When to stop after cardiac arrest?
Eyal Golan, MD PhD(c)
Clinical Associate, Critical Care Medicine & Neurocritical Care Medicine
Interdepartmental Division of Critical Care and Department of Medicine
University of Toronto
University of Toronto
Interdepartmental Division of Critical Care

Conflicts of interest
Financial: None
? Academic: Research focus
Guideline development
(ILCOR, AHA-ECC, CCCTG-CNCS)
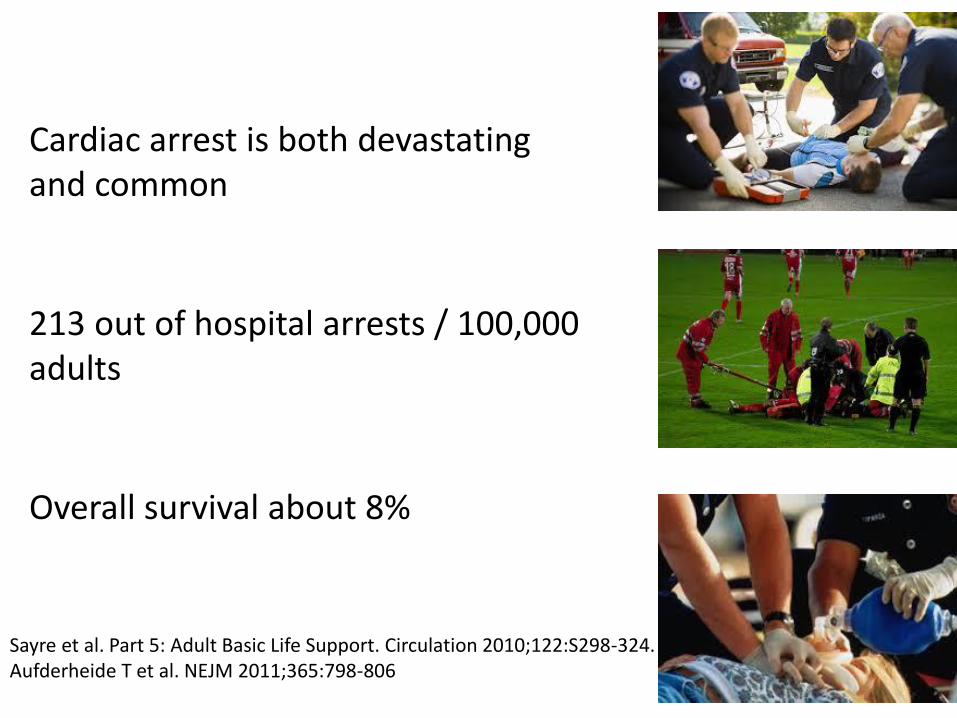
Cardiac arrest is both devastating and common
213 out of hospital arrests / 100,000 adults
Overall survival about 8%
Sayre et al. Part 5: Adult Basic Life Support. Circulation 2010;122:S298-324. Aufderheide T et al. NEJM 2011;365:798-806
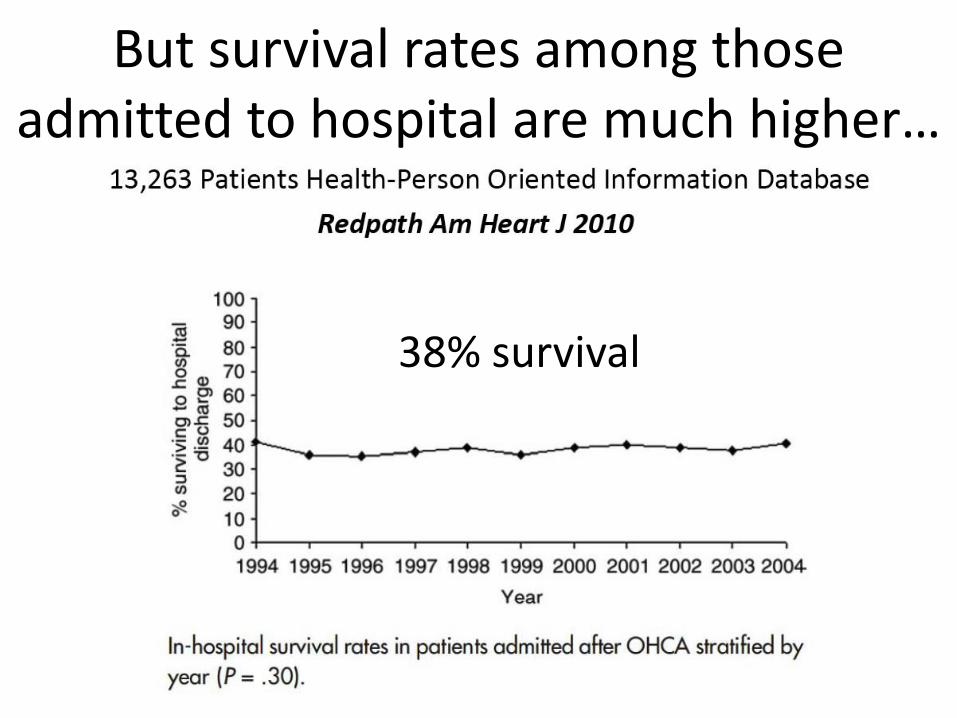
38% survival
But survival rates among those admitted to hospital are much higher…

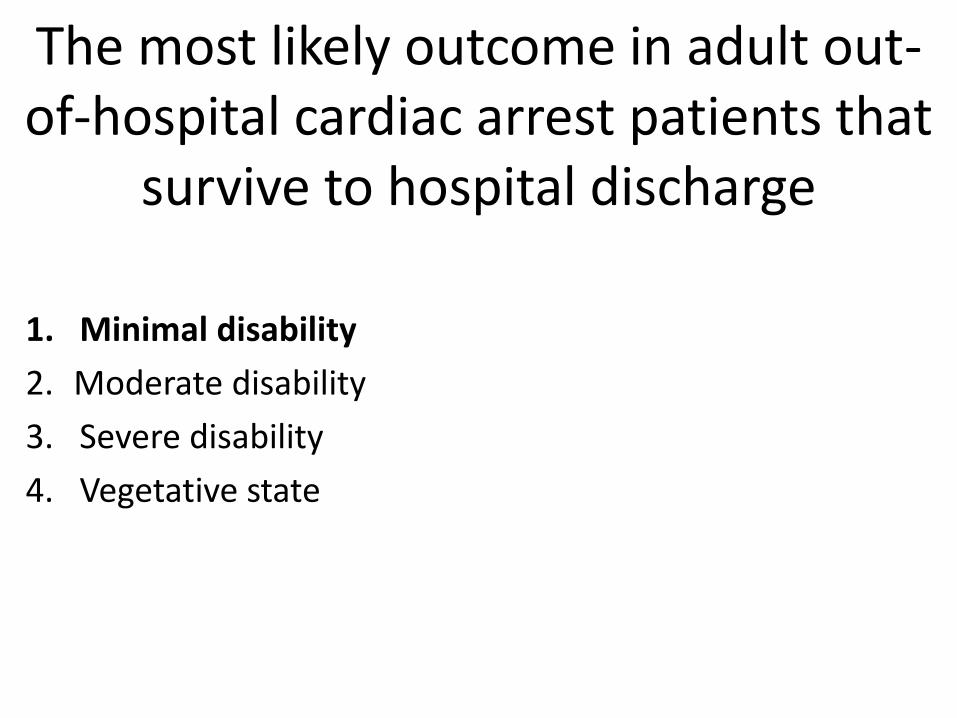
The most likely outcome in adult out-of-hospital cardiac arrest patients that
survive to hospital discharge
1. Minimal disability
2. Moderate disability
3. Severe disability
4. Vegetative state
The most likely outcome in adult out-of-hospital cardiac arrest patients that
survive to hospital discharge
1. Minimal disability
2. Moderate disability
3. Severe disability
4. Vegetative state

38% survival More than two thirds have minimal to no disability
Sayre et al. Part 5: Adult Basic Life Support. Circulation 2010;122:S298-324. Aufderheide T et al. NEJM 2011;365:798-806
But survival rates among those admitted to hospital are much higher…

Predicting good neurological outcome in adult cardiac arrest survivors that receive targeted temperature
management
Golan E, Scales DC, Morrison LM 2014 (data not yet published)

Predicting good neurological outcome in adult cardiac arrest survivors that receive targeted temperature
management
Golan E, Scales DC, Morrison LM 2014 (not yet published data)
78% of patients that survived to
hospital discharge experienced a very
good neurological outcome as defined
by a CPC 1 (431/550 patients)


“The majority (79%) of surviving patients
who underwent TH after cardiac arrest in
this series had preserved cognitive function
and were able to return to work.”

The Chain of Survival

1. Brain death
2. A decision to withdrawal life support
3. Sepsis
4. Acute respiratory distress syndrome
The most common mechanism of death during ICU
1. Brain death
2. A decision to withdrawal life support
3. Sepsis
4. Acute respiratory distress syndrome
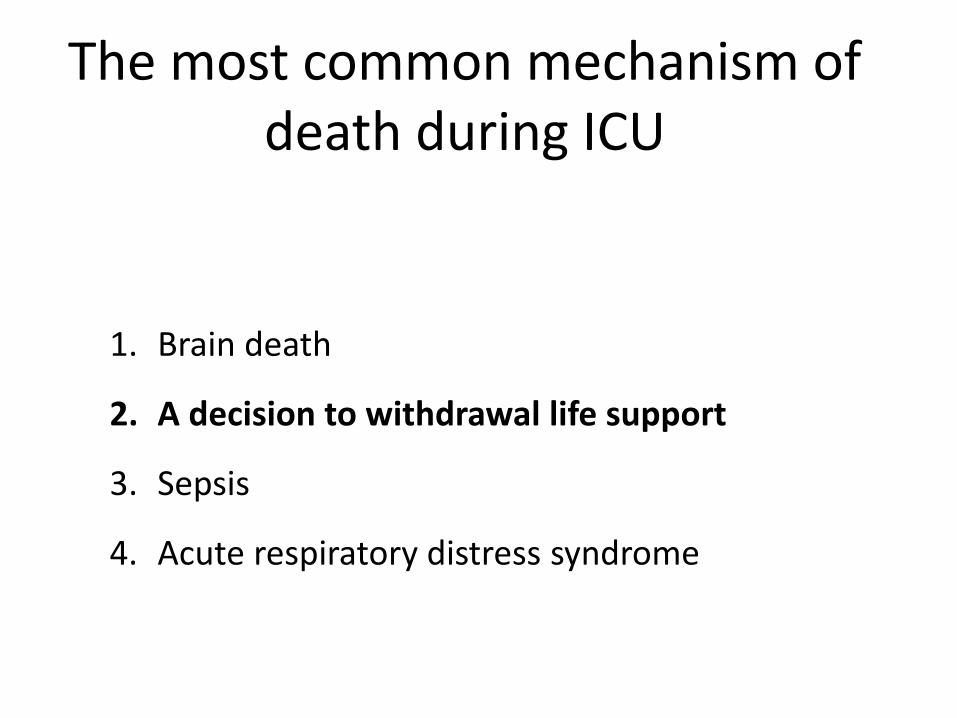
The most common mechanism of death during ICU

Termination of life support is the most common way that patients die during ICU
Physician prediction of poor outcome is the strongest predictor of termination of life support
Cook et al. N Engl J Med 2003;349:1123-32
Rocker et al. Crit Care Med 2004; 32:1149 –1154
Our predictions are important!
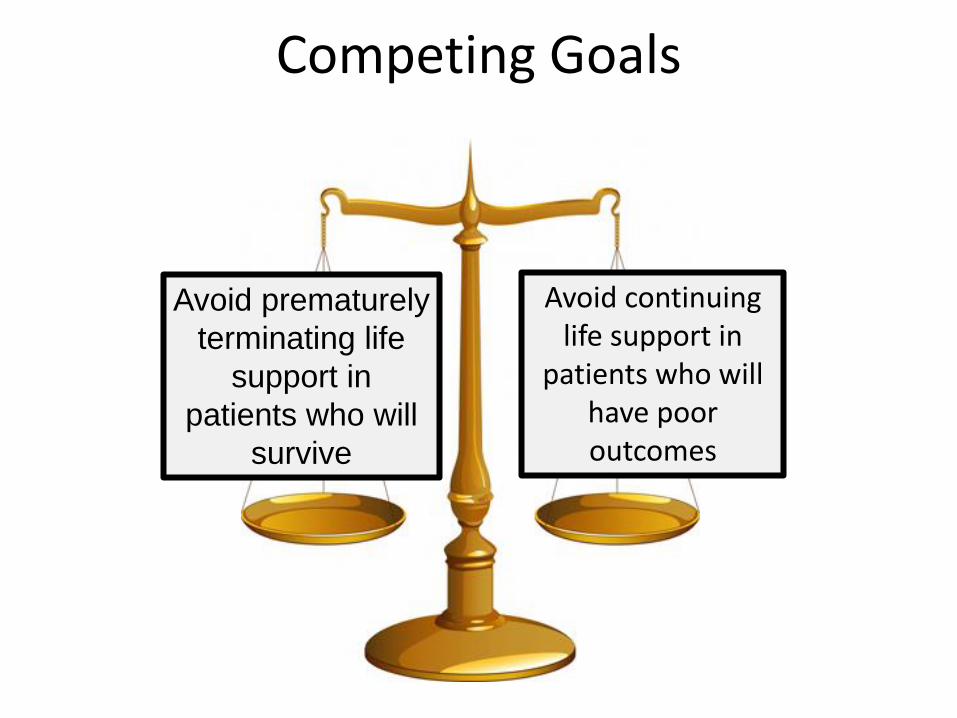
Avoid prematurely
terminating life
support in
patients who will
survive
Avoid continuing life support in
patients who will have poor outcomes
Competing Goals
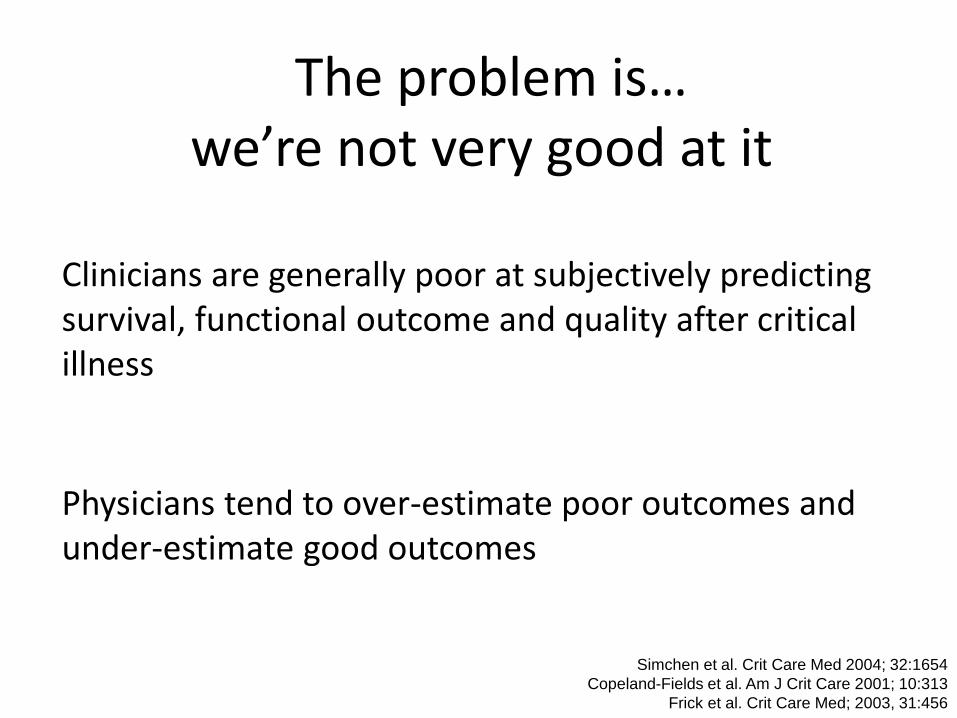
Clinicians are generally poor at subjectively predicting survival, functional outcome and quality after critical illness
Physicians tend to over-estimate poor outcomes and under-estimate good outcomes
Simchen et al. Crit Care Med 2004; 32:1654
Copeland-Fields et al. Am J Crit Care 2001; 10:313
Frick et al. Crit Care Med; 2003, 31:456
The problem is… we’re not very good at it!

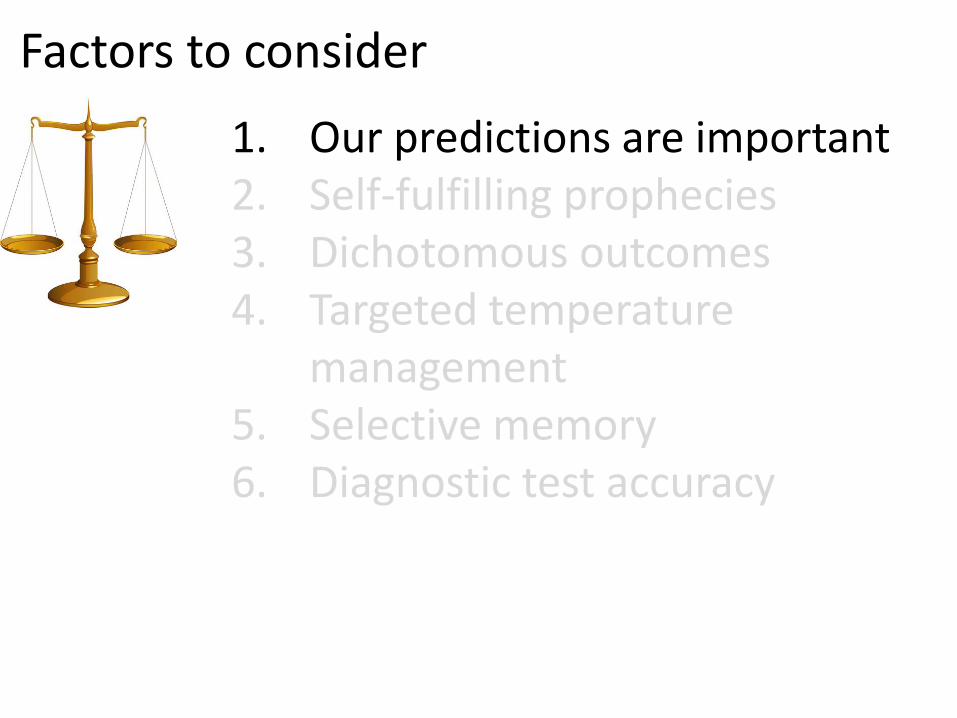
Factors to consider
1. Our predictions are important 2. Self-fulfilling prophecies 3. Dichotomous outcomes 4. Targeted temperature
management 5. Selective memory 6. Diagnostic test accuracy
Factors to consider
1. Our predictions are important 2. Self-fulfilling prophecies 3. Dichotomous outcomes 4. Targeted temperature
management 5. Selective memory 6. Diagnostic test accuracy
Factors to consider
1. Our predictions are important 2. Self-fulfilling prophecies 3. Dichotomous outcomes 4. Targeted temperature
management 5. Selective memory 6. Diagnostic test accuracy

Self-fulfilling prophecies
Problems clinically
Physicians become falsely reassured
Problems for research
Most studies do not prevent physicians from stopping life support in response to clinical predictors
Newer trials aim to prevent “early” withdrawal
Geocadin et al. Neurology 2006; 67:105 Geocadin et al. Curr Op Crit Care 2008; 14:261 Nielsen et al, N Engl J Med. 2013 Dec 5;369(23):2197-206

Factors to consider
1. Our predictions are important 2. Self-fulfilling prophecies 3. Dichotomous outcomes 4. Targeted temperature
management 5. Selective memory 6. Diagnostic test accuracy
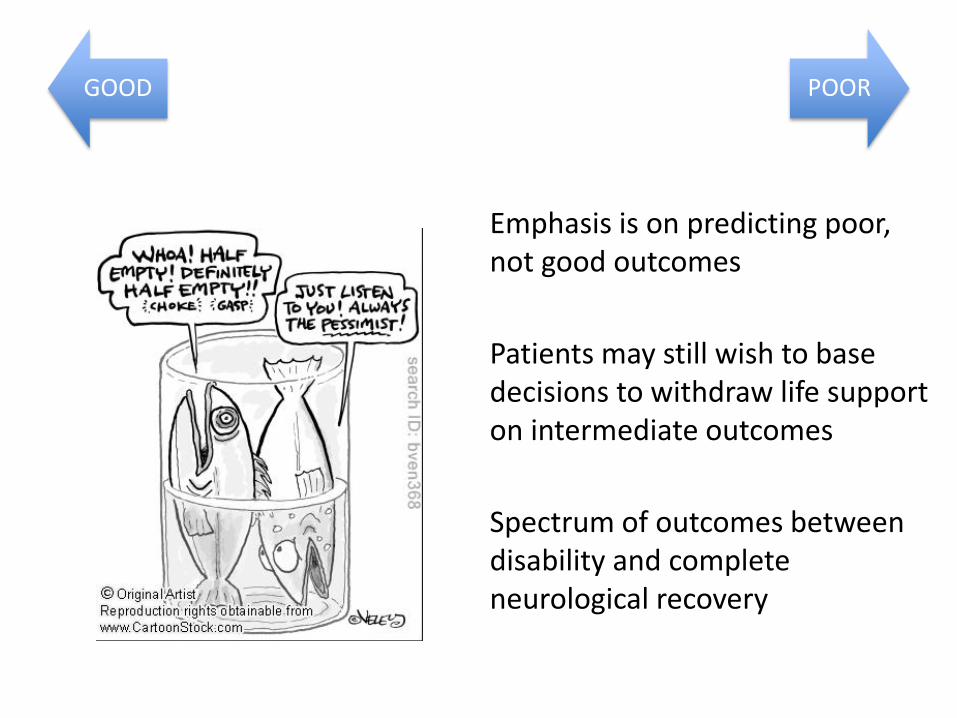
GOOD POOR
Emphasis is on predicting poor, not good outcomes
Patients may still wish to base decisions to withdraw life support on intermediate outcomes
Spectrum of outcomes between disability and complete neurological recovery

Factors to consider
1. Our predictions are important 2. Self-fulfilling prophecies 3. Dichotomous outcomes 4. Targeted temperature
management 5. Selective memory 6. Diagnostic test accuracy
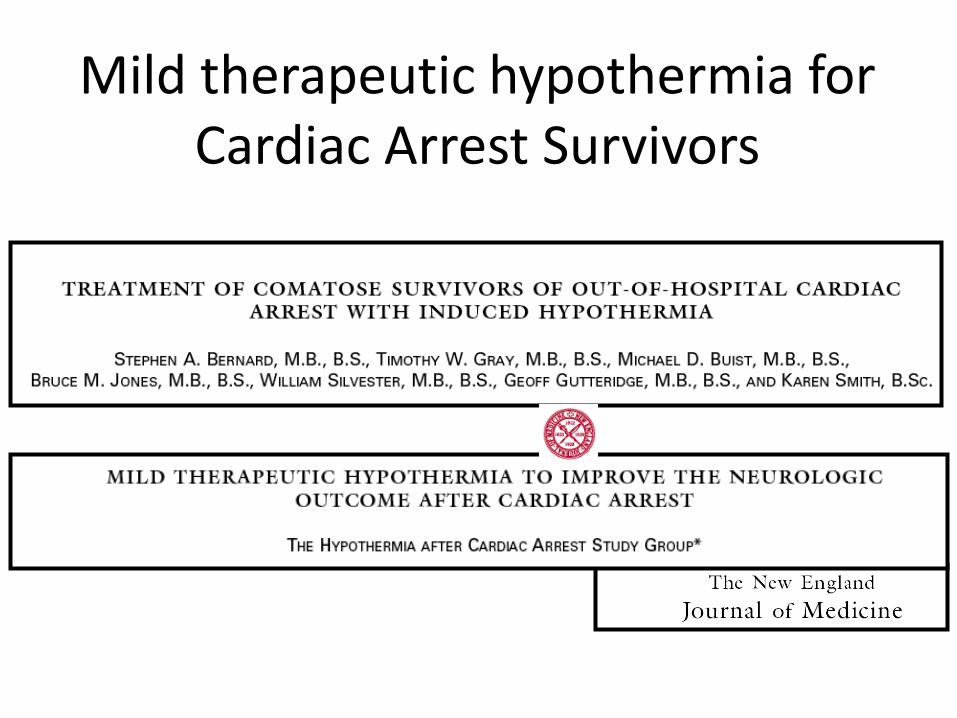
Mild therapeutic hypothermia for Cardiac Arrest Survivors
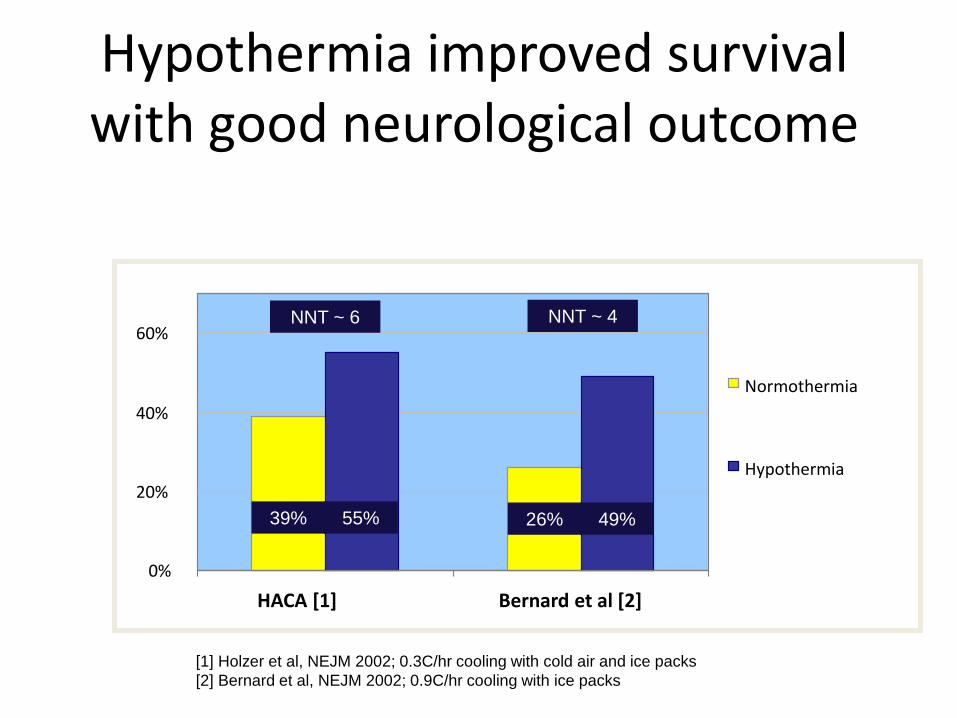
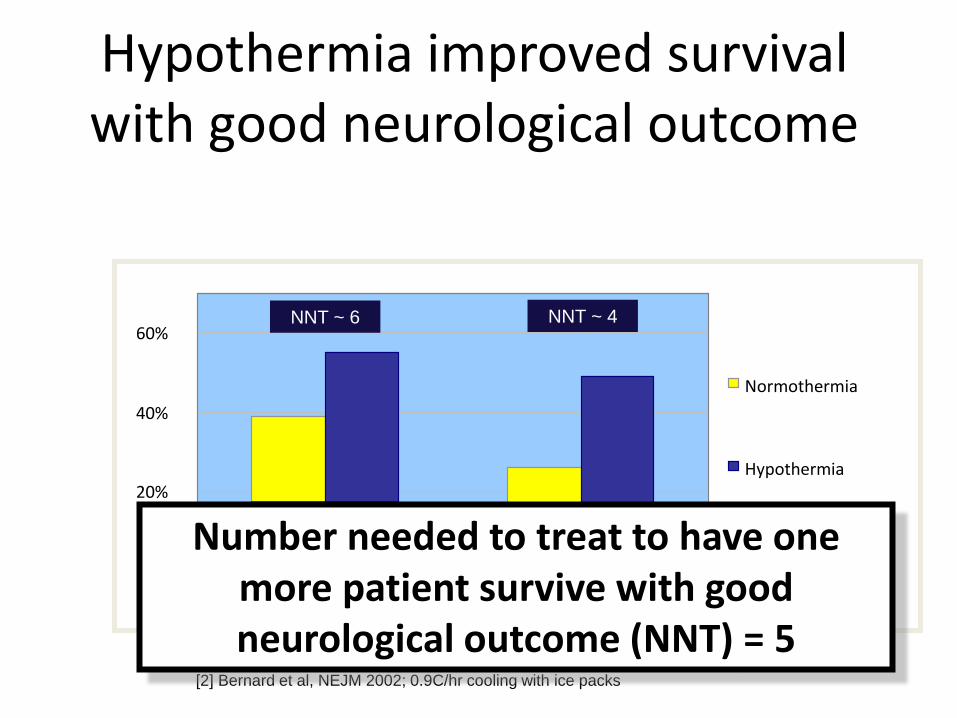
[1] Holzer et al, NEJM 2002; 0.3C/hr cooling with cold air and ice packs
[2] Bernard et al, NEJM 2002; 0.9C/hr cooling with ice packs
0%
20%
40%
60%
HACA [1] Bernard et al [2]
Normothermia
Hypothermia
26% 49% 39% 55%
NNT ~ 6 NNT ~ 4
Hypothermia improved survival with good neurological outcome
[1] Holzer et al, NEJM 2002; 0.3C/hr cooling with cold air and ice packs
[2] Bernard et al, NEJM 2002; 0.9C/hr cooling with ice packs
0%
20%
40%
60%
HACA [1] Bernard et al [2]
Normothermia
Hypothermia
26% 49% 39% 55%
NNT ~ 6 NNT ~ 4
Number needed to treat to have one more patient survive with good neurological outcome (NNT) = 5
Hypothermia improved survival with good neurological outcome

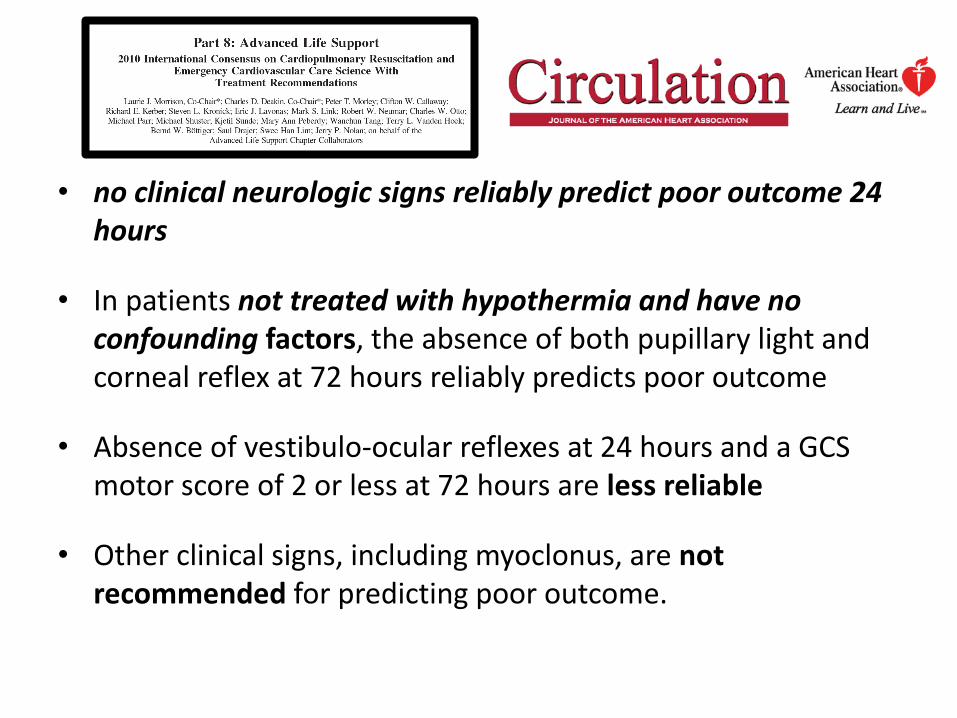
• no clinical neurologic signs reliably predict poor outcome 24 hours
• In patients not treated with hypothermia and have no confounding factors, the absence of both pupillary light and corneal reflex at 72 hours reliably predicts poor outcome
• Absence of vestibulo-ocular reflexes at 24 hours and a GCS motor score of 2 or less at 72 hours are less reliable
• Other clinical signs, including myoclonus, are not recommended for predicting poor outcome.

The Targeted Temperature Management (TTM) Trial
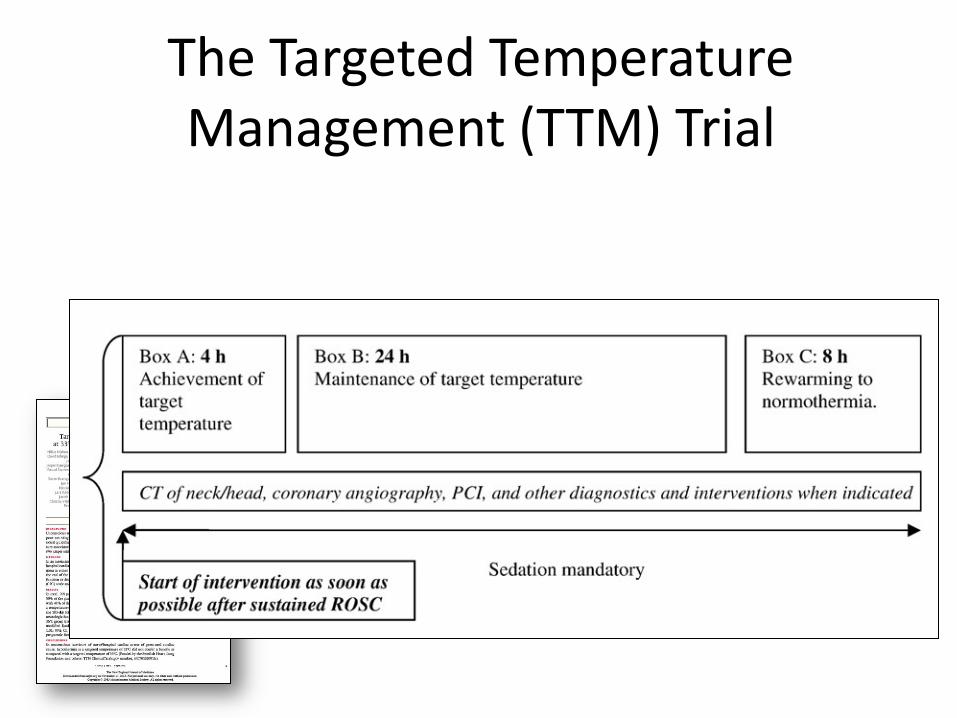
The Targeted Temperature Management (TTM) Trial
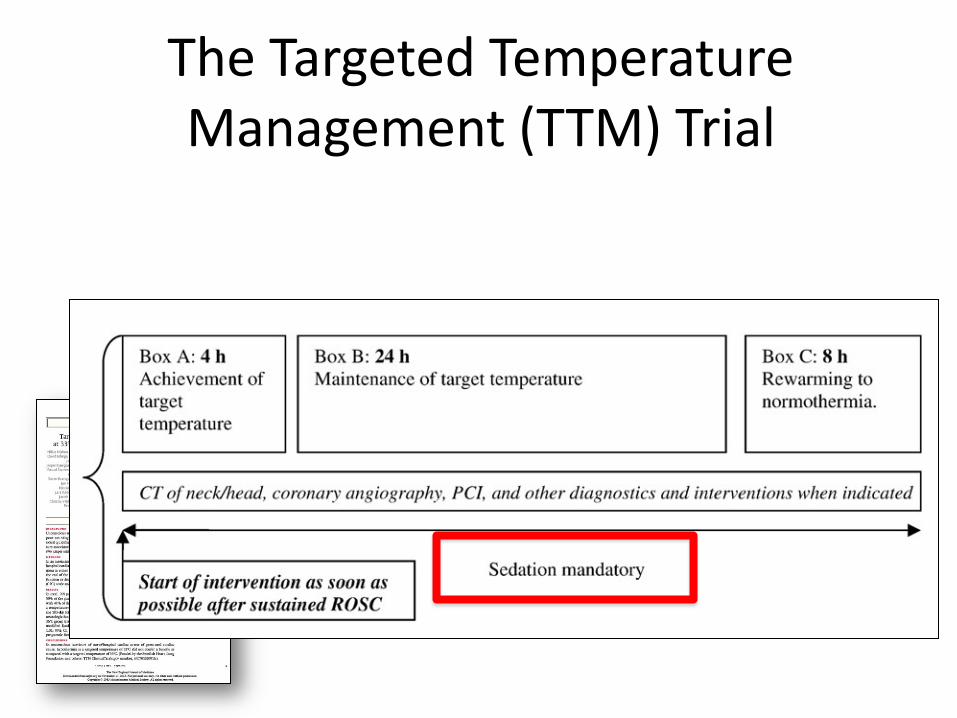
The Targeted Temperature Management (TTM) Trial
• Confounding due to sedating/paralyzing medications used to induce and maintain hypothermia
• May change accuracy of predictors used for neuroprognostication by attenuating degree of brain injury
• We have all seen examples
TTM changes the accuracy of our clinical predictors
Factors to consider
1. Our predictions are important 2. Self-fulfilling prophecies 3. Dichotomous outcomes 4. Targeted temperature
management 5. Selective memory 6. Diagnostic test accuracy

“A 55-yr-old man presented with cardiac
arrest… spontaneous perfusion restored,
and therapeutic hypothermia provided”
“Death was pronounced and the family
consented to organ donation.”
Webb and Samuels, CCM 2011.
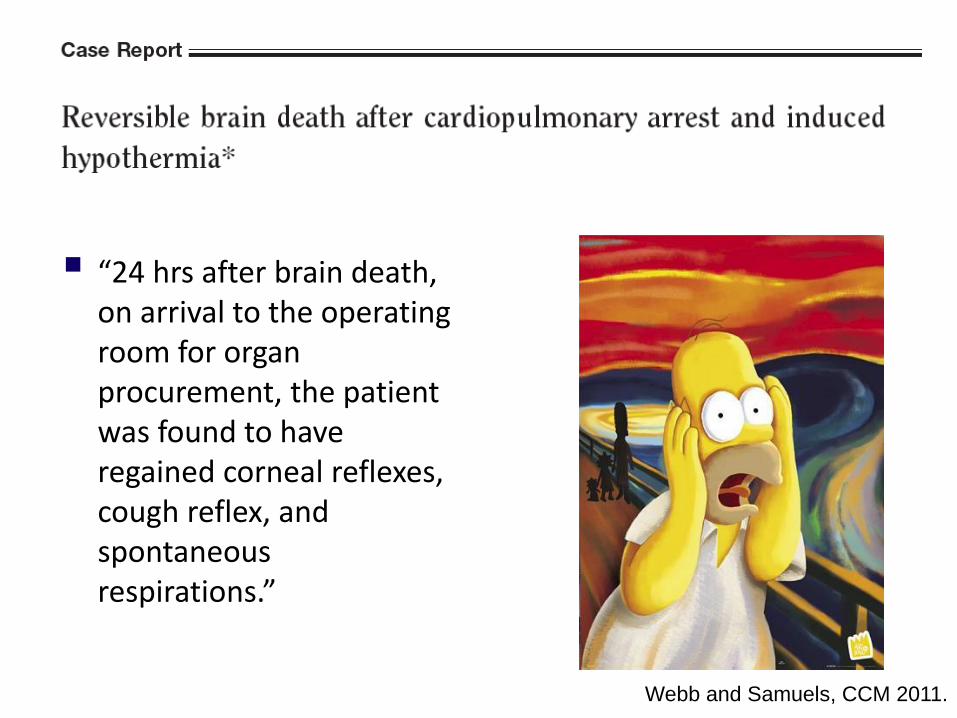
“24 hrs after brain death, on arrival to the operating room for organ procurement, the patient was found to have regained corneal reflexes, cough reflex, and spontaneous respirations.”
Webb and Samuels, CCM 2011.

Factors to consider
1. Our predictions are important 2. Self-fulfilling prophecies 3. Dichotomous outcomes 4. Targeted temperature
management 5. Selective memory 6. Diagnostic test accuracy

No consensus on the PRECISION that should be obtained for predicting poor outcomes
How wide should confidence intervals around ZERO be?
0%
95% CI
100%
The confidence problem
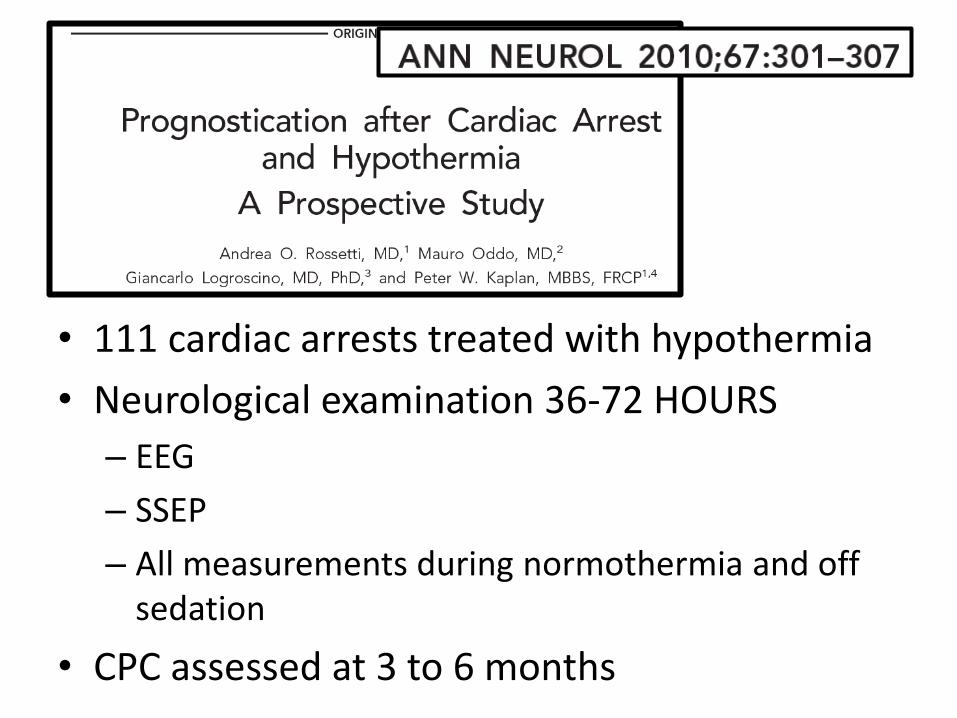
• 111 cardiac arrests treated with hypothermia
• Neurological examination 36-72 HOURS
– EEG
– SSEP
– All measurements during normothermia and off sedation
• CPC assessed at 3 to 6 months


Golan E et al, CCM 2014 Oct;42(10):2235-43
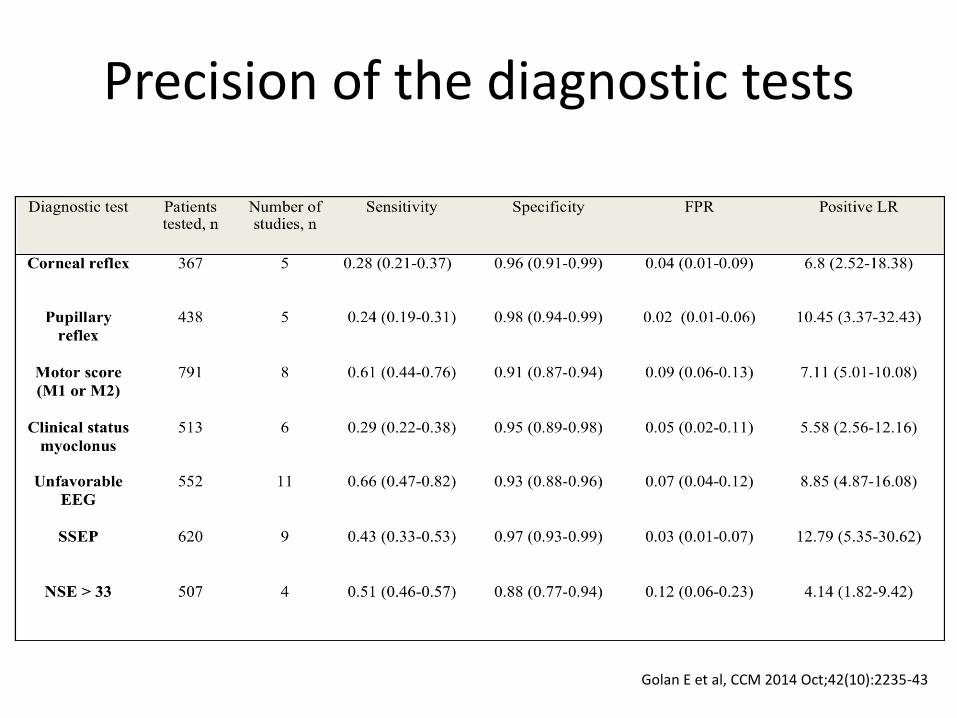
Precision of the diagnostic tests
Golan E et al, CCM 2014 Oct;42(10):2235-43

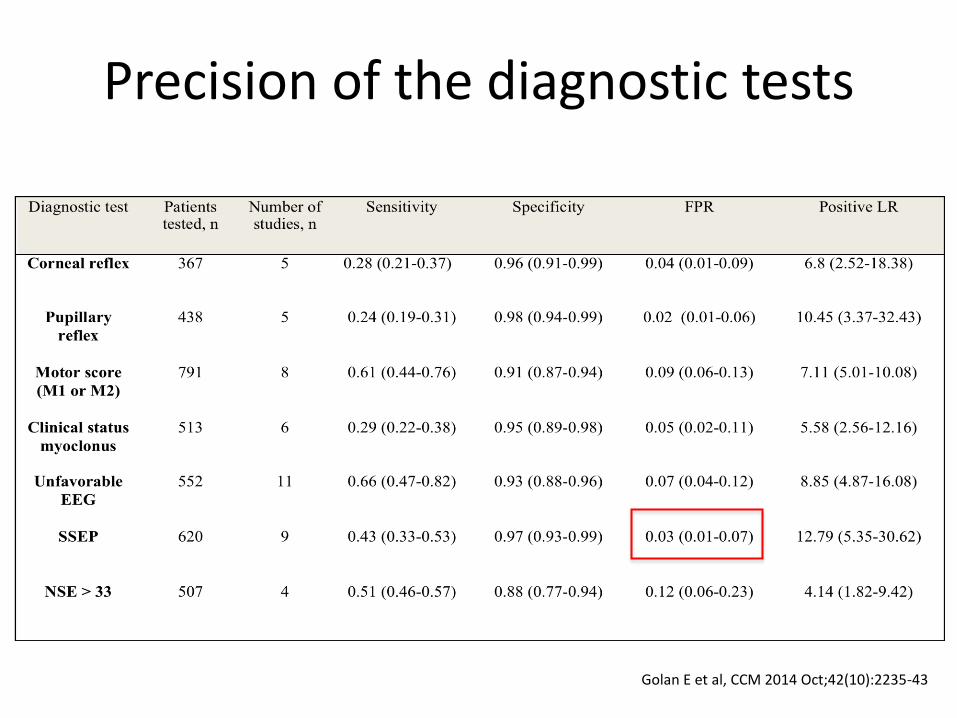
Precision of the diagnostic tests
Golan E et al, CCM 2014 Oct;42(10):2235-43
Precision of the diagnostic tests
Golan E et al, CCM 2014 Oct;42(10):2235-43
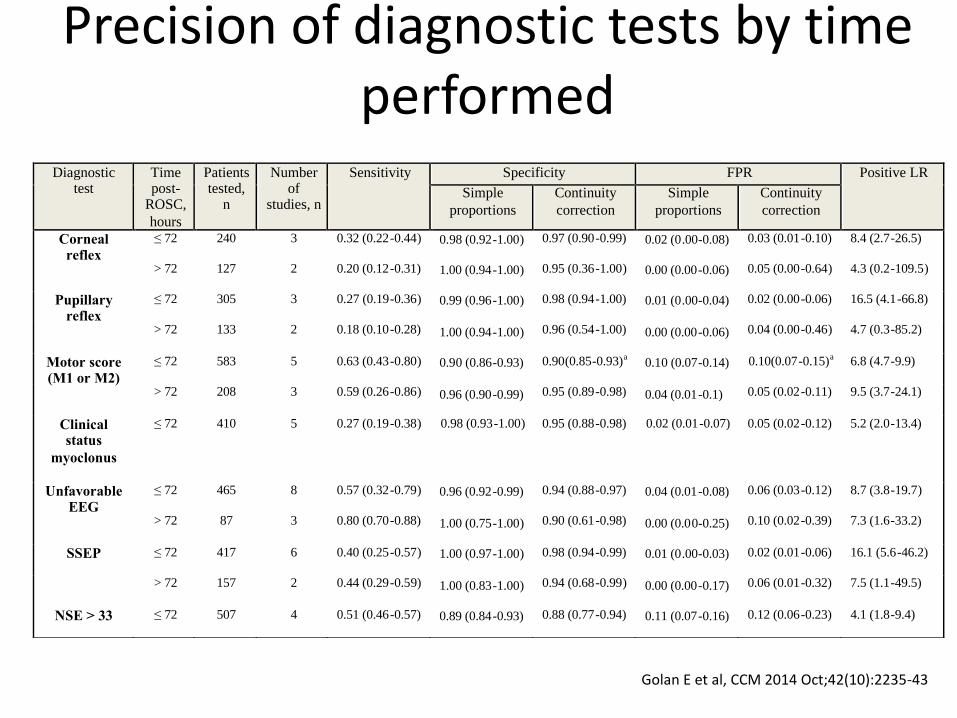
Precision of diagnostic tests by time performed
Diagnostic test
Time post-
ROSC,
hours
Patients tested,
n
Number of
studies, n
Sensitivity Specificity FPR Positive LR
Simple
proportions
Continuity
correction
Simple
proportions
Continuity
correction
Corneal reflex
≤ 72 240 3 0.32 (0.22-0.44)
0.98 (0.92-1.00) 0.97 (0.90-0.99) 0.02 (0.00-0.08) 0.03 (0.01-0.10) 8.4 (2.7-26.5)
> 72 127 2 0.20 (0.12-0.31) 1.00 (0.94-1.00) 0.95 (0.36-1.00) 0.00 (0.00-0.06) 0.05 (0.00-0.64) 4.3 (0.2-109.5)
Pupillary reflex
≤ 72 305 3 0.27 (0.19-0.36) 0.99 (0.96-1.00) 0.98 (0.94-1.00) 0.01 (0.00-0.04) 0.02 (0.00-0.06) 16.5 (4.1-66.8)
> 72 133 2 0.18 (0.10-0.28) 1.00 (0.94-1.00) 0.96 (0.54-1.00) 0.00 (0.00-0.06) 0.04 (0.00-0.46) 4.7 (0.3-85.2)
Motor score (M1 or M2)
≤ 72 583 5 0.63 (0.43-0.80)
0.90 (0.86-0.93) 0.90(0.85-0.93)a 0.10 (0.07-0.14) 0.10(0.07-0.15)a 6.8 (4.7-9.9)
> 72 208 3 0.59 (0.26-0.86) 0.96 (0.90-0.99) 0.95 (0.89-0.98) 0.04 (0.01-0.1) 0.05 (0.02-0.11) 9.5 (3.7-24.1)
Clinical status
myoclonus
≤ 72 410 5 0.27 (0.19-0.38) 0.98 (0.93-1.00) 0.95 (0.88-0.98) 0.02 (0.01-0.07) 0.05 (0.02-0.12) 5.2 (2.0-13.4)
Unfavorable EEG
≤ 72 465 8 0.57 (0.32-0.79) 0.96 (0.92-0.99) 0.94 (0.88-0.97) 0.04 (0.01-0.08) 0.06 (0.03-0.12) 8.7 (3.8-19.7)
> 72 87 3 0.80 (0.70-0.88) 1.00 (0.75-1.00) 0.90 (0.61-0.98) 0.00 (0.00-0.25) 0.10 (0.02-0.39) 7.3 (1.6-33.2)
SSEP ≤ 72 417 6 0.40 (0.25-0.57) 1.00 (0.97-1.00) 0.98 (0.94-0.99) 0.01 (0.00-0.03) 0.02 (0.01-0.06) 16.1 (5.6-46.2)
> 72 157 2 0.44 (0.29-0.59) 1.00 (0.83-1.00) 0.94 (0.68-0.99) 0.00 (0.00-0.17) 0.06 (0.01-0.32) 7.5 (1.1-49.5)
NSE > 33 ≤ 72 507 4 0.51 (0.46-0.57) 0.89 (0.84-0.93) 0.88 (0.77-0.94) 0.11 (0.07-0.16) 0.12 (0.06-0.23) 4.1 (1.8-9.4)
Golan E et al, CCM 2014 Oct;42(10):2235-43
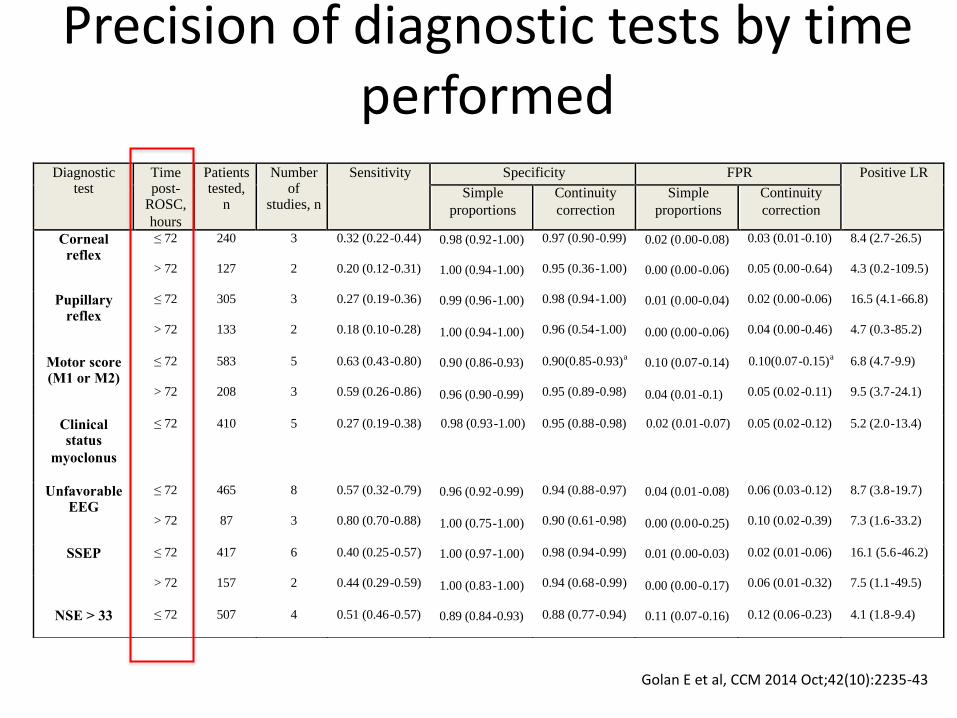
Precision of diagnostic tests by time performed
Diagnostic test
Time post-
ROSC,
hours
Patients tested,
n
Number of
studies, n
Sensitivity Specificity FPR Positive LR
Simple
proportions
Continuity
correction
Simple
proportions
Continuity
correction
Corneal reflex
≤ 72 240 3 0.32 (0.22-0.44)
0.98 (0.92-1.00) 0.97 (0.90-0.99) 0.02 (0.00-0.08) 0.03 (0.01-0.10) 8.4 (2.7-26.5)
> 72 127 2 0.20 (0.12-0.31) 1.00 (0.94-1.00) 0.95 (0.36-1.00) 0.00 (0.00-0.06) 0.05 (0.00-0.64) 4.3 (0.2-109.5)
Pupillary reflex
≤ 72 305 3 0.27 (0.19-0.36) 0.99 (0.96-1.00) 0.98 (0.94-1.00) 0.01 (0.00-0.04) 0.02 (0.00-0.06) 16.5 (4.1-66.8)
> 72 133 2 0.18 (0.10-0.28) 1.00 (0.94-1.00) 0.96 (0.54-1.00) 0.00 (0.00-0.06) 0.04 (0.00-0.46) 4.7 (0.3-85.2)
Motor score (M1 or M2)
≤ 72 583 5 0.63 (0.43-0.80)
0.90 (0.86-0.93) 0.90(0.85-0.93)a 0.10 (0.07-0.14) 0.10(0.07-0.15)a 6.8 (4.7-9.9)
> 72 208 3 0.59 (0.26-0.86) 0.96 (0.90-0.99) 0.95 (0.89-0.98) 0.04 (0.01-0.1) 0.05 (0.02-0.11) 9.5 (3.7-24.1)
Clinical status
myoclonus
≤ 72 410 5 0.27 (0.19-0.38) 0.98 (0.93-1.00) 0.95 (0.88-0.98) 0.02 (0.01-0.07) 0.05 (0.02-0.12) 5.2 (2.0-13.4)
Unfavorable EEG
≤ 72 465 8 0.57 (0.32-0.79) 0.96 (0.92-0.99) 0.94 (0.88-0.97) 0.04 (0.01-0.08) 0.06 (0.03-0.12) 8.7 (3.8-19.7)
> 72 87 3 0.80 (0.70-0.88) 1.00 (0.75-1.00) 0.90 (0.61-0.98) 0.00 (0.00-0.25) 0.10 (0.02-0.39) 7.3 (1.6-33.2)
SSEP ≤ 72 417 6 0.40 (0.25-0.57) 1.00 (0.97-1.00) 0.98 (0.94-0.99) 0.01 (0.00-0.03) 0.02 (0.01-0.06) 16.1 (5.6-46.2)
> 72 157 2 0.44 (0.29-0.59) 1.00 (0.83-1.00) 0.94 (0.68-0.99) 0.00 (0.00-0.17) 0.06 (0.01-0.32) 7.5 (1.1-49.5)
NSE > 33 ≤ 72 507 4 0.51 (0.46-0.57) 0.89 (0.84-0.93) 0.88 (0.77-0.94) 0.11 (0.07-0.16) 0.12 (0.06-0.23) 4.1 (1.8-9.4)
Golan E et al, CCM 2014 Oct;42(10):2235-43

What about real life data?
• Consecutive OHCA patients that received TTM and survived to 72hrs post-arrest
• Multicentre (n=34 hospitals) in Southwestern Ontario from 2011-2014
• N= 982
Golan E et al, Data not yet pubilshed
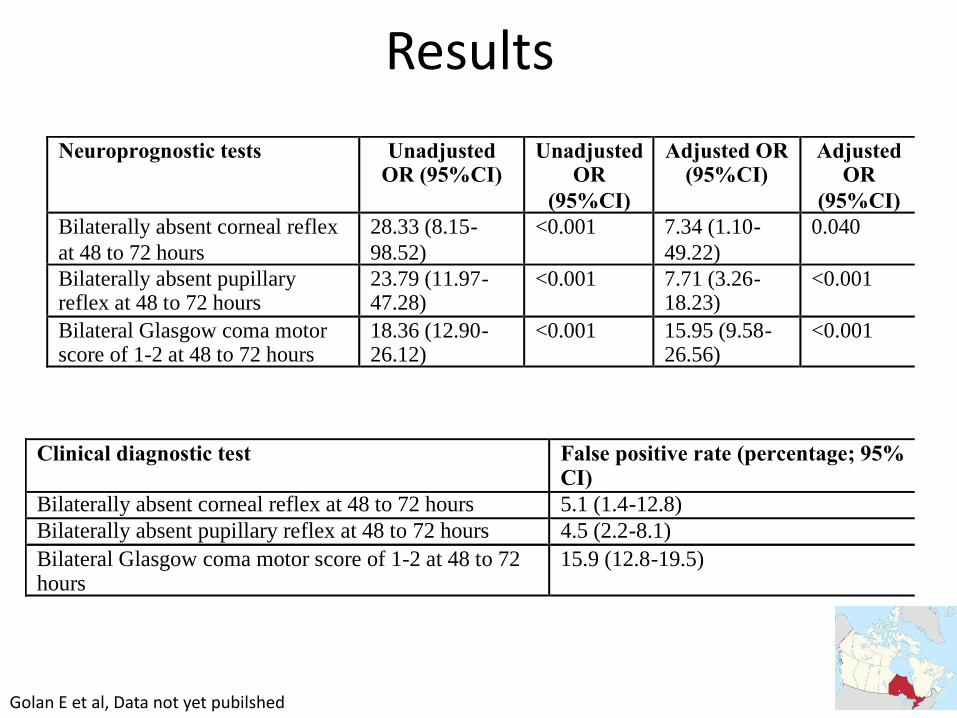
Results
Clinical diagnostic test False positive rate (percentage; 95% CI)
Bilaterally absent corneal reflex at 48 to 72 hours 5.1 (1.4-12.8)
Bilaterally absent pupillary reflex at 48 to 72 hours 4.5 (2.2-8.1)
Bilateral Glasgow coma motor score of 1-2 at 48 to 72 hours
15.9 (12.8-19.5)
Golan E et al, Data not yet pubilshed
Neuroprognostic tests Unadjusted OR (95%CI)
Unadjusted OR
(95%CI)
Adjusted OR (95%CI)
Adjusted OR
(95%CI)
Bilaterally absent corneal reflex
at 48 to 72 hours
28.33 (8.15-
98.52)
<0.001 7.34 (1.10-
49.22)
0.040
Bilaterally absent pupillary reflex at 48 to 72 hours
23.79 (11.97-47.28)
<0.001 7.71 (3.26-18.23)
<0.001
Bilateral Glasgow coma motor score of 1-2 at 48 to 72 hours
18.36 (12.90-26.12)
<0.001 15.95 (9.58-26.56)
<0.001

• Diagnostic tests beyond 72hr of arrest (72hr post-TTM intervention) yield FPR near 0% with narrow confidence intervals
• TTM trial, neuroprognostication arm, expected to be published in Winter 2014 (diagnostic testing at 72hrs post-TTM intervention, 108hr post-arrest)
Golan E et al, Data not yet pubilshed
Cronberg T et al, Data not yet pubilshed
Do we stop too early?


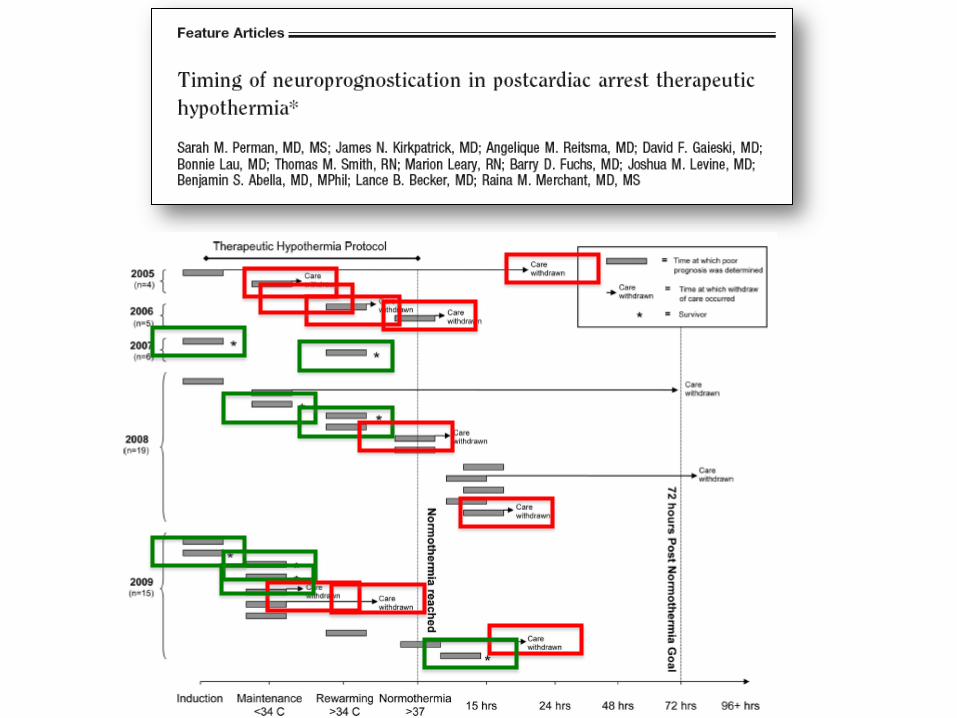

57
72 hours
The PremaTOR Study (Preventing Premature Termination
Of Resuscitation)
University of Toronto
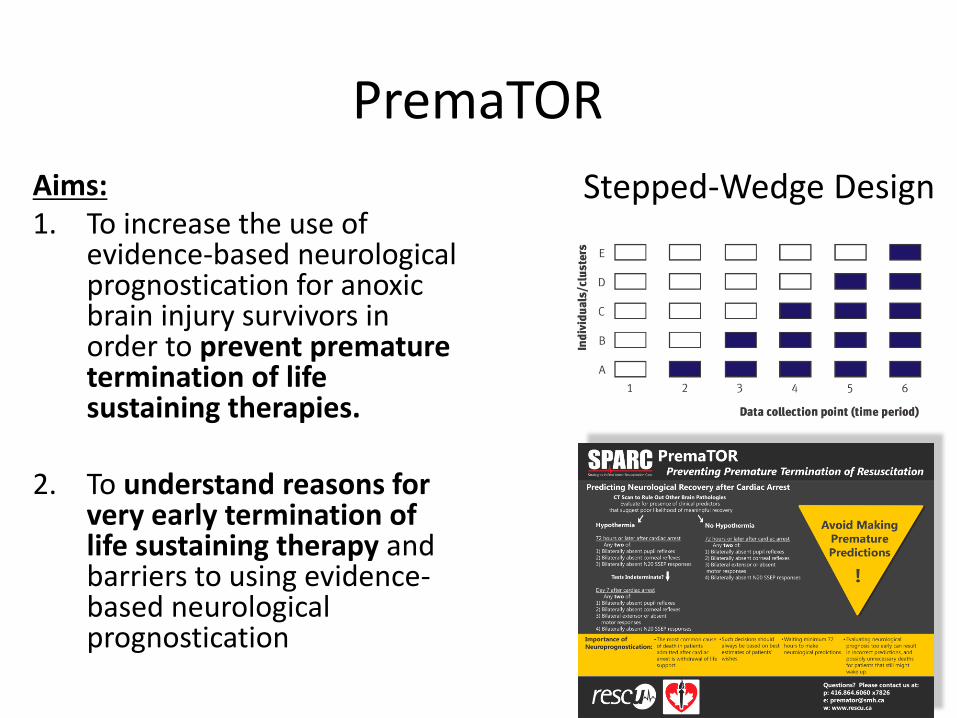
Aims: 1. To increase the use of
evidence-based neurological prognostication for anoxic brain injury survivors in order to prevent premature termination of life sustaining therapies.
2. To understand reasons for very early termination of life sustaining therapy and barriers to using evidence-based neurological prognostication
PremaTOR
Stepped-Wedge Design
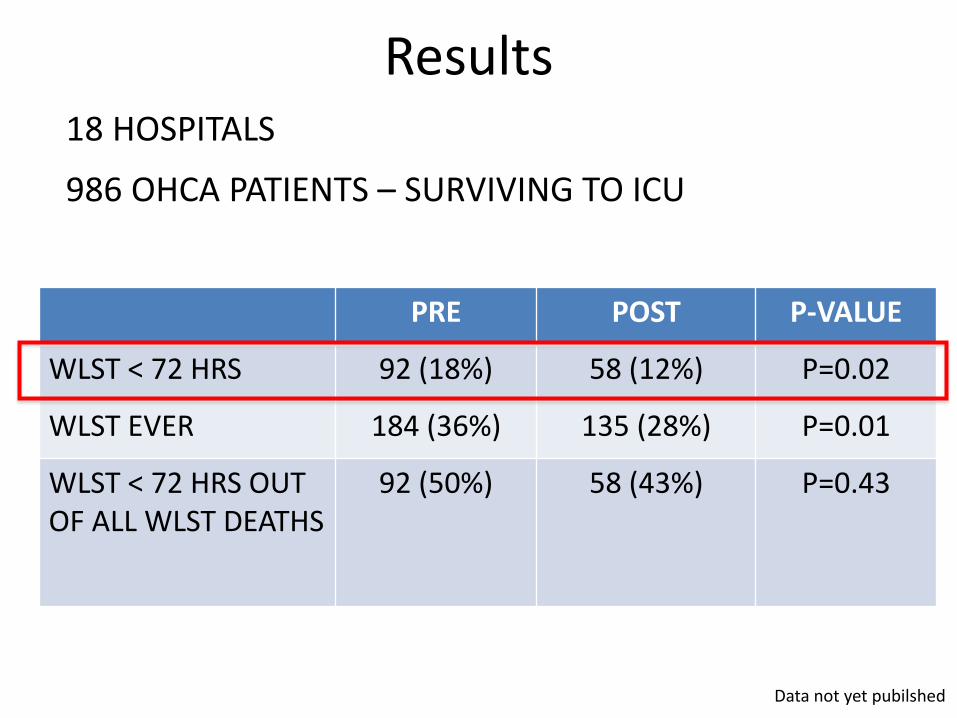
18 HOSPITALS
986 OHCA PATIENTS – SURVIVING TO ICU
Results
Data not yet pubilshed
PRE POST P-VALUE
WLST < 72 HRS 92 (18%) 58 (12%) P=0.02
WLST EVER 184 (36%) 135 (28%) P=0.01
WLST < 72 HRS OUT OF ALL WLST DEATHS
92 (50%) 58 (43%) P=0.43
PRE POST P-VALUE
SURVIVAL TO HOSPITAL DISCHARGE
156 (30%) 155 (33%) P=0.3
SURVIVAL WITH GOOD OUTCOME
128 (25%) 133 (28%) P=0.6
BRAIN DEATH 79 (15%) 97 (20%) P=0.04
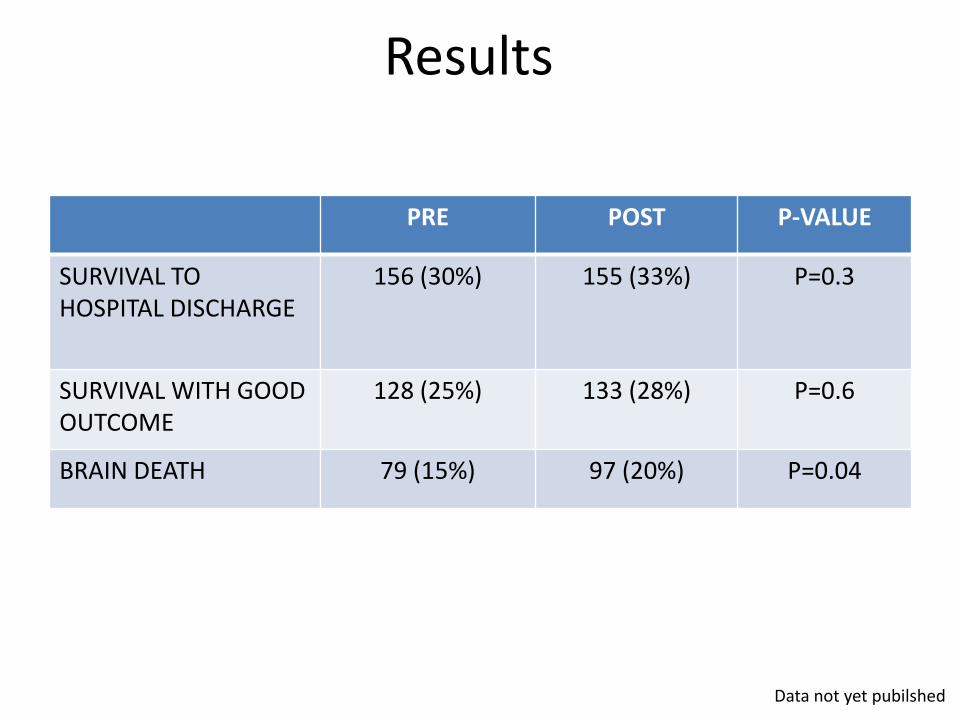
Results
Data not yet pubilshed
PRE POST P-VALUE
SURVIVAL TO HOSPITAL DISCHARGE
156 (30%) 155 (33%) P=0.3
SURVIVAL WITH GOOD OUTCOME
128 (25%) 133 (28%) P=0.6
BRAIN DEATH 79 (15%) 97 (20%) P=0.04
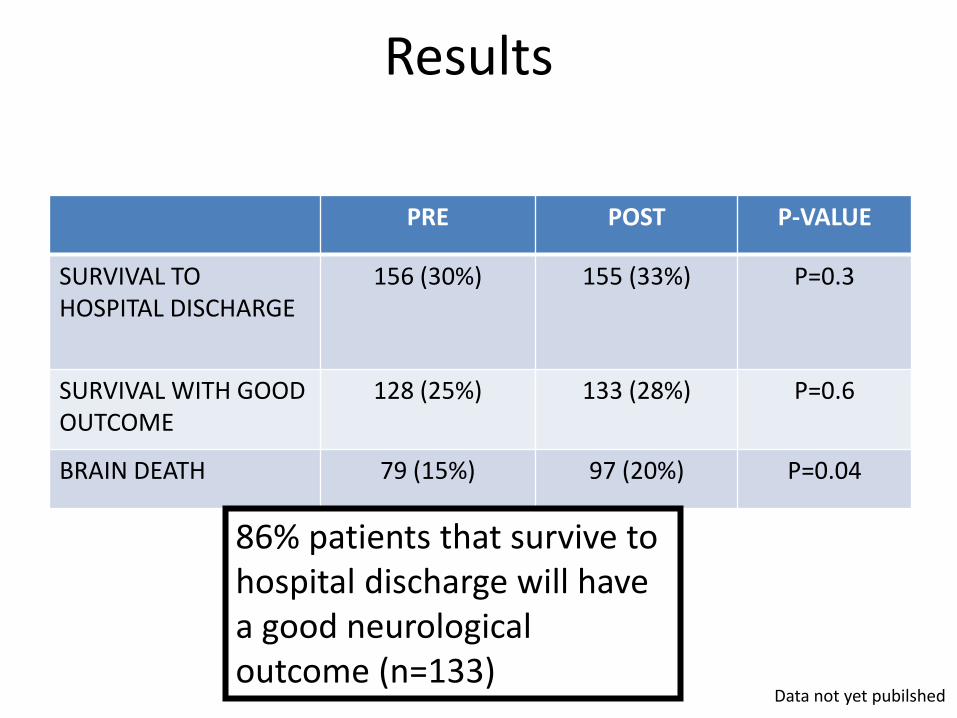
Results
Data not yet pubilshed
86% patients that survive to hospital discharge will have a good neurological outcome (n=133)

Prognostication is a hot topic… Guidelines currently being
produced by multiple agencies
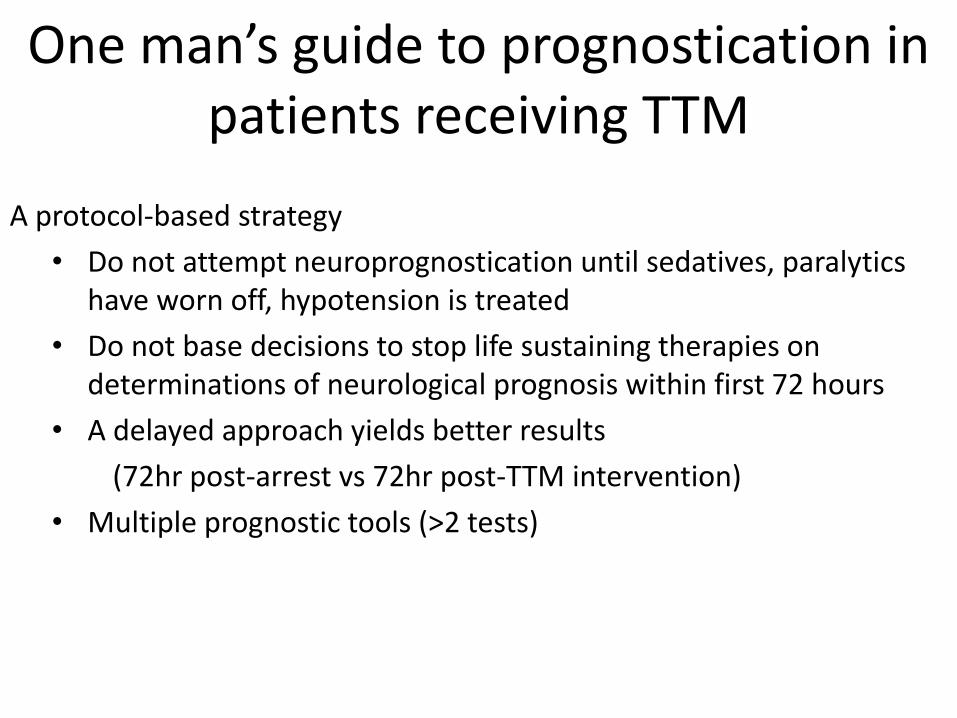
One man’s guide to prognostication in patients receiving TTM
A protocol-based strategy
• Do not attempt neuroprognostication until sedatives, paralytics have worn off, hypotension is treated
• Do not base decisions to stop life sustaining therapies on determinations of neurological prognosis within first 72 hours
• A delayed approach yields better results
(72hr post-arrest vs 72hr post-TTM intervention)
• Multiple prognostic tools (>2 tests)
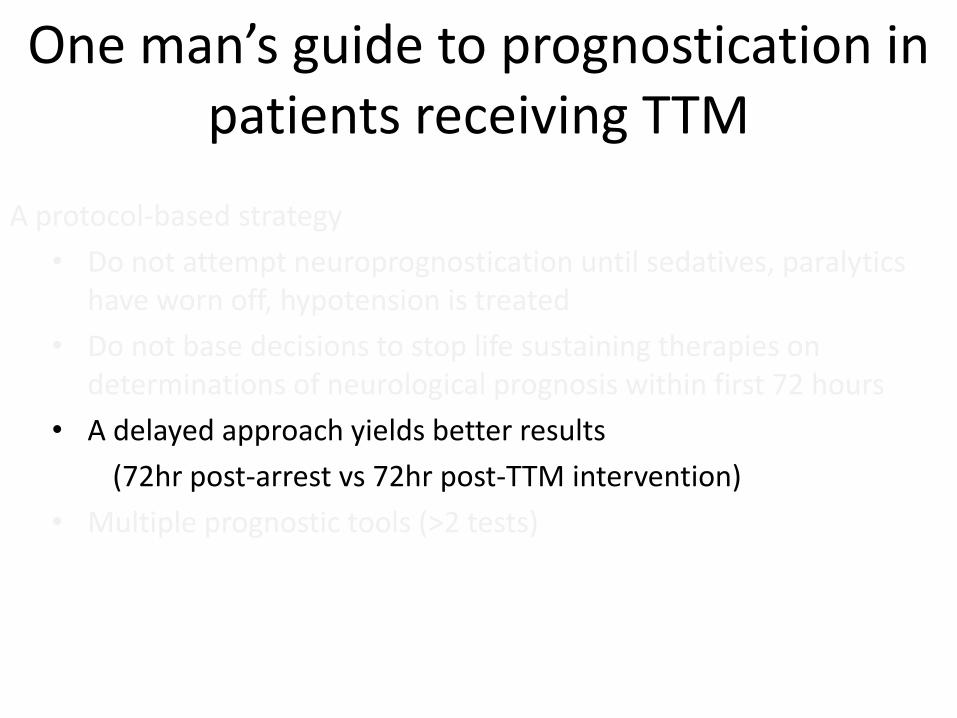

Thank you
• Damon Scales
• Laurie Morrison
• Jeff Singh
• Niall Ferguson
• Cliff Callaway