

Where Goes New Hampshire?
New Hampshire 2018
Steve NortonExecutive Director NH Center for Public Policy StudiesMarch 11, 2008
“…to raise new ideas and improve policy debates through quality information and analysis on issues shaping New Hampshire’s future.”
Sponsored by BusinessNH Magazine and Leadership New Hampshire

What is NH?

What Will NH Be in 2018?

The New Hampshire Revolution: NH Income per person grew faster than US in 1970-80’s.
Source: US Bureau of Economic Analysis
Ratio of Personal Income per Capita - NH to US
-15.0%
-10.0%
-5.0%
0.0%
5.0%
10.0%
15.0%
1970
1972
1974
1976
1978
1980
1982
1984
1986
1988
1990
1992
1994
1996
1998
2000
2002
2004

Macro Trends
• Aging– People are getting older, fewer children
• Economic Change– Agriculture -> Manufacturing -> ?
• The World is Flat– Information, Communication, Transportation
• Environmental Change– Climate, Water, Conservation
• Migration• Role of Towns in Shaping New Hampshire

AgingSchools
Housing
Health Care
What Will the Boomers Do?
Balance of GovernmentAnd Private
Economic Development
Quality Of Life
Transportation
Rails
I93
Zoning And Livable Communities
Migration
It’s A System, Not Static

Age Distribution: 1970
Distribution of NH Population by Age in 1970
(60,000) (40,000) (20,000) - 20,000 40,000 60,000
0-4
5-9
10-14
15-19
20-24
25-29
30-34
35-39
40-44
45-49
50-54
55-59
60-64
65-69
70-74
75-79
80-84
85+
Persons
(60,000) (40,000) (20,000) - 20,000 40,000 60,000
Males Females

Age Distribution: 1995
Distribution of NH Population by Age in 1995
(60,000) (40,000) (20,000) - 20,000 40,000 60,000
0-4
5-9
10-14
15-19
20-24
25-29
30-34
35-39
40-44
45-49
50-54
55-59
60-64
65-69
70-74
75-79
80-84
85+
Persons
(60,000) (40,000) (20,000) - 20,000 40,000 60,000
Males Females

Age Distribution: 2020?
Distribution of NH Population by Age in 2020
(60,000) (40,000) (20,000) - 20,000 40,000 60,000
0-4
5-9
10-14
15-19
20-24
25-29
30-34
35-39
40-44
45-49
50-54
55-59
60-64
65-69
70-74
75-79
80-84
85+
Persons
(60,000) (40,000) (20,000) - 20,000 40,000 60,000
Males Females

Health Care Accounts for Much of Job Growth
Source: NH Department of Labor Projections
Distribution of Estimated 113,788 New Jobs by Industry (2004-2014)
Education (All)24%
Retail17%
All Other17%
Health Care42%

Migration Happened (Many from MA!)
Source: www.carseyinstitute.unh.edu
Source: Johnson, Ken. 2007. 'The Changing Faces of New Hampshire. The Carsey Institute. Durham, NH.

Migration Happens?Source: www.carseyinstitute.unh.edu
Source: Johnson, Ken. 2007. 'The Changing Faces of New Hampshire. The Carsey Institute. Durham, NH.

The Changing Face of NH?
Distribution of Population by Race and Ethnicity (2005)
0.70% 0.70%1.10% 2.10% 2.20%
96.40%
0.00%
10.00%
20.00%
30.00%
40.00%
50.00%
60.00%
70.00%
80.00%
90.00%
100.00%
White Black orAfrican
American
AmericanIndian and
AlaskaNative
Asian Some otherrace
Hispanic orLatino (ofany race)
NH PercentUS Percent

High Growth in foreign born in early 2000s. Higher than US
average and similar to Georgia and NC
State
2000-2005 Percentage Change
in Foreign Born Population
2000-2005 Average Annual Percentage
Change
2005 Foreign Born
Population
Georgia 37.8% 6.6% 795,419
New Hampshire 33.8% 6.0% 72,480
North Carolina 30.4% 5.5% 560,753
Massachusetts 15.3% 2.9% 891,184
Connecticut 14.4% 2.7% 423,254
Rhode Island 9.4% 1.8% 130,517
Maine 5.5% 1.1% 38,727
Montana 2.1% 0.4% 16,734
Vermont -6.0% -1.2% 21,843
United States 14.8% 2.8% 35,622,125
Source: Ross Gittell, NH 2018 Presentation

Why NH? Lower Housing Prices?
Median Home Value (1960 and 2007)
$13,800
$313,138
$236,597
$10,700
$207,720
$11,900
$0
$50,000
$100,000
$150,000
$200,000
$250,000
$300,000
$350,000
1960 2007
NHMASSUS

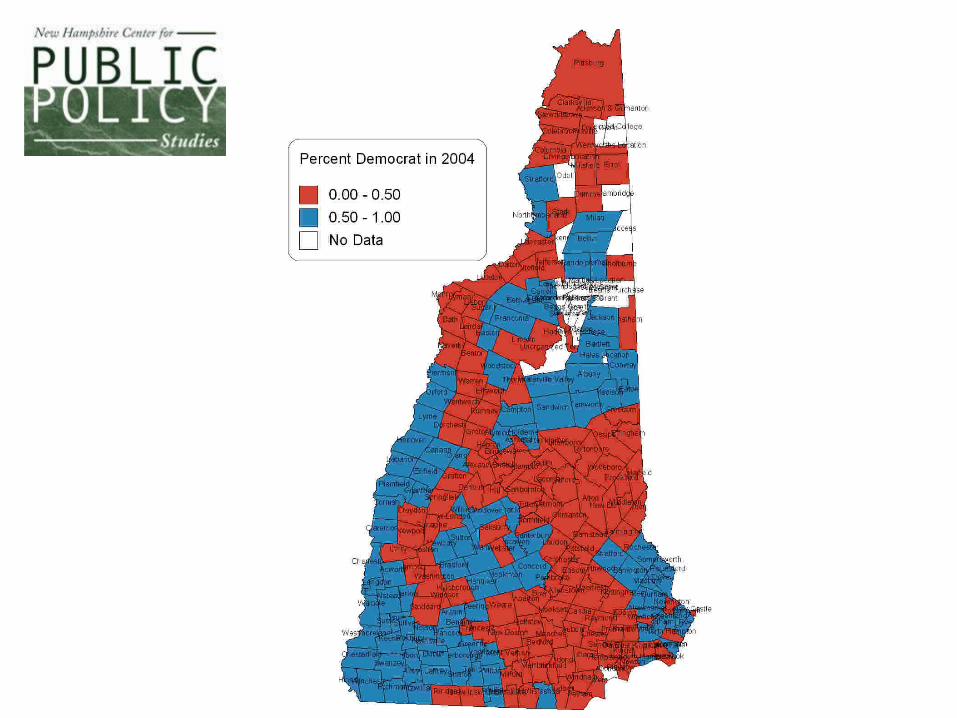
Voting PatternsChange


Major Policy Levers Which Will Affect Issue of Aging
• Transportation• Housing Prices• ‘Retaining Youth’ Initiatives (55 Initiative, the
Arts)• Information Highway• Conservation, Quality of Life, Water and Sewer• Business Development• State and Community Investment• Taking Advantage of Regional Opportunities

What is NH?
The Tech Corridor?
The Lakes RegionThe North Country
The Seacoast
The Capital RegionThe Monadnock Region
Mt Washington Valley

Geographic Variation: What Do Regions Have in Common?
Source: NH Office of State Planning Estimates
Population C hange 2000 to 2005
-27 - 50
50 - 100
100 - 200
200 - 300
300 - 1,000
1,000 - 3 ,000

And the Agent for Change is …

? Recession ?

NH 2018
• Many policy levers affecting the future. • Prediction for 2018? Not that much different
than now.• Recession makes investment and change
difficult.• State and local policy decisions regarding
transportation, housing and energy likely to fundamentally shape 2018 and BEYOND.
• What will the boomers do?

All of our reportsare available on the
web:
www.nhpolicy.orgwww.nhpolicy.org
New Hampshire Center New Hampshire Center for Public Policy Studiesfor Public Policy Studies
Board of Directors
Donna Sytek, Chair
John B. Andrews
John D. Crosier
Shelia T. Francoeur
Chuck Morse
Todd Selig
Stuart Smith
James Tibbetts
Brian Walsh
Kimon S. Zachos
Martin Gross
Staff
Steve Norton
Dennis Delay
Ryan Tappin
“…to raise new ideas and improve policy debates through quality information and analysis on issues shaping New Hampshire’s future.”


