
Whole of Government Accounts: year ended 31 March 2019
HC 500 July 2020


Whole of Government Accounts: year ended 31 March 2019
HC500 July 2020
Presented to the House of Commons pursuant to section 11 of the Government Resources and Accounts Act 2000
Ordered by the House of Commons to be printed on 21 July 2020

© Crown copyright 2020
This publication is licensed under the terms of the Open Government Licence v3.0 except
where otherwise stated. To view this licence, visit nationalarchives.gov.uk/doc/open-
government-licence/version/3.
Where we have identified any third party copyright information you will need to obtain
permission from the copyright holders concerned.
This publication is available at: www.gov.uk/official-documents.
Any enquiries regarding this publication should be sent to us at
ISBN 978-1-913635-34-3 PU2970
1
Contents
Chapter 1 Overview and performance analysis 2
Chapter 2 Statement of Accounting Officer's responsibilities 66
Chapter 3 Governance Statement 68
Chapter 4 Financial Statements 77
Chapter 5 Certificate and Report of the Comptroller and Auditor
General to the House of Commons
179
Annex A Comparison to the National Accounts 192
2
Chapter 1
Overview and performance analysis
Overview 1.1 The Whole of Government Accounts (WGA) is a uniquely comprehensive
view of the governments financial position and performance. It consolidates the UK
public sector, in line with International Financial Reporting Standards.
1.2 The requirement to produce WGA is set out in legislation (the Government
Resources and Accounts Act 2000), and every year the Treasury must prepare a set
of accounts, have them audited and lay them in Parliament.
1.3 The headlines for WGA 2018-19 show income of £795.6 billion (2017-18:
£764.5 billion restated), expenditure of £851.8 billion (2017-18: £808.8 billion
restated). After financing costs, most notably changes in the discount rate, the net
income for WGA is £1.5 billion (2017-18: net expenditure £202.8 billion restated).
On the Statement of Financial Position, WGA shows total assets of £2,098.8 billion
(2017-18: £2,013.8 billion restated), and liabilities of £4,554.6 billion (2017-18:
£4,579.2 billion restated).
1.4 As well as the income, expenditure, assets and liabilities recognised in WGA,
the accounts include several other liabilities and commitments that are disclosed,
but not recognised. These include capital commitments of £53.2 billion (2017-18:
£54.2 billion), operating lease commitments of £21.3 billion (2017-18: £21.0
billion), PFI finance lease commitments of £38.5 billion and service charge
commitments of £81.4 billion (2017-18: £39.6 billion and £86.3 billion) and other
financial commitments of £59.8 billion (2017-18: £48.8 billion).
1.5 In addition, the government has several contingent liabilities. These are
currently not sufficiently likely to occur to warrant recognition on the Statement of
Financial Position but are disclosed. These include £80.1 billion (2017-18: £83.7
billion) of contingent liabilities that are reported under the accounting standards,
and a further £297.4 billion (£318.9 billion restated) of remote contingent liabilities.
As the chance of these liabilities becoming due is considered remote, the accounting
standards do not require their disclosure. However, the Treasury requires
government departments to disclose remote contingent liabilities through its
government reporting framework.
1.6 Two major events took place after the 2018-19 financial year end. These are
EU exit and the outbreak of COVID-19. Although the financial effects of these events
are not recorded in WGA, this overview provides a summary of the likely financial
3
impact where known and further information is provided in Note 32, Events after
the reporting period.
Significant matters of interest
COVID-19
1.7 This has been an unprecedented period in the history of the United
Kingdom. The challenges of the COVID-19 outbreak is requiring a national effort
and is having a huge impact on society, the economy and public services.
1.8 Shortly after COVID-19 was declared a pandemic on 11 March 2020 the
government began to make a series of announcements to support public services,
workers and businesses. These measures are detailed in the NAO’s publication
Overview of the UK government’s response to the COVID-19 pandemic1 and total
£124.3 billion as at 4 May 2020:
• £6.6 billion for health and social care
• £15.8 billion for other public services and the wider emergency response
• £19.5 billion for support measures for individuals
• £82.2 billion for financial support for businesses
• £0.2 billion of other support, including international aid
1.9 Out of the £124.3 billion estimation, approximately £5.5 billion are loans.
The loans would normally be expected to be repaid and would most likely appear on
the WGA balance sheet. This will then be subject to impairment assessments going
forward.
1.10 The NAO report notes that these cost commitments do include central
government’s allocation of funding to local and devolved governments but do not
include further spending decisions taken by local authorities and devolved
administrations. It also notes that some of these commitments are for a given period
of support, which may be extended and therefore lead to increased costs. This is
particularly relevant for the Coronavirus Job Retention Scheme which was extended
on 12 May 2020 to October 2020.
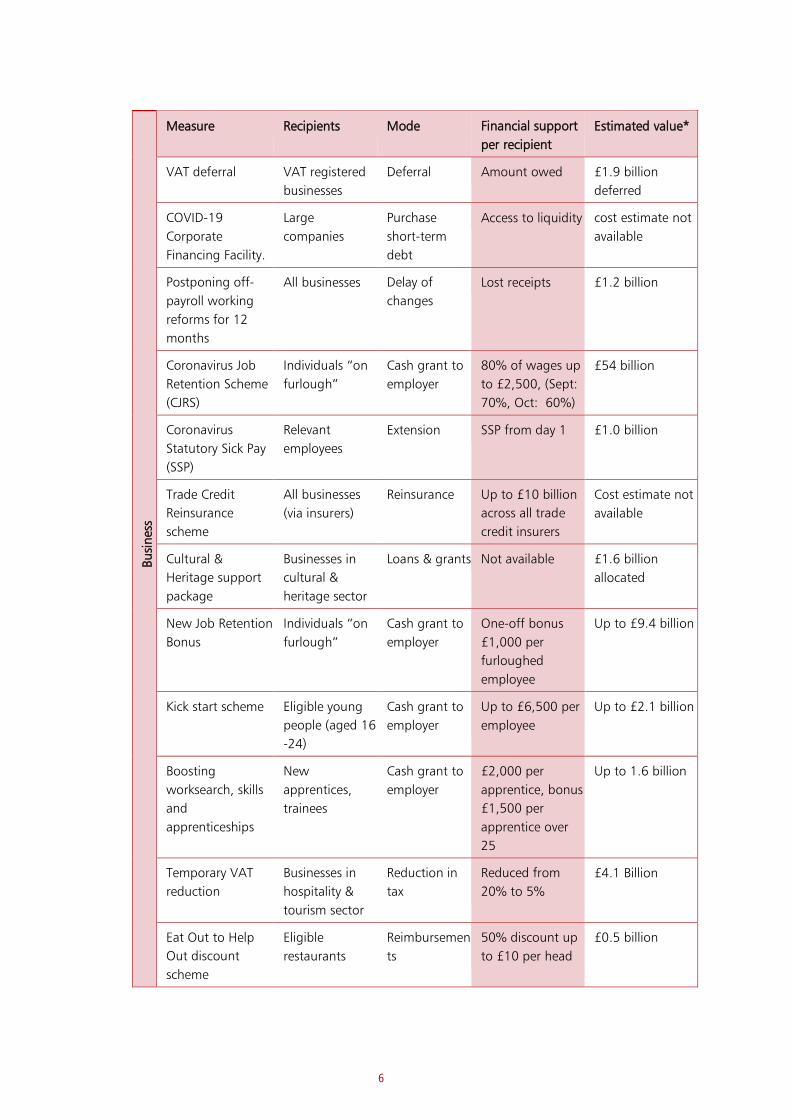
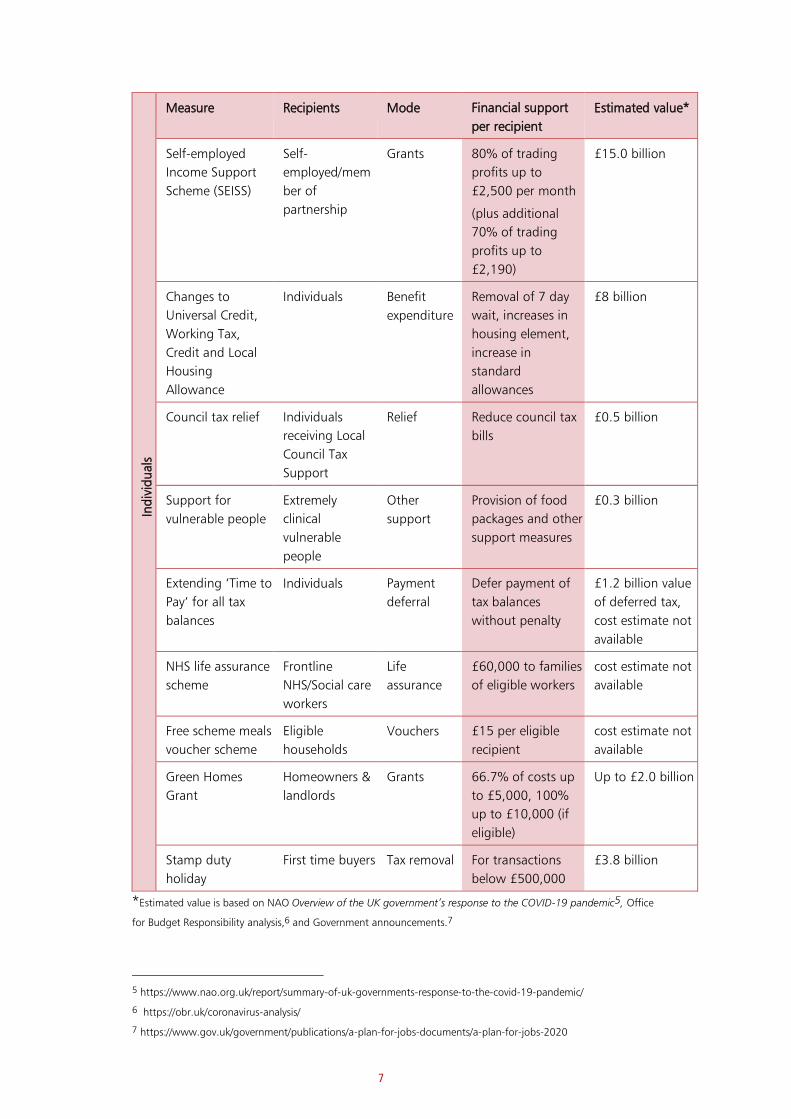
1.11 Since the NAO report in May, there has been additional announcements of
government measures. Table 1.A on the following page summarises all COVID-19
measures to support individuals and businesses up until the announcement of the
latest measure on 4 June, and an estimate of their cost where available.
1.12 The spread of COVID-19 and the public health restrictions put in place to
limit it will raise the budget deficit and public debt significantly, reflecting both the
associated economic disruption and the government’s economic policy response.
1.13 The OBR produced an initial assessment of the potential impact of the
coronavirus on the economy and public finances on 14 April 2020, this will be
1 https://www.nao.org.uk/report/summary-of-uk-governments-response-to-the-covid-19-pandemic/
4
updated on the 14 July 20202 . This was a scenario rather than a forecast, based on
the illustrative assumption that economic activity would be heavily restricted for
three months and then gradually return to normal over the subsequent three
months.
1.14 The OBR’s initial scenario has Public Sector Net Borrowing (PSNB) at £273
billion in 2020-21 and Public Sector Net Debt (PSND) as a percentage of GDP at
95%. On 14th May this forecast was updated. PSNB increased to £298.4 billion and
PSND increased to 95.8%. Both forecasts are significantly different to the forecasts
published in the March Economic Fiscal Outlook.3 In March PSNB was forecast to be
£54.8 billion in 2020-21 and PSND as a percentage of GDP at 77.4%.
1.15 The OBR continue to monitor the economic, market and policy
developments that will feed through to the official measures of the public finances
and the latest information is available on their website. The table below provides an
estimate of costs based on NAO and OBR’s best understanding of the announced
measures. Precise costs will depend on a range of uncertain factors, including the
impact of the crisis on the wider economy and the level of take-up for each scheme.
1.16 On the 8 July 2020 the Chancellor announced a number of new measures as
part of a £160 billion support package to help the UK economy recover.4 The
estimated cost of some of the measures were included in the speech and therefore
reported in the table below. Where the estimated value is not known, it will be
recorded as not available. The OBR will be providing cost estimates for the measures
announced in late July.
2 https://obr.uk/coronavirus-analysis/
3 https://obr.uk/efo/economic-and-fiscal-outlook-march-2020/
4 https://www.gov.uk/government/news/rishis-plan-for-jobs-will-help-britain-bounce-back

5
Summary of COVID-19 measures and potential financial implications as at 4 June 2020
Busi
nes
s Measure Recipients Mode Financial support
per recipient Estimated value*
Grants for small
businesses and
retail, hospitality
and leisure grant
fund scheme
businesses
Small businesses
and retail,
hospitality and
leisure sectors
Grants £10,000 or
£25,000
£15.0 billion
Coronavirus
Business
Interruption Loan
Scheme (CBILS)
Small and
medium sized
businesses
Guarantor
for 80%
Up to £5 million,
covering lender
levied charges &
interest charges
£5 billion for 3
schemes (CBILS
being 1)
Business rates
holiday relief
Eligible Retail,
Hospitality and
Leisure
businesses
Removal Equivalent to
business rate bill
£10.2 billion
Coronavirus Large
Business
Interruption Loan
Scheme
Larger
businesses
Guarantor
for 80%
Guarantor for
80% of up to £50
million
£5 billion for 3
schemes
(Coronavirus Large
Business
Interruption Loan
Scheme being 2)
Future Fund UK based
companies
Loans
(subject to
match
funding)
£125K-£5 million £0.25 billion
allocation
Financial support
for research and
development
SMEs
SMEs Grants and
loans
£750 million of
grants made
available
Up to
£0.55 billion
Bounce Back Loan
Scheme
Smallest
businesses
Guarantor
for 100%
Up to £50,000,
covering lender
levied charges, &
interest charges
£5 billion for 3
schemes (Bounce
Back Loan Scheme
being 3)
Local Authority
Discretionary
Grants Fund
Eligible small
businesses not
covered by
other existing
schemes
Grants Up to £25,000 £0.6 billion
6
Busi
nes
s
Measure Recipients Mode Financial support
per recipient
Estimated value*
VAT deferral
VAT registered
businesses
Deferral Amount owed £1.9 billion
deferred
COVID-19
Corporate
Financing Facility.
Large
companies
Purchase
short-term
debt
Access to liquidity cost estimate not
available
Postponing off-
payroll working
reforms for 12
months
All businesses Delay of
changes
Lost receipts £1.2 billion
Coronavirus Job
Retention Scheme
(CJRS)
Individuals “on
furlough”
Cash grant to
employer
80% of wages up
to £2,500, (Sept:
70%, Oct: 60%)
£54 billion
Coronavirus
Statutory Sick Pay
(SSP)
Relevant
employees
Extension SSP from day 1 £1.0 billion
Trade Credit
Reinsurance
scheme
All businesses
(via insurers)
Reinsurance Up to £10 billion
across all trade
credit insurers
Cost estimate not
available
Cultural &
Heritage support
package
Businesses in
cultural &
heritage sector
Loans & grants Not available £1.6 billion
allocated
New Job Retention
Bonus
Individuals “on
furlough”
Cash grant to
employer
One-off bonus
£1,000 per
furloughed
employee
Up to £9.4 billion
Kick start scheme Eligible young
people (aged 16
-24)
Cash grant to
employer
Up to £6,500 per
employee
Up to £2.1 billion
Boosting
worksearch, skills
and
apprenticeships
New
apprentices,
trainees
Cash grant to
employer
£2,000 per
apprentice, bonus
£1,500 per
apprentice over
25
Up to 1.6 billion
Temporary VAT
reduction
Businesses in
hospitality &
tourism sector
Reduction in
tax
Reduced from
20% to 5%
£4.1 Billion
Eat Out to Help
Out discount
scheme
Eligible
restaurants
Reimbursemen
ts
50% discount up
to £10 per head
£0.5 billion
7
Ind
ivid
ual
s
Measure Recipients Mode Financial support
per recipient
Estimated value*
Self-employed
Income Support
Scheme (SEISS)
Self-
employed/mem
ber of
partnership
Grants 80% of trading
profits up to
£2,500 per month
(plus additional
70% of trading
profits up to
£2,190)
£15.0 billion
Changes to
Universal Credit,
Working Tax,
Credit and Local
Housing
Allowance
Individuals Benefit
expenditure
Removal of 7 day
wait, increases in
housing element,
increase in
standard
allowances
£8 billion
Council tax relief Individuals
receiving Local
Council Tax
Support
Relief Reduce council tax
bills
£0.5 billion
Support for
vulnerable people
Extremely
clinical
vulnerable
people
Other
support
Provision of food
packages and other
support measures
£0.3 billion
Extending ‘Time to
Pay’ for all tax
balances
Individuals Payment
deferral
Defer payment of
tax balances
without penalty
£1.2 billion value
of deferred tax,
cost estimate not
available
NHS life assurance
scheme
Frontline
NHS/Social care
workers
Life
assurance
£60,000 to families
of eligible workers
cost estimate not
available
Free scheme meals
voucher scheme
Eligible
households
Vouchers £15 per eligible
recipient
cost estimate not
available
Green Homes
Grant
Homeowners &
landlords
Grants 66.7% of costs up
to £5,000, 100%
up to £10,000 (if
eligible)
Up to £2.0 billion
Stamp duty
holiday
First time buyers Tax removal For transactions
below £500,000
£3.8 billion
*Estimated value is based on NAO Overview of the UK government’s response to the COVID-19 pandemic5, Office
for Budget Responsibility analysis,6 and Government announcements.7
5 https://www.nao.org.uk/report/summary-of-uk-governments-response-to-the-covid-19-pandemic/
6 https://obr.uk/coronavirus-analysis/
7 https://www.gov.uk/government/publications/a-plan-for-jobs-documents/a-plan-for-jobs-2020
8
Transactions and balances with the EU
1.17 The UK left the European Union on 31 January 2020. This section explains
how the financial relationship between the UK and EU is treated in WGA and
provides an estimate of the financial liability arising from EU exit.
1.18 A fuller explanation of the relationship is set out in Annex E of the European
Union Finances: statement on the EU Budget and measures to counter fraud and
financial mismanagement.8
1.19 Transactions, balances and commitments between the UK public sector and
the EU are recognised in a number of places in WGA:
• The UK’s contribution to the EU budget is recognised as a grant expense.
This totalled £12.9 billion for 2018-19 (£12.2 billion for 2017-18). This
contribution is paid by the Consolidated Fund, and can be found in Note 9
of WGA.
• EU grants and subsidies paid by the UK government on behalf of the EU
are also recognised as a grant expense. For 2018-19 this was £4.1 billion
(£3.1 billion in 2017-18). This is largely made up of £2.5 billion (£2.1
billion in 2017-18) of grant payments made by the Department for
Environment, Food and Rural Affairs (DEFRA). The EU reimburses the UK for
this expenditure. This grant payment can be found in Note 9 of WGA.
• Income from the EU to reimburse grants and subsidies can be found in
Note 5 of the accounts. For 2018-19 this income was £5.9 billion (£4.1
billion for 2017-18). As noted above, this is largely made up of income
received by DEFRA to reimburse them for grants and subsidies paid. Both
the payment of grants and subsidies and the subsequent reimbursement is
reported to ensure transparency of the flow of funds.
• The UK’s interest in the European Investment Bank is included as a non-
current investment in the Consolidated Fund accounts and WGA. The value
of this asset in WGA at 31 March 2019 was £9.9 billion (2017-18 £9.7
billion). It is included on the Statement of Financial Position and in Note 16
as an equity investment. Under the Withdrawal Agreement the UK’s paid
in capital in the EIB of €3.5 billion will repaid to the UK. For further details
see paragraph 1.24.
• In addition to income, assets and expenditure, there are contingent
liabilities held by the UK government that reflect commitments to the EIB
and loans to EU member states and third countries that are ultimately
backed by the EU budget. As these are contingent liabilities, no money has
changed hands, they represent a commitment of the UK government
should it be needed. Therefore, no liability is recognised on the balance
sheet, and these amounts do not contribute to the WGA net liabilities
figure. In addition, these are considered remote contingent liabilities,
meaning they are considered to have a very low chance of crystallising. The
government’s commitment for callable capital under the EIB is £30.6 billion
(£31.3 billion in 2017-18), and the UK’s maximum liability under loans
backed by the EU budget is £9.9 billion (£10.6 billion in 2017-18). More
8 https://www.gov.uk/government/collections/eu-annual-statement
9
information on these can be found in the accounts of the Consolidated
Fund, and in Note 30 of WGA.
The financial settlement
1.20 The UK left the European Union on 31 January 2020. A transition period is in
effect to the end of 2020. Current rules on trade, travel and business for the UK and
EU will continue to apply during the transition period.
1.21 The Agreement on the withdrawal of the United Kingdom of Great Britain
and Northern Ireland from the European Union and the European Atomic Energy
Community9 sets out the financial settlement that was reached on the UK’s financial
rights and obligations as a departing Member State.
Scope of the financial settlement
1.22 The financial settlement addresses mutual obligations that arose primarily as
a consequence of the UK’s participation in the EU budget, and commitments related
to the UK’s broader membership of the EU. It does not cover the costs of facilitating
withdrawal or new administrative arrangements that may result from the UK’s exit.
There is also no obligation in the financial settlement to pay for the relocation of EU
bodies previously located in the UK.
1.23 The financial settlement does not cover costs that might be associated with
the UK’s future relationship with the EU. The government has been clear throughout
this period that there are some specific European programmes in which the UK may
want to participate. If so, and this will be for the UK to decide, it is reasonable that
an appropriate contribution should be made. These decisions are subject to
negotiations on our future relationship with the EU, and future decisions of
Parliament.
1.24 The financial settlement has three main components:
• First, the UK will continue to participate in EU annual budgets to 31
December 2020. This means that the UK will continue to make its
contribution and get receipts from EU budget programmes under the
normal rules. The financial impact of this will be reflected as an in-year cost
in the 2019-20 and 2020-21 accounts of the Consolidated Fund,
departments administering certain EU programme receipts and WGA, and
are not reflected in the figures in the table below.
• Second, the UK will then pay its share of the EU’s outstanding
commitments at the end of 2020 (the so-called RAL- ‘reste à liquider’) and
again will benefit from some of these commitments.
• Third, the UK will pay a share of the EU’s liabilities as at the end of 2020,
and any materialising contingent liabilities, and in return will benefit from a
share of relevant EU assets. This includes eligible pension liabilities. These
are shown in the ‘pensions’, ‘EIB paid in capital’ and ‘other’ lines in the
table below.
9 https://www.gov.uk/government/publications/agreement-on-the-withdrawal-of-the-united-kingdom-of-great-
britain-and-northern-ireland-from-the-european-union-and-the-european-atomic-energy-communi
10
Valuation of the financial settlement
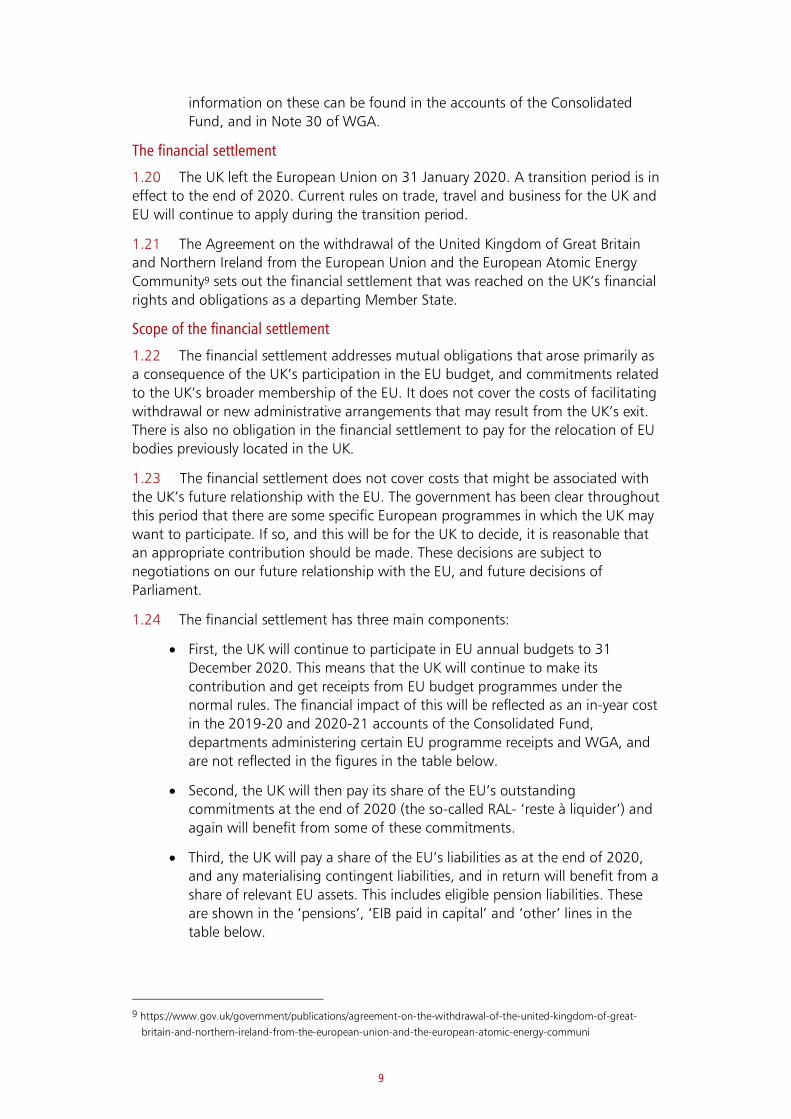
1.25 An estimate of the assets and liabilities that would be recognised in the
accounts of HM Treasury and also of those disclosed in the Consolidated Fund in
respect of the EIB as a result of the financial settlement, as at 31 March 2020, is
provided in the table below. This only includes those elements of the financial
settlement that are recognised under applicable accounting standards and
therefore, for example, the first element (contributions and receipts from the 2020
EU Budget) are not included. A fuller presentation of all elements of the financial
settlement can be found in European Union Finances, published by HM Treasury.6
Valuation of the financial settlement as at 31 March 2020
Element Asset (£bn) Liability (£bn) Maturity profile
RAL - (30.3) To 2027-28
Pensions - (8.2) Various
EIB paid in capital 2.5 - To 2031-32
Other 0.2 - To 2022-23
Total (net) (35.8)
Source: HM Treasury
1.26 The UK's shareholding in the EIB is recognised as a financial asset with a
value of £9.9 billion in WGA 2018-19. The figure of £2.5 billion represents the
return of the UK's paid-in capital in the EIB (€3.5 billion undiscounted). 2018-19
values in WGA have not been restated.
1.27 Remote contingent liabilities relating to the UK's callable capital commitment
from membership of the European Investment Bank (EIB) are valued at £31.6bn (as
at 31st March 2020). This commitment was previously disclosed in 2017-18 WGA. In
addition, the UK will maintain a contingent liability in respect of the returned paid in
capital, which will wind down in relation to the amortisation of EIB operations
approved before withdrawal. Remote contingent liabilities to the EU Budget in Note
30 of WGA are treated in combination with the UK’s share of the associated pre-
paid guarantee funds in accordance with the terms of the Withdrawal Agreement,
which in some cases gives rise to contingent assets. Contingent assets and liabilities
are not included in the table above.
1.28 The financial provisions of the Withdrawal Agreement also include other
elements that will be recognised as expenditure and income in WGA in future
reporting periods. For example, UK participation in EU annual budgets to 2020 do
not give rise to material assets or liabilities. UK contributions and public sector
receipts from EU programmes accrue in the year to which they relate. Further
information on the financial effects arising from the financial provisions of the
Withdrawal Agreement can be found in the European Union Finances, published by
HM Treasury.10
10 https://www.gov.uk/government/collections/eu-annual-statement
11
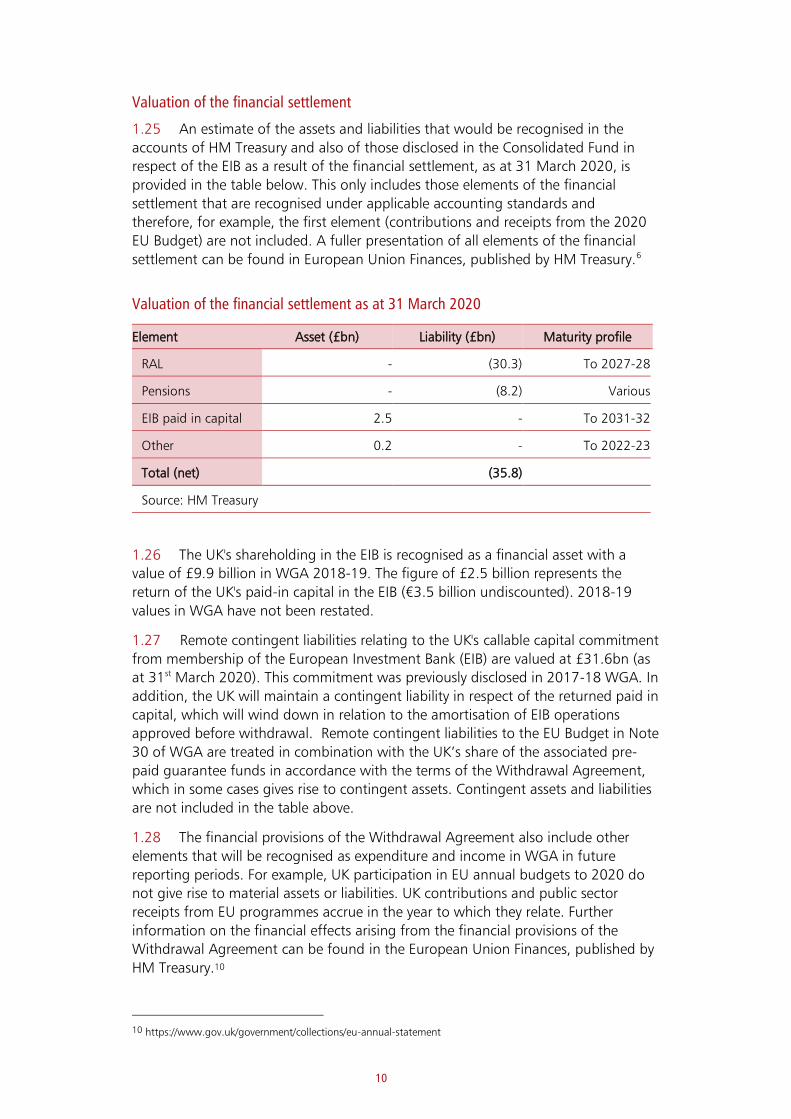
Sensitivities and assumptions
1.29 These assets and liabilities represent payments and receipts to be recognised
several years into the future. There are a number of key sensitivities and assumptions
which may affect future valuations.
1.30 The asset and liability valuations are sensitive to changes in the discount
rates applied under the applicable accounting standards. The obligations of the
financial settlement are principally denominated in Euros and therefore the sterling
valuations are sensitive to changes in the Sterling/Euro exchange rate. The
accounting valuations for the pension related liabilities are sensitive to actuarial
assumptions (e.g. life expectancy, inflation) for defined benefit pension obligations.
The value of the RAL is also sensitive to the level of implementation of EU Budget
commitments (not all commitments necessarily translate into payments). All the
items disclosed in the table above, with the exception of those in relation to the EIB,
are sensitive to the UK’s financing share (the average proportion of the EU Budget
that the UK has financed over the 2014-20 period). The key sensitivities are set out
in the table below.
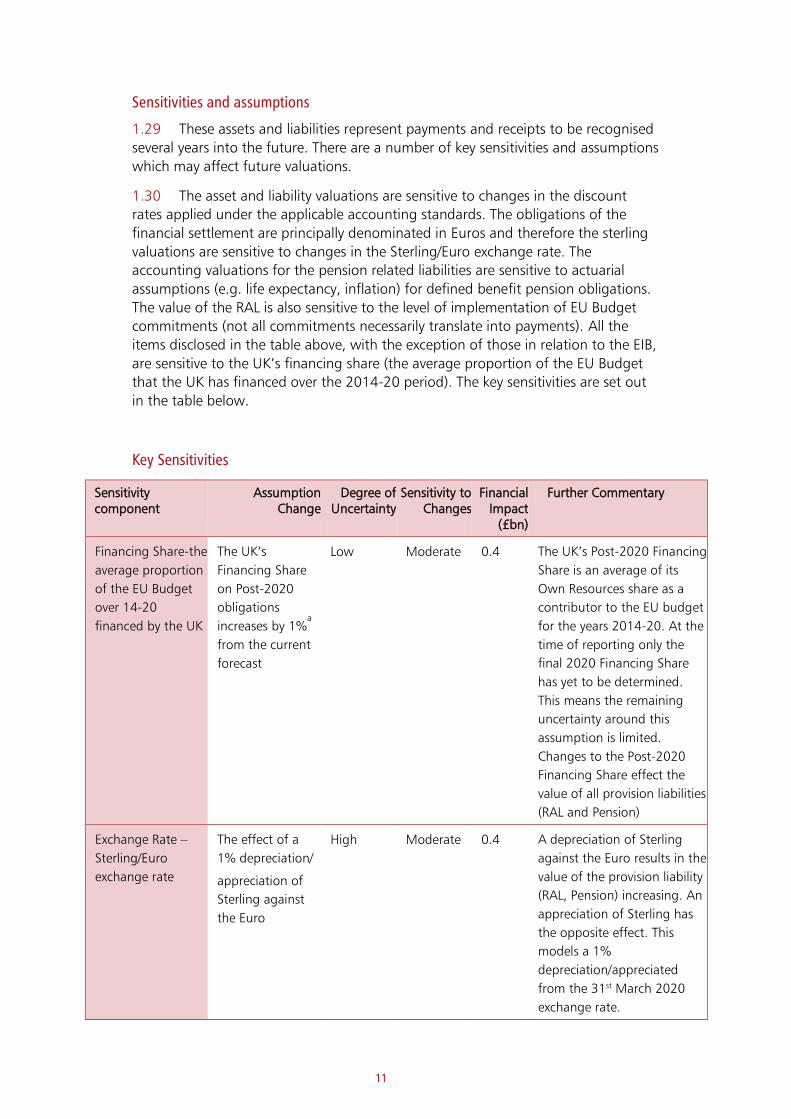
Key Sensitivities
Sensitivity component
Assumption Change
Degree of Uncertainty
Sensitivity to Changes
Financial Impact
(£bn)
Further Commentary
Financing Share-the
average proportion
of the EU Budget
over 14-20
financed by the UK
The UK’s
Financing Share
on Post-2020
obligations
increases by 1%a
from the current
forecast
Low Moderate 0.4 The UK’s Post-2020 Financing
Share is an average of its
Own Resources share as a
contributor to the EU budget
for the years 2014-20. At the
time of reporting only the
final 2020 Financing Share
has yet to be determined.
This means the remaining
uncertainty around this
assumption is limited.
Changes to the Post-2020
Financing Share effect the
value of all provision liabilities
(RAL and Pension)
Exchange Rate –
Sterling/Euro
exchange rate
The effect of a
1% depreciation/
appreciation of
Sterling against
the Euro
High Moderate 0.4 A depreciation of Sterling
against the Euro results in the
value of the provision liability
(RAL, Pension) increasing. An
appreciation of Sterling has
the opposite effect. This
models a 1%
depreciation/appreciated
from the 31st March 2020
exchange rate.
12
Decommitments –
the proportion of
EU budgetary
commitments in
the RAL that are
not implemented
The proportion of
RAL that is
estimated to be
decommitted
changes by 1% in
absolute terms.
Moderate Moderate 0.3 A decrease in
decommitments increases the
value of the RAL liability. An
increase in decommitments
will have the opposite effect.
Discount Rate – the
discount rate
applied to future
cash flows to take
account of the time
value of money
The effect of a
0.1% decrease in
the discount rate
applied to
provision liabilities
(principally RAL
and Pension)
Moderate Moderate 0.3 Provisions are discounted in
accordance with the
requirements of the Financial
reporting Manual and the
rates set centrally by HM
Treasury. The 0.1% decrease
is applied to each of the spot
rates set for different time
horizons. Changes to this
discount rate do not affect
what the UK pays under the
financial settlement, only the
valuation of the liability for
financial reporting purposes.
Source: HM Treasury
a This is equivalent to an increase in absolute terms of over 0.1% in terms of the UK’s share of EU
obligations. For further explanation of the UK’s financing share of the EU budget, see European Union
Finances, published by the HM Treasury.
Spending on EU Exit preparations
1.31 The UK public sector has incurred costs to prepare for EU exit. These costs
have been met through a mixture of additional funding provided specifically for this
purpose and through existing budgets. The costs of preparing for EU exit are
included within WGA but cannot be split out from other day-to-day activities.
Assessing whether expenditure relates wholly or partially to EU exit preparations
requires a significant level of judgement. It is challenging to harmonise these
judgements across all entities.
1.32 The National Audit Office published an estimate of EU Exit spending by
central government departments in its report Measuring the cost of EU exit
preparations11. This report found that at least £4.4 billion had been spent by
departments on EU exit preparations between June 2016 and 31 January 2020. Of
this, £1.9 billion was spent on staff and staff related activities, and £1.5 billion spent
on purchases of goods and services.
1.33 Around £1.6 billion of this was spent in 2018-19, and a further £2.3 billion
spent in 2019-20.
1.34 Departmental spending (including spending on EU exit) is covered by
Treasury budget management controls in order to prevent overspending.
11 https://www.nao.org.uk/report/the-cost-of-eu-exit-preparations/
13
What WGA does not include in respect of EU exit
1.35 WGA does not include:
• liabilities relating to policy or legislative effects on the wider economy, if
these effects do not meet the criteria set out in the accounting standards
• transactions between entities not covered by WGA (for example private
companies) and the EU
• the effect of EU exit on the economy; in addition, any marginal impact on
the public finances (e.g. through increased or decreased spending on
benefits, increased or decreased borrowing or changes in underlying
assumptions that affect valuations) will be recognised but may not be
separately identifiable

Year at a glance Highlights of cross government performance statistics
£34.1bn additional tax generated by tackling avoidance, evasion and non-
compliance. Source HMRC
£5.3bn received from the sale of Bradford & Bingley loans
£2.5bn in revenue from the sale of shares in RBS. Source: HMT£
£5.5bn used to support 78,000 smaller businesses. Source: BEIS
£45.2bn core funding for schools and high needs. Source: DfE
£1.8bn for the Schools for the Future programme in Scotland.Source: Scottish Government
£1.1bn of the Home Building Fund was awarded, and is expected to
unlock over 47,000 homes. Source: MHCLG
1.6% GDP growth in 2019. Source: ONS
>£1.4bn invested across 2014-19 with 193 schools and colleges
rebuilt or refurbished in Wales. Source: Welsh Government
£1.5bn in revenue from the sale of Network Rail arches portfolio.Source: DfT
£350m to help boost economic potential of Northern Ireland. Source: NI Office
£182.5bn paid out in benefit, pension and Social Fund payments.Source: DWP
14
What is WGA?
Whole of Government Accounts is a unique publication, that puts the UK at the global forefront of fiscal transparency and government financial reporting.
WGA is made up of over 9,000 entities, across the whole public sector including central government departments, local authorities, devolved administrations, the NHS, academy schools and public corporations.
Why do we prepare WGA?
Providing a comprehensive picture of the UK’s public sector finances is important, and supports government transparency. Having a picture of long term liabilities helps inform more effective management of fiscal risks.
WGA is independently audited, providing assurance that the figures are prepared in line with International Financial Reporting Standards, as interpreted for the public sector context.
WGA and National Accounts
Day to day management of the public finances uses the National Accounts measures. These measures are less comprehensive than WGA, but are far faster to prepare, and follow international standards that allow comparisons between countries. Using WGA and the National Accounts together allows for robust monitoring of the fiscal position and periodic assessments of the overall state of the public finances, both through WGA itself and through the additional analysis that it supports such as the Office for Budget Responsibility’s Fiscal Risks Report and Fiscal Sustainability Report. Further details on the National Accounts are included in Annex A.
15
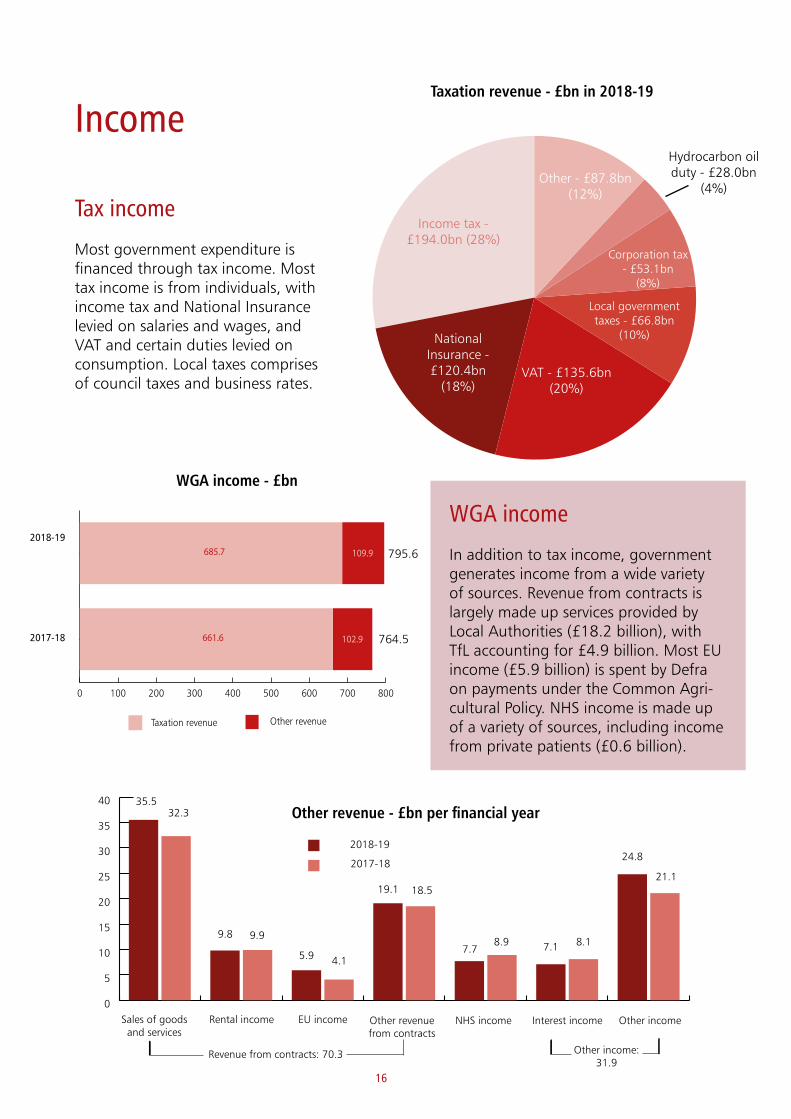
Income
Tax income
Most government expenditure is financed through tax income. Most tax income is from individuals, with income tax and National Insurance levied on salaries and wages, and VAT and certain duties levied on consumption. Local taxes comprises of council taxes and business rates.
WGA income
In addition to tax income, government generates income from a wide variety of sources. Revenue from contracts is largely made up services provided by Local Authorities (£18.2 billion), with TfL accounting for £4.9 billion. Most EU income (£5.9 billion) is spent by Defra on payments under the Common Agri-cultural Policy. NHS income is made up of a variety of sources, including income from private patients (£0.6 billion).
Income tax - £194.0bn (28%)
National Insurance - £120.4bn
(18%)VAT - £135.6bn
(20%)
Local government taxes - £66.8bn
(10%)
Corporation tax - £53.1bn
(8%)
Other - £87.8bn(12%)
Hydrocarbon oil duty - £28.0bn
(4%)
Taxation revenue - £bn in 2018-19
Other revenue - £bn per financial year
WGA income - £bn
0
5
10
15
20
25
30
35
40
Sales of goods and services
Rental income EU income Other revenue from contracts
Interest income Other income
5.9 4.1
9.8 9.9
35.532.3
19.1
7.78.9 7.1
24.8
21.1
2018-19
2017-18
18.5
8.1
NHS income
Revenue from contracts: 70.3 Other income: 31.9
0 100 200 300 400 500 600 700 800
Other revenueTaxation revenue
2018-19
2017-18
685.7
661.6
109.9
102.9
795.6
764.5
16
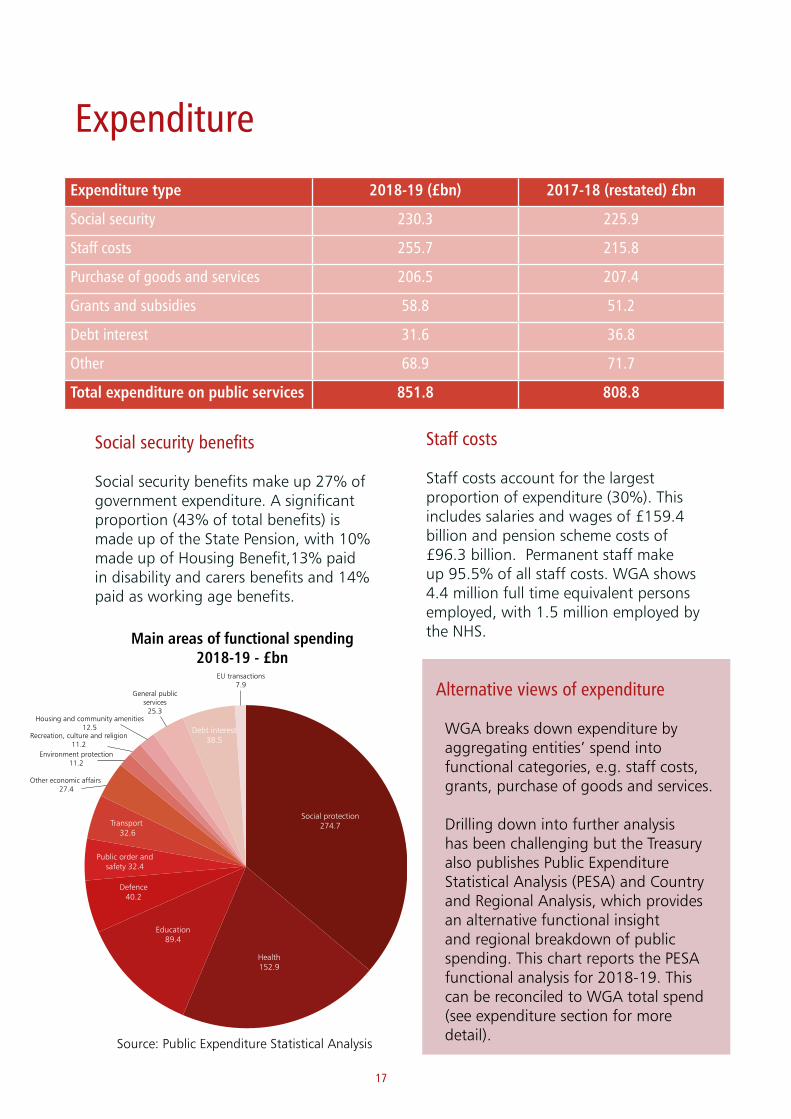
Expenditure
Main areas of functional spending 2018-19 - £bn
Expenditure type 2018-19 (£bn) 2017-18 (restated) £bn
Social security 230.3 225.9
Staff costs 255.7 215.8
Purchase of goods and services 206.5 207.4
Grants and subsidies 58.8 51.2
Debt interest 31.6 36.8
Other 68.9 71.7
Total expenditure on public services 851.8 808.8
Social security benefits
Social security benefits make up 27% of government expenditure. A significant proportion (43% of total benefits) is made up of the State Pension, with 10% made up of Housing Benefit,13% paid in disability and carers benefits and 14% paid as working age benefits.
Staff costs
Staff costs account for the largest proportion of expenditure (30%). This includes salaries and wages of £159.4 billion and pension scheme costs of £96.3 billion. Permanent staff make up 95.5% of all staff costs. WGA shows 4.4 million full time equivalent persons employed, with 1.5 million employed by the NHS.
Social protection 274.7
Health 152.9
Education89.4
Defence40.2
Public order and safety 32.4
Transport 32.6
Other economic affairs 27.4
Environment protection11.2
Recreation, culture and religion11.2
Debt interest 38.5
General public services
25.3Housing and community amenities
12.5
EU transactions7.9 Alternative views of expenditure
WGA breaks down expenditure by aggregating entities’ spend into functional categories, e.g. staff costs, grants, purchase of goods and services.
Drilling down into further analysis has been challenging but the Treasury also publishes Public Expenditure Statistical Analysis (PESA) and Country and Regional Analysis, which provides an alternative functional insight and regional breakdown of public spending. This chart reports the PESA functional analysis for 2018-19. This can be reconciled to WGA total spend (see expenditure section for more detail). Source: Public Expenditure Statistical Analysis
17

Assets
£bn per financial year
Asset type 2018-19 (£bn) 2017-18 (£bn)
Property, plant and equipment 1,268.0 1,208.4
Other financial assets 514.9 507.6
Trade and other receivables 190.3 179.9
Other assets 125.6 117.9
Total assets 2,098.8 2,013.8
Property, plant and equipment
Property, plant and equipment (PPE comprises 60% of assets in WGA. The largest components of PPE are land and buildings, and infrastructure assets – which includes the road and rail network.
Trade and other receivables
The most significant government receivable is taxation income due of £150.7 billion. This represents amounts of tax and duties where the taxable event has occurred but the return has not been received from the taxpayer by the year end.
The most significant assets owned by government are property plant and equipment, other financial assets and trade and other receivables.
Other financial assets
Other financial assets include loans and deposits, the student loan book, equity investments and debt securities. Some are held for cash management purposes and others to support specific policy objectives. The largest increase is student loans, driven by new loans being issued. Equity investments includes shares in RBS. The government sold a tranche of 7.7% of RBS shares with a fair value of £2.5 billion, reducing the remaining shareholding to 62.1%.
0 100 200 300 400 500 600
205.3
206.4
76.9
70.0
56.3
54.8
33.2
30.7
105.0
101.9
38.2
43.8
2018-19
2017-18
Loans and deposits Student loans Equity investments
IMF assets Debt securities Derivatives and other
18
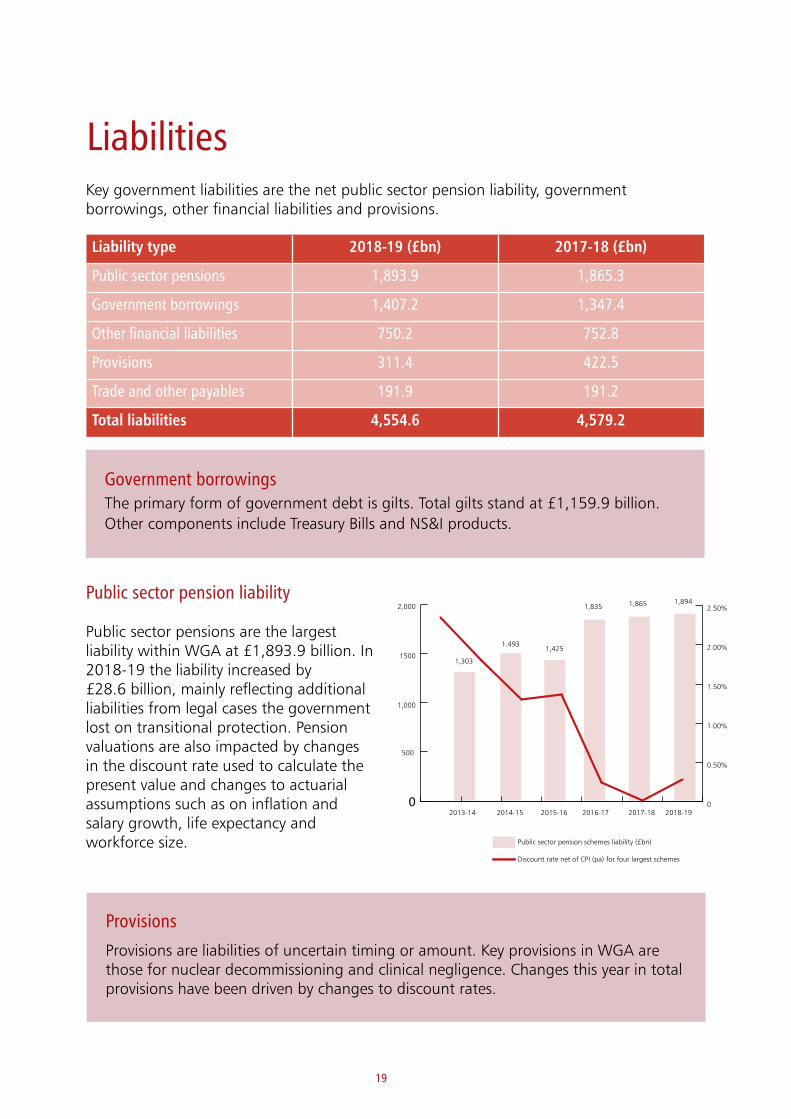
Liabilities Key government liabilities are the net public sector pension liability, government borrowings, other financial liabilities and provisions.
Government borrowingsThe primary form of government debt is gilts. Total gilts stand at £1,159.9 billion.Other components include Treasury Bills and NS&I products.
Liability type 2018-19 (£bn) 2017-18 (£bn)
Public sector pensions 1,893.9 1,865.3
Government borrowings 1,407.2 1,347.4
Other financial liabilities 750.2 752.8
Provisions 311.4 422.5
Trade and other payables 191.9 191.2
Total liabilities 4,554.6 4,579.2
0
500
1,000
1500
2,000
0
0.50%
1.00%
1.50%
2.00%
2.50%
2013-14
500
2014-15 2015-16 2016-17 2017-18 2018-19
1,303
1.4931,425
1,835 1,865 1,894
Public sector pension schemes liability (£bn)
Discount rate net of CPI (pa) for four largest schemes
Public sector pension liability
Public sector pensions are the largest liability within WGA at £1,893.9 billion. In 2018-19 the liability increased by £28.6 billion, mainly reflecting additional liabilities from legal cases the government lost on transitional protection. Pension valuations are also impacted by changes in the discount rate used to calculate the present value and changes to actuarial assumptions such as on inflation and salary growth, life expectancy and workforce size.
Provisions Provisions are liabilities of uncertain timing or amount. Key provisions in WGA are those for nuclear decommissioning and clinical negligence. Changes this year in total provisions have been driven by changes to discount rates.
19

Commitments and contingent liabilities
Commitments
Commitments captured in WGA total £178.2 billion. These include £53.2 billion in capital commitments, £21.3 billion in commitments under operating leases, £5.4 billion in finance leases, £38.5 billion in PFI finance lease commitments and £59.8 billion in other financial commitments.
Types of liability in WGA
The WGA balance sheet shows £4.6 trillion of liabilities. In addition to these, there are commitments which are not recognised on the balance sheet.
Some of these (such as contingent liabilities) are not recognised because they are not seen as probable to occur. Others are commitments, where there is a contractual obligation but the triggering event to recognise a liability has yet to occur.
Contingent liabilities
Contingent liabilities are liabilities that are unlikely, and will not crystallise unless a specific event occurs. These include indemnities, guarantees, or clinical negligence liabilities that are not already recognised on the balance sheet. We see a spike in remote contingent liabilities in 2015-16 when Pension Protection Fund starts disclosing its remote contingent liability for pensions.
The charts below show government’s remote and non-remote contingent liabilities.
Non-remote contingent liabilities £bn per financial year
Remote contingent liabilities£bn per financial year
0
100
200
300
400
500
Other Outstanding loans to EU member states
Gov's potential obligations for coins in circulation
Callable capital in International Financial Institutions
Callable capital to Europe Investment Bank
PPF remote contingent liabilities
2014-15 2015-16 2016-17 2017-18 2018-19
Government Indemnity Scheme DCMS
75.7
419.5
389.8
318.9
297.4
0
20
40
60
80
100
120
2014-15 2015-16 2016-17 2017-18 2018-19
Other Transport infrastructure projects Supporting international organisations
Export guarantees and insurance policies Financial stability interventions by HMT
Clinical negligence claims Taxes subject to challenge
76.4
104.3
84.0 83.780.0
20
21
Report on Assets and Liabilities
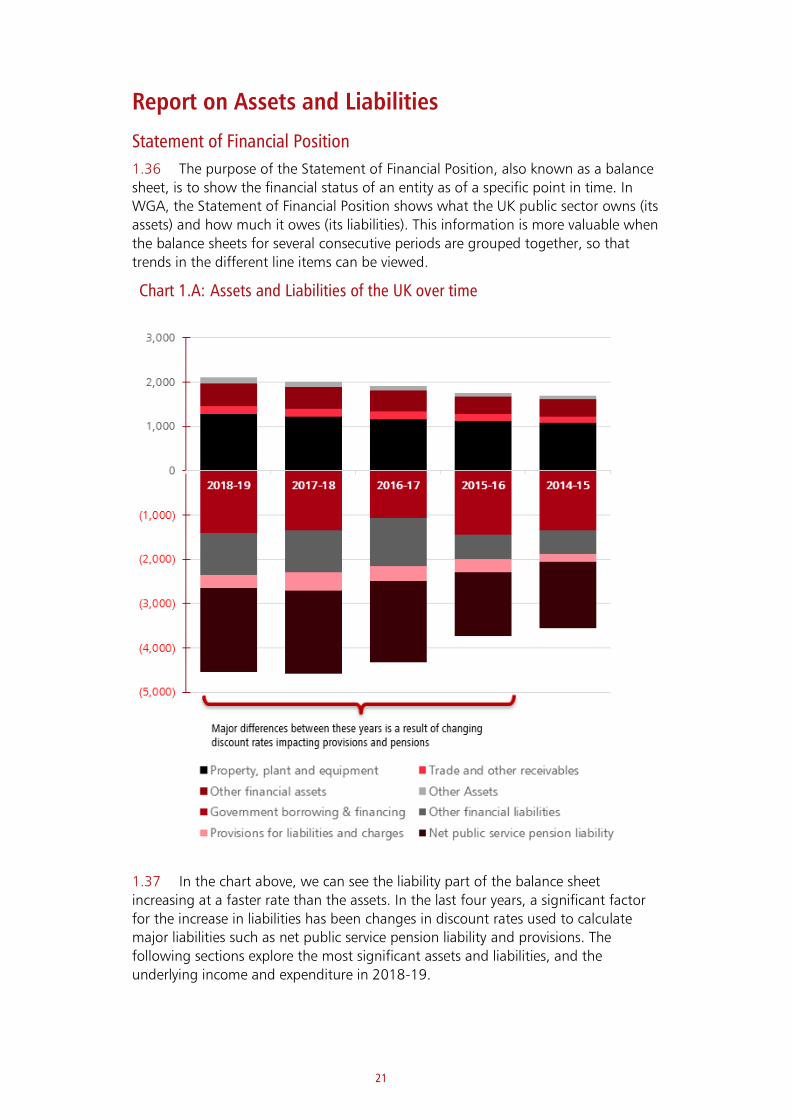
Statement of Financial Position
1.36 The purpose of the Statement of Financial Position, also known as a balance
sheet, is to show the financial status of an entity as of a specific point in time. In
WGA, the Statement of Financial Position shows what the UK public sector owns (its
assets) and how much it owes (its liabilities). This information is more valuable when
the balance sheets for several consecutive periods are grouped together, so that
trends in the different line items can be viewed.
Chart 1.A: Assets and Liabilities of the UK over time
1.37 In the chart above, we can see the liability part of the balance sheet
increasing at a faster rate than the assets. In the last four years, a significant factor
for the increase in liabilities has been changes in discount rates used to calculate
major liabilities such as net public service pension liability and provisions. The
following sections explore the most significant assets and liabilities, and the
underlying income and expenditure in 2018-19.
22
Box 1.A: COVID-19 update – Impact on public finances May 2020
May’s public finance data provides helpful insight to the fiscal impact from
the COVID-19 lockdown and government support for individuals and
businesses. Tax payments received by HMRC were down 43% on the same
period last year, while central government spending jumped by 48%.a
Public sector net borrowing (PSNB) totalled £55.2 billion in May, up £49.6
billion on May last year, and £5.2 billion higher than market expectations.
Borrowing across April and May reached £103.7 billion, up £87.0 billion on
the same period last year and higher than the full-year borrowing in any year
since 2013-14. The rise reflected a £30.6 billion rise in central government
spending, along with a £16.2 billion fall in central government receipts. Local
government borrowing was up £3.0 billion on last year.
Net debt rose by 20.5% of GDP on a year earlier to 100.9% in May – the first
time it has exceeded 100% of GDP since the early 1960s. This reflects the
impact of higher borrowing and Bank of England schemes on cash debt, but
also the falls in nominal GDP over the coming months assumed in the OBR
scenario.
Looking ahead: COVID-19 potential impact on liabilities in future years
The government’s intention is to finance the packages through its normal
debt management operations. Public Sector net borrowing fell from 10.2% of
GDP in 2009-10b to 1.8% of GDP in 2018-19.c The work of the last ten years in
bringing borrowing and debt back under control has ensured the public
finances are well placed to deal with the challenges posed by COVID-19.
However, the government does anticipate a significant financial impact in
2019-20 and 2020-21 accounts on financial liabilities:
• Government borrowing will increase to fund the extra measures
announced to help support individuals, businesses and subsequently
the economy and as a result of reduced taxation income.
• Provisions and public sector liabilities are measured using discount
rates based on factors like the time value of money and corporate
bond yields. These are subject to fluctuation as a result of the
substantial market changes due to COVID-19.
a https://obr.uk/docs/June-2020-Commentary-on-the-public-sector-finances.pdf
b https://obr.uk/docs/dlm_uploads/econ_fiscal_outlook_291110.pdf
c https://cdn.obr.uk/EFO_March-2020_Accessible.pdf
23
Assets
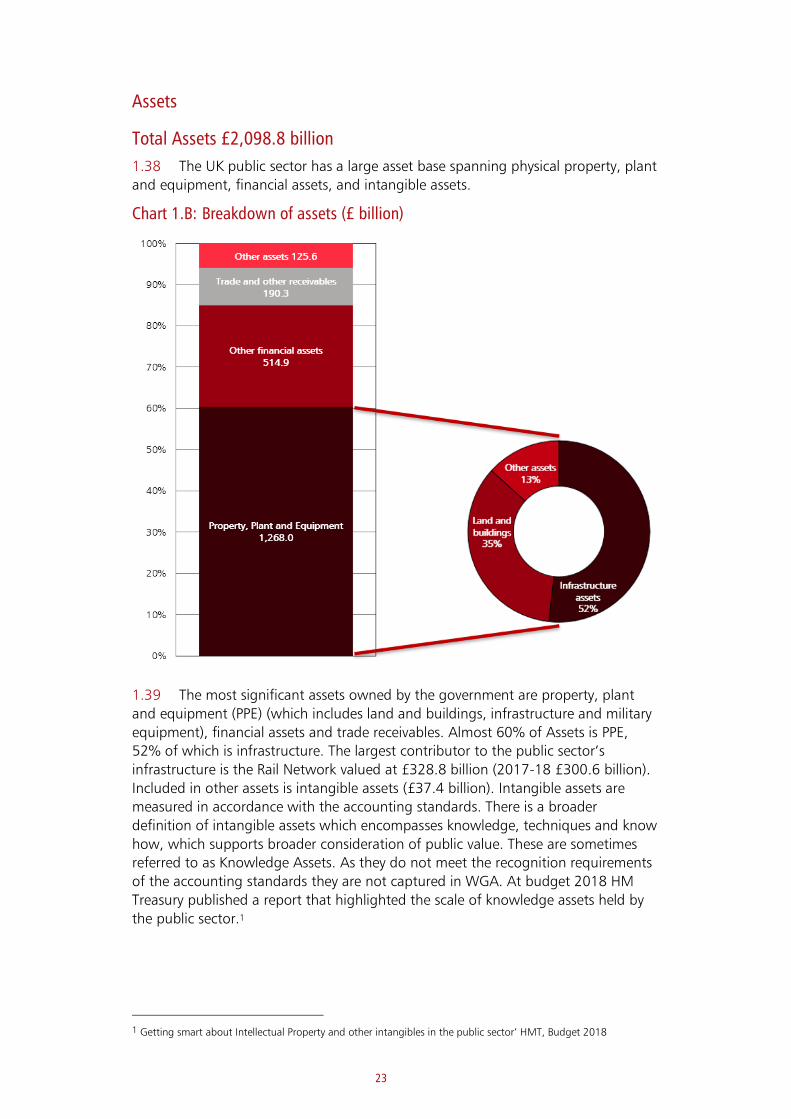
Total Assets £2,098.8 billion
1.38 The UK public sector has a large asset base spanning physical property, plant
and equipment, financial assets, and intangible assets.
Chart 1.B: Breakdown of assets (£ billion)
1.39 The most significant assets owned by the government are property, plant
and equipment (PPE) (which includes land and buildings, infrastructure and military
equipment), financial assets and trade receivables. Almost 60% of Assets is PPE,
52% of which is infrastructure. The largest contributor to the public sector’s
infrastructure is the Rail Network valued at £328.8 billion (2017-18 £300.6 billion).
Included in other assets is intangible assets (£37.4 billion). Intangible assets are
measured in accordance with the accounting standards. There is a broader
definition of intangible assets which encompasses knowledge, techniques and know
how, which supports broader consideration of public value. These are sometimes
referred to as Knowledge Assets. As they do not meet the recognition requirements
of the accounting standards they are not captured in WGA. At budget 2018 HM
Treasury published a report that highlighted the scale of knowledge assets held by
the public sector.1
1 Getting smart about Intellectual Property and other intangibles in the public sector’ HMT, Budget 2018
24
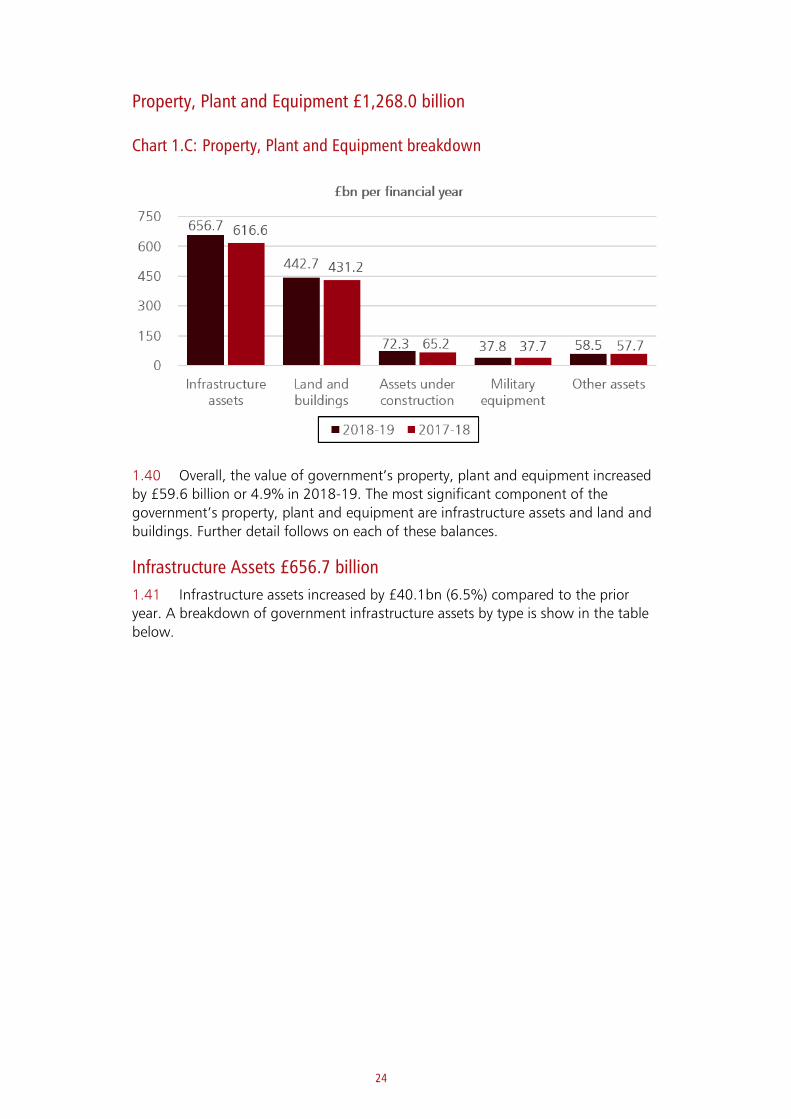
Property, Plant and Equipment £1,268.0 billion
Chart 1.C: Property, Plant and Equipment breakdown
1.40 Overall, the value of government’s property, plant and equipment increased
by £59.6 billion or 4.9% in 2018-19. The most significant component of the
government’s property, plant and equipment are infrastructure assets and land and
buildings. Further detail follows on each of these balances.
Infrastructure Assets £656.7 billion
1.41 Infrastructure assets increased by £40.1bn (6.5%) compared to the prior
year. A breakdown of government infrastructure assets by type is show in the table
below.
25
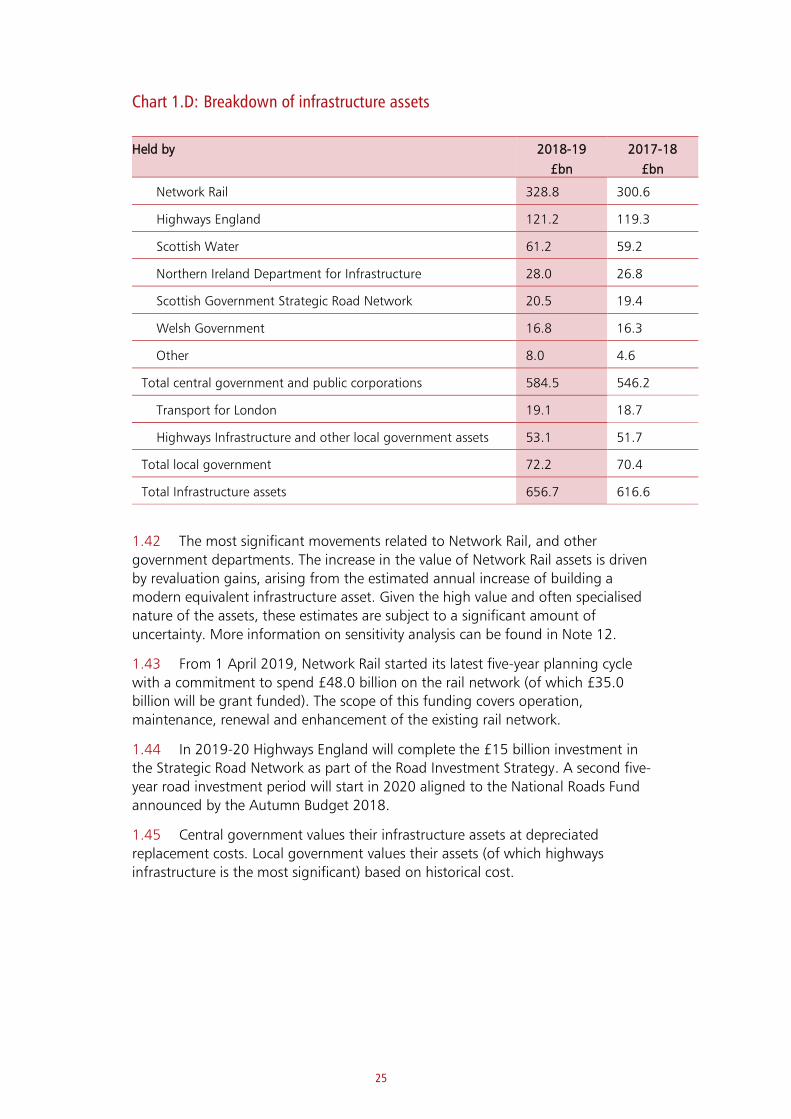
Chart 1.D: Breakdown of infrastructure assets
Held by 2018-19
£bn
2017-18
£bn
Network Rail 328.8 300.6
Highways England 121.2 119.3
Scottish Water 61.2 59.2
Northern Ireland Department for Infrastructure 28.0 26.8
Scottish Government Strategic Road Network 20.5 19.4
Welsh Government 16.8 16.3
Other 8.0 4.6
Total central government and public corporations 584.5 546.2
Transport for London 19.1 18.7
Highways Infrastructure and other local government assets 53.1 51.7
Total local government 72.2 70.4
Total Infrastructure assets 656.7 616.6
1.42 The most significant movements related to Network Rail, and other
government departments. The increase in the value of Network Rail assets is driven
by revaluation gains, arising from the estimated annual increase of building a
modern equivalent infrastructure asset. Given the high value and often specialised
nature of the assets, these estimates are subject to a significant amount of
uncertainty. More information on sensitivity analysis can be found in Note 12.
1.43 From 1 April 2019, Network Rail started its latest five-year planning cycle
with a commitment to spend £48.0 billion on the rail network (of which £35.0
billion will be grant funded). The scope of this funding covers operation,
maintenance, renewal and enhancement of the existing rail network.
1.44 In 2019-20 Highways England will complete the £15 billion investment in
the Strategic Road Network as part of the Road Investment Strategy. A second five-
year road investment period will start in 2020 aligned to the National Roads Fund
announced by the Autumn Budget 2018.
1.45 Central government values their infrastructure assets at depreciated
replacement costs. Local government values their assets (of which highways
infrastructure is the most significant) based on historical cost.
26
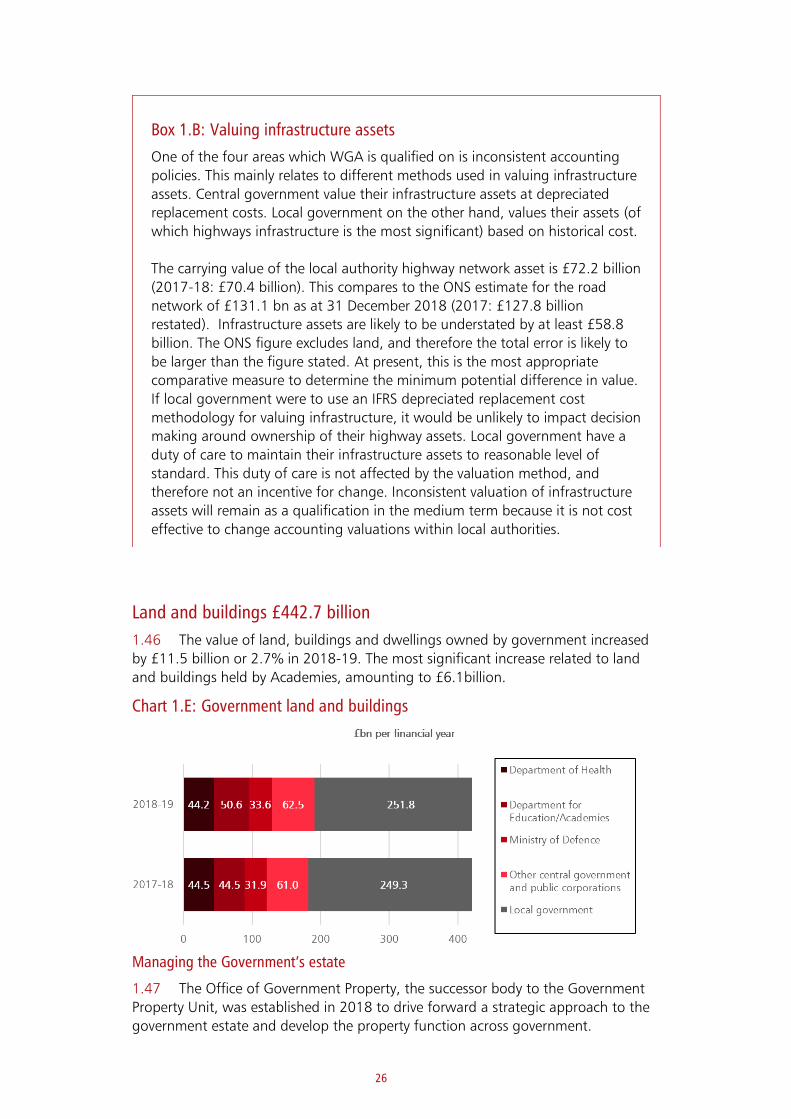
Land and buildings £442.7 billion
1.46 The value of land, buildings and dwellings owned by government increased
by £11.5 billion or 2.7% in 2018-19. The most significant increase related to land
and buildings held by Academies, amounting to £6.1billion.
Chart 1.E: Government land and buildings
Managing the Government’s estate
1.47 The Office of Government Property, the successor body to the Government
Property Unit, was established in 2018 to drive forward a strategic approach to the
government estate and develop the property function across government.
Box 1.B: Valuing infrastructure assets
One of the four areas which WGA is qualified on is inconsistent accounting
policies. This mainly relates to different methods used in valuing infrastructure
assets. Central government value their infrastructure assets at depreciated
replacement costs. Local government on the other hand, values their assets (of
which highways infrastructure is the most significant) based on historical cost.
The carrying value of the local authority highway network asset is £72.2 billion
(2017-18: £70.4 billion). This compares to the ONS estimate for the road
network of £131.1 bn as at 31 December 2018 (2017: £127.8 billion
restated). Infrastructure assets are likely to be understated by at least £58.8
billion. The ONS figure excludes land, and therefore the total error is likely to
be larger than the figure stated. At present, this is the most appropriate
comparative measure to determine the minimum potential difference in value.
If local government were to use an IFRS depreciated replacement cost
methodology for valuing infrastructure, it would be unlikely to impact decision
making around ownership of their highway assets. Local government have a
duty of care to maintain their infrastructure assets to reasonable level of
standard. This duty of care is not affected by the valuation method, and
therefore not an incentive for change. Inconsistent valuation of infrastructure
assets will remain as a qualification in the medium term because it is not cost
effective to change accounting valuations within local authorities.
27
Box 1.C: Office of Government Property
The Government Estate Strategya was published in July 2018 with the
ambition of elevating property to a strategic platform for the delivery of public services. It heralds a more commercial approach to central government property - including establishing the Government Property Agency (GPA) and establishing a programme to deliver a Digital National Asset Register. This will join, for the first time in one place, public sector property and land data with socioeconomic data. This will allow for improved strategic management of the government estate through a portfolio view of assets, and also enable better location decisions by linking estate with geographic, social and economic information. During the reporting period, the government progressed work towards a new framework for assessing the whole life cost of property – informing more effective decision-making through the whole life of our assets – from planning and design through to construction, operation and decommission. Developments to date have focused on common assessment tools, new standards and management practices. These will drive better value from the estate and make for a better user experience by ensuring investment decisions do not just consider construction/acquisition costs but take a longer-term view.
In this reporting period government raised £2.06 billion from disposal of 339b
sites. This brings the total raised since 2015 to £4.62 billion of surplus land and property from the disposal of 1,852 sites. The annual Transparency Report for 2018/19, detailing the sale of government land and property in the
reporting period, was published in February 2020.c
The annual State of the Estate report for the 2018/19 financial year was
published in February 2020.d The report demonstrated the continued
reduction, by 4%, in the size of the central civil estate and reported that carbon emissions have reduced across the estate by 46% compared to the 2009-10 baseline and paper consumption has dropped by 59%. The central estate is nearly a third smaller, and costs £1.6 billion less to run, than in 2010. The government continues to significantly outperform the private sector on three key performance metrics - space per person, cost per person and cost per m². In its first year of operation, since its launch on 1 April 2018, GPA took £195 million of general-purpose properties occupied by the Cabinet Office, Crown Commercial Service, and Department for Business, Energy and Industrial Strategy (BEIS) onto the GPA balance sheet along with their facilities management. The intention is to transfer all general-purpose assets to the GPA to enable optimum operation and management of this portfolio.
a https://www.gov.uk/government/publications/government-estate-strategy-2018
b The sale of the Network Rail Arches portfolio of 5,261 rental spaces is counted as one site.
c https://www.gov.uk/government/publications/sales-of-government-assets
d https://www.gov.uk/government/publications/state-of-the-estate-2018-2019

28
Other Financial Assets £514.9 billion
Chart 1.F: Breakdown of other financial assets
1.48 The government holds a range of financial assets. Some are held as part of
the government’s normal operations to manage cash and foreign exchange risks.
Other were acquired to support specific policy objectives. The largest balance in
loans and deposits is Term Funding Scheme loans, held by the Bank of England
(£121.4 billion). The largest balance in debt securities is held by the Exchange
Equalisation Account (£81.0 billion). The largest student loan balance is held by the
Department of Education (£67.9 billion). Further details on these significant
balances is included below.
Term Funding Scheme loans: £121.4 billion
1.49 Assets held under the Term Funding Scheme (TFS) decreased by £5.7 billion
as a result of loans maturing in 2018-19. The Term Funding Scheme (TFS) was
announced in August 2016, as part of a comprehensive package of easing measures
announced by the Monetary Policy Committee. The primary objective of the TFS was
to reinforce the pass through of the August 2016 cut in Bank Rate to the interest
rates faced by households and companies, allowing the reduction from 0.5% to
0.25% to have broadly the same impact as cuts made when rates were further from
zero.
1.50 The design of the TFS reflected this primary objective and it was calibrated so
that the reduction in Bank Rate could have a broadly neutral impact on lenders’
margins in aggregate. Under the TFS, participating banks and building societies
were able to borrow funds from the Bank of England at a rate close to Bank Rate for
up to four years. The TFS opened to drawdowns on 19 September 2016 and closed
on 28 February 2018, as envisaged when it was introduced, having made £127
billion of loans. In January 2019, the TFS loans held by the Bank of England Asset
Purchase Facility (BEAPFF) were transferred out of the BEAPFF account into the Bank
of England’s balance sheet.
1.51 Quantitative and qualitative evidence, including feedback from participants,
suggests that the primary objective of the TFS was achieved. Observations from the
period after the TFS was launched suggest that the reduction in Bank Rate was
29
passed through to lower lending rates on loans such as mortgages, without any
significant compression in lenders’ net interest margins, or in the supply of credit to
the economy. Moreover, it seems that the TFS has been effective in supporting
lending to the real economy – aggregate net lending by TFS participants increased
4.5% over the course of the scheme.
1.52 TFS loans makes up 20.2% of the Bank of England’s assets.
1.53 More information about TFS loans can be found in the Bank of England’s
annual report and accounts, in other documents on their website2.
Exchange Equalisation Account - Debt Securities: £81.0 billion
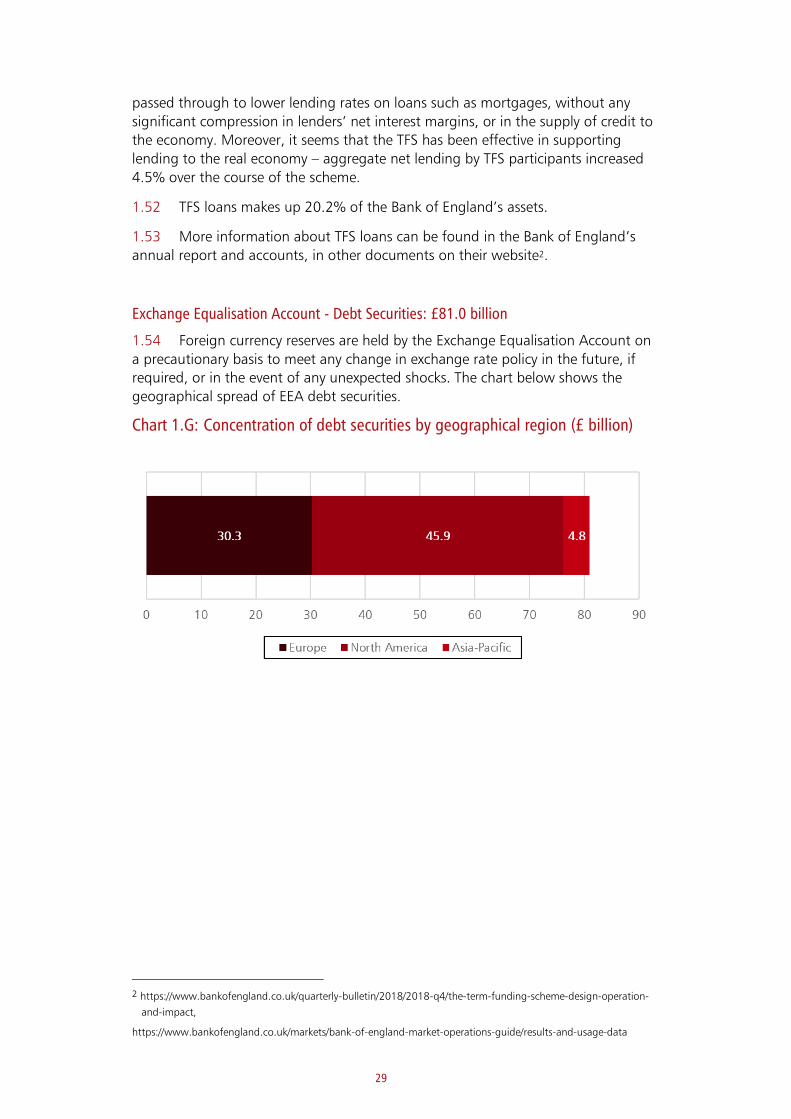
1.54 Foreign currency reserves are held by the Exchange Equalisation Account on
a precautionary basis to meet any change in exchange rate policy in the future, if
required, or in the event of any unexpected shocks. The chart below shows the
geographical spread of EEA debt securities.
Chart 1.G: Concentration of debt securities by geographical region (£ billion)
2 https://www.bankofengland.co.uk/quarterly-bulletin/2018/2018-q4/the-term-funding-scheme-design-operation-
and-impact,
https://www.bankofengland.co.uk/markets/bank-of-england-market-operations-guide/results-and-usage-data
30
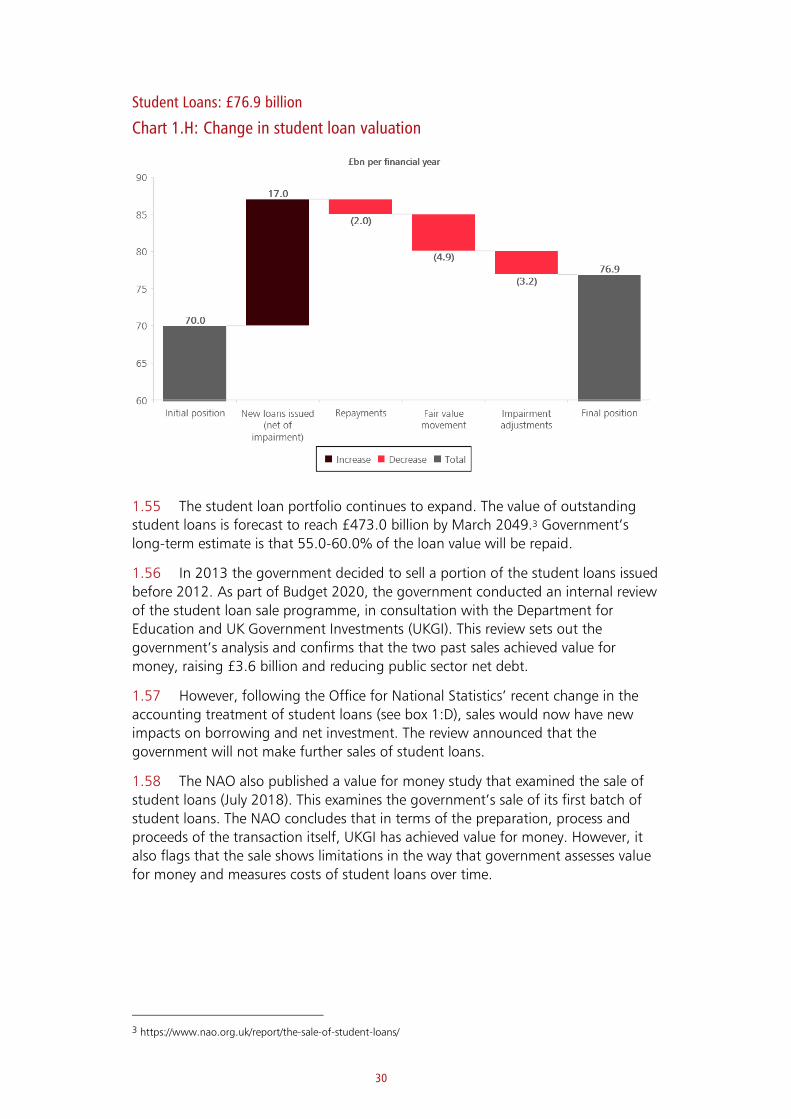
Student Loans: £76.9 billion
Chart 1.H: Change in student loan valuation
1.55 The student loan portfolio continues to expand. The value of outstanding
student loans is forecast to reach £473.0 billion by March 2049.3 Government’s
long-term estimate is that 55.0-60.0% of the loan value will be repaid.
1.56 In 2013 the government decided to sell a portion of the student loans issued
before 2012. As part of Budget 2020, the government conducted an internal review
of the student loan sale programme, in consultation with the Department for
Education and UK Government Investments (UKGI). This review sets out the
government’s analysis and confirms that the two past sales achieved value for
money, raising £3.6 billion and reducing public sector net debt.
1.57 However, following the Office for National Statistics’ recent change in the
accounting treatment of student loans (see box 1:D), sales would now have new
impacts on borrowing and net investment. The review announced that the
government will not make further sales of student loans.
1.58 The NAO also published a value for money study that examined the sale of
student loans (July 2018). This examines the government’s sale of its first batch of
student loans. The NAO concludes that in terms of the preparation, process and
proceeds of the transaction itself, UKGI has achieved value for money. However, it
also flags that the sale shows limitations in the way that government assesses value
for money and measures costs of student loans over time.
3 https://www.nao.org.uk/report/the-sale-of-student-loans/
31
Box 1.D: The impact of student loans on public sector net borrowing
Following the adoption of IFRS 9 Financial Instruments from April 2018,
Department for Education’s accounting for student loans has moved to fair
value through profit and loss. However, budgeting for student loans remains
based on amortised cost, and the Office for National Statistics (ONS) have
introduced a new statistical treatment for student loans in the National
Accounts and Public Sector Finances from September 2019.
In December 2018, following a review, the ONS decided that part of the initial
loan paid to students would be treated as government capital expenditure
and increase the deficit, and part would continue to be treated as government
lending. In addition, the ONS concluded that interest accrued on student
loans should only reduce the deficit if it was expected to be repaid.
The ONS implemented this change into the National Accounts and Public
Sector Finances in September 2019, and prior to that, the ONS published a
detailed methodological guide in June 2019, along with provisional estimates
of the impact on the fiscal aggregates.
The ONS has published the fiscal effect of the change in treatment for outturn
periods. For the 2018-19 financial year, compared to the previous treatment,
the change has increased Public Sector Net Borrowing (PSNB) by £12.4 billion:
£10.1 billion of this increase is from the new recording of capital expenditure,
affecting Public Sector Net Investment (PSNI) – including £1.5 billion relating
to the sale of student loans in that year – while the remaining £2.3 billion is
due to lower accrued interest receipts (which increases the Public Sector
Current Budget Deficit).
Liabilities
Total liabilities £4,554.6 billion
1.59 Government holds a series of significant liabilities: government borrowing,
public sector pension liabilities, other financial liabilities, payables and provisions.
Below is a summary of significant liabilities on the government’s balance sheet.

32
Summary of liabilities
Liability Due within one year
£bn
Due after one year
£bn
Deposits by banks 554.0 2.8 Deposits by banks are mostly deposits by commercial
banks with the Bank of England and are repayable on
demand. These fluctuate depending on the underlying
business activity of those financial institutions.
Bank notes in
circulation
74.2 - There is a constant need to have a supply of cash in the
economy. Whilst this liability is repayable on demand, it
can be considered to not have a maturity, although its
value will fluctuate over time depending on the value of
notes in circulation.
Gilts 59.9 1,100.0 Gilts are the main form of government borrowing. This
will drive the governments’ need to access the bond
market to fund borrowing. At the end of 2018-19, the
average time to maturity of gilts is 15.9 years, the longest
maturity gilt in issue is due to redeem in the 2071-72
fiscal year, and the main bulk of gilts are due for
redemption before 2040.
Nuclear
decommissioning
provision
3.1 149.1 The nuclear decommissioning provision reflects works to
decommission nuclear sites which are not expected to be
fully completed until 2137. The length of time, and
complexity of the materials involved, results in
uncertainty in cost estimates in later years.
Clinical negligence 2.9 82.4 Clinical negligence payments are dependent on the
outcome of legal processes. Claims for seriously injured
patients are usually paid as a lump sum up front and
annual payments for the rest of the claimant’s life. This
means some elements of the liability will last several
decades.
Public sector
pensions
- 1,893.9 The OBR produces projections for public sector pensions
up to 2067-68. Given the nature of the liability, pay-outs
will be made for many decades to come.
Other liabilities 416.2 216.1 Short-term liabilities range from trade and other
payables, to Treasury bills and IMF Special Drawings
Rights. Figures can fluctuate depending on the
underlying business activity. Long-term liabilities range
from PFI contracts ending in 2049-50, to Pension
Protection Fund provisions estimated to 2094, to
obligations under finance leases with varying terms,
including one held by the Ministry of Defence for homes
for service personnel which ends in 174 years
1,110.3 3,444.3

33
1.60 The following sections provide more detail on some of the government’s
most substantial liabilities. These are:
• deposits by banks
• government borrowings
• provisions
• public sector pensions
1.61 No liabilities are recognised in the 2018-19 WGA for COVID-19 support
measures to individuals and businesses.
Deposits by banks £556.8 billion
1.62 Deposits by banks mainly comprise reserves accounts held at the Bank of
England. This is a decrease of £1.3 billion from £558.1 billion in 2017-18. Reserves
accounts are sterling current accounts for banks and building societies. They are the
most liquid asset a bank or building society can hold and are the ultimate means of
settlement between banks and building societies.
1.63 The rate paid by the Bank on reserves account balances is also the means by
which the Bank keeps market interest rates in line with Bank Rate. All reserves
balances are remunerated at Bank Rate.
1.64 Chart 1.I below shows how deposits by banks have increased steadily over
the last 15 years. During the last 15 years, the Bank of England have used new
monetary policy tools, such as Quantitative Easing (QE) and the Term Funding
Scheme, to boost spending and investment in the economy and help the
independent Monetary Policy Committee meet its inflation target. These policies are
funded by creating additional central bank reserves, which increases deposits by
commercial banks at the Bank of England. Policies which create central bank
reserves have been used multiple times since 2008, notably there have been rounds
of QE in 2009, 2012, 2016 and 2020, which have led to the continued sharp
increase in deposits by banks over the last 12 years.
1.65 In the case of QE, the basic mechanics involve the central bank creating
money by extending a loan to the Bank of England Asset Purchase Facility (BEAPFF).
The BEAPFF uses this money to buy gilts and high quality corporate bonds from the
private sector which results in a rise in central banks reserves held by commercial
banks.

34
Chart 1.I: Deposit by banks at Bank of England over the last 15 years (£ billion)
Source: Bank of England
Government borrowing £1,407.2 billion
Chart 1.J: Government borrowing over time
1.66 Government borrowing is achieved through the issuance of gilts and
Treasury bills. The total nominal value of central government wholesale debt
(excluding government holdings) as at 31 March 2019 was £1,407.2 billion, up
from £1,347.4 billion as at 31 March 2018.
1.67 When setting a strategy for government borrowing, a number of risks are
taken into account. These include interest rate risks, refinancing risk, inflation risk,
liquidity risk and execution risk. Maintaining the relatively long average maturity of
government debt was part of an expressed objective to mitigate refinancing risk.
35
Details of the government’s debt management strategy and financing plans are set
out in the Debt management report.4
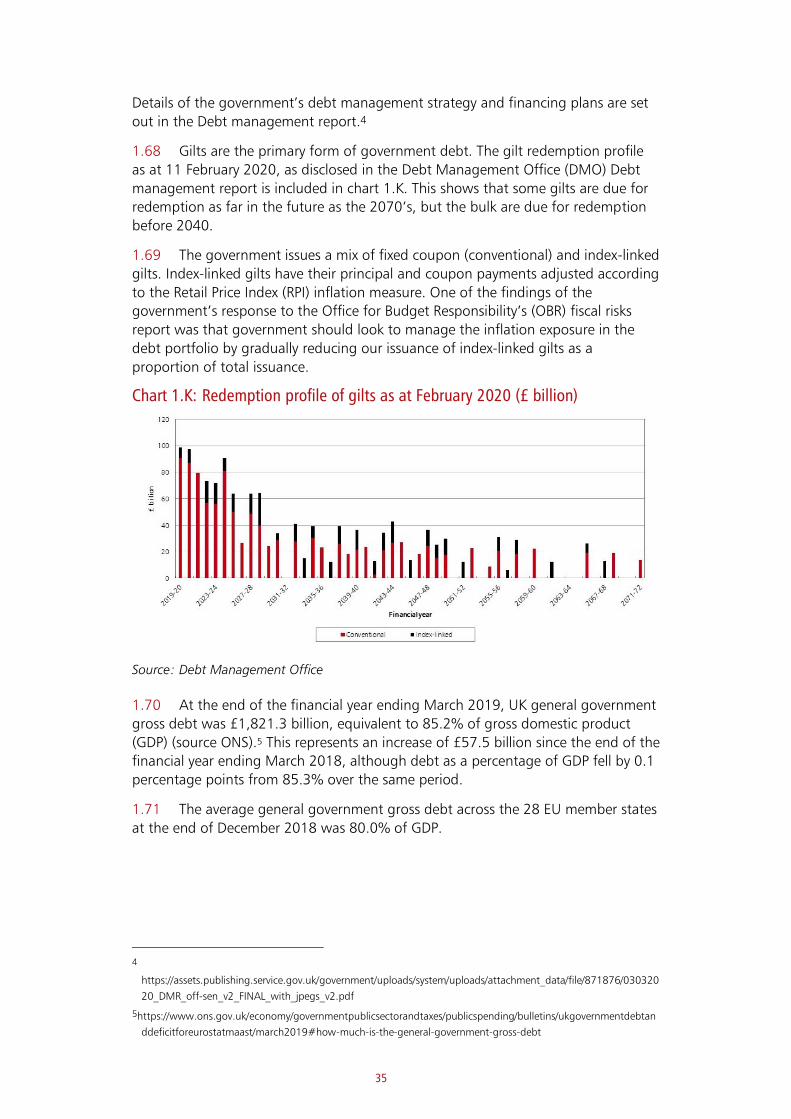
1.68 Gilts are the primary form of government debt. The gilt redemption profile
as at 11 February 2020, as disclosed in the Debt Management Office (DMO) Debt
management report is included in chart 1.K. This shows that some gilts are due for
redemption as far in the future as the 2070’s, but the bulk are due for redemption
before 2040.
1.69 The government issues a mix of fixed coupon (conventional) and index-linked
gilts. Index-linked gilts have their principal and coupon payments adjusted according
to the Retail Price Index (RPI) inflation measure. One of the findings of the
government’s response to the Office for Budget Responsibility’s (OBR) fiscal risks
report was that government should look to manage the inflation exposure in the
debt portfolio by gradually reducing our issuance of index-linked gilts as a
proportion of total issuance.
Chart 1.K: Redemption profile of gilts as at February 2020 (£ billion)
Source: Debt Management Office
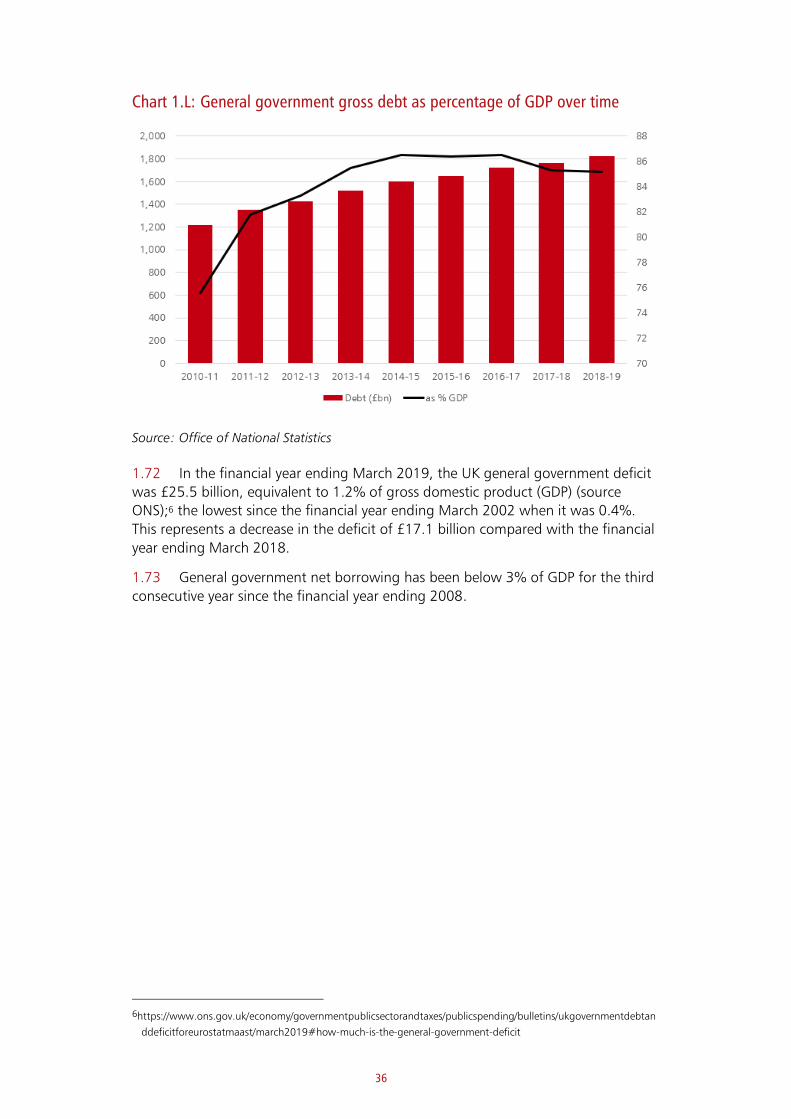
1.70 At the end of the financial year ending March 2019, UK general government
gross debt was £1,821.3 billion, equivalent to 85.2% of gross domestic product
(GDP) (source ONS).5 This represents an increase of £57.5 billion since the end of the
financial year ending March 2018, although debt as a percentage of GDP fell by 0.1
percentage points from 85.3% over the same period.
1.71 The average general government gross debt across the 28 EU member states
at the end of December 2018 was 80.0% of GDP.
4
https://assets.publishing.service.gov.uk/government/uploads/system/uploads/attachment_data/file/871876/030320
20_DMR_off-sen_v2_FINAL_with_jpegs_v2.pdf
5https://www.ons.gov.uk/economy/governmentpublicsectorandtaxes/publicspending/bulletins/ukgovernmentdebtan
ddeficitforeurostatmaast/march2019#how-much-is-the-general-government-gross-debt
36
Chart 1.L: General government gross debt as percentage of GDP over time
Source: Office of National Statistics
1.72 In the financial year ending March 2019, the UK general government deficit
was £25.5 billion, equivalent to 1.2% of gross domestic product (GDP) (source
ONS);6 the lowest since the financial year ending March 2002 when it was 0.4%.
This represents a decrease in the deficit of £17.1 billion compared with the financial
year ending March 2018.
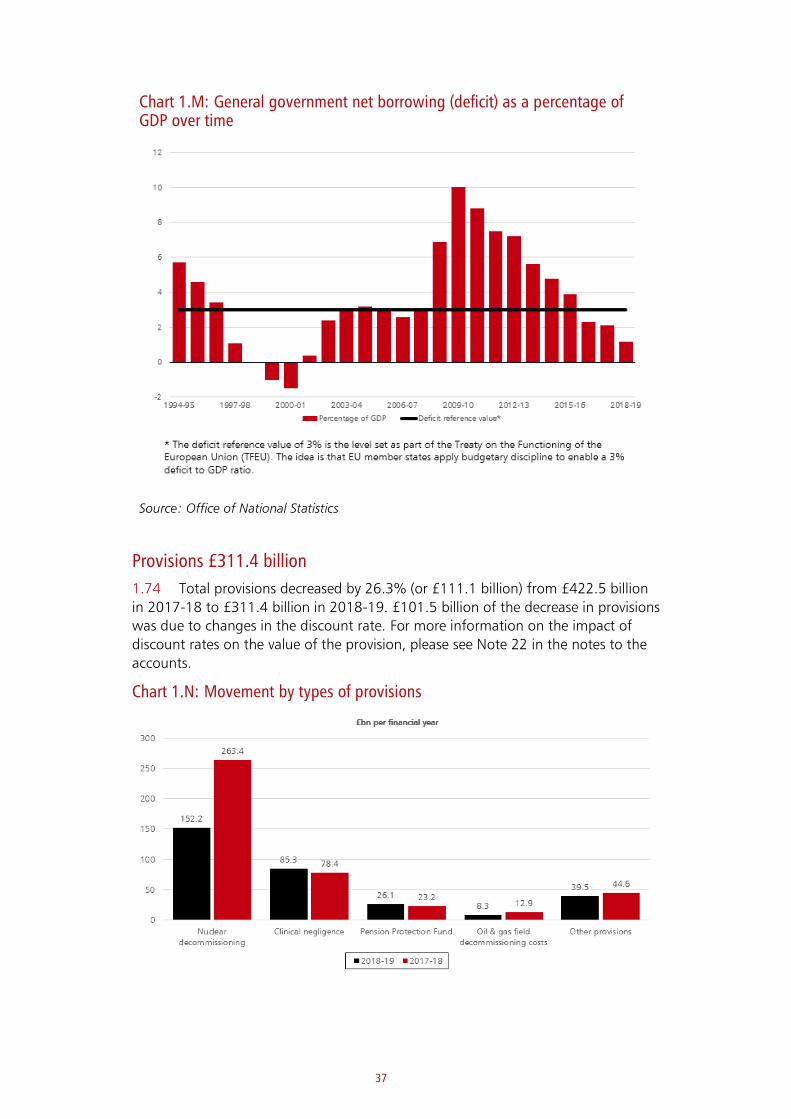
1.73 General government net borrowing has been below 3% of GDP for the third
consecutive year since the financial year ending 2008.
6https://www.ons.gov.uk/economy/governmentpublicsectorandtaxes/publicspending/bulletins/ukgovernmentdebtan
ddeficitforeurostatmaast/march2019#how-much-is-the-general-government-deficit
37
Chart 1.M: General government net borrowing (deficit) as a percentage of GDP over time
Source: Office of National Statistics
Provisions £311.4 billion
1.74 Total provisions decreased by 26.3% (or £111.1 billion) from £422.5 billion
in 2017-18 to £311.4 billion in 2018-19. £101.5 billion of the decrease in provisions
was due to changes in the discount rate. For more information on the impact of
discount rates on the value of the provision, please see Note 22 in the notes to the
accounts.
Chart 1.N: Movement by types of provisions
38
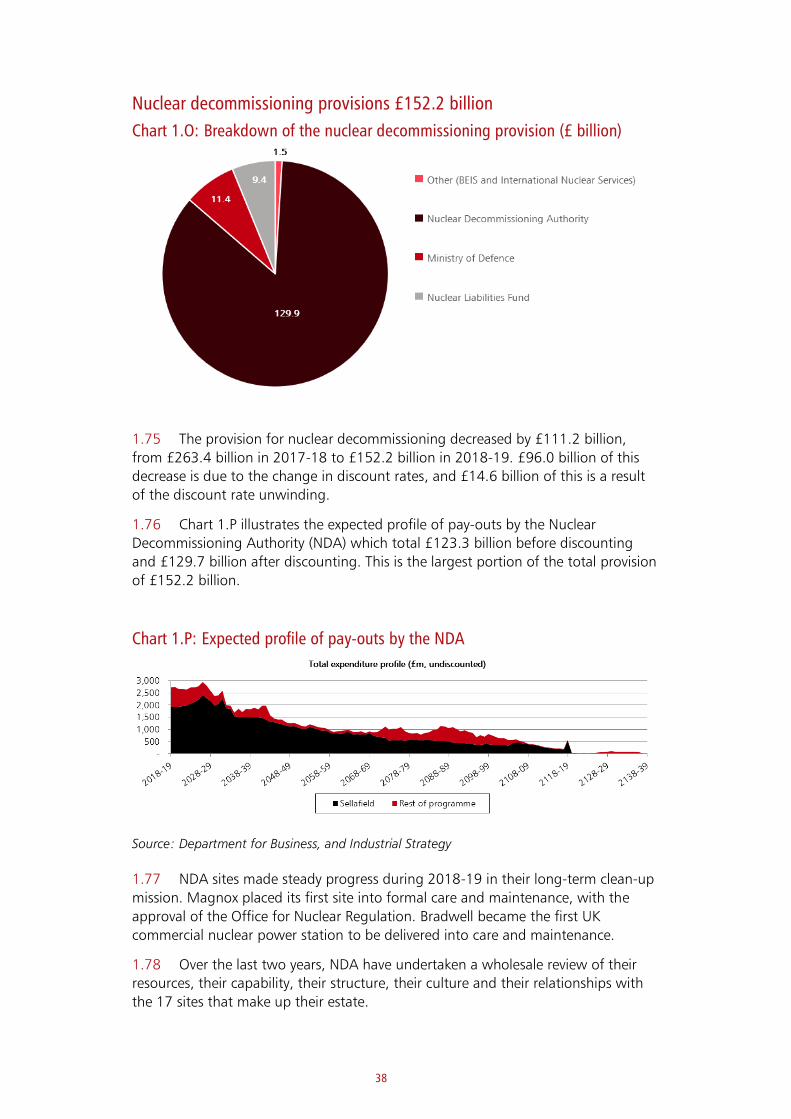
Nuclear decommissioning provisions £152.2 billion
Chart 1.O: Breakdown of the nuclear decommissioning provision (£ billion)
1.75 The provision for nuclear decommissioning decreased by £111.2 billion,
from £263.4 billion in 2017-18 to £152.2 billion in 2018-19. £96.0 billion of this
decrease is due to the change in discount rates, and £14.6 billion of this is a result
of the discount rate unwinding.
1.76 Chart 1.P illustrates the expected profile of pay-outs by the Nuclear
Decommissioning Authority (NDA) which total £123.3 billion before discounting
and £129.7 billion after discounting. This is the largest portion of the total provision
of £152.2 billion.
Chart 1.P: Expected profile of pay-outs by the NDA
Source: Department for Business, and Industrial Strategy
1.77 NDA sites made steady progress during 2018-19 in their long-term clean-up
mission. Magnox placed its first site into formal care and maintenance, with the
approval of the Office for Nuclear Regulation. Bradwell became the first UK
commercial nuclear power station to be delivered into care and maintenance.
1.78 Over the last two years, NDA have undertaken a wholesale review of their
resources, their capability, their structure, their culture and their relationships with
the 17 sites that make up their estate.
39
1.79 The NDA has identified the steps that they need to take to deliver their
mission of releasing their sites for other uses. Two of their strategic outcomes have
been achieved and good progress is being made with the safe management of
nuclear inventory and reduction of its risks. More strategic outcomes will be
achieved with the closure of the reprocessing facilities and the building of new
modern treatment and storage facilities to manage nuclear material and waste.
Clinical negligence provision £85.3 bn
1.80 The Department of Health and Social Care provides for future costs in a
number of cases where it is the defendant in legal proceedings brought by claimants
seeking damages for the effects of alleged clinical negligence.
1.81 The provision for clinical negligence claims increased by £6.9 billion or 8.8%
in 2018-19, from £78.4 billion to £85.3 billion. The increase in provision is a result
of an increase in expected future pay-outs, offset partially by pay-outs made in year,
and provisions not required being written back. In addition to the clinical negligence
provision, £50.8 billion (2017-18: £47.3 billion) is included as a contingent liability
for clinical negligence.
1.82 NHS Resolution makes a provision in its accounts for the likely value of future
claims payments, and records contingent liabilities that represent possible additional
claims payments to those already provided for. More information on contingent
liabilities is included in Notes 29 and 30 to the accounts.
1.83 Most the UK government’s clinical negligence claims are managed by NHS
Resolution, who handle both clinical and non-clinical claims relating to the NHS in
England. In 2018-19, they received 10,678 new clinical negligence claims,
compared to 10,673 in 2017-18, a relatively flat profile with an increase of five
claims (0.08%). The number of new non-clinical claims, typically employers’ and
public liability claims, rose from 3,570 received in 2017-18 to 3,585 in 2018-19, an
increase of 0.42%. Further information on claims can be found on Page 17 of NHS
Resolution 2018-19 account.
1.84 The drivers of claim costs are a combination of the number of claims
received, the amount of compensation paid for those claims and the legal costs
Box 1.E: Nuclear Sector Deal
A sector deal between government and the nuclear industry was published by
the Department for Business, Energy and Industrial Strategy in June 2018.a
This sector deal builds on the government’s historical partnership with the UK
nuclear sector.
It ensures that the UK’s nuclear sector remains cost competitive with other
forms of low-carbon technologies to support the governments Clean Growth
Strategy and Grand Challenge. Through adopting new construction
techniques and innovative approaches to manufacturing, the deal will reduce
the costs of building new reactors in a way that builds domestic supply chain
capability and skills.
a https://www.gov.uk/government/publications/nuclear-sector-deal
40
which are attached to them. Furthermore, discount rates can have a significant
effect on these costs.
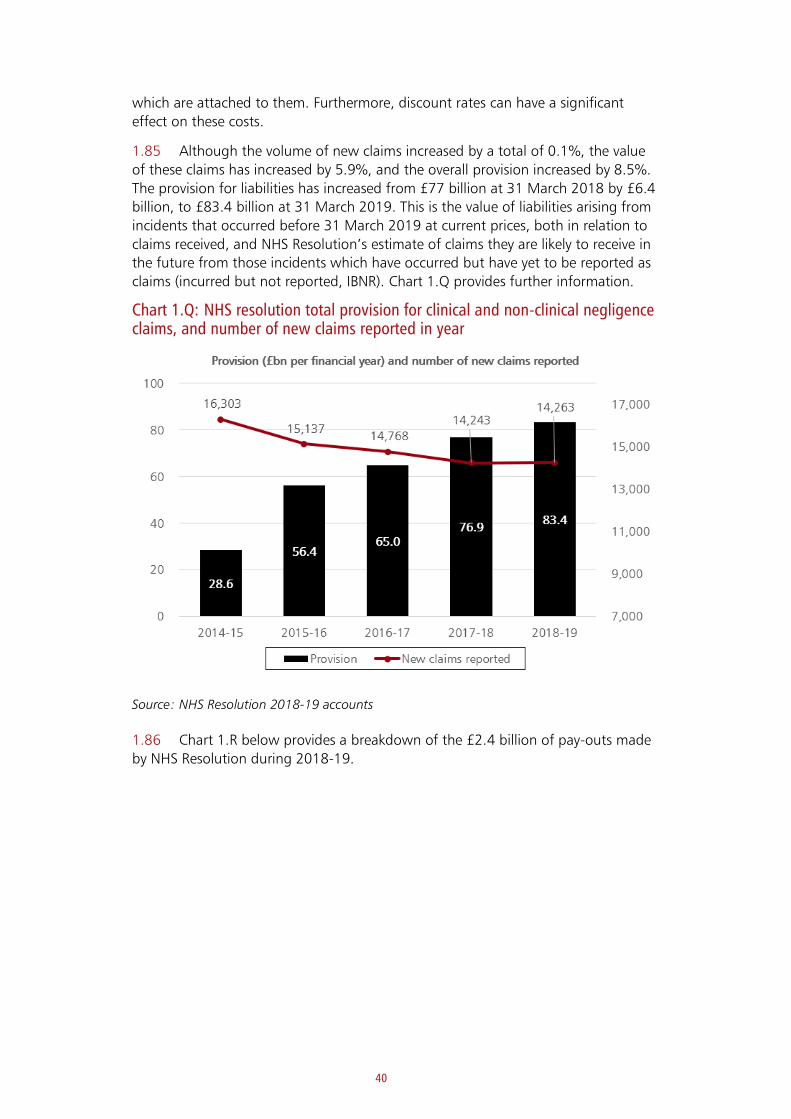
1.85 Although the volume of new claims increased by a total of 0.1%, the value
of these claims has increased by 5.9%, and the overall provision increased by 8.5%.
The provision for liabilities has increased from £77 billion at 31 March 2018 by £6.4
billion, to £83.4 billion at 31 March 2019. This is the value of liabilities arising from
incidents that occurred before 31 March 2019 at current prices, both in relation to
claims received, and NHS Resolution’s estimate of claims they are likely to receive in
the future from those incidents which have occurred but have yet to be reported as
claims (incurred but not reported, IBNR). Chart 1.Q provides further information.
Chart 1.Q: NHS resolution total provision for clinical and non-clinical negligence claims, and number of new claims reported in year
Source: NHS Resolution 2018-19 accounts
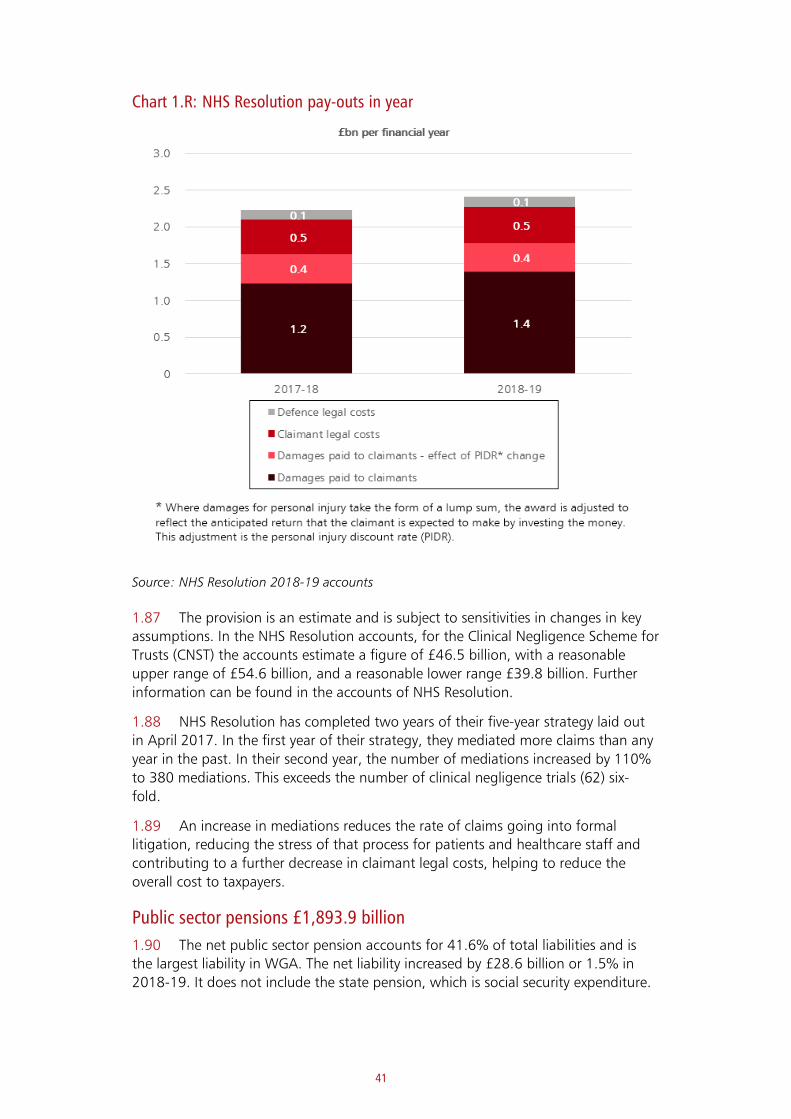
1.86 Chart 1.R below provides a breakdown of the £2.4 billion of pay-outs made
by NHS Resolution during 2018-19.
41
Chart 1.R: NHS Resolution pay-outs in year
Source: NHS Resolution 2018-19 accounts
1.87 The provision is an estimate and is subject to sensitivities in changes in key
assumptions. In the NHS Resolution accounts, for the Clinical Negligence Scheme for
Trusts (CNST) the accounts estimate a figure of £46.5 billion, with a reasonable
upper range of £54.6 billion, and a reasonable lower range £39.8 billion. Further
information can be found in the accounts of NHS Resolution.
1.88 NHS Resolution has completed two years of their five-year strategy laid out
in April 2017. In the first year of their strategy, they mediated more claims than any
year in the past. In their second year, the number of mediations increased by 110%
to 380 mediations. This exceeds the number of clinical negligence trials (62) six-
fold.
1.89 An increase in mediations reduces the rate of claims going into formal
litigation, reducing the stress of that process for patients and healthcare staff and
contributing to a further decrease in claimant legal costs, helping to reduce the
overall cost to taxpayers.
Public sector pensions £1,893.9 billion
1.90 The net public sector pension accounts for 41.6% of total liabilities and is
the largest liability in WGA. The net liability increased by £28.6 billion or 1.5% in
2018-19. It does not include the state pension, which is social security expenditure.
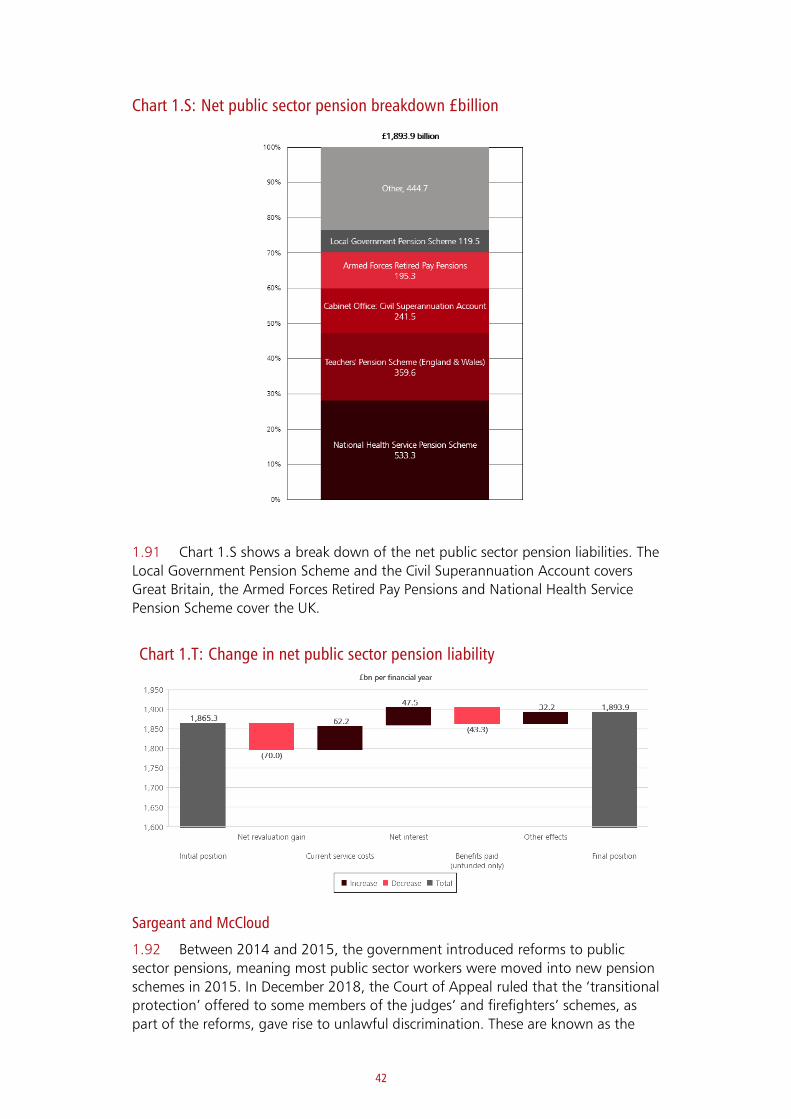
42
1.91 Chart 1.S shows a break down of the net public sector pension liabilities. The
Local Government Pension Scheme and the Civil Superannuation Account covers
Great Britain, the Armed Forces Retired Pay Pensions and National Health Service
Pension Scheme cover the UK.
Chart 1.T: Change in net public sector pension liability
Sargeant and McCloud
1.92 Between 2014 and 2015, the government introduced reforms to public
sector pensions, meaning most public sector workers were moved into new pension
schemes in 2015. In December 2018, the Court of Appeal ruled that the ‘transitional
protection’ offered to some members of the judges’ and firefighters’ schemes, as
part of the reforms, gave rise to unlawful discrimination. These are known as the
Chart 1.S: Net public sector pension breakdown £billion

43
McCloud and Sargeant cases. On 27 June 2019, the Supreme Court rejected the
government’s appeal on this judgment.
1.93 On 15 July 2019 the Chief Secretary to the Treasury made a written
ministerial statement confirming that, as ‘transitional protection’ was offered to
members of all the main public service pension schemes, the difference in treatment
will need to be removed across all those schemes for members with relevant service.
1.94 All of the main public service pension schemes are therefore impacted by the
McCloud and Sargeant cases. This has increased their accounting liabilities with past
service costs totalling £31.8 billion in 2018-19 (2017-18: £1.3 billion). These
increases are estimates of extra liabilities from expected changes to benefits as a
result of removing the transitional protection. Any differences between the assumed
and final remedy across public service pension schemes could lead to further past
service costs in later accounts. As with other liabilities, costs associated with this
remedy will vary in accounts as assumptions change.
The largest public service pension schemes
1.95 Four single unfunded pension schemes make up 70.2% of the pension
liability. These are: the National Health Service Pension Scheme (NHSPS), Teachers’
Pension Scheme (TPS) (England & Wales), Cabinet Office Civil Superannuation
(PCSPS), and Armed Forces Pension Scheme (AFPS).
Snapshot of the four biggest pension schemes
* Due to the complexity of some of the schemes, individual members may be a member of more than one scheme, and therefore double counted. An active member is defined as an individual who is in pensionable service and where the employer has not provided a withdrawal indicator.
1.96 The four main schemes’ financial management arrangements conform to the
requirements of HM Treasury as laid out in “Managing Public Money”. Pensions in
payment and deferment are increased based on the change in the Consumer Price
Index (CPI) in the 12 months to the end of the preceding September. As CPI at
September 2017 was 3%, there was a 3% increase to these pensions in April 2018.
1.97 These four schemes are unfunded, defined benefit occupational pension
schemes. The pay-as-you-go nature of these schemes means that pension
contributions of employees and employers are used to offset payments to current
pensioners.

44
1.98 The income received in the NHS Pension Scheme currently exceeds payments
made by the scheme, so the balance of surplus cash is returned to HM Treasury
under arrangements governed by the legislation.
1.99 The income in the Principal Civil Service Pension Scheme (PCSPS), Teachers’
Pension Scheme (TPS) and the Armed Forces Pension Scheme (AFPS) is insufficient to
pay all pensions in payment. The balance of funding is provided by Parliament.
Chart 1.U: Pension liabilities over time
1.100 The balance sheet value of public sector pensions can vary significantly over
time. Much of this change is due to changes in assumptions. These include
demographic assumptions, such as life expectancy, used by actuaries to estimate the
amount that will eventually be paid out in pensions. Another factor is the discount
rate used to convert those future payments into a liability at the reporting date.
Discount rate
1.101 Each year, revisions are made to the discount rate used to calculate the
public sector pension liability for accounting purposes. This rate is based on the
market yield of corporate bonds net of the consumer price index (CPI). The discount
rate for central government schemes is set by HM Treasury each year.
1.102 The discount rate generally has a significant impact on the liability because
many of the benefit payments that the schemes expect to make fall decades into the
future, and so a small change in the per annum discount rate has a large impact on
the liability.
1.103 Chart 1.V illustrates how the trend in this net discount rate compares with
the trend in the public sector pension scheme liability over recent years. In 2018-19,
there was an increase to the central government net discount rate, from 0.1% to
0.29%. This alone would be expected to cause a gain on revaluation to the pension
liability of around £75 billion. The actual revaluation gain from changes in
assumptions of £56.0 billion also includes the impact of other actuarial
assumptions, as summarised below.
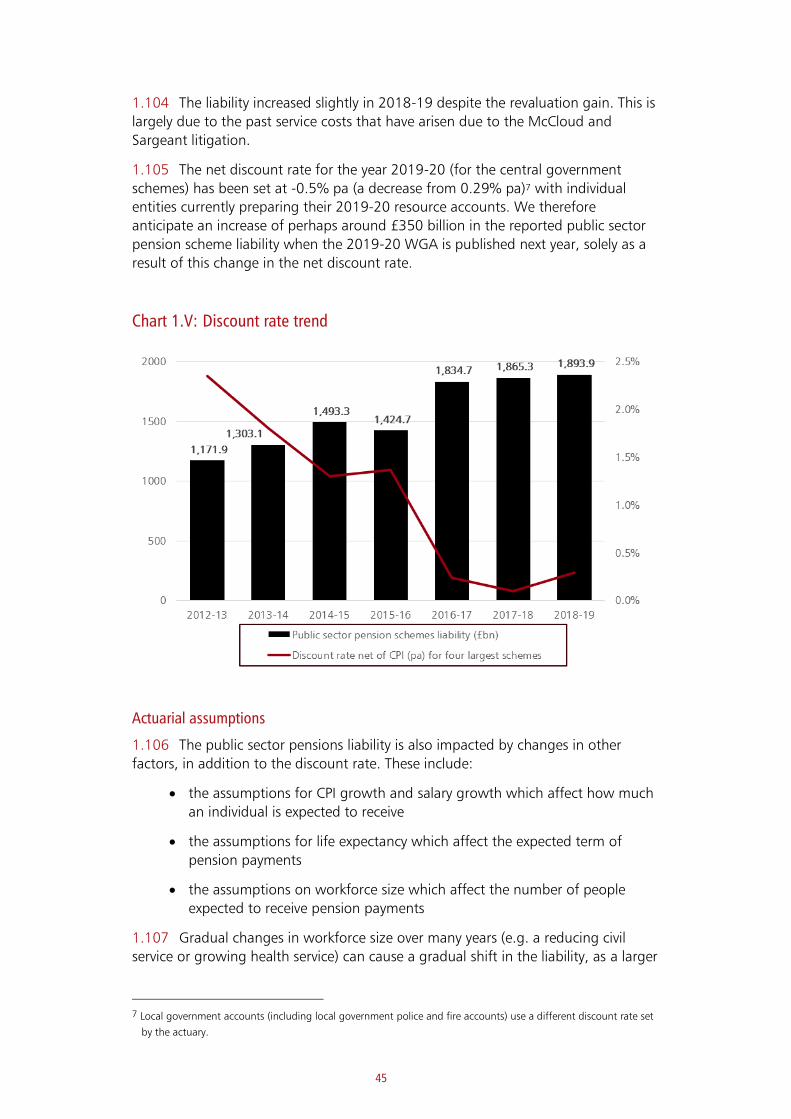
45
1.104 The liability increased slightly in 2018-19 despite the revaluation gain. This is
largely due to the past service costs that have arisen due to the McCloud and
Sargeant litigation.
1.105 The net discount rate for the year 2019-20 (for the central government
schemes) has been set at -0.5% pa (a decrease from 0.29% pa)7 with individual
entities currently preparing their 2019-20 resource accounts. We therefore
anticipate an increase of perhaps around £350 billion in the reported public sector
pension scheme liability when the 2019-20 WGA is published next year, solely as a
result of this change in the net discount rate.
Chart 1.V: Discount rate trend
Actuarial assumptions
1.106 The public sector pensions liability is also impacted by changes in other
factors, in addition to the discount rate. These include:
• the assumptions for CPI growth and salary growth which affect how much
an individual is expected to receive
• the assumptions for life expectancy which affect the expected term of
pension payments
• the assumptions on workforce size which affect the number of people
expected to receive pension payments
1.107 Gradual changes in workforce size over many years (e.g. a reducing civil
service or growing health service) can cause a gradual shift in the liability, as a larger
7 Local government accounts (including local government police and fire accounts) use a different discount rate set
by the actuary.
46
or smaller value is added to the liability annually to reflect the pension promised to
the workforce for their service that year.
1.108 Step changes in the liability can occur when key assumptions or data are
updated, such as the ONS publication of population projections which are used to
set life expectancy assumptions. Some schemes, including the four largest public
sector pension schemes, moved from using ONS 2014 life expectancy assumptions
to ONS 2016 assumptions in 2017-18. The ONS 2016 projections assume lower
future life expectancy, compared to the ONS 2014 projections. This change was
largely driven by higher observed mortality over 2014 to 2016 than was expected in
the previous assumptions.
Affordability of public sector pensions
1.109 Changes to the discount rate net of CPI drive changes in the public sector
pension liability, but do not affect the future benefits payable. Due to this, the
government focuses on other measures to assess the affordability of the public
sector pension schemes and manage the associated fiscal risks.
1.110 For example, when monitoring the fiscal implications of the schemes, the
government considers the OBR’s long-term projections of public sector pension
scheme expenditure, as published in their Fiscal Sustainability Reports. These look at
the future expected pension cash flows as a percentage of GDP. The next Fiscal
sustainability report is due to be published on 14 July. This report will incorporate
the impact of the coronavirus.
Box 1.F: How are public sector pension liabilities treated in the National Accounts?
WGA recognises future pension liabilities when the rights accrue to
employees, even though payment is not yet due. The National Accounts only
recognises expenditure as it is paid out to retirees and does not recognise a
future liability. The expenditure recognised in National Accounts is reduced by
the amount received through employer and employee contributions.
47
Box 1.G: Actuarial Valuations
Some figures in the WGA are calculated using actuarial techniques. The most
significant of these are pensions liabilities and some of the provisions such as
clinical negligence.
What is an actuarial valuation?
An actuarial valuation is the calculation of any amount where assumptions
need to be made about what will happen in the future. Very often, this
involves payments that are expected to be made several years in the future,
where there is uncertainty in the amount or timing of the payments. Each
future payment is estimated, discounted to the valuation date and added
together.
Setting assumptions
Assumptions are needed if the timing or amount of future payments is
uncertain. Some examples of assumptions in valuations include:
• life expectancy, retirement age and salary growth of pension scheme
members
• average cost and inflation of clinical negligence claims
• timing of construction of nuclear decommissioning sites
Assumptions can be set based on the past experience of the entity being
valued if the administrative data held is recorded accurately and if the dataset
is large enough to make statistically robust conclusions. Many of the public
service pension schemes hold data that can be used to set assumptions.
Assumptions should also allow for trends in the experience and known future
changes in, for instance, pension scheme rules.
Different assumptions may be appropriate for valuations with different
purposes, such as to set employer contribution rates or to specify liabilities in
accounts for a pension scheme.
Data
The calculation of the liability will usually start from administrative data held.
For instance, a pension scheme valuation will use the rates of pensions
currently in payment, the amount of pensions accrued but not yet in payment
and the salaries of current employees. If there are uncertainties about this
data, then assumptions are made about the data before it is used in
calculations.

48
Report on Income and Expenditure 1.111 Over the last 5 years the net expenditure on public services shown by the
black line in chart 1.W, has reduced by 38.5% (£35.2 billion). The most significant
fall in net expenditure for public services was in 2015-16, where a 5.2% increase in
income was accompanied by a 1.2% fall in total expenditure on public services. In
2015-16, the main driver of the fall in public service expenditure was a 64.6%
(£16.8 billion) decrease in the “increase in provisions” on the SOCNE.
1.112 Conversely, total net expenditure for the year (red line) fluctuates radically
from year to year. This is because of provision financing costs which include the
impact of changes in discount rates used for provisions. In 2016-17 this was £9.3
billion, increasing to £93.4 billion in 2017-18, and decreasing to -£-115.8 billion
in 2018-19. More information can be found in note 11 of the financial accounts.
Box 1.H: COVID-19 update- impact on public finances May 2020
Box 1.A looked at the impact of COVID-19 on assets and liabilities. This
section focuses on the impact of COVID-19 on income and expenditure.
In May 2020, HMRC cash receipts fell by 43% (£19.4 billion) on a year earlier.
VAT accounted for the bulk of the deterioration as the Government’s VAT
deferral scheme left VAT receipts negative in May (-£0.6 billion). Income tax,
corporation tax and fuel duties also saw sharp falls on a year earlier.a
Central government spending was up 48% (£30.6 billion) in May compared to
the same period last year. Across April and May spending is up £65.8 billion
on last year. reflecting the impact of the coronavirus job retention scheme
(CJRS), additional grants to local authorities and higher public services
spending, much of which was COVID-19 related (including NHS spending).
At this stage of the year, even in normal circumstances, expenditure data are
highly provisional and subject to revision.
Chart 1.W: Income and Expenditure trends
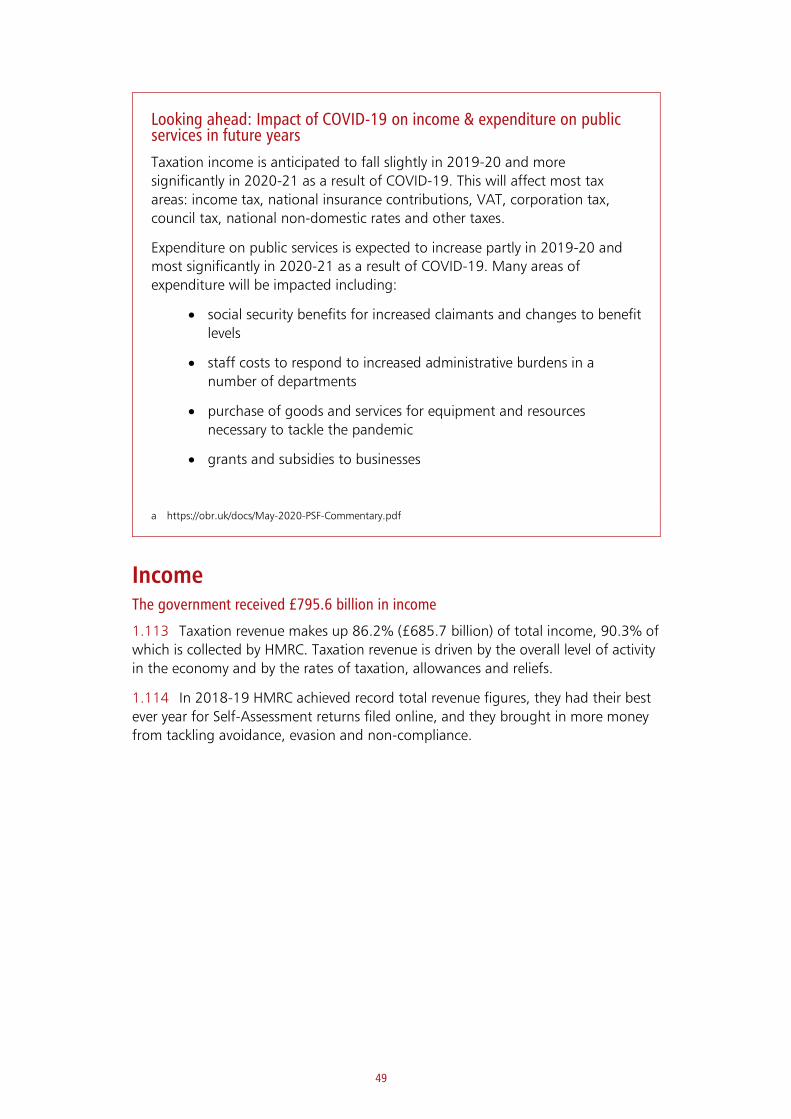
49
Looking ahead: Impact of COVID-19 on income & expenditure on public services in future years
Taxation income is anticipated to fall slightly in 2019-20 and more
significantly in 2020-21 as a result of COVID-19. This will affect most tax
areas: income tax, national insurance contributions, VAT, corporation tax,
council tax, national non-domestic rates and other taxes.
Expenditure on public services is expected to increase partly in 2019-20 and
most significantly in 2020-21 as a result of COVID-19. Many areas of
expenditure will be impacted including:
• social security benefits for increased claimants and changes to benefit
levels
• staff costs to respond to increased administrative burdens in a
number of departments
• purchase of goods and services for equipment and resources
necessary to tackle the pandemic
• grants and subsidies to businesses
a https://obr.uk/docs/May-2020-PSF-Commentary.pdf
Income The government received £795.6 billion in income
1.113 Taxation revenue makes up 86.2% (£685.7 billion) of total income, 90.3% of
which is collected by HMRC. Taxation revenue is driven by the overall level of activity
in the economy and by the rates of taxation, allowances and reliefs.
1.114 In 2018-19 HMRC achieved record total revenue figures, they had their best
ever year for Self-Assessment returns filed online, and they brought in more money
from tackling avoidance, evasion and non-compliance.

50
Chart 1.X: Taxation revenue over time (£ billion)
1.115 Income tax, National Insurance Contributions and VAT make up the three
largest elements of total tax revenue, but a wide range of other taxes and duties are
also factored in. The following snapshot summarises the key elements of total tax
revenue in 2018-19.
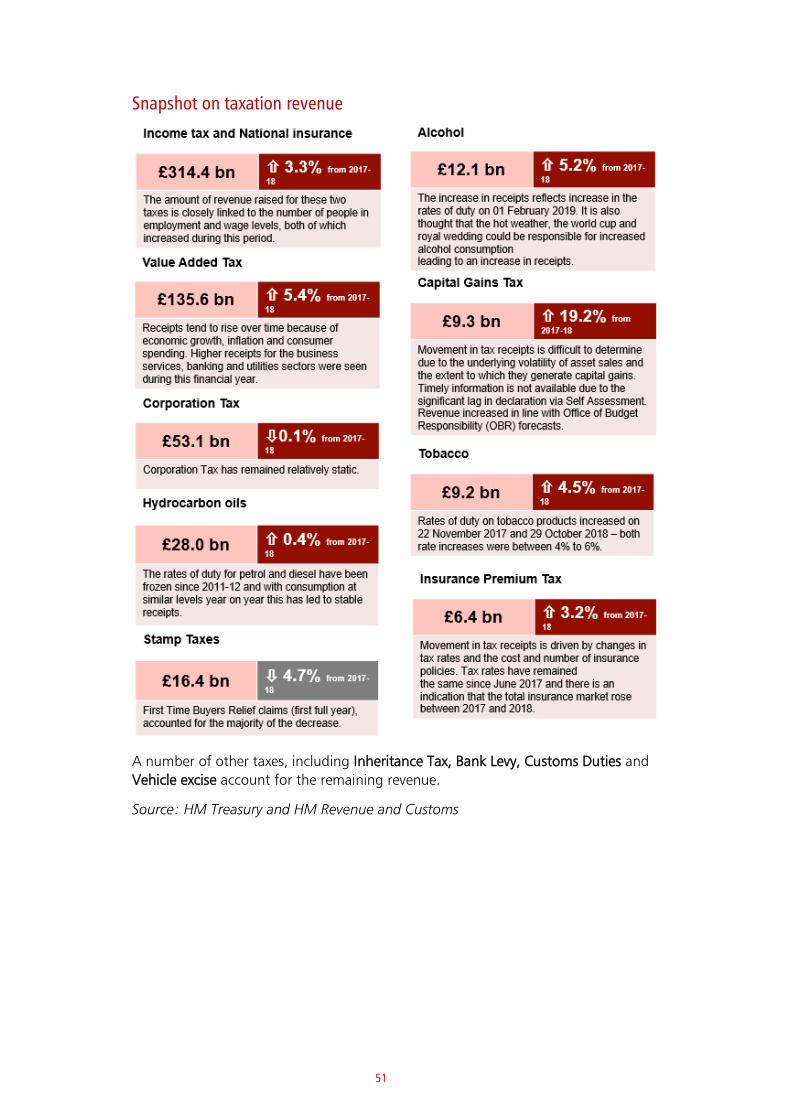
51
Snapshot on taxation revenue
A number of other taxes, including Inheritance Tax, Bank Levy, Customs Duties and
Vehicle excise account for the remaining revenue.
Source: HM Treasury and HM Revenue and Customs

52
Expenditure
Total Expenditure on public services is £851.8 billion
1.116 The government spent £851.8 billion on public services. The most significant
elements were social security benefits of £230.3 billion (2017-18: £225.9 billion),
staff costs of £255.7 billion (2017-18: £215.8 billion) and purchase of goods and
services of £206.5 billion (2017-18: £207.4 billion), each of which is explored in
more detail in the following sections.
Chart 1.Y: Expenditure trends
1.117 Overall, total expenditure on public services has increased by 13.4% over the
last 5 years. The largest change for 2018-19 was an increase of £30.5 billion in past
service costs for public sector pensions, which is included within ‘staff costs’. This
reflects the Court of Appeal ruling against the government in the two cases of
Sargeant and McCloud. Further details can be found in note 24.
1.118 As well as WGA, the Treasury publishes the Public Expenditure Statistical
Analysis (PESA)8 and the Country and Regional Analysis (CRA).9
1.119 These statistical publications provide another way of looking at government
expenditure based on what it is spent on (e.g. health, education) and where it is
spent.
8 https://www.gov.uk/government/statistics/public-expenditure-statistical-analyses-2019
9 https://www.gov.uk/government/statistics/country-and-regional-analysis-2019
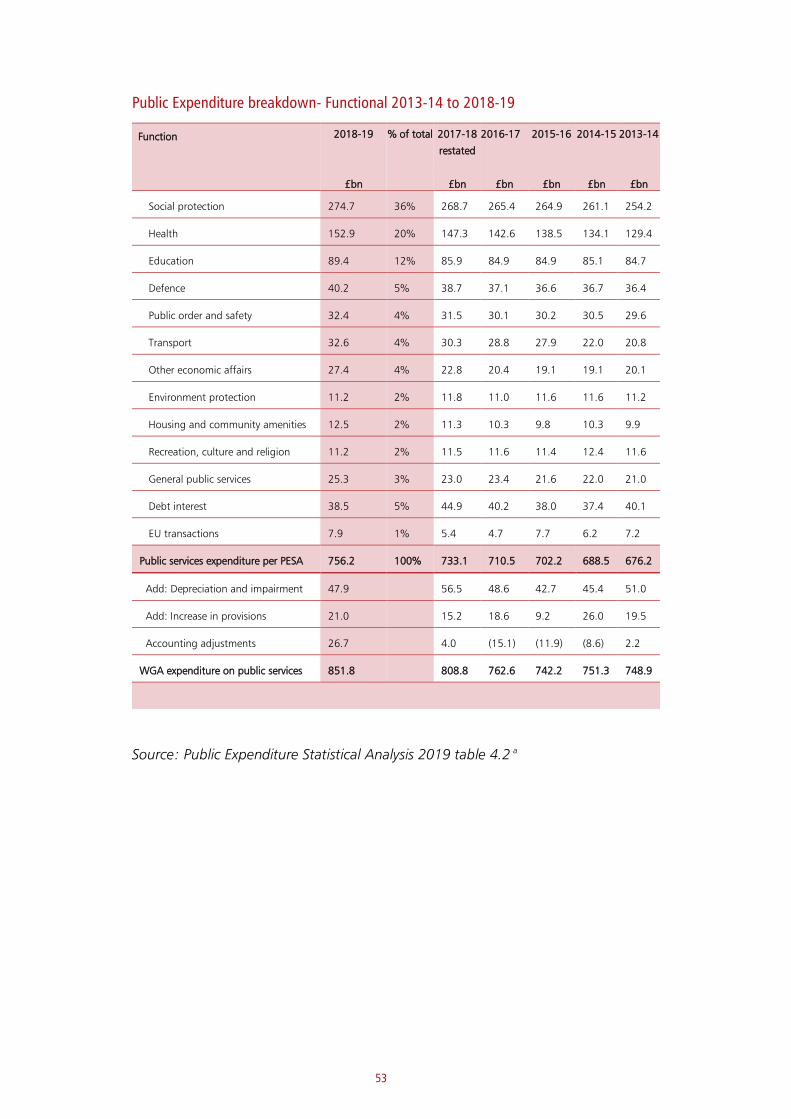
53
Public Expenditure breakdown- Functional 2013-14 to 2018-19
Function 2018-19
£bn
% of total 2017-18
restated
£bn
2016-17
£bn
2015-16
£bn
2014-15
£bn
2013-14
£bn
Social protection 274.7 36% 268.7 265.4 264.9 261.1 254.2
Health 152.9 20% 147.3 142.6 138.5 134.1 129.4
Education 89.4 12% 85.9 84.9 84.9 85.1 84.7
Defence 40.2 5% 38.7 37.1 36.6 36.7 36.4
Public order and safety 32.4 4% 31.5 30.1 30.2 30.5 29.6
Transport 32.6 4% 30.3 28.8 27.9 22.0 20.8
Other economic affairs 27.4 4% 22.8 20.4 19.1 19.1 20.1
Environment protection 11.2 2% 11.8 11.0 11.6 11.6 11.2
Housing and community amenities 12.5 2% 11.3 10.3 9.8 10.3 9.9
Recreation, culture and religion 11.2 2% 11.5 11.6 11.4 12.4 11.6
General public services 25.3 3% 23.0 23.4 21.6 22.0 21.0
Debt interest 38.5 5% 44.9 40.2 38.0 37.4 40.1
EU transactions 7.9 1% 5.4 4.7 7.7 6.2 7.2
Public services expenditure per PESA 756.2 100% 733.1 710.5 702.2 688.5 676.2
Add: Depreciation and impairment 47.9 56.5 48.6 42.7 45.4 51.0
Add: Increase in provisions 21.0 15.2 18.6 9.2 26.0 19.5
Accounting adjustments 26.7 4.0 (15.1) (11.9) (8.6) 2.2
WGA expenditure on public services 851.8 808.8 762.6 742.2 751.3 748.9
Source: Public Expenditure Statistical Analysis 2019 table 4.2 a

54
Public Services expenditure breakdown – Country and Regional 2013-14 – 2018-19
Region 2018-19
£bn
% of total 2017-18
restated
£bn
2016-17
£bn
2015-16
£bn
2014-15
£bn
2013-14
£bn
North East 27.1 4% 25.7 25.6 25.3 24.8 24.5
North West 71.9 9% 70.9 68.3 67.6 66.3 64.8
Yorkshire and the Humber 50.0 6% 48.5 48.1 47.7 46.8 45.5
East Midlands 41.3 5% 39.9 39.1 38.6 38.2 37.0
West Midland 54.5 7% 52.2 51.5 50.2 50.3 48.2
East 54.2 7% 51.5 49.8 49.5 48.3 46.6
London 92.9 12% 90.9 88.6 87.6 84.5 83.3
South East 78.6 10% 75.1 73.5 71.1 69.3 67.8
South West 49.9 7% 48.0 46.9 45.9 45.3 43.9
Scotland 61.2 8% 58.7 57.4 56.2 54.9 54.1
Wales 33.4 4% 32.4 31.4 31.0 30.6 30.1
Northern Ireland 21.8 3% 20.8 20.5 20.2 20.3 19.9
Outside UK 30.2 4% 26.7 25.4 25.8 27.1 26.7
Non-identifiable expenditure 106.1 14% 109.3 102.9 101.1 96.4 83.4
Public sector expenditure on services 773.1 100% 750.6 729.0 717.8 703.1 675.8
Add: Depreciation and impairment 47.9 56.5 48.6 42.7 45.4 51.0
Add: Increase in provisions 21.0 15.2 18.6 9.2 26.0 19.5
Accounting adjustments 9.8 (13.5) (33.6) (11.9) (23.2) 2.2
WGA expenditure on public services 851.8 808.8 762.6 742.2 751.3 748.9
Source: Country and Regional analysis 2019 table A.1 a
a Table may not agree with PESA/CRA due to rounding
Social security benefits totalled £230.3 billion
1.120 Government spending on social security benefits increased by 1.9% in 2018-
19 compared with 2017-18. It has increased by 5.8% over the last five years. The
largest element of social security benefits is the state pension. State pension
expenditure increased by £3.0 billion as a result of the annual uprating in line with
the “triple lock” at 2.5%. There were around 12.8 million pensioners receiving a
State Pension as at August 2018, with around 1.2 million of them living overseas.
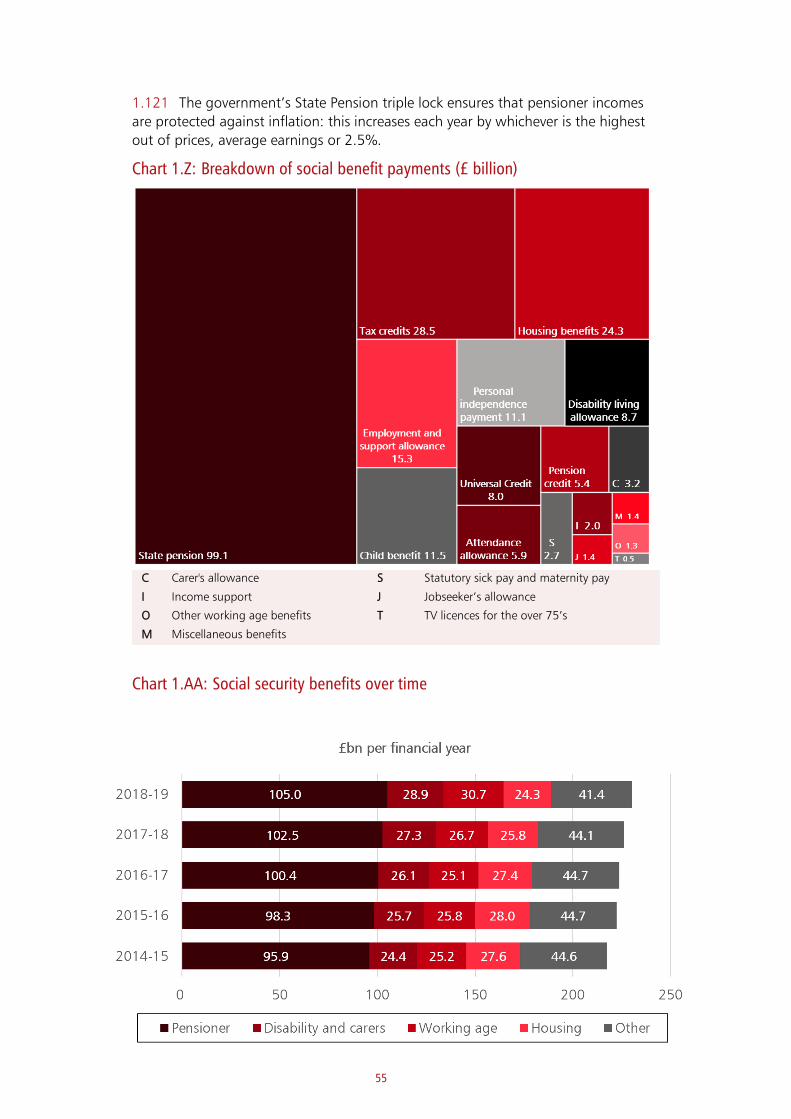
55
1.121 The government’s State Pension triple lock ensures that pensioner incomes
are protected against inflation: this increases each year by whichever is the highest
out of prices, average earnings or 2.5%.
Chart 1.Z: Breakdown of social benefit payments (£ billion)
C Carer's allowance S Statutory sick pay and maternity pay
I Income support J Jobseeker’s allowance
O Other working age benefits T TV licences for the over 75’s
M Miscellaneous benefits
Chart 1.AA: Social security benefits over time
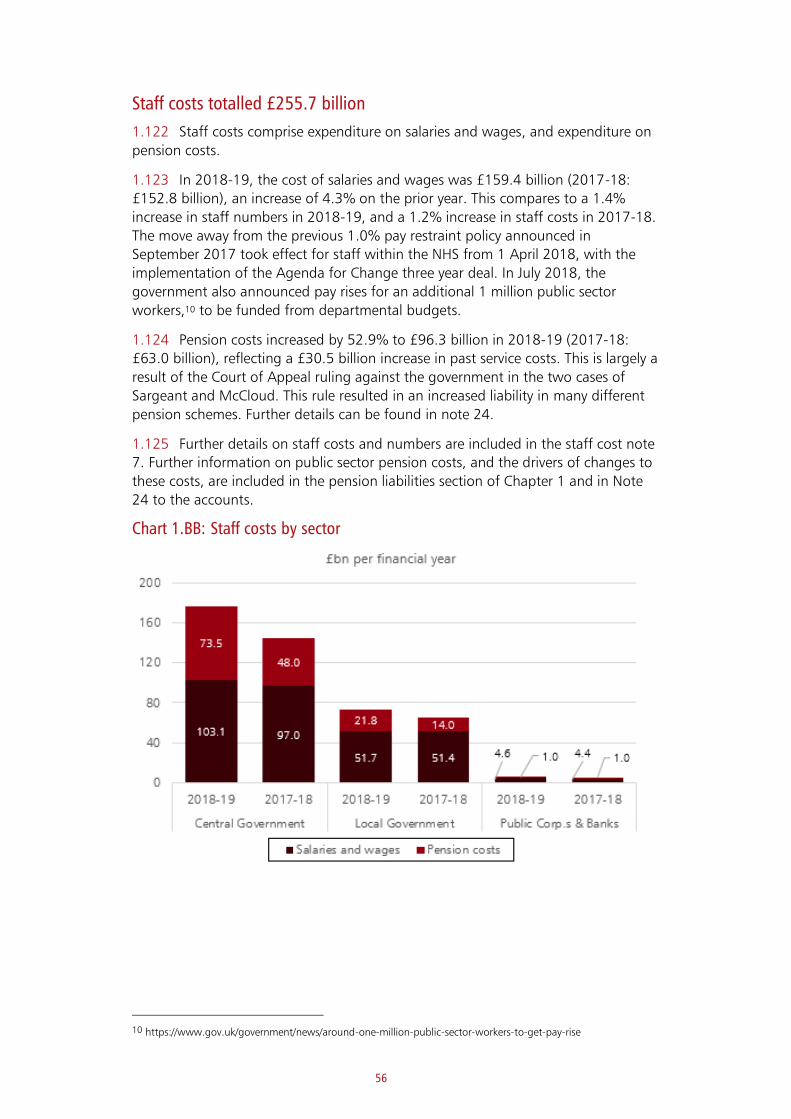
56
Staff costs totalled £255.7 billion
1.122 Staff costs comprise expenditure on salaries and wages, and expenditure on
pension costs.
1.123 In 2018-19, the cost of salaries and wages was £159.4 billion (2017-18:
£152.8 billion), an increase of 4.3% on the prior year. This compares to a 1.4%
increase in staff numbers in 2018-19, and a 1.2% increase in staff costs in 2017-18.
The move away from the previous 1.0% pay restraint policy announced in
September 2017 took effect for staff within the NHS from 1 April 2018, with the
implementation of the Agenda for Change three year deal. In July 2018, the
government also announced pay rises for an additional 1 million public sector
workers,10 to be funded from departmental budgets.
1.124 Pension costs increased by 52.9% to £96.3 billion in 2018-19 (2017-18:
£63.0 billion), reflecting a £30.5 billion increase in past service costs. This is largely a
result of the Court of Appeal ruling against the government in the two cases of
Sargeant and McCloud. This rule resulted in an increased liability in many different
pension schemes. Further details can be found in note 24.
1.125 Further details on staff costs and numbers are included in the staff cost note
7. Further information on public sector pension costs, and the drivers of changes to
these costs, are included in the pension liabilities section of Chapter 1 and in Note
24 to the accounts.
Chart 1.BB: Staff costs by sector
10 https://www.gov.uk/government/news/around-one-million-public-sector-workers-to-get-pay-rise
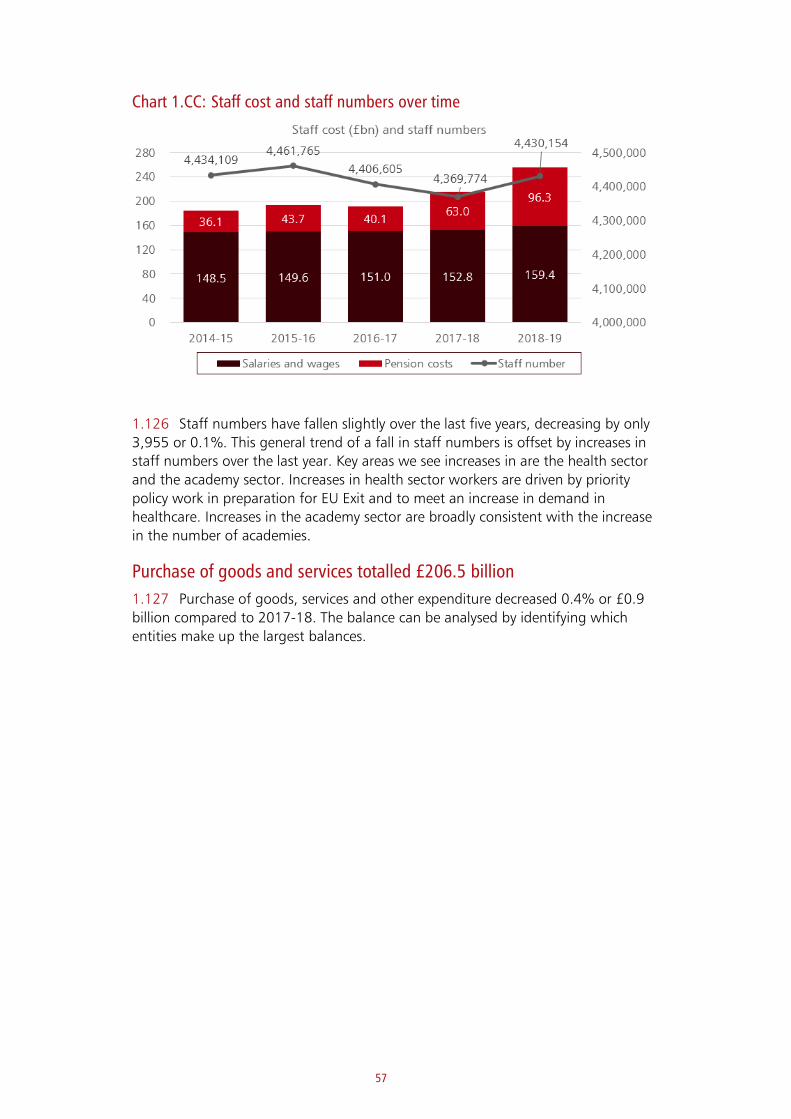
57
Chart 1.CC: Staff cost and staff numbers over time
1.126 Staff numbers have fallen slightly over the last five years, decreasing by only
3,955 or 0.1%. This general trend of a fall in staff numbers is offset by increases in
staff numbers over the last year. Key areas we see increases in are the health sector
and the academy sector. Increases in health sector workers are driven by priority
policy work in preparation for EU Exit and to meet an increase in demand in
healthcare. Increases in the academy sector are broadly consistent with the increase
in the number of academies.
Purchase of goods and services totalled £206.5 billion
1.127 Purchase of goods, services and other expenditure decreased 0.4% or £0.9
billion compared to 2017-18. The balance can be analysed by identifying which
entities make up the largest balances.
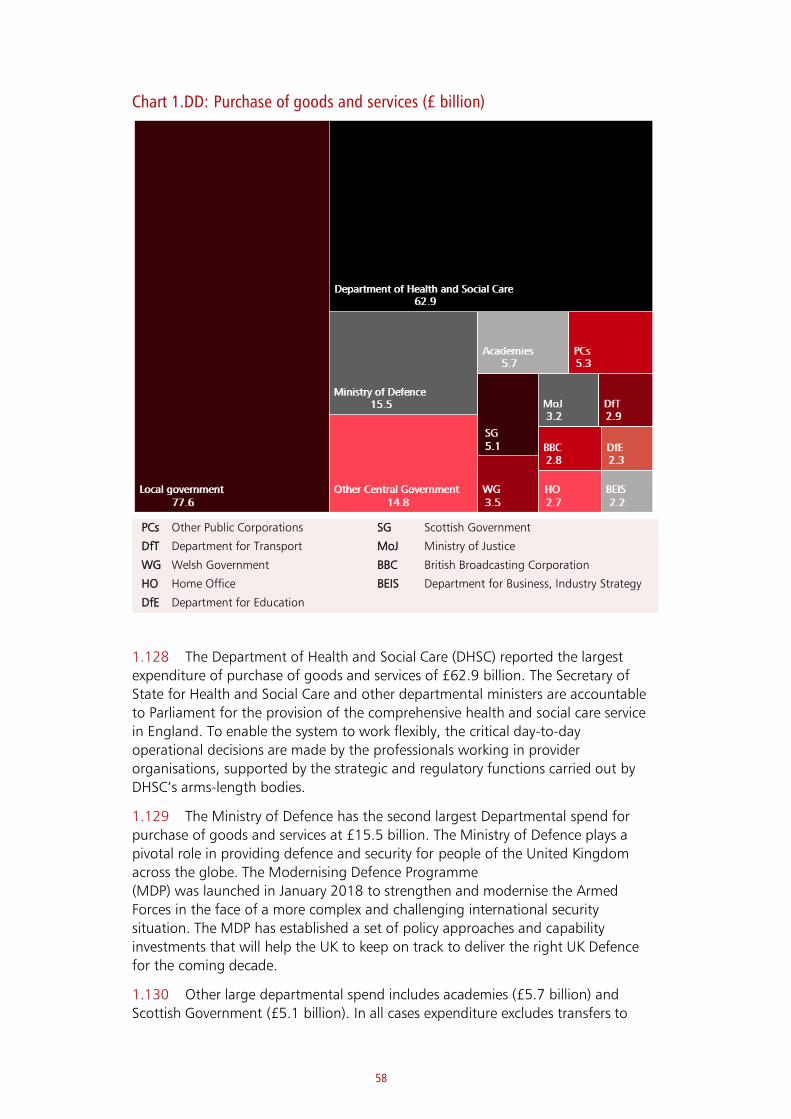
58
Chart 1.DD: Purchase of goods and services (£ billion)
PCs Other Public Corporations SG Scottish Government
DfT Department for Transport MoJ Ministry of Justice
WG Welsh Government BBC British Broadcasting Corporation
HO Home Office BEIS Department for Business, Industry Strategy
DfE Department for Education
1.128 The Department of Health and Social Care (DHSC) reported the largest
expenditure of purchase of goods and services of £62.9 billion. The Secretary of
State for Health and Social Care and other departmental ministers are accountable
to Parliament for the provision of the comprehensive health and social care service
in England. To enable the system to work flexibly, the critical day-to-day
operational decisions are made by the professionals working in provider
organisations, supported by the strategic and regulatory functions carried out by
DHSC’s arms-length bodies.
1.129 The Ministry of Defence has the second largest Departmental spend for
purchase of goods and services at £15.5 billion. The Ministry of Defence plays a
pivotal role in providing defence and security for people of the United Kingdom
across the globe. The Modernising Defence Programme
(MDP) was launched in January 2018 to strengthen and modernise the Armed
Forces in the face of a more complex and challenging international security
situation. The MDP has established a set of policy approaches and capability
investments that will help the UK to keep on track to deliver the right UK Defence
for the coming decade.
1.130 Other large departmental spend includes academies (£5.7 billion) and
Scottish Government (£5.1 billion). In all cases expenditure excludes transfers to
59
other parts of the public sector (for example from the Department for Education to
academies or local authorities).
1.131 The wide range of activities carried out by entities in the public sector,
differences in what is material in each entity and differences in reporting
conventions means that it is hard to analyse expenditure on goods and services by
category within WGA. For example, central government departments report by
category of expenditure but frequently have items that are unique to their service
(such as medical supplies). By comparison, local government report based on the
purpose of the expenditure (such as delivering social care). HM Treasury continue to
work on providing a more useful analysis of goods and services that works across
different sectors.
Box 1.I: What is not included in WGA
Although WGA is a highly comprehensive product, there are some areas that
are not included, either because they are outside the accounting standards,
would lead to lengthy disclosures that added limited value, or due to
limitations in the data collection:
a) WGA does not include a liability for future state pension payments. This is
because the payments are only recognised when they fall due, which is on an
ongoing basis. Similarly, future payments for public services are also not
recognised unless contractually committed.
b) WGA does not recognise an asset for future tax revenue, as the revenue can
only be recognised as it falls due.
c) WGA does not include individual remuneration disclosures of public sector
employees, including senior employees. This information can be found in the
published accounts of individual organisations.
d) WGA cannot currently provide in depth analysis of expenditure, particularly
purchases of goods and services. This is because different organisations have
different definitions of expenditure categories. Treasury continues to review
this area to make improvements, and provide supplementary information.
e) WGA follows the IFRS definition of Intangible assets. This means that there
are strict rules over what can and cannot be recognised on the Statement of
Financial Position. There is a broader definition of intangible assets which
encompasses knowledge, techniques and know how, which supports broader
consideration of public value. This is known as Knowledge Assets, however
they are not captured in WGA. At budget 2018 HM Treasury published a
report that highlighted the scale of knowledge assets held by the public
sector.a
f) WGA does not include full forecasts of the financial effects of COVID-19 or EU exit. Available information on EU exit is included in paragraphs 1.16 to 1.34. Information on the potential effects of COVID-19 is included in Table 1 A.
a Getting smart about Intellectual Property and other intangibles in the public sector’ HMT, Budget 2018
60
Other matters of note
PFI and PF2
1.132 Government has historically brought private investment into government-
funded projects in sectors such as health, education, justice, defence and transport
using Public Private Partnerships (PPPs). PPPs are long-term contractual
arrangements, usually for the construction and maintenance of an infrastructure
asset over 25-30 years.
1.133 Until 2012, the Private Finance Initiative (PFI) was the government’s
preferred model of PPP. In 2012, PFI was replaced with Private Finance 2 (PF2),
which was only used six times. In 2018, both PFI and PF2 were retired for use on
future projects as a result of concerns about the fiscal risk they created, their
inflexibility, and operational complexity. At 31 March 2018, there were 704 current
PFI and PF2 projects with a capital value of £57.0 billion, a reduction from 715
projects with a value of £59.0 billion at 31 March 201711.
1.134 PFI assets make up a small but important part of the government’s asset
base. PFI assets are paid for in instalments. The charge covers the cost of the asset,
an interest charge to reflect the financing of the asset, and a service charge for
ongoing maintenance and use of the asset.
1.135 In addition to assets and liabilities on the Statement of Financial Position, PFI
contracts also commit the government to paying service charges. These are the costs
of maintaining the purchased assets and are recognised as the services that trigger
these payments are delivered. Whilst not recognised as a liability on the Statement
of Financial Position, WGA discloses the total contractual commitment.
1.136 The government set up a Centre of Best Practice in 2018 to help NHS Trusts
improve the management of legacy PFI contracts. At Budget 2020, the government
announced that it would go further and provided £2 million to fund reviews of PFI
contracts across central government in England, including those outside the health
system.
Contingent Liabilities
What contingent liabilities does government have?
1.137 The government has a total of £377.5 billion disclosed as contingent
liabilities, a decrease of £25.1 billion from 2017-18 (restated). The government has
quantifiable and non-quantifiable contingent liabilities, and these are classified as
remote and non-remote (disclosed under IAS37) in notes 29 and 30 to the
accounts.
11 https://www.gov.uk/government/publications/private-finance-initiative-and-private-finance-2-projects-2018-
summary-data
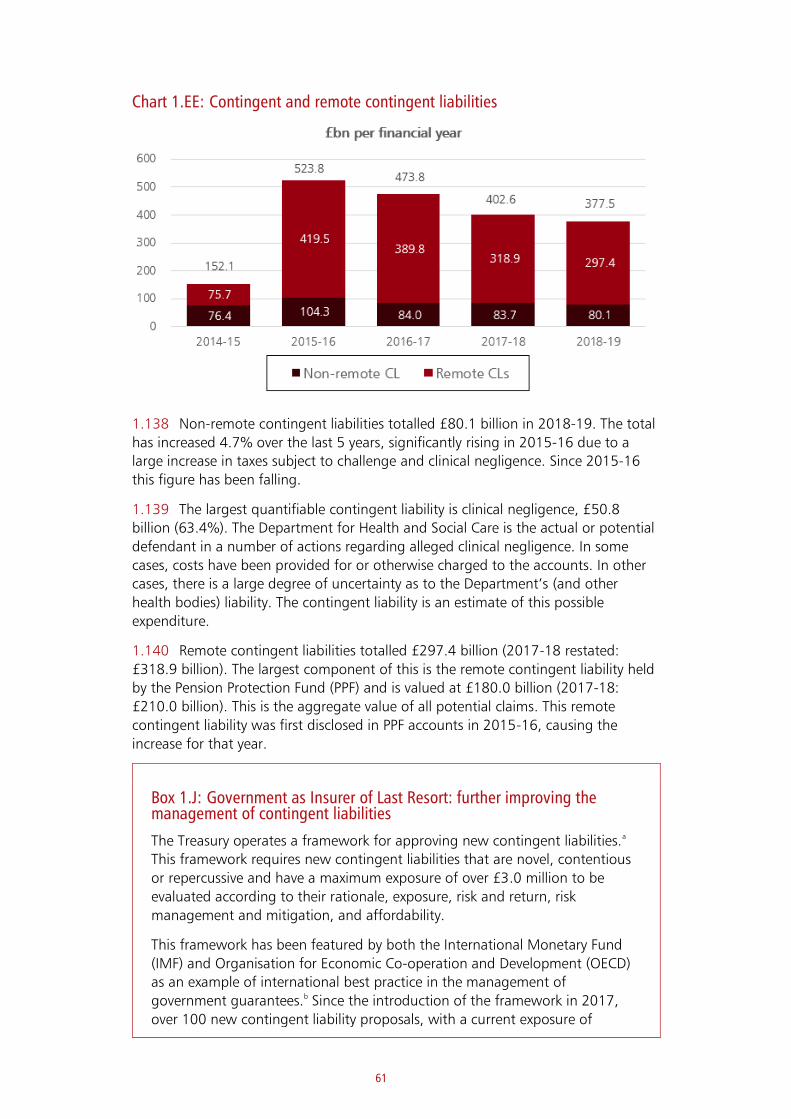
61
Chart 1.EE: Contingent and remote contingent liabilities
1.138 Non-remote contingent liabilities totalled £80.1 billion in 2018-19. The total
has increased 4.7% over the last 5 years, significantly rising in 2015-16 due to a
large increase in taxes subject to challenge and clinical negligence. Since 2015-16
this figure has been falling.
1.139 The largest quantifiable contingent liability is clinical negligence, £50.8
billion (63.4%). The Department for Health and Social Care is the actual or potential
defendant in a number of actions regarding alleged clinical negligence. In some
cases, costs have been provided for or otherwise charged to the accounts. In other
cases, there is a large degree of uncertainty as to the Department’s (and other
health bodies) liability. The contingent liability is an estimate of this possible
expenditure.
1.140 Remote contingent liabilities totalled £297.4 billion (2017-18 restated:
£318.9 billion). The largest component of this is the remote contingent liability held
by the Pension Protection Fund (PPF) and is valued at £180.0 billion (2017-18:
£210.0 billion). This is the aggregate value of all potential claims. This remote
contingent liability was first disclosed in PPF accounts in 2015-16, causing the
increase for that year.
Box 1.J: Government as Insurer of Last Resort: further improving the management of contingent liabilities
The Treasury operates a framework for approving new contingent liabilities.a
This framework requires new contingent liabilities that are novel, contentious
or repercussive and have a maximum exposure of over £3.0 million to be
evaluated according to their rationale, exposure, risk and return, risk
management and mitigation, and affordability.
This framework has been featured by both the International Monetary Fund
(IMF) and Organisation for Economic Co-operation and Development (OECD)
as an example of international best practice in the management of
government guarantees.b Since the introduction of the framework in 2017,
over 100 new contingent liability proposals, with a current exposure of
62
around £150.0 billion, have been evaluated using it.c The framework has
helped improve the process for creating new contingent liabilities as the
majority have only been approved after:
• more comprehensive information or improved quantification was
provided to better understand the risk
• substantial policy changes to reduce the risk or improve
compensation to the taxpayer for bearing the risk
A number of contingent liabilities, with a total exposure of over £9.6 billion,
have been rejected outright. This has helped to reduce risk and improve fiscal
sustainability.
The Balance Sheet Review has highlighted opportunities to build on the
success of the existing approval regime and further improve the management
of contingent liabilities. At Spring Budget 2020 the government published the
‘Government as Insurer of Last Resort’ report, which sets out a range of
proposals to:d
• improve the expertise in the government to quantify and price risk
• improve compensation for risk taken on by the taxpayer
• establish the right incentives to reduce both the probability of risk
materialising and the cost when it does
• clarify risk ownership to provide more certainty on how losses will be
shared between the Exchequer, departments and the private sector
These proposals also address one of the fiscal risks highlighted in the Office
for Budget Responsibility’s (OBRs) Fiscal Risks Report.e Whilst these proposals
provide the foundations for improving the management of contingent
liabilities, the application of these proposals to individual contingent liabilities
will need to be tailored on a case-by-case basis to reflect the specific
circumstance of that contingent liability. The government will take forward
work to implement these proposals.
a Contingent liability approval framework: guidance’, HM Treasury, July 2017
b ‘How to strengthen the management of government guarantees’, IMF, October 2017, ‘18th Annual
Meeting of OECD Senior Financial Management and Reporting Officials’, OECD Paris, March 2018
c £150 billion represents the maximum potential exposure for government, i.e., what the public sector
obligation would be in a plausible worst-case scenario. This approach is different from the WGA
quantification of contingent liabilities, which estimates the most probable outcome. The contingent
liabilities database therefore provides an estimate of the maximum amount the government may have
to cover due to the commitments represented by its contingent liabilities.
d ‘Government as Insurer of Last Resort’, HMT, March 2020
e ‘Fiscal Risks Report 2019’, OBR, July 2019
63
The role of WGA in financial reporting and management 1.141 WGA is part of a broader framework of financial reporting and
management. The key elements of this framework are discussed below:
1.142 Individual entity accounts - Individual entity’s Accounting Officers (and
equivalent) are responsible for the public funds spent within their entity. As part of
this framework of accountability, each individual entity produces an annual report
and accounts. These are prepared in line with International Financial Reporting
Standards, as adapted and interpreted by the relevant authority for the public sector
context. These accounts are then independently audited and published. In the case
of central government departments and their arm’s length bodies, these accounts
are laid in Parliament, and are used by Select Committees and the Public Accounts
Committee.
1.143 In general, departments and their arm’s length bodies publish their accounts
before the summer Parliamentary recess after the end of the financial year. For
2019-20, HM Treasury has introduced measures that reduce the reporting burden
for central government departments’ accounts, in the light of the COVID-19
pandemic. These measures include reduced performance reporting requirements
and a relaxation of the deadline for laying accounts in Parliament.
1.144 Supply Estimates - Public spending is subject to Parliamentary approval.
Public bodies request the funding they need for the year via the budgeting and
Estimates process. These budgets are then voted on by Parliament. Once budget has
been provided, the central government department is responsible for ensuring that
it does not overspend. Spending against budgets must be disclosed as part of
department’s financial accounts, and this information is audited. If a department
overspends, its accounts will be subject to an audit qualification.
1.145 Internal management accounts - Individual entities are responsible for
remaining within budget. Therefore, the Accounting Officer (and equivalent) of each
organisation is required to put in place appropriate financial controls. Many
organisations will have their own internal forecasting and management account
processes, that produce management data on a monthly basis. This data is then
used by management to allocate resources and manage in-year over or
underspends.
1.146 Public Sector Finances release - This monthly national statistics publication is
a joint release between the Office for National Statistics (ONS) and HM Treasury. It
records the official UK government positions for spending, receipts, borrowing and
debt. Central government data is supplied by HM Treasury, based on data provided
by each government department.
1.147 OBR publications - The Office for Budget Responsibility (OBR) produces
independent forecasts of the medium-term outlook for the economy and public
finances twice a year, at fiscal events. They also publish, in alternating years, a Fiscal
Risks Report (FRR) and a Fiscal Sustainability Report (FSR). The government is
required to respond to the FRR within a year of publication. This helps to ensure that
fiscal risks and their management are properly considered and scrutinised.
1.148 These reports draw on a wide range of sources, including WGA data. Fiscal
risks affect net borrowing by reducing future receipts or increasing future
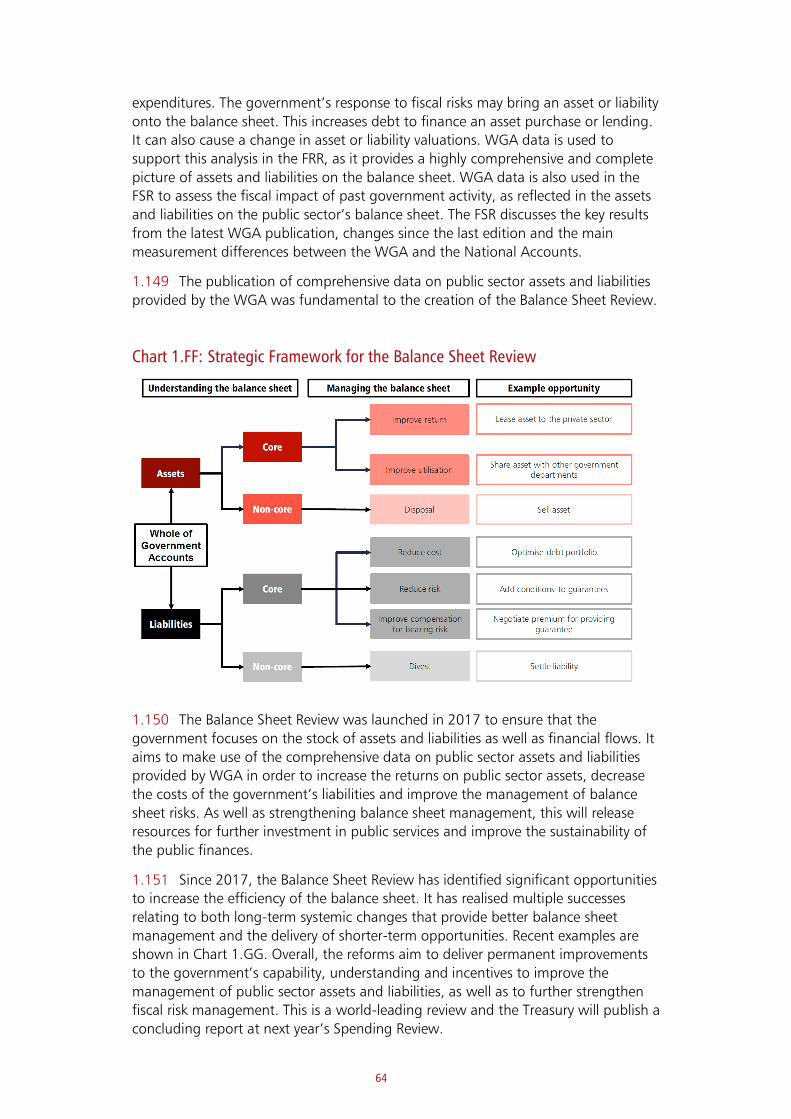
64
expenditures. The government’s response to fiscal risks may bring an asset or liability
onto the balance sheet. This increases debt to finance an asset purchase or lending.
It can also cause a change in asset or liability valuations. WGA data is used to
support this analysis in the FRR, as it provides a highly comprehensive and complete
picture of assets and liabilities on the balance sheet. WGA data is also used in the
FSR to assess the fiscal impact of past government activity, as reflected in the assets
and liabilities on the public sector’s balance sheet. The FSR discusses the key results
from the latest WGA publication, changes since the last edition and the main
measurement differences between the WGA and the National Accounts.
1.149 The publication of comprehensive data on public sector assets and liabilities
provided by the WGA was fundamental to the creation of the Balance Sheet Review.
1.150 The Balance Sheet Review was launched in 2017 to ensure that the
government focuses on the stock of assets and liabilities as well as financial flows. It
aims to make use of the comprehensive data on public sector assets and liabilities
provided by WGA in order to increase the returns on public sector assets, decrease
the costs of the government’s liabilities and improve the management of balance
sheet risks. As well as strengthening balance sheet management, this will release
resources for further investment in public services and improve the sustainability of
the public finances.
1.151 Since 2017, the Balance Sheet Review has identified significant opportunities
to increase the efficiency of the balance sheet. It has realised multiple successes
relating to both long-term systemic changes that provide better balance sheet
management and the delivery of shorter-term opportunities. Recent examples are
shown in Chart 1.GG. Overall, the reforms aim to deliver permanent improvements
to the government’s capability, understanding and incentives to improve the
management of public sector assets and liabilities, as well as to further strengthen
fiscal risk management. This is a world-leading review and the Treasury will publish a
concluding report at next year’s Spending Review.
Chart 1.FF: Strategic Framework for the Balance Sheet Review

65
Chart 1.GG: Successes of the Balance Sheet Review in 2018-19 and 2019-20a
a 1. https://assets.publishing.service.gov.uk/government/uploads/system/uploads/attachment_data/file/788708/asset_sale_disclosures_guidance_for_government_web.pdf
2. https://www.ons.gov.uk/economy/nationalaccounts/uksectoraccounts/bulletins/nationalbalancesheet/previousReleases
3. https://assets.publishing.service.gov.uk/government/uploads/system/uploads/attachment_data/file/871660/06022020_Government_as_Insurer_of_Last_Resort_report__Final_clean_.pdf
4. https://assets.publishing.service.gov.uk/government/uploads/system/uploads/attachment_data/file/790059/2019_-20_CBG_Final_web.pdf
5. https://assets.publishing.service.gov.uk/government/uploads/system/uploads/attachment_data/file/752003/Getting_smart_about_intellectual_property_and_other_intangibles_in_the_public_sector_-_Budget_2018.pdf
6. https://assets.publishing.service.gov.uk/government/uploads/system/uploads/attachment_data/file/871954/Budget_review_of_student_loan_sale_programme.pdf
Events since 31 March 2019
1.152 There have been a number of events that could have a bearing on the
Statement of Financial Position as at 31 March 2019. These events are shown in
Note 32 to the accounts.
Catherine Little
Accounting Officer
17 July 2020
66
Chapter 2
Statement of Accounting Officer's responsibilities 2.1 Under section 9 of the Government Resources and Accounts Act 2000 (the
GRAA), HM Treasury is required to prepare, for each financial year, a consolidated
set of accounts for a group of entities, each of which appears to HM Treasury:
• to exercise functions of a public nature, or
• to be entirely or substantially funded from public money
2.2 The account is prepared on an accruals basis and in accordance with the
GRAA and the 2018-19 Government Financial Reporting Manual (FReM) which
applies EU adopted International Financial Reporting Standards (IFRS) as adapted or
interpreted for the public sector. The accounts must give a true and fair view of the
whole of government’s finances.
2.3 In preparing the accounts, the Accounting Officer is required to comply with
the requirements of the FReM, and in particular to:
• observe the relevant accounting and disclosure requirements and apply
suitable accounting policies on a consistent basis
• make judgements and estimates on a reasonable basis, including those
judgements involved in consolidating accounting information provided by
different sectors
• state whether applicable accounting standards, as set out in the FReM,
have been followed, and disclose and explain any material departures in
the accounts
• prepare the accounts on a going concern basis
2.4 In addition to these responsibilities, and specifically with regard to Whole of
Government Accounts (WGA), the Accounting Officer is responsible for:
• drawing up WGA in accordance with the GRAA
• ensuring that WGA complies with the FReM and generally accepted
accounting practice
• agreeing the process of producing WGA and for ensuring that relevant
data are collected and accurately and appropriately processed
• ensuring that there is an appropriate control environment for the
production of WGA
2.5 The responsibilities of an Accounting Officer are set out in Managing Public
Money, published by HM Treasury and include the need for efficiency, economy,

67
effectiveness, and prudence in the administration of public resources to deliver value
for money.1
2.6 The WGA Accounting Officer is responsible for signing the WGA Governance
statement. When signing the Governance statement, the WGA Accounting Officer
places reliance on the assurances made for each individual entity by the Accounting
Officer or their equivalent, as documented through the Governance statement for
those bodies.
1 http://www.hm-treasury.gov.uk/psr_mpm_index.htm

68
Chapter 3
Governance Statement
Scope of Accounting Officer’s responsibility 3.1 As Accounting Officer, I am responsible for maintaining a governance
framework to support the efficient and effective production of the Whole of
Government Accounts (WGA). The framework is designed to minimise the risks to
the process of preparing and publishing the consolidated accounts. The accounts of
individual entities consolidated within WGA are subject to their own governance
frameworks including Accounting Officer or equivalent controls.
3.2 The previous Accounting Officer, James Bowler, was Accounting Officer for
the Whole of Government Accounts up to 11 March 2020. I have been Accounting
Officer for the Whole of Government Accounts since 12 March 2020. Although I
was not Accounting Officer for the Whole of Government Accounts for the whole
period that this report covers, James Bowler has provided me with written assurance
that there were adequate governance arrangements in place up to 11 March 2020
and that the system of internal control was effective throughout.
3.3 The framework is intended to manage risk to a reasonable level rather than
to eliminate all risk of failure to the consolidation and preparation process. It
provides reasonable, but not absolute, assurance of effectiveness. The governance
framework is based on an ongoing process, designed to identify and prioritise the
risks, to evaluate the likelihood of those risks being realised and the impact should
they be realised, and to manage them efficiently.
3.4 Publication of WGA is managed within HM Treasury’s overall risk
management framework, which is set out in the department’s annual report and
accounts. The Deputy Director for Government Financial Reporting is responsible on
a day-to-day basis for managing risk and for ensuring that the activities necessary
for the production of these accounts are properly planned, resourced and
performed.
3.5 HM Treasury has put in place a risk management framework to manage the
key risks to the WGA consolidation and preparation process. This includes
maintenance and regular review of a risk register to assist in identifying and
implementing mitigating actions. HM Treasury also maintains a control and
validation framework to define the controls over the preparation of the accounts
and to monitor the effectiveness and completeness of the controls in place.
3.6 In producing WGA, I must rely on the Accounting Officer (or equivalent) of
each entity to manage their own risks. In some instances, the risks from underlying
accounts may have a significant impact on the WGA consolidation and preparation
process. The major risks identified from the underlying accounts are set out in
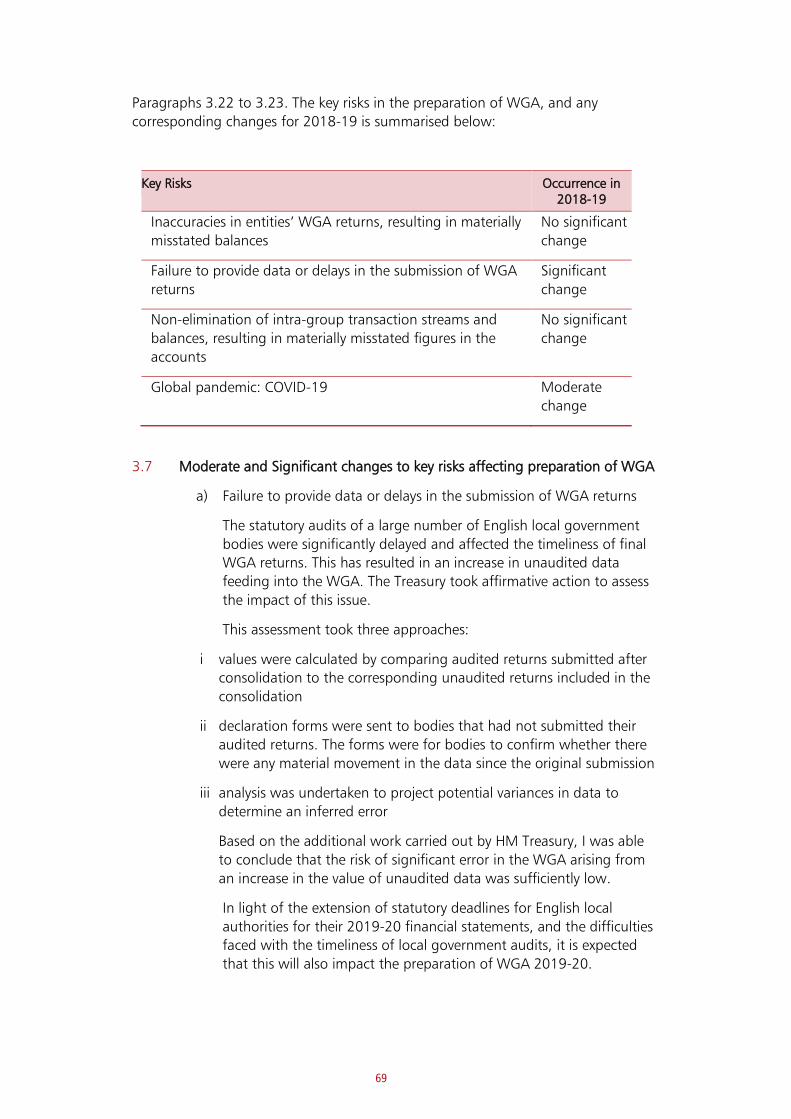
69
Paragraphs 3.22 to 3.23. The key risks in the preparation of WGA, and any
corresponding changes for 2018-19 is summarised below:
Key Risks Occurrence in 2018-19
Inaccuracies in entities’ WGA returns, resulting in materially
misstated balances
No significant
change
Failure to provide data or delays in the submission of WGA
returns
Significant
change
Non-elimination of intra-group transaction streams and
balances, resulting in materially misstated figures in the
accounts
No significant
change
Global pandemic: COVID-19 Moderate
change
3.7 Moderate and Significant changes to key risks affecting preparation of WGA
a) Failure to provide data or delays in the submission of WGA returns
The statutory audits of a large number of English local government
bodies were significantly delayed and affected the timeliness of final
WGA returns. This has resulted in an increase in unaudited data
feeding into the WGA. The Treasury took affirmative action to assess
the impact of this issue.
This assessment took three approaches:
i values were calculated by comparing audited returns submitted after
consolidation to the corresponding unaudited returns included in the
consolidation
ii declaration forms were sent to bodies that had not submitted their
audited returns. The forms were for bodies to confirm whether there
were any material movement in the data since the original submission
iii analysis was undertaken to project potential variances in data to
determine an inferred error
Based on the additional work carried out by HM Treasury, I was able
to conclude that the risk of significant error in the WGA arising from
an increase in the value of unaudited data was sufficiently low.
In light of the extension of statutory deadlines for English local
authorities for their 2019-20 financial statements, and the difficulties
faced with the timeliness of local government audits, it is expected
that this will also impact the preparation of WGA 2019-20.

70
b) Global pandemic: COVID-19
The impact of COVID-19 will be reflected partly in the financial
accounts of 2019-20, and largely in the accounts of 2020-21. In
terms of the preparation of WGA 2018-19, this has caused small
delays in the timeliness of the publication. There are likely to be
additional delays in the preparation of WGA 2019-20 as a result of an
extension to the statutory deadline for laying resource accounts.
On 22 May 2020, the Permanent Secretary of HM Treasury wrote to
the Chair of PAC in relation to a number of potential control total
breaches for government departments’ 2019-20 accounts as a result
of the COVID-19 pandemic. WGA does not include data on control
totals, however this also highlights the financial reporting challenges
that bodies will face in preparing the 2019-20 accounts. These
challenges are likely to impact WGA .
3.8 The WGA governance framework has been in place for the year ended 31
March 2019 which this account reports on and the full period of account
preparation up to the date of approval. The governance accords with HM Treasury
guidance, including the ‘Corporate Governance in Central Government: Code of
Good Practice’, to the extent that it is deemed relevant and practical.
The WGA governance framework 3.9 I receive support and assurance on the management of risks in a number of
ways:
• The HM Treasury Group Audit and Risk Committee, chaired by a non-
executive member and supported by the Treasury’s internal audit function,
reviews the department’s approach to internal control and provides
independent advice, with oversight of financial reporting and risk
management activities associated with WGA.
• As well as the internal framework of governance and risk management, the
WGA is subject to external audit provided by the Comptroller & Auditor
General, supported by staff from the National Audit Office (NAO). The
Comptroller & Auditor General is independent, and reports his findings on
the accounts to Parliament. More information about the respective
responsibility of the auditor and preparer can be found in the Comptroller
& Auditor General’s audit certificate in Chapter 5. The Comptroller &
Auditor General and his staff have access to all HM Treasury papers and
attend HM Treasury’s Audit and Risk Committee.
How WGA is prepared 3.10 WGA is a uniquely complex undertaking, and is unlike accounts in most
private sector organisations. This section provides more information on the stages of
WGA preparation.
71
Data collection
3.11 There are a wide range of entities consolidated into WGA. These include
central government departments, local government bodies, entities in the devolved
administrations of Scotland, Wales and Northern Ireland, and public corporations.
3.12 The data that makes up WGA is largely based on the information included in
each entity’s audited financial statements, which are published at different times.
Historically, central government departments aimed to publish their accounts prior
to that year’s summer recess (summer closure of Parliament), English local
government bodies aimed to publish their finalised accounts by July, and devolved
administrations have their own reporting timetables, based on the requirements of
local accountability and oversight bodies. It should be noted that the publication
deadline for English local government has changed for 2019-20 in response to the
COVID-19 pressures. It is not possible to prepare WGA until the vast majority of
these entities have finalised their financial statements.
3.13 The format of financial statements varies across the UK public sector. In
order to be consolidated into WGA, entities have to provide audited data in a
standardised format using a data collection tool provided by the Treasury. The data
collection tool covers the whole of an entity’s group. Whilst there are over 9,000
organisations consolidated in WGA, this is equivalent to approximately 750 returns
in WGA.
3.14 Not every entity in the public sector is consolidated into WGA. The largest
entity which is excluded is the Royal Bank of Scotland. Paragraph 3.24 explains how
this leads to a qualification of the auditors opinion. In addition to RBS, very small
stand-alone entities (below £20 million) are not consolidated and the Treasury
publishes a list of these entities online. Finally, there are some entities which are part
of the public sector but are not answerable to the Executive function of
government, that are also excluded from WGA. These include entities such as the
Crown Estate and the NAO. The Treasury also publishes a list of these entities online.
Adjustments and eliminations
3.15 In order to produce WGA, transactions between entities have to be
eliminated. This ensures that assets, liabilities, income and expenditure are not
overstated. There are a vast range of transactions within the public sector and the
data collection tool asks entities to provide details of all of their transactions with
other WGA entities.
3.16 Many transactions can be quickly eliminated based on returns in the data
collection tool. Others require investigation because the transactions reported by
two entities do not match. Sometimes this is due to legitimate differences of
opinion on how to treat a transaction, on some occasions it is due to incomplete
information in one counterparty, or it can be because one counterparty has made
an error in the data collection tool.
3.17 As part of the WGA preparation process, the Treasury reviews and adjusts
transactions between WGA entities until the difference in what is reported by
entities (known as the ‘eliminations error’) is at an acceptable level. For the 18-19
WGA the final elimination error in the Statement of Financial Position is £4.2 billion
and in the Statement of Comprehensive Net Expenditure, £6.1 billion.
72
Analytical review
3.18 Once the intra-governmental transactions have been eliminated, the Treasury
moves on to a process called 'analytical review'. Analytical review is the process of
analysing and interrogating the financial data to ensure its integrity and investigate
variances. In carrying out the analytical review the Treasury also focuses on ensuring
that trends in the data are understood, which supports the analysis provided in
Chapter 1 of WGA and provides useful data that is shared with other bodies to
support broader development of public policy and statistics.
How WGA is being used
3.19 WGA is now an established product. In addition to making an important
contribution to accountability and transparency, both the publication and the
underlying dataset are used to support decision making and risk management.
Within the Treasury WGA data is used in the Managing Fiscal Risk publication, the
Balance Sheet Review (BSR) and internally for example by the Local Government
Spending team. More detail of the BSR is found in Chapter 1.
3.20 The publication and underlying dataset are also used more broadly,
including:
• The Office for National Statistics produce one off articles using WGA data,
and use WGA data to feed into wider datasets. For example, in the
compilation of the public sector finances dataset consistent with the IMF’s
Government Finance Statistic framework1, and in the benchmarking for UK
gross national income set by Eurostat.
• The Office for Budget Responsibility (OBR) independently reports on the
future sustainability of the public finances in its Fiscal Sustainability Report2
and Fiscal Risks Report3, drawing on the data published in WGA. In
addition, the government responded to the findings of the Fiscal Risk
Report in the Managing Fiscal Risks report.
• The Chartered Institute of Public Finance & Accountancy (CIPFA) is a
professional body for people in public finance, and manages the
accounting framework for Local Government. WGA data is used in their
CIPFA stats which is an independent source of comprehensive data about
local government and its services.
• Independent thinktanks and charities including Bright Blue,4 and Resolution
Foundation.5 Resolution Foundation published a report making the case for
balance sheet targeting in Fiscal Policy.
1https://www.ons.gov.uk/economy/governmentpublicsectorandtaxes/publicsectorfinance/datasets/internationalmone
taryfundsgovernmentfinancestatisticsframeworkinthepublicsectorfinancesappendixe
2 https://obr.uk/report/fiscal-sustainability-report/
3 https://obr.uk/docs/dlm_uploads/Fiscalrisksreport2019.pdf
4 https://brightblue.org.uk/tackling-intergenerational-inequity-at-its-roots/
5 https://www.resolutionfoundation.org/publications/seeking-public-value/
73
• Other professional bodies: both the Association of Chartered Certified
Accountants (ACCA) and the Institute of Chartered Accountants in England
and Wales (ICAEW) have presented analysis of WGA data.
Qualifications
3.21 The 2018-19 WGA audit opinion has been qualified as a result of
qualifications in underlying accounts and as a result of issues relating to the
boundary, non-coterminous year ends and accounting policies applied by the
Treasury when carrying out the WGA consolidation.
Qualifications in underlying accounts
3.22 A small number of entities have audit qualifications to their accounts. The
qualifications are caused by weaknesses that need to be managed by the relevant
Accounting Officer (or equivalent) and cannot be managed by the WGA Accounting
Officer.
3.23 Those qualifications that are material to WGA are summarised below:
• The Ministry of Defence (MOD) has not applied IFRIC 4 ‘Determining
whether an Arrangement Contains a Lease’ to all of its contracts. The MOD
believes there are a number of contracts that should be accounted for as
leasers, but it does not have accurate information to enable it to do so. The
impact on the financial statements of not applying IFRIC 4 is that
contractors’ assets held under finance leases and the associated liabilities
have been excluded from the Statement of Financial Position.
Consequently, the Comptroller & Auditor-General qualified his opinion on
the accounts of the Ministry of Defence on the basis that a material value
of leased assets and liabilities were omitted from its Statement of Financial
Position.
• both the Department of Work and Pensions and HM Revenue and
Customs’ Trust statement accounts received qualified audit opinions due to
the level of fraud and error being material to the overall audit opinion on
the regularity of the accounts
Qualifications from the consolidation process
3.24 The qualifications which arise from the consolidation process are those
relating to the boundary, accounting policies and non-coterminous year ends and
are summarised below:
• The boundary qualification arises as a result of WGA excluding certain
bodies from the consolidation. The largest of the bodies to be excluded is
the Royal Bank of Scotland (RBS). The scale and nature of RBS activities
would distort the picture of UK finances. This qualification will remain as
long as RBS is in public ownership.
• The qualification on inconsistent accounting policies mainly relates to
different methods used in valuing infrastructure assets. The largest
difference remaining is the valuation of the local authority road network
which will remain as a qualification in the medium term.
74
• The non-coterminous year ends qualification mainly relates to the inclusion
of academy schools which have a year end of 31 August, as opposed to
the 31 March date used by WGA.
3.25 Further details on the boundary and accounting treatment of infrastructure
assets are included in the critical accounting estimates and judgements in Note 2 to
the accounts. Further details on the qualification arising from the academies sector
are included below.
WGA and the Academies sector
3.26 Academies have a financial year which aligns with the academic year. DfE
has alternative reporting arrangements for the academies sector as agreed with the
Treasury and Parliament. The DfE core department, its agencies and arms length
bodies prepare one set of accounts to 31 March. The academies sector prepare a
separate sector account, to a year end of 31 August (known as the Sector Annual
Report and Accounts, or SARA). This data creates a non-coterminous year end
misalignment with the rest of WGA, and this in turn leads to a qualification to
WGA.
3.27 It is not practicable to change the Academies year end to 31 March, as this
will cause significant disruption to the sector, and cause misalignment between the
internal activities of Academies (which would normally be planned over the course
of an academic year) and financial reporting and planning.
3.28 The key challenge is to determine how similar or different a 31 March
balance would be to the 31 August balance from 7 months earlier, which is the
balance consolidated into WGA. Balances such as property, plant and equipment,
tend to increase steadily. The balance at 31 August 2017 was £46.7 billion and this
was included in the 2017-18 WGA. We now know that the 31 August 2018 balance
was £52.5 billion (which has been included in this 2018-19 WGA) and that the
balance as at 31 March 2018 is likely to be in between those two figures, giving an
estimated maximum error of £5.8 billion on last year’s figure. Once the SARA for the
year ended 31 August 2019 is published later this year it will be possible to similarly
estimate the error on the £52.5 billion of property, plant and equipment included in
this year’s WGA.
3.29 Balances such as cash, may vary more within a year. Given the size of these
balances, a material difference between 31 August and 31 March balances is not
anticipated, and the Treasury and DfE will continue to work together on the
evidence base to support the 31 March position and any adjustments that may be
required. It should be noted that the effect of COVID-19 on the schooling process,
may cause variances in trend data used to support the preparation of Academies
financial performance as at 31 March.

75
Comparing balance sheet positions
Item (£bn) SARA balance 31 August 2018 (included in the 2018-19 WGA)
SARA balance 31 August 2017
(included in the 2017-18 WGA)
Estimated Maximum amount of variance between 31 August
and 31 March.
Property Plant and
equipment
52.5 46.7 5.8
Cash and cash
equivalents
3.9 3.5 n/k
Other assets 1.4 1.5 0.1
Pension Deficit 6.6 7.0 0.4
Other liabilities 2.3 2.2 0.1
Source: SARA
Balancing timeliness, quality and cost effectiveness of data
3.30 While there have been significant improvements in the quality of WGA over
time, the accounts remain qualified. However, three of these qualification issues are
partly driven by the same underlying root cause:
• The qualification relating to MOD remains, in part, because it would not be
cost effective to review the contracts to identify arrangements that may
amount to a lease.
• The qualification relating to highways infrastructure remains, in part,
because it would not be cost effective to change accounting valuations
within Local Authorities only for the benefit of WGA.
• The qualification relating to Academies non-coterminous year end remains,
in part because it would not be cost effective to require separate 31 March
returns from the Academies sector, this involves almost 8,000 entities.
3.31 In preparing WGA, I must balance the timeliness, cost effectiveness and
quality of the accounts. Significant financial outlay to provide changes to WGA
reporting and disclosures has to be carefully considered. While I will continue to
improve WGA, it is important to acknowledge that some of the issues outlined
above may not have a cost-effective solution. Where I determine this to be the case,
I will consider how supplementary disclosures or information can be used to
improve the quality of the accounts.
Assurance in making this judgement
3.32 I have assessed the WGA compliance with the Corporate Governance in
Central Government Departments Code of Good Practice. I believe that we comply
with the provisions of the Code that are relevant to my responsibilities to prepare
WGA.
3.33 I am satisfied that there is no additional remedial action to improve the
quality of the data at this present time. This is because some improvements will take
several years to implement fully. In part, this is because lessons are being learned
76
after the accounts of the previous year have been completed. I have procedures in
place to monitor the progress being made to tackle these weaknesses.
3.34 I have considered the evidence that supports this governance statement and
I am assured that the Treasury has a strong framework of controls to support the
production of WGA.
Information and data handling
3.35 In preparing WGA, HM Treasury does not collect any personal data from
WGA entities. WGA data collected from WGA entities are held on HM Treasury’s
Online System for Central Accounting and Reporting (OSCAR) database.
Disclosure of information to auditors
3.36 As Accounting Officer, I confirm that there is no relevant audit information
of which the NAO is unaware. I have taken all the necessary steps to make myself
aware of any relevant audit information and to establish that the NAO is aware of
that information.
3.37 I confirm that this annual report and accounts 2018-19 is, as a whole, fair,
balanced and understandable. I take personal responsibility for the annual report
and accounts, including the judgements required for determining that it is fair,
balanced and understandable.
Catherine Little
Accounting Officer
17 July 2020
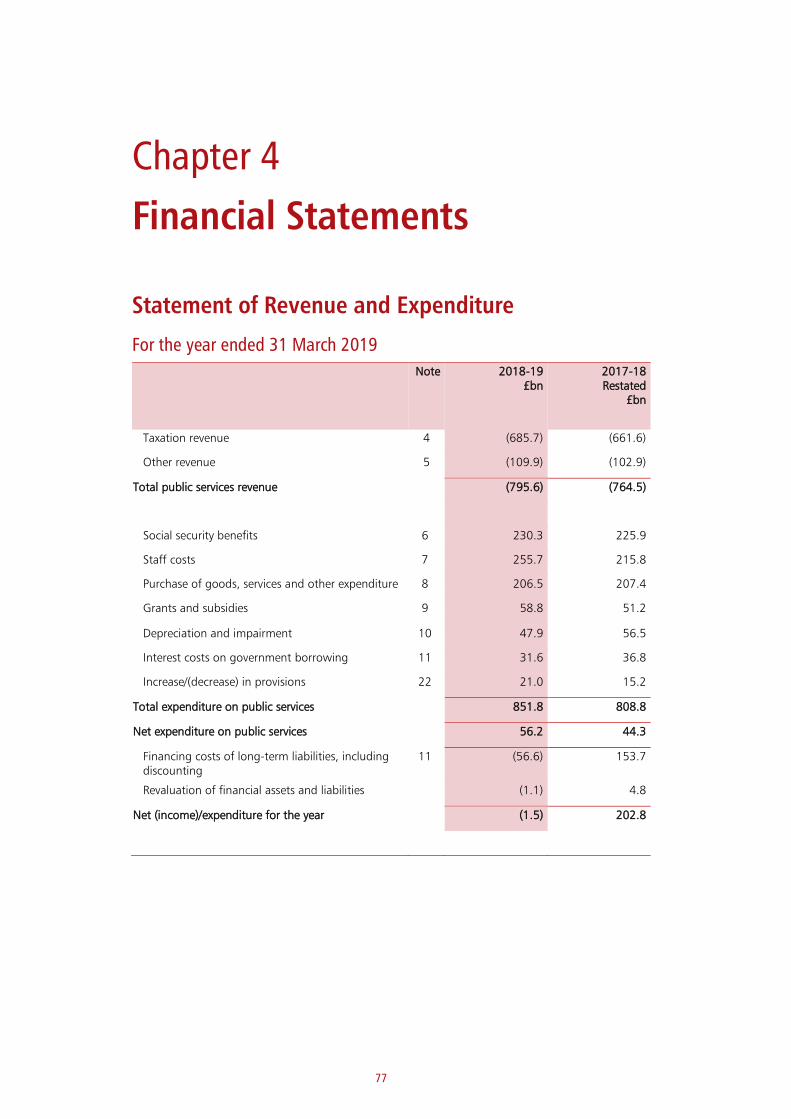
77
Chapter 4
Financial Statements
Statement of Revenue and Expenditure
For the year ended 31 March 2019
Note 2018-19 £bn
2017-18 Restated
£bn
Taxation revenue 4 (685.7) (661.6)
Other revenue 5 (109.9) (102.9)
Total public services revenue (795.6) (764.5)
Social security benefits 6 230.3 225.9
Staff costs 7 255.7 215.8
Purchase of goods, services and other expenditure 8 206.5 207.4
Grants and subsidies 9 58.8 51.2
Depreciation and impairment 10 47.9 56.5
Interest costs on government borrowing 11 31.6 36.8
Increase/(decrease) in provisions 22 21.0 15.2
Total expenditure on public services 851.8 808.8
Net expenditure on public services 56.2 44.3
Financing costs of long-term liabilities, including discounting
11 (56.6) 153.7
Revaluation of financial assets and liabilities (1.1) 4.8
Net (income)/expenditure for the year (1.5) 202.8

78
Statement of Comprehensive Income and Expenditure
For the year ended 31 March 2019
Note 2018-19 £bn
2017-18 Restated
£bn
Net (income)/expenditure for the year (1.5) 202.8
Other comprehensive income and expenditure:
Net (gain)/loss on:
(49.8) (36.1)
(0.1) (0.7)
(1.0)
Revaluation of property, plant and equipment
Revaluation of intangible assets
Revaluation of assets measured at Fair Value
through Other Comprehensive Income
Revaluation of pension scheme liabilities (38.6)
(76.4) Other comprehensive income and expenditure
Total comprehensive (income)/ expenditure for the year
(119.2) 126.4
(117.7)
(71.1)
3.3

79
Statement of Financial Position
As at 31 March 2019
Note 2018-19 £bn
2017-18 Restated
£bn
Non-current assets
Property, plant and equipment 12 1,268.0 1,208.4
Investment property 13 22.9 20.0
Intangible assets 14 37.4 36.0
Trade and other receivables 15 17.9 19.1
Other financial assets 16 320.6 323.3
1,666.8 1,606.8
Current assets
Inventories 17 9.7 9.9
Trade and other receivables 15 172.4 160.8
Other financial assets 16 194.3 184.3
Cash and cash equivalents 18 44.2 34.3
Gold holdings 9.9 9.4
Assets held for sale 1.5 8.3
432.0 407.0
Total assets 2,098.8 2,013.8
Current liabilities
Trade and other payables 19 (133.3) (126.8)
Government borrowings 20 (307.2) (275.6)
Other financial liabilities 21 (652.1) (654.0)
Provisions 22 (17.7) (16.4)
(1,110.3) (1,072.8)
Non-current liabilities
Trade and other payables 19 (58.6) (64.4)
Government borrowings 20 (1,100.0) (1,071.8)
Other financial liabilities 21 (98.1) (98.8)
Provisions 22 (293.7) (406.1)
Net public sector pension liability 24 (1,893.9) (1,865.3)
(3,444.3) (3,506.4)
Total liabilities (4,554.6) (4,579.2)
Net liabilities (2,455.8) (2,565.4)
Financed by taxpayers’ equity:
General reserve (3,018.6) (3,134.0)
Revaluation reserve 558.6 564.5
Other reserves 4.2 4.1
Total liabilities to be funded by future revenues (2,455.8) (2,565.4)

80
The financial statements and supporting notes on pages 81-178 and Annex A form part of these accounts.
Catherine Little
Accounting Officer
17 July 2020
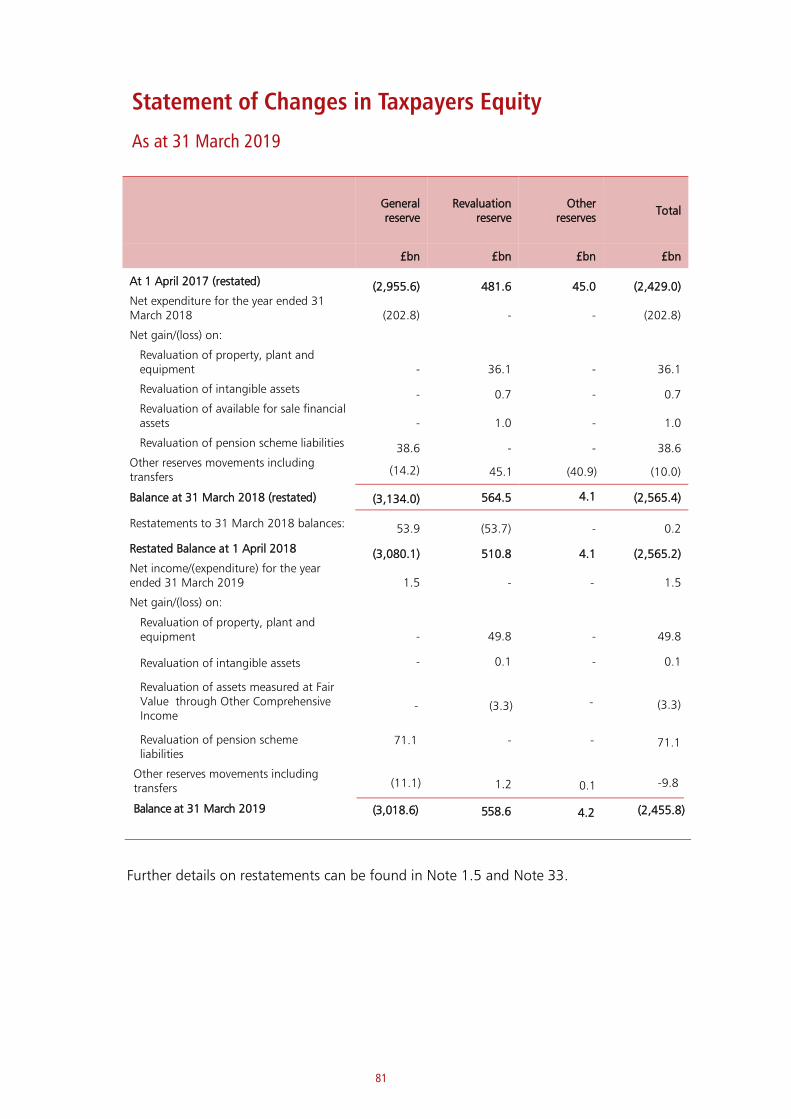
81
Statement of Changes in Taxpayers Equity
As at 31 March 2019
General reserve
Revaluation reserve
Other reserves
Total
£bn £bn £bn £bn
At 1 April 2017 (restated) (2,955.6) 481.6 45.0 (2,429.0) Net expenditure for the year ended 31 March 2018 (202.8) - - (202.8)
Net gain/(loss) on:
Revaluation of property, plant and equipment - 36.1 - 36.1
Revaluation of intangible assets - 0.7 - 0.7 Revaluation of available for sale financial assets - 1.0 - 1.0
Revaluation of pension scheme liabilities 38.6 - - 38.6Other reserves movements including transfers
(14.2) 45.1 (40.9) (10.0)
Balance at 31 March 2018 (restated) (3,134.0) 564.5 4.1 (2,565.4)
Restatements to 31 March 2018 balances: 53.9 (53.7) - 0.2
Restated Balance at 1 April 2018 (3,080.1) 510.8 4.1 (2,565.2) Net income/(expenditure) for the year ended 31 March 2019 1.5 - - 1.5
Net gain/(loss) on:
- 49.8 - 49.8
- 0.1 - 0.1
- (3.3) -
Revaluation of property, plant and equipment Revaluation of intangible assets
Revaluation of assets measured at Fair Value through Other Comprehensive Income
Revaluation of pension scheme liabilities
71.1 - -
(3.3)
(11.1) 1.2 0.1 -9.8Other reserves movements including transfers
Balance at 31 March 2019 (3,018.6) 558.6 4.2 (2,455.8)
Further details on restatements can be found in Note 1.5 and Note 33.
71.1

82
Statement of Cash Flows
For the year ended 31 March 2019
Note 2018-19
£bn
2017-18 restated
£bn
Cash flows from operating activities
Net operating expenditure for public services SoRE (56.2) (44.3)
Adjustments for non-cash transactions 163.8 141.6
Adjustment for non-operating transactions 28.3 32.3
(Increase)/decrease in inventories - (0.6)
(Increase)/decrease in trade and other receivables (12.1) (7.5)
Increase/(decrease) in trade and other payables 0.7 5.5
Net cash movement for the provision of pensions (42.7) (41.5)
Use of provisions (13.3) (10.1)
Net cash inflow/(outflow) from operating activities 68.5 75.4
Cash flows from capital expenditure and financial investment
Purchase of non-financial assets (63.7) (62.6)
Proceeds from disposal of non-financial assets 5.6 3.1
Net cash inflow/(outflow) from purchase and disposal of
financial assets and liabilities
16.0 (47.6)
Net cash inflow/(outflow) from capital expenditure and
financial investment
(42.1) (107.1)
Cash flows from financing activities
Interest received 7.1 8.1
Financing costs of long-term liabilities, including
discounting
(49.4) (13.7)
Finance charges paid on finance leases and PFI contracts (6.4) (4.7)
Net Borrowings 32.2 48.0
Net cash inflow/(outflow) from financing activities (16.5) 37.7
Net increase/(decrease) in cash and cash equivalents 18 9.9 6.0
Cash and cash equivalents at the beginning of the year 18 34.3 28.3
Cash and cash equivalents at the end of the year 18 44.2 34.3
83
Notes to the accounts
Note 1. Statement of accounting policies
1.1 Basis of preparation
The financial statements have been prepared in accordance with the ‘Government Resources and Accounts Act 2000’ (GRAA) and International Financial Reporting Standards (IFRS), as adapted and interpreted by the Financial Reporting Manual (FReM). Several public bodies consolidated into these financial statements do not follow the FReM. For example, local authorities follow the IFRS-based Code of Practice on Local Authority Accounting. Adjustments are made on consolidation to harmonise accounting policies where material and any exceptions are noted in these accounting policies. In adopting the going concern basis for preparing the financial statements, the Accounting Officer has considered the government’s power to set tax rates to meet its funding requirements, as well as controls over public spending, which ensure that the government will continue to exercise its functions.
1.2 Accounting convention
The financial statements have been prepared under the historical cost convention, modified where appropriate to account for the revaluation of certain assets and liabilities as set out in these accounting policies.
1.3 Basis of consolidation
The financial statements consolidate a group of entities that appears to HM Treasury to exercise functions of a public nature, or to be entirely or substantially funded from public money. This group includes:
• central government bodies including departments, arm’s length bodies,
agencies and the NHS
• local government bodies such as councils, police and crime commissioners,
combined authorities and transport bodies (such as Transport for London)
• public corporations
• the devolved administrations of Scotland, Wales and Northern Ireland The Whole of Government Accounts (WGA) boundary is based on the Office for National Statistics (ONS) classification of the public sector to ensure the accounts are consistent and comparable to other measures of financial performance, such as the National Accounts. There are areas where the boundary diverges from the ONS classification, most significantly the exclusion of Royal Bank of Scotland (RBS), and further details are provided in the critical accounting estimates and judgements in Note 2. WGA is prepared by consolidating financial data provided by components based on their own audited statutory accounts, wherever possible. For components with transactions and balances over certain thresholds, the financial data provided for consolidation is reviewed by the component’s own auditor to confirm consistency with the audited statutory accounts. Those thresholds are £2 billion for central government bodies and £0.5 billion for local government bodies, applicable to any of income, expenditure, assets excluding property, plant and equipment, or liabilities excluding pension liabilities.
84
WGA also does not include small bodies (those with assets, liabilities, income and expenditure less than £20 million), and a small number of entities that report directly to Parliament, such as the National Audit Office.
A list of all the entities consolidated in the financial statements is published on gov.uk. 1.4 Accounting standards in issue but not yet effective
The following new standards have been issued but are not yet effective: IFRS 16 'Leases' was issued in January 2016, effective for periods beginning on or after 1 January 2019. The FReM has deferred the public sector’s adoption of IFRS 16 Leases, until 2020-21, however it will now be adopted by the public sector in 2021-22 because of challenges to ‘business as usual’ posed by COVID-19. IFRS 16 replaces IAS 17 ‘Leases’ and represents a significant change in lessee accounting. It removes the distinction between operating and finance leases for lessees by introducing a single lessee accounting model that requires a lessee to recognise assets and liabilities for all leases with a term of more than 12 months, unless the underlying asset is of low value. It is not possible to identify the impact of IFRS 16 on WGA at this stage, as it depends on work carried out at individual organisations to identify the impact within their own accounts. The impact is expected to be material. IFRS 17 ‘Insurance Contracts’ was issued in May 2017 and applies to annual reporting periods beginning on or after 1 January 2021 (subject to EU endorsement). IFRS 17 establishes the principles for the recognition, measurement, presentation and disclosure of insurance contracts within the scope of the standard. The objective of IFRS 17 is to ensure that an entity provides relevant information that faithfully represents those contracts. This information gives a basis for users of financial statements to assess the effect that insurance contracts have on the entity's financial position, financial performance and cash flows. Once effective, IFRS 17 will replace IFRS 4 Insurance Contracts. It is not possible at this time to quantify the impact of IFRS 17 on WGA, as this will be dependent on choices made on the scope and applicability of the standard to the public sector, and work done within individual entities to assess the impact on their own business. There are no other IFRS or International Financial Reporting Interpretations Committee (IFRIC) interpretations not yet effective that would be expected to have a material impact on WGA.
1.5 New accounting standards adopted in the year
The following new standards have been adopted in year: IFRS 9 'Financial Instruments' replaces IAS 39 'Financial Instruments: Recognition and Measurement' and was adopted by the public sector from 1 April 2018. The FReM removes the option to adopt IFRS 9 retrospectively, and therefore adjustments to the carrying amounts of financial assets and liabilities at the date of transition have been recognised in the opening retained earnings and other reserves of the current period. In addition, amendments to IFRS 7 'Financial Instruments: Disclosures' have also been applied to the current period only. IFRS 9 introduces new requirements for the classification, measurement and impairment of financial assets and liabilities. IFRS 9 contains three principal classification categories for
85
financial assets: amortised cost, fair value through other comprehensive income (FVTOCI), and fair value through profit or loss (FVTPL). A financial asset is classified into one of these three categories based on how it is managed and its contractual cash flow characteristics. Under IFRS 9, a financial asset is impaired using a forward-looking expected credit loss model which replaces the previous incurred loss model under IAS 39. IFRS 9 contains two classification categories for financial liabilities: amortised cost or fair value through profit or loss (FVTPL). The accounting policy for financial assets is in accounting policy Note 1.21 and the impairment methodology is detailed in Note 23, financial instruments. There are three areas where it impacts WGA:
• classification and measurement of financial assets
• classification and measurement of financial liabilities
• impairment of financial assets
The most significant of these are the impact on financial assets and especially those disclosed within Note 23 (financial instruments) and Note 16 (other financial assets). The key changes are shown in the “Financial assets by category table” in Note 23. No changes are required to the corresponding “Financial labilities by category” table. Similarly, there are no changes to the fair value hierarchy tables within Note 23. The only new requirement in IFRS 9 for financial liabilities relates to the changes in the fair value of an entity’s own debt instruments under the fair value option. This new requirement is to prevent entities from recognising gains in profit and loss when their credit quality declines. This is unlikely to be a problem for government entities with most financial liabilities being measured at amortised cost; with the notable exception of financial liabilities held for trading (including derivative liabilities) which are measured at fair value through profit or loss. IFRS 9’s impairment requirements of financial assets apply to:
• debt instruments - loans, trade receivables and debt securities measured at
amortised cost or fair value through other comprehensive income (FVTOCI)
• lease receivables
• contract assets within the scope of IFRS 15
• certain financial guarantees and loan commitments
All equity investments, measured at either fair value through profit or loss (FVTPL) or FVTOCI, and other financial instruments measured at FVTPL, are outside the scope of IFRS 9’s impairment model. IAS 39’s impairment model of “incurred loss” is replaced with a more forward-looking “expected credit loss” (ECL) model. Under IFRS 9, it is no longer necessary for a loss event to have occurred before credit losses are recognised. WGA is now required to recognise either a 12-month or lifetime ECL, depending on whether there has been a significant increase in credit risk since initial recognition. The ECL model applies to both debt instruments accounted for at amortised cost and at FVTOCI. The WGA note most affected by the changes to the impairment of financial assets, under IFRS 9 is Note 15 (trade and other receivables). The first-time adoption of IFRS 9 means that the 2017-18 comparative figures for trade and other receivables compiled under IAS 39 are calculated on a different basis to those shown for 2018-19 under IFRS 9. Any comparison between the two periods needs to be qualified in these terms.

86
IFRS 15 'Revenue from Contracts with Customers’ replaces IAS 18 'Revenue' and IAS 11 'Construction Contracts' and has been adopted by the public sector from 1 April 2018. As with IFRS 9, the FReM removes the option to adopt IFRS 15 retrospectively, and therefore any difference between the previous carrying amount and the carrying amount under IFRS 15 has been recognised as adjustments to opening balances on 1 April 2018. IFRS 15 provides a principles-based approach for revenue recognition and introduces the concept of recognising revenue for performance obligations as they are satisfied. The standard requires revenue to be recognised at the point of control passing to the customer, which can be over time or at a single point in time. Furthermore, it requires an assessment to be undertaken for each performance obligation within the contract or service provided and this may impact the timing of when revenue is recognised. Most government income streams are not dependent on satisfying performance obligations within a contractual arrangement; therefore, this new standard has a limited impact on most government entities. For example, government income relating to taxation, levies, licensing, and other fees and charges are not generally dependent upon contractual obligations being met by government. There is an impact on some revenue streams, specifically those disclosed in Note 5 – Other Revenue. IFRS 15 impacts on the recognition of other revenue, and the accounting policy is in accounting policy Note 1.7. In order to apply the principles above, IFRS 15 introduces a five-step model to account for revenues: 1. identify the contract with a customer 2. identify the performance obligations in the contract 3. determine the transaction price 4. allocate the transaction price to the performance obligations in the contract 5. recognise revenue when the performance obligation is satisfied Current grants and capital grants, European Union Funding, venture capital, repayable launch investment, interest income and dividend income are outside the scope of IFRS 15. Also, IFRS 15 does not apply to non-exchange transactions such as taxation, fines and penalties. These transactions are covered in IFRS 15 paragraph 15. It states that when a contract with a customer does not meet the criteria in IFRS 15 paragraph 9 and an entity receives consideration from the customer, the entity shall recognise the consideration received as revenue only when either of the following events has occurred:
• the entity has no remaining obligations to transfer goods or services to the
customer and all, or substantially all, of the consideration promised by the
customer has been received by the entity and is non-refundable; or
• the contract has been terminated and the consideration received from the
customer is non-refundable
The most significant disclosure changes within WGA related to IFRS 15 is in Note 15, where current and non-current contract assets are now recognised when an entity has transferred goods and services to a customer and the right to consideration is conditional on something other than the passage of time; such as the fulfilment of other performance criteria specified within the contract. Contract assets are different from trade receivables because a trade receivable is an unconditional right to receive payment subject to the passage of time.
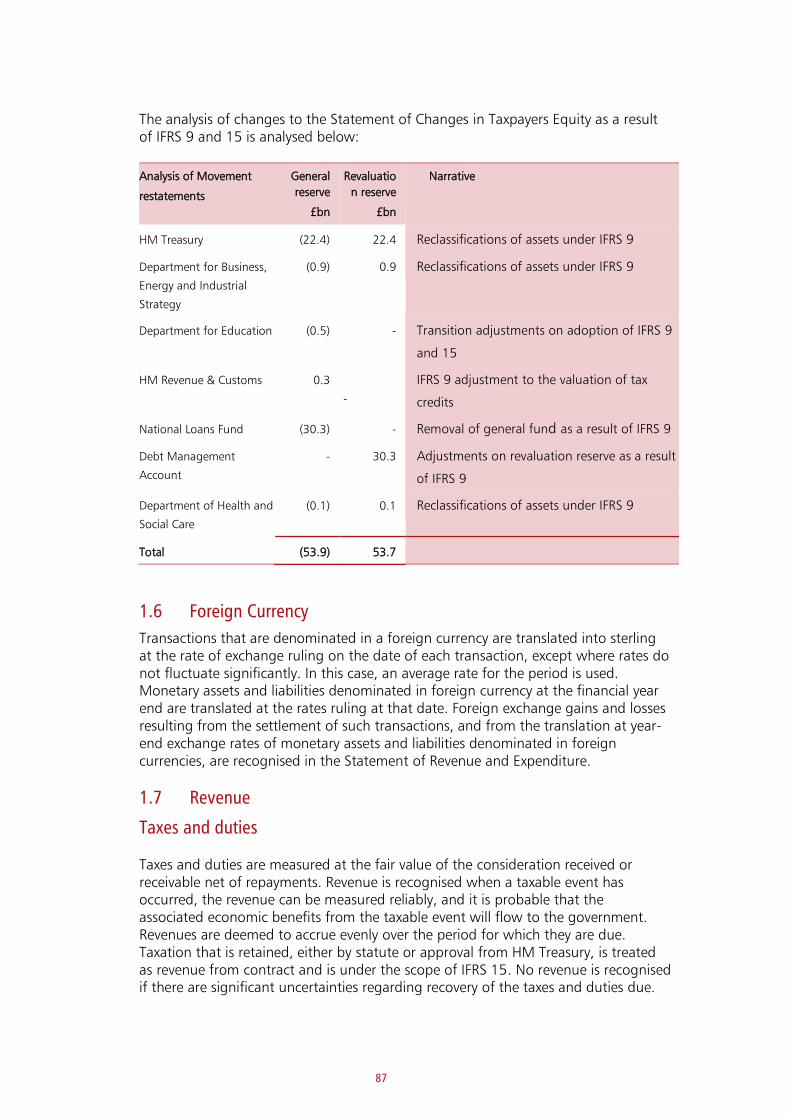
87
The analysis of changes to the Statement of Changes in Taxpayers Equity as a result of IFRS 9 and 15 is analysed below:
Analysis of Movement
restatements
General
reserve
£bn
Revaluatio
n reserve
£bn
Narrative
HM Treasury (22.4) 22.4 Reclassifications of assets under IFRS 9
Department for Business,
Energy and Industrial
Strategy
(0.9) 0.9 Reclassifications of assets under IFRS 9
Department for Education (0.5) - Transition adjustments on adoption of IFRS 9
and 15
HM Revenue & Customs 0.3
-
IFRS 9 adjustment to the valuation of tax
credits
National Loans Fund (30.3) - Removal of general fund as a result of IFRS 9
Debt Management
Account
- 30.3 Adjustments on revaluation reserve as a result
of IFRS 9
Department of Health and
Social Care
(0.1) 0.1 Reclassifications of assets under IFRS 9
Total (53.9) 53.7
1.6 Foreign Currency
Transactions that are denominated in a foreign currency are translated into sterling at the rate of exchange ruling on the date of each transaction, except where rates do not fluctuate significantly. In this case, an average rate for the period is used. Monetary assets and liabilities denominated in foreign currency at the financial year end are translated at the rates ruling at that date. Foreign exchange gains and losses resulting from the settlement of such transactions, and from the translation at year-end exchange rates of monetary assets and liabilities denominated in foreign currencies, are recognised in the Statement of Revenue and Expenditure.
1.7 Revenue
Taxes and duties Taxes and duties are measured at the fair value of the consideration received or receivable net of repayments. Revenue is recognised when a taxable event has occurred, the revenue can be measured reliably, and it is probable that the associated economic benefits from the taxable event will flow to the government. Revenues are deemed to accrue evenly over the period for which they are due. Taxation that is retained, either by statute or approval from HM Treasury, is treated as revenue from contract and is under the scope of IFRS 15. No revenue is recognised if there are significant uncertainties regarding recovery of the taxes and duties due.
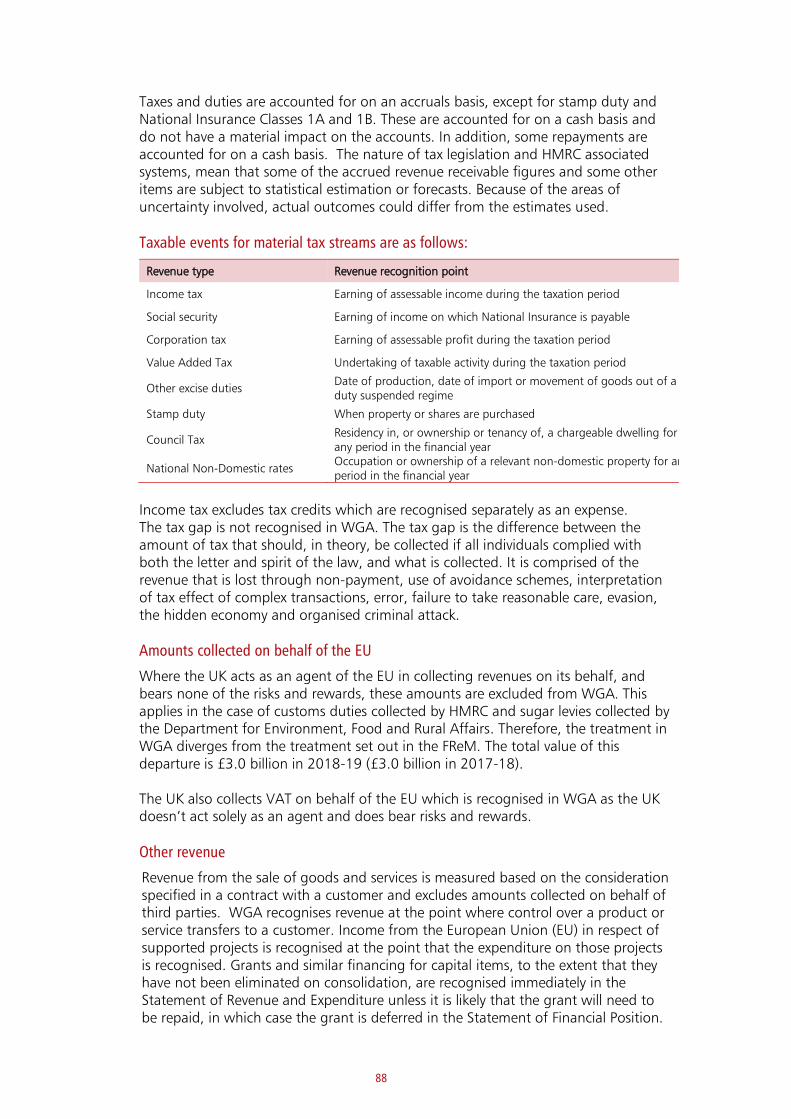
88
Taxes and duties are accounted for on an accruals basis, except for stamp duty and National Insurance Classes 1A and 1B. These are accounted for on a cash basis and do not have a material impact on the accounts. In addition, some repayments are accounted for on a cash basis. The nature of tax legislation and HMRC associated systems, mean that some of the accrued revenue receivable figures and some other items are subject to statistical estimation or forecasts. Because of the areas of uncertainty involved, actual outcomes could differ from the estimates used.
Taxable events for material tax streams are as follows:
Revenue type Revenue recognition point
Income tax Earning of assessable income during the taxation period
Social security Earning of income on which National Insurance is payable
Corporation tax Earning of assessable profit during the taxation period
Value Added Tax Undertaking of taxable activity during the taxation period
Other excise duties Date of production, date of import or movement of goods out of a duty suspended regime
Stamp duty When property or shares are purchased
Council Tax Residency in, or ownership or tenancy of, a chargeable dwelling for any period in the financial year
National Non-Domestic rates Occupation or ownership of a relevant non-domestic property for any period in the financial year
Income tax excludes tax credits which are recognised separately as an expense. The tax gap is not recognised in WGA. The tax gap is the difference between the amount of tax that should, in theory, be collected if all individuals complied with both the letter and spirit of the law, and what is collected. It is comprised of the revenue that is lost through non-payment, use of avoidance schemes, interpretation of tax effect of complex transactions, error, failure to take reasonable care, evasion, the hidden economy and organised criminal attack.
Amounts collected on behalf of the EU
Where the UK acts as an agent of the EU in collecting revenues on its behalf, and bears none of the risks and rewards, these amounts are excluded from WGA. This applies in the case of customs duties collected by HMRC and sugar levies collected by the Department for Environment, Food and Rural Affairs. Therefore, the treatment in WGA diverges from the treatment set out in the FReM. The total value of this departure is £3.0 billion in 2018-19 (£3.0 billion in 2017-18). The UK also collects VAT on behalf of the EU which is recognised in WGA as the UK doesn’t act solely as an agent and does bear risks and rewards.
Other revenue
Revenue from the sale of goods and services is measured based on the consideration specified in a contract with a customer and excludes amounts collected on behalf of third parties. WGA recognises revenue at the point where control over a product or service transfers to a customer. Income from the European Union (EU) in respect of supported projects is recognised at the point that the expenditure on those projects is recognised. Grants and similar financing for capital items, to the extent that they have not been eliminated on consolidation, are recognised immediately in the Statement of Revenue and Expenditure unless it is likely that the grant will need to be repaid, in which case the grant is deferred in the Statement of Financial Position.
89
1.8 Expenditure
Social security benefits
Social security benefits are statutory entitlements payable to private individuals and
households and include the state pension. Social security benefits are accounted for
as expenditure in the period to which they relate. Social security benefits include tax
credits, which are recognised in the year in which claims are assessed and awards
authorised. Where under or overpayments are identified, either during the award
year or subsequently, over time most of this is recovered.
Staff costs
Staff costs include salaries and wages, the costs of pensions and other employee benefits. Staff costs that can be attributed directly to the construction of an asset have been capitalised. Average staff numbers include staff engaged on capital projects. Public sector pension scheme costs include current service costs and past service costs, both of which are explained in further detail in accounting policy Note 1.20.
Grants and subsidies
Grants and subsidies are recorded as expenditure during the period that the underlying event or activity giving entitlement to the grant occurs. Entitlement to a grant varies according to the details of individual schemes and the terms of the offers made. Unpaid and unclaimed grants are charged to the Statement of Revenue and Expenditure on the basis of estimates of claims not received and are included in accruals in the Statement of Financial Position.
Interest costs
Interest costs on government borrowing are determined using the effective interest rate method. The effective interest rate is the rate that discounts estimated future cash flows to the debt instrument’s initial carrying amount. Most government borrowings are at fixed interest rates. For variable rate borrowings the current rate applicable to that product is used and this treatment is also applied to index-linked borrowings. Gilts with the same maturity and coupon rate are sometimes issued in separate tranches and may have a different effective interest rate due to market conditions. However, once issued, gilts with the same maturity and coupon rate are indistinguishable from each other and so are treated as one issue using a weighted average effective interest rate.
1.9 Property, plant and equipment
Property, plant and equipment are initially recognised at cost and subsequently valued at current value in existing use. For non-specialised assets, such as offices, this is the market value based on its current use less depreciation. For specialised assets, including the road and rail network held by central government, this is replacement cost less depreciation. However, road network assets held by local government, Northern Ireland Department for Infrastructure and Scottish Water infrastructure assets and some others are valued at historical cost less depreciation. Further details on the accounting estimates involved in valuing infrastructure assets are included in the critical accounting estimates and judgements in Note 2.
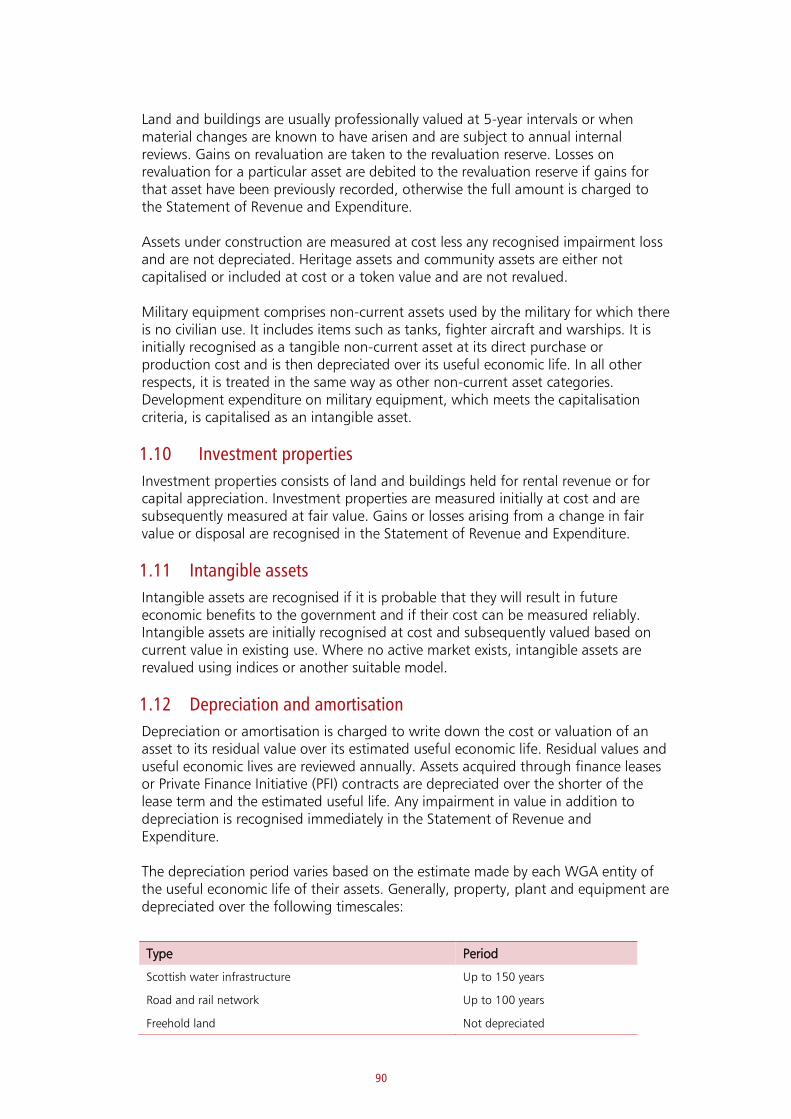
90
Land and buildings are usually professionally valued at 5-year intervals or when material changes are known to have arisen and are subject to annual internal reviews. Gains on revaluation are taken to the revaluation reserve. Losses on revaluation for a particular asset are debited to the revaluation reserve if gains for that asset have been previously recorded, otherwise the full amount is charged to the Statement of Revenue and Expenditure. Assets under construction are measured at cost less any recognised impairment loss and are not depreciated. Heritage assets and community assets are either not capitalised or included at cost or a token value and are not revalued. Military equipment comprises non-current assets used by the military for which there is no civilian use. It includes items such as tanks, fighter aircraft and warships. It is initially recognised as a tangible non-current asset at its direct purchase or production cost and is then depreciated over its useful economic life. In all other respects, it is treated in the same way as other non-current asset categories. Development expenditure on military equipment, which meets the capitalisation criteria, is capitalised as an intangible asset.
1.10 Investment properties
Investment properties consists of land and buildings held for rental revenue or for capital appreciation. Investment properties are measured initially at cost and are subsequently measured at fair value. Gains or losses arising from a change in fair value or disposal are recognised in the Statement of Revenue and Expenditure.
1.11 Intangible assets
Intangible assets are recognised if it is probable that they will result in future economic benefits to the government and if their cost can be measured reliably. Intangible assets are initially recognised at cost and subsequently valued based on current value in existing use. Where no active market exists, intangible assets are revalued using indices or another suitable model.
1.12 Depreciation and amortisation
Depreciation or amortisation is charged to write down the cost or valuation of an asset to its residual value over its estimated useful economic life. Residual values and useful economic lives are reviewed annually. Assets acquired through finance leases or Private Finance Initiative (PFI) contracts are depreciated over the shorter of the lease term and the estimated useful life. Any impairment in value in addition to depreciation is recognised immediately in the Statement of Revenue and Expenditure. The depreciation period varies based on the estimate made by each WGA entity of the useful economic life of their assets. Generally, property, plant and equipment are depreciated over the following timescales:
Type Period
Scottish water infrastructure Up to 150 years
Road and rail network Up to 100 years
Freehold land Not depreciated

91
Buildings Up to 60 years
Assets under construction Not depreciated
Military equipment Up to 35 years
Plant and machinery Up to 30 years
Transport equipment Up to 50 years
IT equipment Up to 10 years
Furniture and fittings Up to 20 years
Investment properties Not depreciated
Intangible assets are typically amortised over the following timescales:
Type Period
Military equipment Up to 35 years
Development expenditure Up to 35 years
Other intangible assets Up to 15 years
1.13 Inventories
Inventories are valued at the lower of cost and net realisable value. Where there is no expectation of consumption or sale in the ordinary course of business, the value is impaired to reduce it to net realisable value. Until 2018-19, the Ministry of Defence held inventory at current cost based on replacement purchase price or estimated through indexation. This change in accounting policy was accounted for as an in-year adjustment and was not material to WGA (net value of £228 million).
1.14 Cash and cash equivalents
Cash and cash equivalents comprise cash in hand and current balances with banks and other financial institutions. They are readily convertible to known amounts of cash, are subject to insignificant risk of changes in value and have an original maturity of three months or less. The carrying amount of these assets approximates their fair value.
1.15 Gold holdings
Gold is valued at fair value based on the sterling equivalent of the London Bullion Market Association dollar denominated spot bid price at the reporting date. Changes in fair value are recognised in the Statement of Revenue and Expenditure.
1.16 Trade and other receivables
Trade and other receivables are recognised initially at fair value and subsequently at amortised cost. IFRS 9 allows entities to apply a 'simplified approach' for trade receivables, contract assets and lease receivables. The simplified approach allows entities to recognise lifetime expected losses on all these assets without the need to identify significant increases in credit risk. An entity may select its accounting policy for trade receivables, lease receivables and contract assets independently of each other, these are recognised in the Statement of Revenue and Expenditure.
92
In WGA Note 15, trade and other receivables, contract assets are being shown separately for the first time following the introduction of IFRS 15.
1.17 Leases
Leases in which a significant proportion of the risks and rewards of ownership are transferred to government are finance leases and the leased assets are treated as if they had been purchased. The corresponding liability to the leasing company is shown as a finance lease liability and the accounts distinguish between payments of interest and capital. All other leases are operating leases and the costs in respect of operating leases are recognised in the Statement of Revenue and Expenditure on a straight-line basis. The Ministry of Defence has not applied IFRIC 4 ‘Determining whether an Arrangement Contains a Lease’ to all its contracts. Further information regarding this departure from the FReM can be found in Chapter 3.
1.18 Private Finance Initiatives (PFI)
PFI contracts in which the government controls or regulates the services that the private sector operator must provide with the assets; and controls any significant residual interest in the asset at the end of the contract, are recorded on the government’s balance sheet as if they had been purchased. The corresponding liability to the PFI operator is recognised as a PFI liability and the accounts distinguish between payments of interest, capital and charges for services. If the above conditions are not met, then the private sector provider recognises the asset and all payments are recognised as charges for services. Several WGA entities have PFI contracts which should not be recognised on the Statement of Financial Position because, under IFRIC 12, the private sector contractor was, on balance, considered to have greater control over the use of the asset. WGA entities reported these off-balance sheet contracts in their accounts in different ways in 2018-19, as the accounting standards allow flexibility as to how to present the information. Therefore, it is not possible to provide a summary of all PFI contracts in this account.
1.19 Provisions
Provisions are recognised when the government has a present obligation as a result of a past event and it is probable that the government will be required to settle that obligation. Provisions are measured at the best estimate of the expenditure required to settle the present obligation at the reporting date and are discounted to present value where the time value of money is material. Where some or all the expenditure required to settle a provision is expected to be recovered from a third party, the recoverable amount is treated as an asset. The net provision expense after deducting expected recoveries from third parties is recognised in the Statement of Revenue and Expenditure.
93
1.20 Pension liabilities
The pension liability relates to public sector pension liabilities for current and former government employees, plus a small component for other approved organisations that qualify for membership of these government schemes. The government operates both defined benefit and defined contribution pension schemes. The defined benefit pension schemes are either funded (meaning that the scheme is a separate entity, which receives contributions and invests them to fund pension payments) or unfunded (meaning that there is no separate fund and the government is directly liable to fund pension payments as they fall due). The pension liability excludes the state pension paid to the general public which is included within overall expenditure and recorded as welfare spend. State pension future liability is not recognised in the accounts.
For defined benefit pension schemes, the difference between the fair value of scheme assets (if any) and the present value of the scheme liability is recognised as a net asset or net liability on the Statement of Financial Position. The scheme liability is calculated by discounting expected future benefit payments back to the reporting date using a discount rate based on high quality corporate bonds, usually interpreted as corporate bonds with a credit rating of AA. The expected future benefit payments are calculated allowing for pensionable service to the reporting date, future increases to benefits in accordance with scheme rules (known as the projected unit method) and projections of earnings for current employees up to the date of retirement, leaving service or early death. The pension liability is therefore an estimate of the amount of money that would need to be invested in high quality corporate bonds at the reporting date to cover all the expected future benefit payments accrued up to the reporting date.
Current service costs are the increase in the present value of the scheme liabilities arising from current members’ service over the year. They are determined by the individual scheme actuaries and are calculated using the discount rate at the start of the year. Past service costs are changes in the present value of the scheme liabilities related to employee service in prior periods arising in the current period as a result of the introduction, change, or improvement to retirement benefits. These also include any gains or losses in relation to events defined as settlements or curtailments. Pension financing costs are the decrease during the period in the present value of the scheme liabilities because the benefits are one period closer to settlement. The financing cost is based on the discount rate (including inflation) at the start of the year and is calculated on the gross liability of unfunded schemes (which is shown gross) and the net liability of funded schemes (i.e. net of assets). The gains and losses on revaluation reflect three elements:
• the change in the underlying assumptions used by the actuaries to
determine the value of scheme liabilities. This includes changes in the
assumptions such as financial assumptions, mortality rates and projected
salary increases
• where in-year experience differs from assumptions previously used to
determine the liabilities. For example, relating to assumptions about
general salary and pension increases
94
• differences between the asset returns experienced in-year and the interest
on the assets included in the Statement of Revenue and Expenditure for
funded schemes
The current service costs, any past service costs, including those arising from settlements or curtailments, and pension financing costs are recognised as an increase in the pension liability and are charged to the Statement of Revenue and Expenditure. The gain or loss on revaluation of pension scheme assets and liabilities is recognised in the Statement of Other Comprehensive Income.
Payments to defined contribution pension schemes are recognised in the Statement of Revenue and Expenditure as they fall due.
All equity investments, measured at either fair value through profit or loss (FVTPL) or fair value through other comprehensive income (FVTOCI), and other financial instruments measured at FVTPL, are outside the scope of IFRS 9’s impairment model.
1.21 Financial Instruments
Financial assets
Financial assets classified as FVTPL are initially recognised at fair value and transaction costs are recognised as expenditure in the Statement of Revenue and Expenditure. Regular purchases and sales of financial assets are recognised at the trade date, which is the date on which the entity commits to purchase or sell the asset, or, in the case of loans and advances to financial counterparties, at the settlement date.
Financial assets are categorised as one of the following:
1. Amortised cost for financial assets whose cash flows are solely payments ofprincipal and interest and the business model of which is to hold those financialassets in order to collect contractual cash flows. They are initially recognised at fairvalue and thereafter at amortised cost using the effective interest method less anyimpairment. The effective interest rate method is a method of calculating theamortised cost of a financial asset and of recognising and allocating interestincome over the relevant period.
2. Fair Value Through Other Comprehensive Income (FVTOCI) in the case of:
• debt instruments whose cash flows are the sole payments of principal and
interest and held within the business model whose objective is achieved by
both collecting contractual cash flows and selling the financial assets
• equity instruments that are neither held for trading nor contingent
consideration recognised in a business combination
• after initial recognition, these assets are subsequently carried at fair value.
Gains and losses in fair value are recognised directly in equity. On de-
recognition, the cumulative gain or loss previously recognised in equity is
recognised in the Statement of Revenue and Expenditure
3. Fair value through profit or loss (FVTPL) for any financial assets that are notmeasured at amortised cost or FVTOCI. This category includes derivatives and
95
investments in equity instruments, unless an irrevocable election is made on initial recognition to classify as FVTOCI. The election is only available to equity instruments that are not held for trading. Transactions costs and any subsequent movements in the valuation of assets held at FVTPL are recognised in the Statement of Revenue and Expenditure.
Financial assets other than equity instruments and those at FVTPL are assessed for impairment at each reporting date using the expected credit loss model as introduced by IFRS 9, and impairments are recognised in the Statement of Revenue and Expenditure. Financial assets are derecognised when the rights to receive future cash flows have expired or are transferred and the risks and rewards of ownership have been substantially transferred. IFRS 9 impairment requirements for financial assets apply to: 1. debt instruments – loans, trade receivables and debt securities measured at amortised cost or fair value through other comprehensive income (FVTOCI) 2. lease receivables 3. contract assets within the scope of IFRS 15 4. certain financial guarantees and loan commitments
Financial liabilities Most of the government’s financial liabilities are classified at amortised cost. The exceptions are deposits by banks which can also be classified at fair value through profit or loss, IMF Special Drawing Rights allocation which are classified at fair value through profit or loss and derivatives which are classified at fair value through profit or loss.
1.22 Contingent liabilities and contingent assets
Contingent liabilities and contingent assets are not recognised as liabilities or assets in the Statement of Financial Position but are disclosed in the notes to the accounts. A contingent liability is a possible obligation arising either from past events whose existence will be confirmed only by uncertain future events, or a present obligation arising from past events which is not recognised because either an outflow of economic benefit is not probable or the amount of the obligation cannot be reliably measured. A contingent asset is a possible asset whose existence will be confirmed only by the occurrence of one or more uncertain future events not wholly within the control of the entity. Where the time value of money is material, the contingent liabilities and assets are stated at discounted amounts.
96
Note 2. Critical accounting estimates and judgements
2.1 WGA boundary
The Government Resources and Accounts Act (GRAA) 2000 requires HM Treasury to prepare WGA for “a group of bodies each of which appears to HM Treasury (a) to exercise functions of a public nature, or (b) to be entirely or substantially funded from public money”. In complying with the GRAA, HM Treasury has made a judgement to base the consolidation boundary on entities classified to the public sector by the Office for National Statistics (ONS). This has the benefit of aligning the boundary of WGA to the boundary for national accounts and increases the usefulness of WGA as a tool for understanding the public finances.
The exceptions to this policy are: • WGA excludes a small number of entities such as the National Audit Office, Crown Estate and Audit Scotland that are accountable to their respective parliaments or assemblies rather than to an executive arm of the government, and therefore do not form part of government. The total impact of excluding these bodies from WGA is estimated to be £1.3 billion of gross expenditure and £17.5 billion of net assets. Some of these amounts would be eliminated on consolidation. Over £14.3 billion of the net assets not included in WGA are reflected in the Crown Estate. • Minor entities are excluded on the basis that they are too small to have any material impact on WGA. The criteria used for minor bodies in 2018-19 was that they had to have gross expenditure, income, assets and liabilities of less than £20 million (2017-18 £20 million). For example, this includes some district councils. The total impact of excluding minor bodies is estimated to be £0.5 billion of gross expenditure and £0.09 billion of net assets. Some of these amounts would be eliminated on consolidation. The WGA also does not include some other bodies such as English Further Education colleges, Trust Ports and most significantly the Royal Bank of Scotland (RBS).
RBS
RBS is recognised as an investment of government rather than being consolidated. This is on the basis that the scale of RBS would dwarf other aspects of WGA, distorting the accounts and making it difficult to determine trends. It would also be very technically challenging to consolidate RBS due to the differences in accounting policies and year-end. The government does not intend to retain its shares in RBS for the long-term, and has started to sell its holding, which makes the time and cost of consolidation less worthwhile. The table below sets out the estimated effect of excluding RBS from the consolidation. It is based on RBS’s financial results for the year ended 31 December 2018. It does not include an estimate of the changes required to align the year-end or accounting policies.
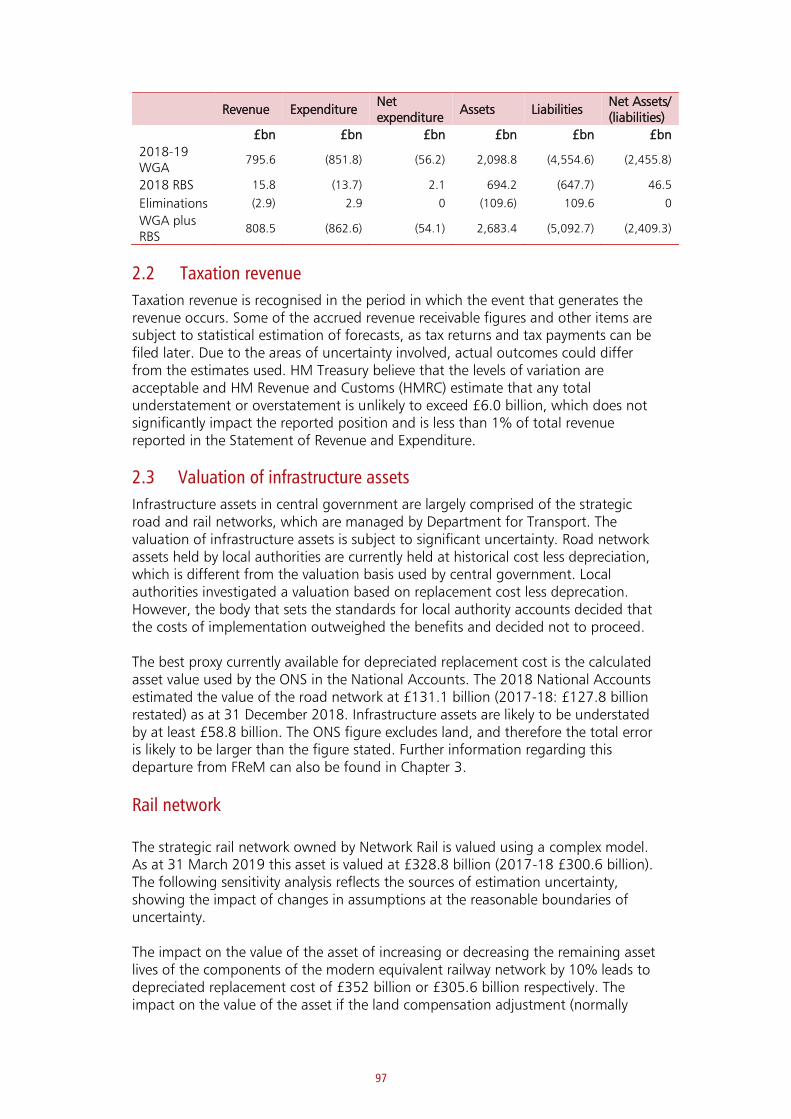
97
Revenue Expenditure Net expenditure
Assets Liabilities Net Assets/ (liabilities)
£bn £bn £bn £bn £bn £bn
2018-19 WGA
795.6 (851.8) (56.2) 2,098.8 (4,554.6) (2,455.8)
2018 RBS 15.8 (13.7) 2.1 694.2 (647.7) 46.5
Eliminations (2.9) 2.9 0 (109.6) 109.6 0
WGA plus RBS
808.5 (862.6) (54.1) 2,683.4 (5,092.7) (2,409.3)
2.2 Taxation revenue
Taxation revenue is recognised in the period in which the event that generates the revenue occurs. Some of the accrued revenue receivable figures and other items are subject to statistical estimation of forecasts, as tax returns and tax payments can be filed later. Due to the areas of uncertainty involved, actual outcomes could differ from the estimates used. HM Treasury believe that the levels of variation are acceptable and HM Revenue and Customs (HMRC) estimate that any total understatement or overstatement is unlikely to exceed £6.0 billion, which does not significantly impact the reported position and is less than 1% of total revenue reported in the Statement of Revenue and Expenditure.
2.3 Valuation of infrastructure assets
Infrastructure assets in central government are largely comprised of the strategic road and rail networks, which are managed by Department for Transport. The valuation of infrastructure assets is subject to significant uncertainty. Road network assets held by local authorities are currently held at historical cost less depreciation, which is different from the valuation basis used by central government. Local authorities investigated a valuation based on replacement cost less deprecation. However, the body that sets the standards for local authority accounts decided that the costs of implementation outweighed the benefits and decided not to proceed. The best proxy currently available for depreciated replacement cost is the calculated asset value used by the ONS in the National Accounts. The 2018 National Accounts estimated the value of the road network at £131.1 billion (2017-18: £127.8 billion restated) as at 31 December 2018. Infrastructure assets are likely to be understated by at least £58.8 billion. The ONS figure excludes land, and therefore the total error is likely to be larger than the figure stated. Further information regarding this departure from FReM can also be found in Chapter 3.
Rail network The strategic rail network owned by Network Rail is valued using a complex model. As at 31 March 2019 this asset is valued at £328.8 billion (2017-18 £300.6 billion). The following sensitivity analysis reflects the sources of estimation uncertainty, showing the impact of changes in assumptions at the reasonable boundaries of uncertainty. The impact on the value of the asset of increasing or decreasing the remaining asset lives of the components of the modern equivalent railway network by 10% leads to depreciated replacement cost of £352 billion or £305.6 billion respectively. The impact on the value of the asset if the land compensation adjustment (normally
98
65%) were to increase or decrease by 10% would lead to depreciated replacement cost of £334.7 billion or £322.9 billion respectively.
The impact on the value of the asset if the adjustment for building on a greenfield site rather than in an operational environment (normally 32%) were to increase or decrease by 10%, an adjustment of 42% or 22%, would lead to a depreciated replacement cost of £332.6 billion or £325.0 billion respectively. This adjustment applies only to costing rates built up using a methodology not already reflecting greenfield build.
The impact on the value of the asset of an adjustment to the risk factor applied to the overall Depreciated Replacement Cost (DRC) valuations, currently 22%, by an increase or decrease of 10% would lead to a depreciated replacement cost of £346.4 billion or £308.6 billion respectively.
Strategic Road Network
The strategic road network owned by Highways England is valued using a complex model. As at 31 March 2019 this asset is valued at £121.2 billion (2017-18 £116.1 billion).
The valuation relies on accounting estimates and is subject to estimation uncertainties. The following sensitivity analysis reflects the sources of estimation uncertainty, showing the impact of changes in assumptions at the reasonable boundaries of uncertainty.
There are three possible scenarios considered. The scenario with the largest range variation shows the impact on the value of the asset of increasing or decreasing the costing rates by 10% would lead to depreciated replacement cost of £133.1 billion or £109.3 billion respectively.
2.4 Financial assets
Student loans
Due to the implementation of IFRS 9, student loans are carried at fair value through profit or loss (FVTPL). The FReM requires that where future cash flows are discounted to measure fair value, the higher of the rate intrinsic to the financial instrument or HMT’s current discount rate should be used. The discount rate used to discount expected cash flows to calculate the fair value of student loans is the intrinsic rate of the loan for Master’s loans, and HMT’s standard cross-government discount rate of RPI+0.7% (2017-18: RPI+0.7%) for the remainder of the loan books, as required by the FReM’s interpretation of IFRS 9.
The fair value calculation also takes into account an estimate of the value of student loans which will not be repaid because of the policy decisions made by the government for the loans to be written off in certain circumstances such as death, disability or the age of the student. This estimate is sensitive to assumptions on borrowers’ earnings which are based on latest forecasts from the Office for Budget Responsibility.
The method for determining the carrying value of the student loan book in the accounts is set by the FReM and is likely to be higher than the amount that they could be sold for. This is because the discount rate used by a market investor in

99
valuing the future cash flows would likely be higher given that the investment is riskier than gilts.
Term Funding Scheme (TFS) loans Loans made by the Bank of England Asset Purchase Facility Fund Limited (BEAPFF) through the Term Funding Scheme (TFS) and associated scheme fees are valued on present value methodology, using expected future cash flows and discounted using Bank Rate to provide a net present value. The discount rate adopted is deemed appropriate as it represents the funding cost to BEAPFF of providing the loans. The deviation away from using a ‘market implied rate’ is justified as TFS loans are unique in their nature, provided at an indiscriminate rate to achieve the policies set by the Bank of England in its function as a central bank. As such there is not an equivalent product or market with which to compare. All participants that have drawn on TFS have been assessed at the end of the reference period running from 30 June 2016 to 31 December 2017 against their level of net lending. For participants whose net lending over the reference period is negative, an additional scheme fee over Bank Rate has been applied to the cost of the loan. As part of the transfer of TFS loans to the Bank of England on 21 January 2019, the nominal value of the loans was de-recognised from the balance sheet having met the criteria per IFRS 9. Ahead of the transfer of these assets, it was agreed that BEAPFF would continue to receive any scheme fees, being those additional scheme fees above Bank Rate payable on balances outstanding at the date of transfer. As such these scheme fees remained on BEAPFF’s balance sheet and are included in other assets.
2.5 Public sector pension liability
The assessment of the pension liabilities requires various assumptions about future unknowns in order to determine the expected future benefit payments. These assumptions include life expectancy, employee turnover rates, projections of price inflation and projections of earnings for current employees. A discount rate is then required to discount the future benefit payments to produce a net present value. The key financial assumptions used by the actuaries of government pension schemes to determine the 2018-19 and 2017-18 WGA pension liabilities are set out below:

100
2018-19 2017-18
Unfunded Funded Unfunded Funded
central
government
local
government
local
government
central
government
local
government
local
government
% % % % % %
Rate of
increase in
salaries
4.10
1.00 - 4.40 2.00 - 4.40 3.95 1.00 – 4.30 2.40 – 4.20
Rate of
increase of
Pensions in
Payment
2.60 2.00 - 4.40 2.00 – 3.90 2.45 1.80 – 4.30 1.80 – 3.80
Discount
rate - real
0.29 0.1
Discount
rate -
nominal
2.90 2.00 - 3.00 2.00 – 3.00 2.55 1.80 – 10.00 2.30 – 3.40
Price
inflation
assumption
2.6 1.70 - 4.00 0.40 – 4.00 2.45 1.00 – 3.60 1.00 – 3.80
2.6 Provision for nuclear decommissioning
Nuclear Decommissioning Authority’s (NDA’s) nuclear decommissioning provision forms the bulk of the overall government provision for nuclear decommissioning and represents the best estimate of the costs of decommissioning plant and equipment on their designated nuclear licenced sites to return them to pre-agreed end states in accordance with the Authority’s published strategy. NDA’s programme of work will take until the year 2137. The estimate is necessarily based on assumptions regarding processes and methods likely to be used to discharge the obligations, reflecting a combination of latest available technical knowledge, requirements of the existing regulatory regime, government policy and commercial agreements. Given the very long timescale involved and the complexity of the plants and material being handled, considerable uncertainty remains in the estimates of future costs, particularly in later years. The estimate is updated to reflect changed circumstances and more recent knowledge and changed assumptions; as a result, material adjustments could be made to the carrying amount of the nuclear decommissioning provision and related assets and liabilities in the future. The principal assumptions and sensitivities around the cost estimates were reviewed and updated by NDA management as at 31 March 2019.
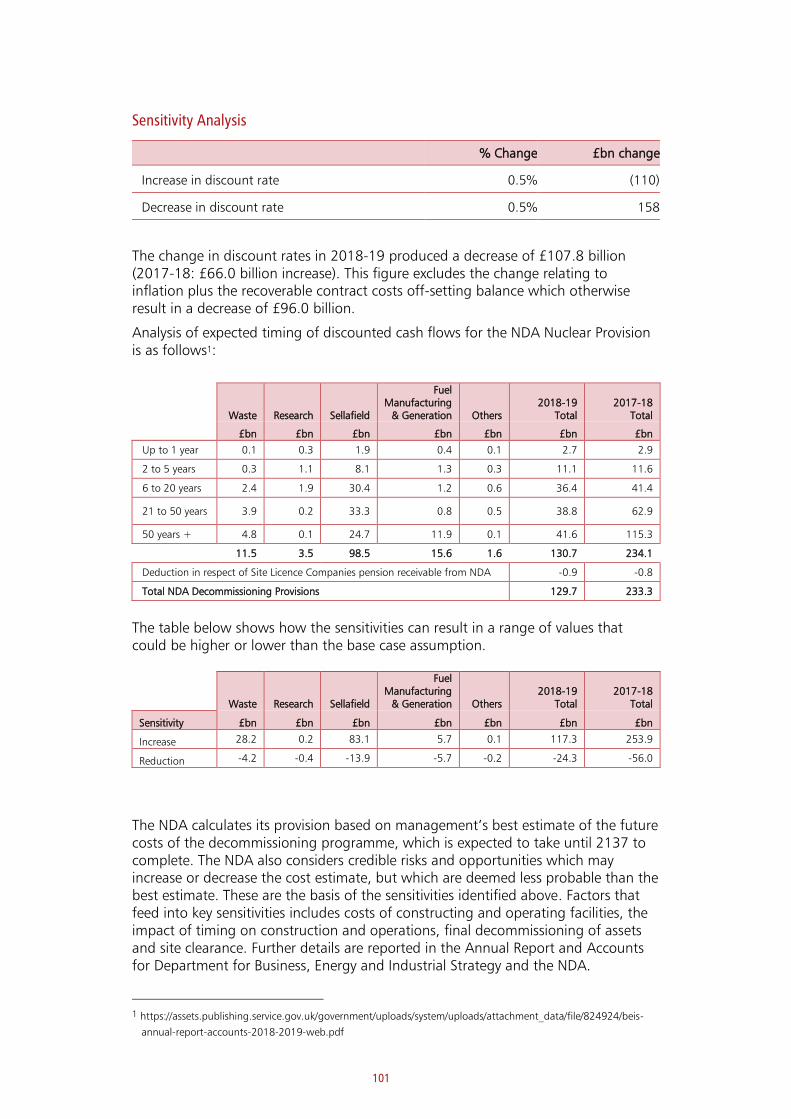
101
Sensitivity Analysis
% Change £bn change
Increase in discount rate 0.5% (110)
Decrease in discount rate 0.5% 158
The change in discount rates in 2018-19 produced a decrease of £107.8 billion (2017-18: £66.0 billion increase). This figure excludes the change relating to inflation plus the recoverable contract costs off-setting balance which otherwise result in a decrease of £96.0 billion.
Analysis of expected timing of discounted cash flows for the NDA Nuclear Provision is as follows1:
Waste Research Sellafield
Fuel Manufacturing
& Generation Others 2018-19
Total 2017-18
Total
£bn £bn £bn £bn £bn £bn £bn
Up to 1 year 0.1 0.3 1.9 0.4 0.1 2.7 2.9
2 to 5 years 0.3 1.1 8.1 1.3 0.3 11.1 11.6
6 to 20 years 2.4 1.9 30.4 1.2 0.6 36.4 41.4
21 to 50 years 3.9 0.2 33.3 0.8 0.5 38.8 62.9
50 years + 4.8 0.1 24.7 11.9 0.1 41.6 115.3
11.5 3.5 98.5 15.6 1.6 130.7 234.1
Deduction in respect of Site Licence Companies pension receivable from NDA -0.9 -0.8
Total NDA Decommissioning Provisions 129.7 233.3
The table below shows how the sensitivities can result in a range of values that could be higher or lower than the base case assumption.
Waste Research Sellafield
Fuel Manufacturing
& Generation Others 2018-19
Total 2017-18
Total
Sensitivity £bn £bn £bn £bn £bn £bn £bn
Increase 28.2 0.2 83.1 5.7 0.1 117.3 253.9
Reduction -4.2 -0.4 -13.9 -5.7 -0.2 -24.3 -56.0
The NDA calculates its provision based on management’s best estimate of the future costs of the decommissioning programme, which is expected to take until 2137 to complete. The NDA also considers credible risks and opportunities which may increase or decrease the cost estimate, but which are deemed less probable than the best estimate. These are the basis of the sensitivities identified above. Factors that feed into key sensitivities includes costs of constructing and operating facilities, the impact of timing on construction and operations, final decommissioning of assets and site clearance. Further details are reported in the Annual Report and Accounts for Department for Business, Energy and Industrial Strategy and the NDA.
1 https://assets.publishing.service.gov.uk/government/uploads/system/uploads/attachment_data/file/824924/beis-
annual-report-accounts-2018-2019-web.pdf
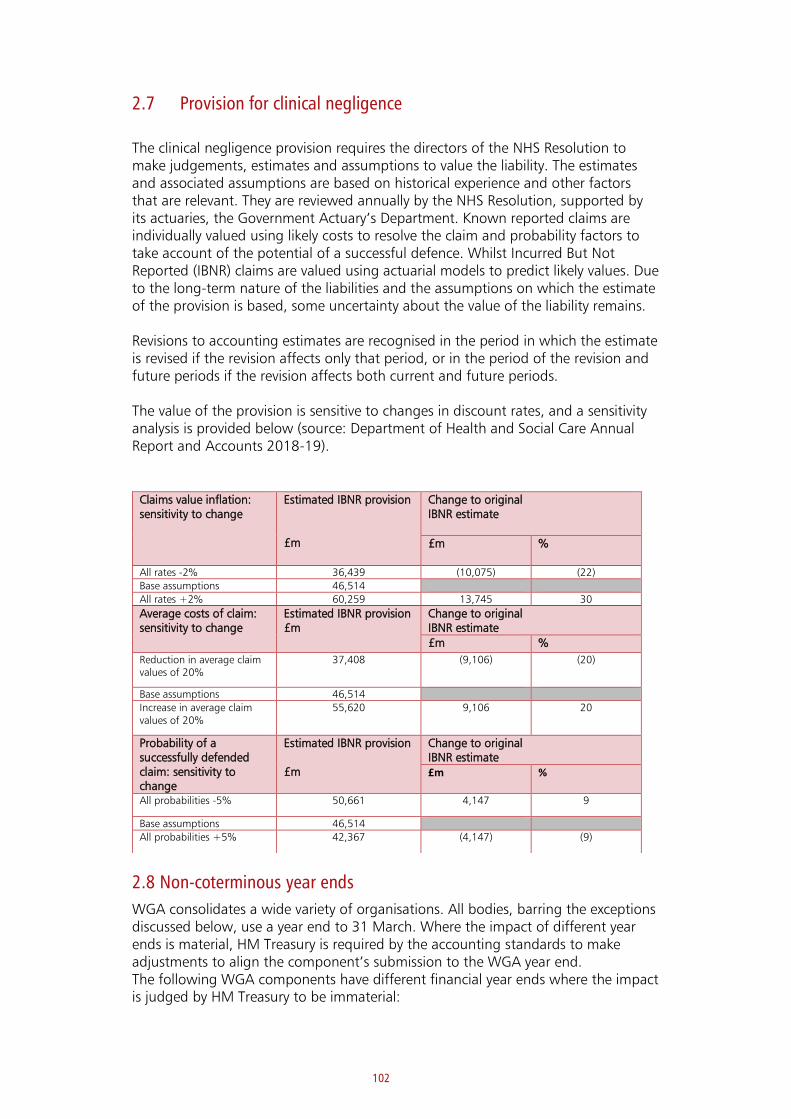
102
2.7 Provision for clinical negligence
The clinical negligence provision requires the directors of the NHS Resolution to make judgements, estimates and assumptions to value the liability. The estimates and associated assumptions are based on historical experience and other factors that are relevant. They are reviewed annually by the NHS Resolution, supported by its actuaries, the Government Actuary’s Department. Known reported claims are individually valued using likely costs to resolve the claim and probability factors to take account of the potential of a successful defence. Whilst Incurred But Not Reported (IBNR) claims are valued using actuarial models to predict likely values. Due to the long-term nature of the liabilities and the assumptions on which the estimate of the provision is based, some uncertainty about the value of the liability remains. Revisions to accounting estimates are recognised in the period in which the estimate is revised if the revision affects only that period, or in the period of the revision and future periods if the revision affects both current and future periods. The value of the provision is sensitive to changes in discount rates, and a sensitivity analysis is provided below (source: Department of Health and Social Care Annual Report and Accounts 2018-19).
2.8 Non-coterminous year ends
WGA consolidates a wide variety of organisations. All bodies, barring the exceptions discussed below, use a year end to 31 March. Where the impact of different year ends is material, HM Treasury is required by the accounting standards to make adjustments to align the component’s submission to the WGA year end. The following WGA components have different financial year ends where the impact is judged by HM Treasury to be immaterial:
Claims value inflation: sensitivity to change
Estimated IBNR provision £m
Change to original IBNR estimate
£m %
All rates -2% 36,439 (10,075) (22)
Base assumptions 46,514
All rates +2% 60,259 13,745 30
Average costs of claim: sensitivity to change
Estimated IBNR provision £m
Change to original IBNR estimate
£m %
Reduction in average claim values of 20%
37,408 (9,106) (20)
Base assumptions 46,514
Increase in average claim values of 20%
55,620 9,106 20
Probability of a successfully defended claim: sensitivity to change
Estimated IBNR provision £m
Change to original IBNR estimate £m %
All probabilities -5% 50,661 4,147 9
Base assumptions 46,514
All probabilities +5% 42,367 (4,147) (9)

103
• Commonwealth Development Corporation - year end to 31 December • Northern Ireland and Scottish FE colleges - year end to 31 July • Channel 4 - year end to 31 December • Bank of England – year end to 28 February • National Physics Laboratory – year end to 31 December • Navy, Army and Air Force Institute - year end to 28 April • Northern Ireland Transport Holding Company – year end to 25 March • British Nuclear Fuels - year end to 30 June The following WGA components have different financial year ends where the impact is judged by HM Treasury to be material:
Academies sector
The Academies sector annual report and accounts has a year end to 31 August 2018. The account is compiled and published by the Department for Education. The Department was unable to estimate, to a material level of accuracy, the adjustments required to reflect their financial position and performance to 31 March. WGA therefore reflects the Academies sector to 31 August 2018, with no adjustments made. The main impact of this misalignment is in property, plant and equipment (where academies report net book value of £52.6 billion) and pension liabilities (where academies report a pension deficit of £6.5 billion). The academies sector is also subject to a qualification based on accuracy and completeness of the comparative land and buildings values and based on accuracy of the opening revaluation reserve balance. More details can be found in the Comptroller and Auditor General’s certificate and report in chapter 5.
2.9 Contracts for difference (CfDs)
CfDs are a mechanism used to support investment in UK green energy projects. CfDs have been established as a contract between the ‘Generator’ and the Low Carbon Contracts Company (LCCC), a company wholly owned by the government and consolidated within the Department for Business, Energy and Industrial Strategy (BEIS). WGA includes several CfDs on the Statement of Financial Position. In addition to the recognised contracts, there is a contract for Hinkley Point C that has not been recognised but is disclosed in BEIS Annual report 2018-19. The valuation for CfDs is dependent on several assumptions including: • changes to discount rate • proportion of electricity lost as it passes from the generator to the supplier • start date of the contract • inflation • forecast future wholesale electricity prices • installed capacity of the project as reflected in the contract • the actual power output of the project compared to its rated installed capacity (known as the load factor) Further details on the assumptions can be found in the accounts of the Department of Business, Energy and Industrial strategy and Note 23 financial instruments.
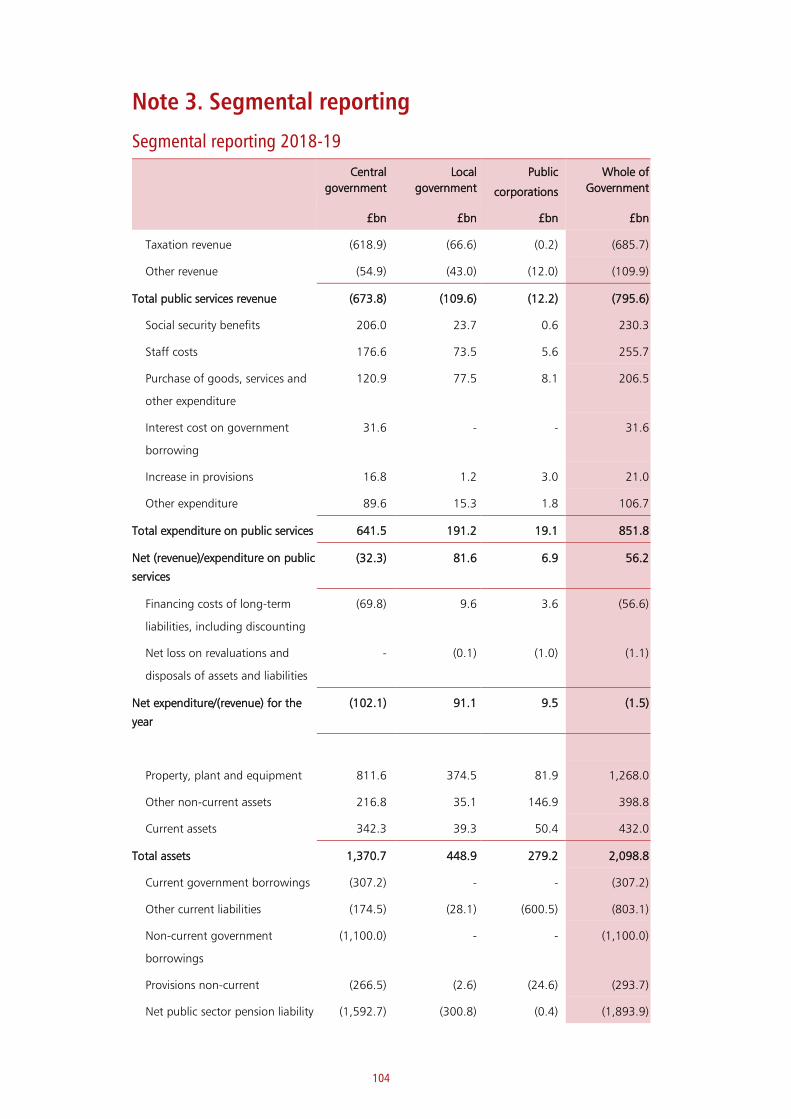
104
Note 3. Segmental reporting
Segmental reporting 2018-19
Central
government
Local
government
Public
corporations
Whole of
Government
£bn £bn £bn £bn
Taxation revenue (618.9) (66.6) (0.2) (685.7)
Other revenue (54.9) (43.0) (12.0) (109.9)
Total public services revenue (673.8) (109.6) (12.2) (795.6)
Social security benefits 206.0 23.7 0.6 230.3
Staff costs 176.6 73.5 5.6 255.7
Purchase of goods, services and
other expenditure
120.9 77.5 8.1 206.5
Interest cost on government
borrowing
31.6 - - 31.6
Increase in provisions 16.8 1.2 3.0 21.0
Other expenditure 89.6 15.3 1.8 106.7
Total expenditure on public services 641.5 191.2 19.1 851.8
Net (revenue)/expenditure on public
services
(32.3) 81.6 6.9 56.2
Financing costs of long-term
liabilities, including discounting
(69.8) 9.6 3.6 (56.6)
Net loss on revaluations and
disposals of assets and liabilities
- (0.1) (1.0) (1.1)
Net expenditure/(revenue) for the
year
(102.1) 91.1 9.5 (1.5)
Property, plant and equipment 811.6 374.5 81.9 1,268.0
Other non-current assets 216.8 35.1 146.9 398.8
Current assets 342.3 39.3 50.4 432.0
Total assets 1,370.7 448.9 279.2 2,098.8
Current government borrowings (307.2) - - (307.2)
Other current liabilities (174.5) (28.1) (600.5) (803.1)
Non-current government
borrowings
(1,100.0) - - (1,100.0)
Provisions non-current (266.5) (2.6) (24.6) (293.7)
Net public sector pension liability (1,592.7) (300.8) (0.4) (1,893.9)
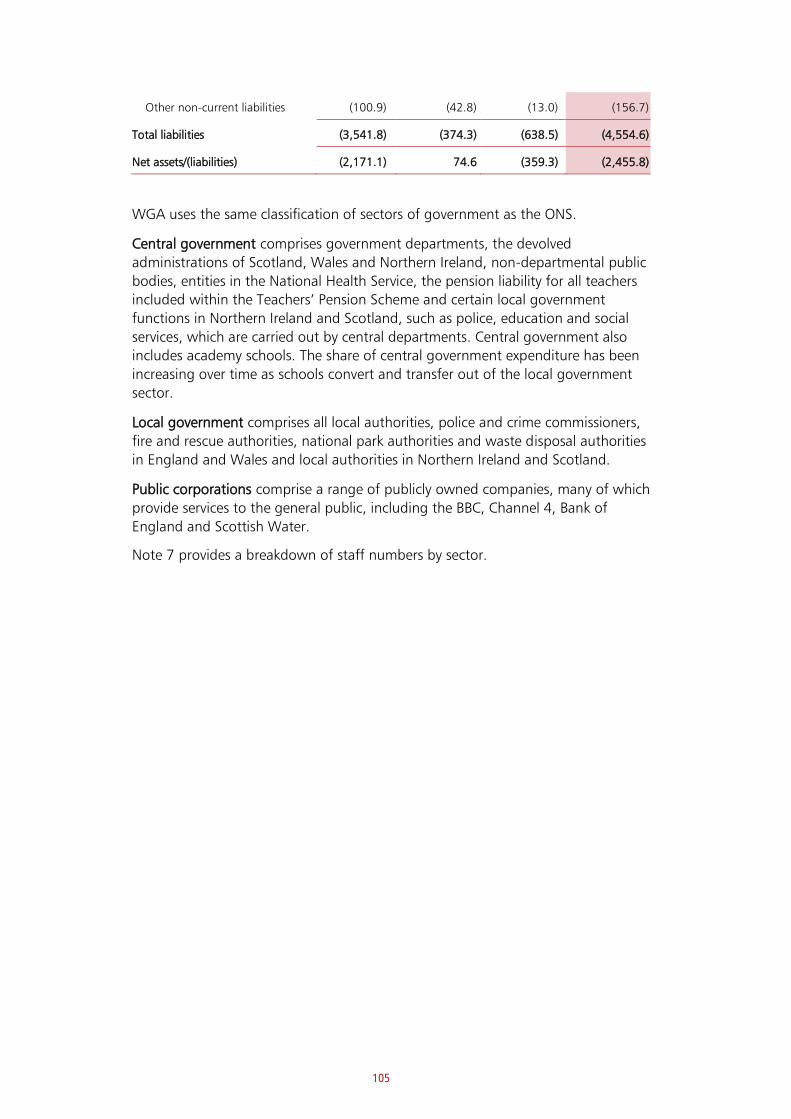
105
Other non-current liabilities (100.9) (42.8) (13.0) (156.7)
Total liabilities (3,541.8) (374.3) (638.5) (4,554.6)
Net assets/(liabilities) (2,171.1) 74.6 (359.3) (2,455.8)
WGA uses the same classification of sectors of government as the ONS.
Central government comprises government departments, the devolved
administrations of Scotland, Wales and Northern Ireland, non-departmental public
bodies, entities in the National Health Service, the pension liability for all teachers
included within the Teachers’ Pension Scheme and certain local government
functions in Northern Ireland and Scotland, such as police, education and social
services, which are carried out by central departments. Central government also
includes academy schools. The share of central government expenditure has been
increasing over time as schools convert and transfer out of the local government
sector.
Local government comprises all local authorities, police and crime commissioners,
fire and rescue authorities, national park authorities and waste disposal authorities
in England and Wales and local authorities in Northern Ireland and Scotland.
Public corporations comprise a range of publicly owned companies, many of which
provide services to the general public, including the BBC, Channel 4, Bank of
England and Scottish Water.
Note 7 provides a breakdown of staff numbers by sector.

106
Segmental reporting 2017-18
Central
government
Local
government
Public
corporations
Whole of
Government
Restated £bn Restated £bn £bn Restated £bn
Taxation revenue (599.2) (62.2) (0.2) (661.6)
Other revenue (51.1) (39.3) (12.5) (102.9)
Total public services revenue (650.3) (101.5) (12.7) (764.5)
Social security benefits 200.1 25.2 0.6 225.9
Staff costs 145.0 65.4 5.4 215.8
Purchase of goods, services and
other expenditure
123.9 75.7 7.8 207.4
Interest cost on government
borrowing
36.8 - - 36.8
Increase in provisions 13.5 0.8 0.9 15.2
Other expenditure 94.6 12.9 0.2 107.7
Total expenditure on public services 613.9 180.0 14.9 808.8
Net (revenue)/expenditure on public
services
(36.4) 78.5 2.2 44.3
Financing costs of long-term
liabilities, including discounting
141.4 10.0 2.3 153.7
Net loss on revaluations and
disposals of assets and liabilities
5.2 (0.5) 0.1 4.8
Net expenditure/(revenue) for the
year
110.2 88.0 4.6 202.8
Property, plant and equipment 761.6 367.8 79.0 1,208.4
Other non-current assets 215.6 31.1 151.7 398.4
Current assets 315.5 38.2 53.3 407.0
Total assets 1,292.7 437.1 284.0 2,013.8
Current government borrowings (275.6) - - (275.6)
Other current liabilities (164.1) (29.1) (604.0) (797.2)
Non-current government
borrowings
(1,071.8) - - (1,071.8)
Provisions non-current (381.3) (2.4) (22.4) (406.1)
Net public sector pension liability (1,589.4) (275.5) (0.4) (1,865.3)
Other non-current liabilities (101.5) (45.0) (16.7) (163.2)
Total liabilities (3,583.7) (352.0) (643.5) (4,579.2)

107
Net assets/(liabilities) (2,291.0) 85.1 (359.5) (2,565.4)
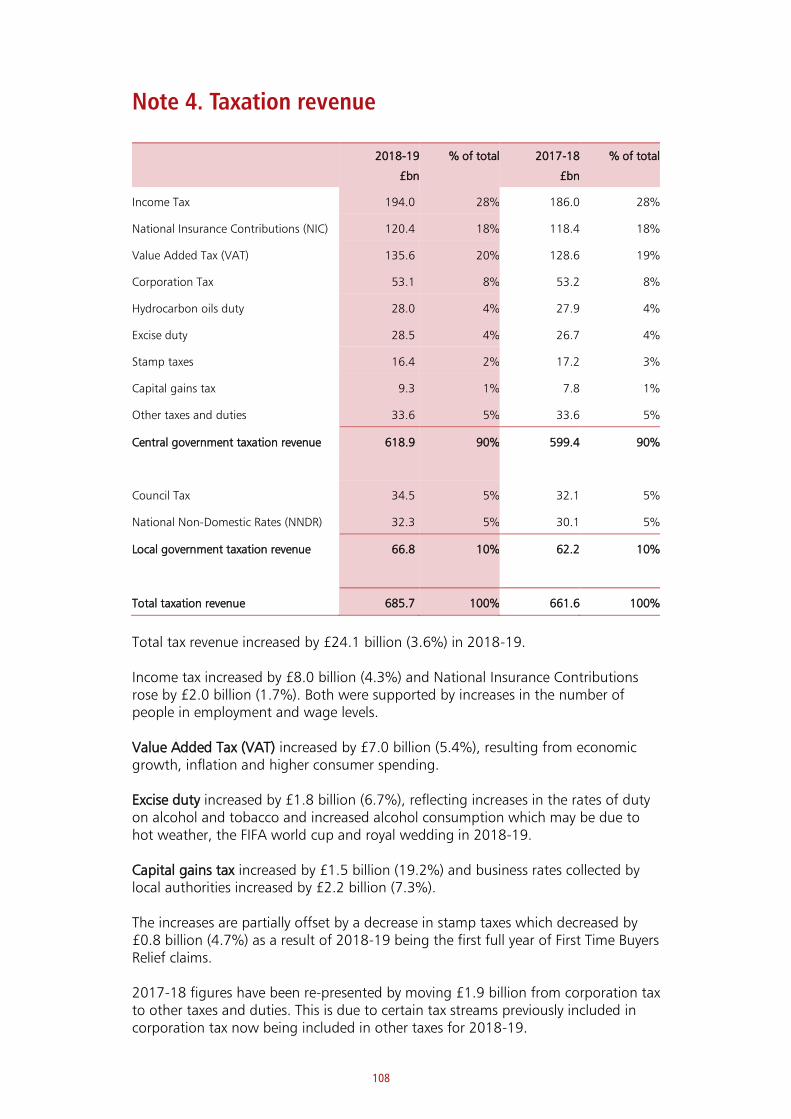
108
Note 4. Taxation revenue 2018-19
£bn
% of total 2017-18
£bn
% of total
Income Tax 194.0 28% 186.0 28%
National Insurance Contributions (NIC) 120.4 18% 118.4 18%
Value Added Tax (VAT) 135.6 20% 128.6 19%
Corporation Tax 53.1 8% 53.2 8%
Hydrocarbon oils duty 28.0 4% 27.9 4%
Excise duty 28.5 4% 26.7 4%
Stamp taxes 16.4 2% 17.2 3%
Capital gains tax 9.3 1% 7.8 1%
Other taxes and duties 33.6 5% 33.6 5%
Central government taxation revenue 618.9 90% 599.4 90%
Council Tax 34.5 5% 32.1 5%
National Non-Domestic Rates (NNDR) 32.3 5% 30.1 5%
Local government taxation revenue 66.8 10% 62.2 10%
Total taxation revenue 685.7 100% 661.6 100%
Total tax revenue increased by £24.1 billion (3.6%) in 2018-19. Income tax increased by £8.0 billion (4.3%) and National Insurance Contributions rose by £2.0 billion (1.7%). Both were supported by increases in the number of people in employment and wage levels. Value Added Tax (VAT) increased by £7.0 billion (5.4%), resulting from economic growth, inflation and higher consumer spending. Excise duty increased by £1.8 billion (6.7%), reflecting increases in the rates of duty on alcohol and tobacco and increased alcohol consumption which may be due to hot weather, the FIFA world cup and royal wedding in 2018-19. Capital gains tax increased by £1.5 billion (19.2%) and business rates collected by local authorities increased by £2.2 billion (7.3%). The increases are partially offset by a decrease in stamp taxes which decreased by £0.8 billion (4.7%) as a result of 2018-19 being the first full year of First Time Buyers Relief claims. 2017-18 figures have been re-presented by moving £1.9 billion from corporation tax to other taxes and duties. This is due to certain tax streams previously included in corporation tax now being included in other taxes for 2018-19.
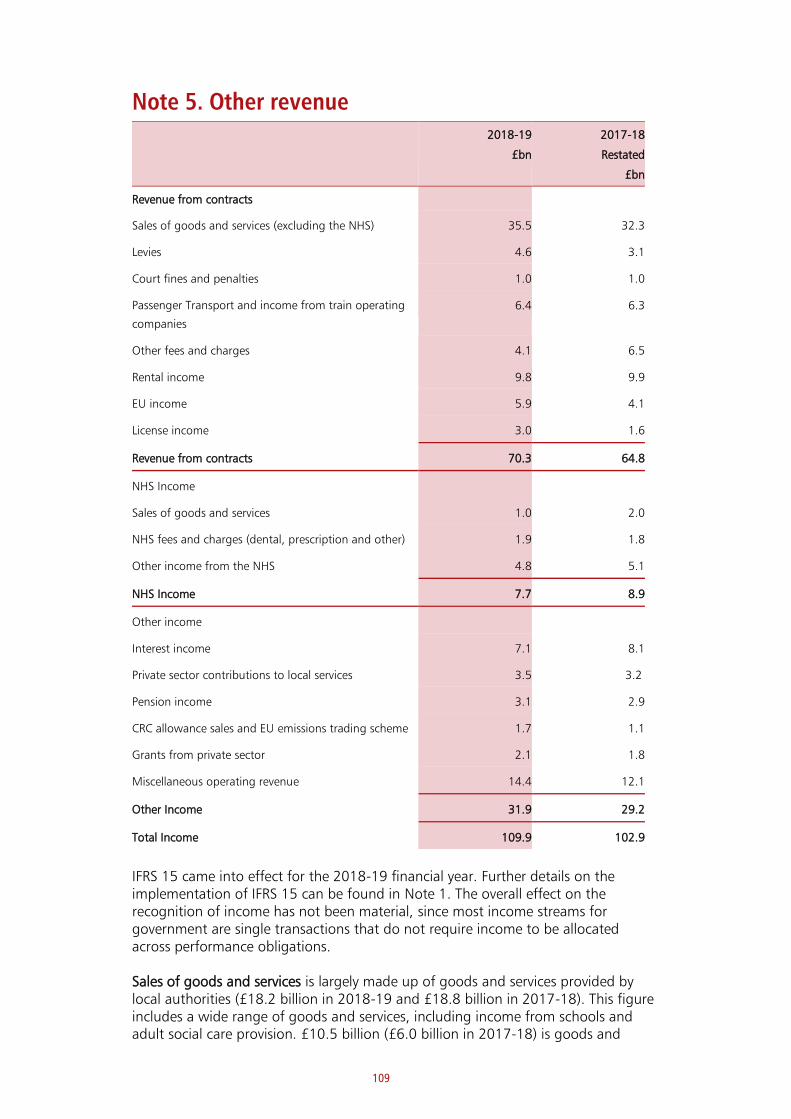
109
Note 5. Other revenue
IFRS 15 came into effect for the 2018-19 financial year. Further details on the implementation of IFRS 15 can be found in Note 1. The overall effect on the recognition of income has not been material, since most income streams for government are single transactions that do not require income to be allocated across performance obligations. Sales of goods and services is largely made up of goods and services provided by local authorities (£18.2 billion in 2018-19 and £18.8 billion in 2017-18). This figure includes a wide range of goods and services, including income from schools and adult social care provision. £10.5 billion (£6.0 billion in 2017-18) is goods and
2018-19
£bn
2017-18
Restated
£bn
Revenue from contracts
Sales of goods and services (excluding the NHS) 35.5 32.3
Levies 4.6 3.1
Court fines and penalties 1.0 1.0
Passenger Transport and income from train operating
companies
6.4 6.3
Other fees and charges 4.1 6.5
Rental income 9.8 9.9
EU income 5.9 4.1
License income 3.0 1.6
Revenue from contracts 70.3 64.8
NHS Income
Sales of goods and services 1.0 2.0
NHS fees and charges (dental, prescription and other) 1.9 1.8
Other income from the NHS 4.8 5.1
NHS Income 7.7 8.9
Other income
Interest income 7.1 8.1
Private sector contributions to local services 3.5 3.2
Pension income 3.1 2.9
CRC allowance sales and EU emissions trading scheme 1.7 1.1
Grants from private sector 2.1 1.8
Miscellaneous operating revenue 14.4 12.1
Other Income 31.9 29.2
Total Income 109.9 102.9
110
services provided by central government, this includes a wide range of income streams. One of the most significant and complex income streams included in this figure is the £765 million of income recognised in year by the Nuclear Decommissioning Authority for the reprocessing of nuclear fuel. This contract involves a complex allocation of performance obligations, with a further £8.5 billion to be recognised over the remaining life of the contract, which runs to 2087. The remaining income is from Public Corporations, including Channel 4, Scottish Water and the Post Office.
Levies are made up of income from the Low Carbon Contracts Company operational cost levy, the Electricity Settlements Company’s settlement cost levy and the Oil and Gas Authority’s petroleum licence levy. Other smaller sources of levy income include the Department for Environment, Food and Rural Affairs, Pension Protection Fund, Land Registry and HM Treasury.
Passenger transport and train operating companies’ income of £6.4 billion (£6.3 billion in 2017-18) is largely made up of passenger income from Transport for London (£4.9 billion in 2018-19, £4.5 billion in 2017-18) and income from Train Operating Companies (TOCs) (£1.5 billion 2018-19, £1.8 billion in 2017-18). The recognition of income from TOCs requires the use of a complex model, which was reassessed under the IFRS 15 standard for 2018-19. The Department for Transport concluded that the existing accounting policy was materially consistent with IFRS 15, and therefore no changes to the pattern of revenue recognition occurred in 2018-19.
Rental income from local government housing relates to rents and related costs collected from local government council tenants.
EU Income of £5.9 billion (£4.1 billion in 2017-18) is largely made up of income from the EU to the Department for Environment Food and Rural Affairs (DEFRA). This income mainly relates to the Basic Payment Scheme and income payable to other paying agencies, and is therefore paid back out as grants, which can be seen in Note 9.
Licence income of £3.0 billion (£1.6 billion in 2017-18) is largely made up of income from OFCOM. The BBC licence fee classified as a tax in Note 4.
NHS income of £7.7 billion (£8.9 billion in 2017-18) is made up of a variety of sources, including income from private patients (£0.6 billion in 2018-19, £0.6 billion in 2017-18).
Pension scheme income of £3.1 billion in 2018-19 (£2.9 billion in 2017-18) relates to employer contributions from organisations which participate in public sector pension schemes but are not themselves consolidated within the WGA boundary. Examples included GPs and charity hospices that contributed to the NHS pension scheme; higher and further education institutions and independent teaching establishments that contributed to the Teachers’ Pension Scheme. It also includes non-WGA entities such as the National Audit Office, Wales Audit Office and Electoral Commission that contribute to the Principal Civil Service Pension Scheme.

111
Note 6. Social security benefits
2018-19
£bn
% of total 2017-18
£bn
% of total
State pension 99.1 43% 96.1 43%
Pension credit 5.4 2% 5.7 3%
TV licences for the over 75’s 0.5 0% 0.7 0%
Pensioner benefits 105.0 45% 102.5 46%
Disability living allowance 8.7 4% 10.5 5%
Attendance allowance 5.9 3% 5.5 2%
Personal independence payment 11.1 5% 8.3 4%
Carer’s allowance 3.2 1% 3.0 1%
Employment and support allowance 15.3 7% 15.7 7%
Jobseeker’s allowance 1.4 1% 1.8 1%
Income support 2.0 1% 2.3 1%
Statutory sick pay and maternity pay 2.7 1% 2.4 1%
Universal Credit 8.0 3% 3.2 1%
Other working age benefits 1.3 1% 1.3 1%
Tax credits 28.5 12% 30.1 13%
Child benefit 11.5 5% 11.7 5%
Housing benefit 24.3 10% 25.8 11%
Miscellaneous benefits 1.4 1% 1.8 1%
Disability, working and other benefits
125.3
55%
123.4
54%
Total social security benefits
230.3
100%
225.9
100%
The State Pension (including the 'new state pension'), at £99.1 billion, is the largest benefit paid, and accounted for almost half of all spending. State Pension expenditure increased by £3.0 billion (3.1%), largely driven by the annual uprating in line with the "triple lock" at 2.5%. However, the number of claimants was down due to the decrease in the number of new claimants after December 2018, as the State Pension age started to rise beyond 65 for men and women. In 2017-18, Universal Credit was shown under the heading 'other working age benefits'. In 2018-19 Universal Credit now has its own specific heading. ‘Other benefits’ have been renamed ‘Miscellaneous benefits’ and an adjustment has been made to the 2017-18 figure to reclassify Maternity or Industrial injury benefits to ‘Other working age benefits.’
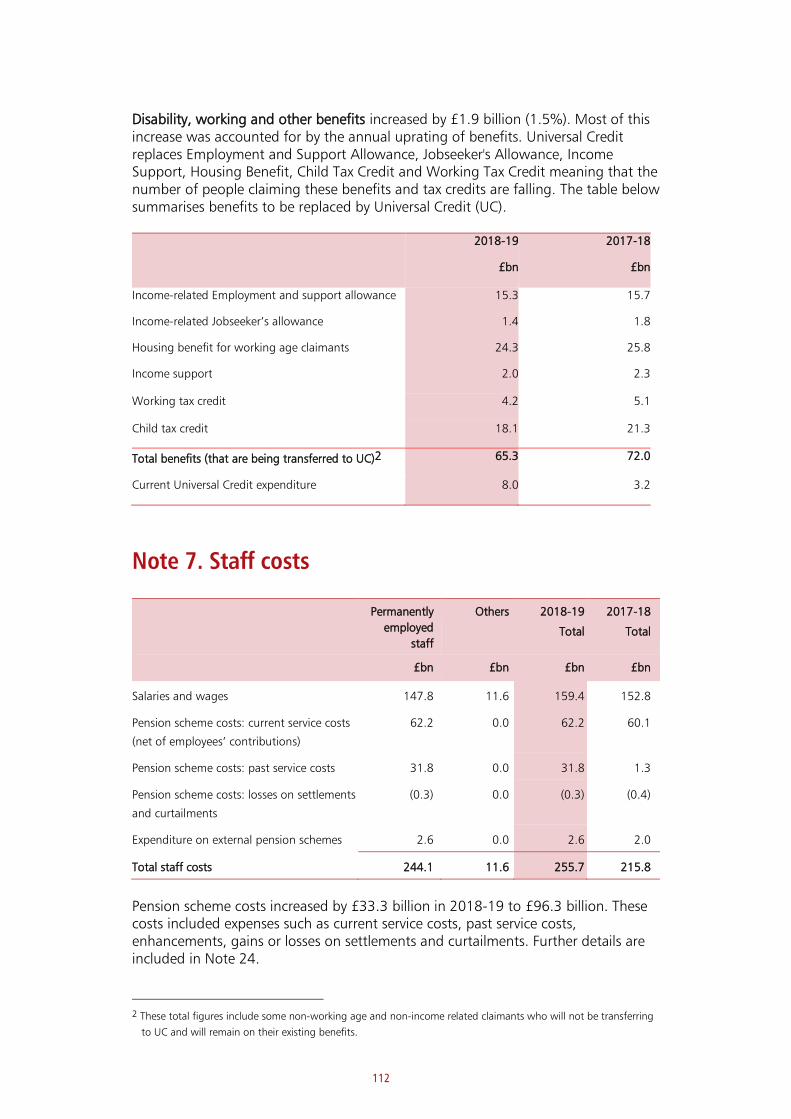
112
Disability, working and other benefits increased by £1.9 billion (1.5%). Most of this increase was accounted for by the annual uprating of benefits. Universal Credit replaces Employment and Support Allowance, Jobseeker's Allowance, Income Support, Housing Benefit, Child Tax Credit and Working Tax Credit meaning that the number of people claiming these benefits and tax credits are falling. The table below summarises benefits to be replaced by Universal Credit (UC). 2018-19
£bn
2017-18
£bn
Income-related Employment and support allowance 15.3 15.7
Income-related Jobseeker’s allowance 1.4 1.8
Housing benefit for working age claimants 24.3 25.8
Income support 2.0 2.3
Working tax credit 4.2 5.1
Child tax credit 18.1 21.3
Total benefits (that are being transferred to UC)2 65.3 72.0
Current Universal Credit expenditure 8.0 3.2
Note 7. Staff costs
Permanently
employed
staff
Others 2018-19
Total
2017-18
Total
£bn £bn £bn £bn
Salaries and wages 147.8 11.6 159.4 152.8
Pension scheme costs: current service costs
(net of employees’ contributions)
62.2 0.0 62.2 60.1
Pension scheme costs: past service costs 31.8 0.0 31.8 1.3
Pension scheme costs: losses on settlements
and curtailments
(0.3) 0.0 (0.3) (0.4)
Expenditure on external pension schemes 2.6 0.0 2.6 2.0
Total staff costs 244.1 11.6 255.7 215.8
Pension scheme costs increased by £33.3 billion in 2018-19 to £96.3 billion. These costs included expenses such as current service costs, past service costs, enhancements, gains or losses on settlements and curtailments. Further details are included in Note 24.
2 These total figures include some non-working age and non-income related claimants who will not be transferring
to UC and will remain on their existing benefits.
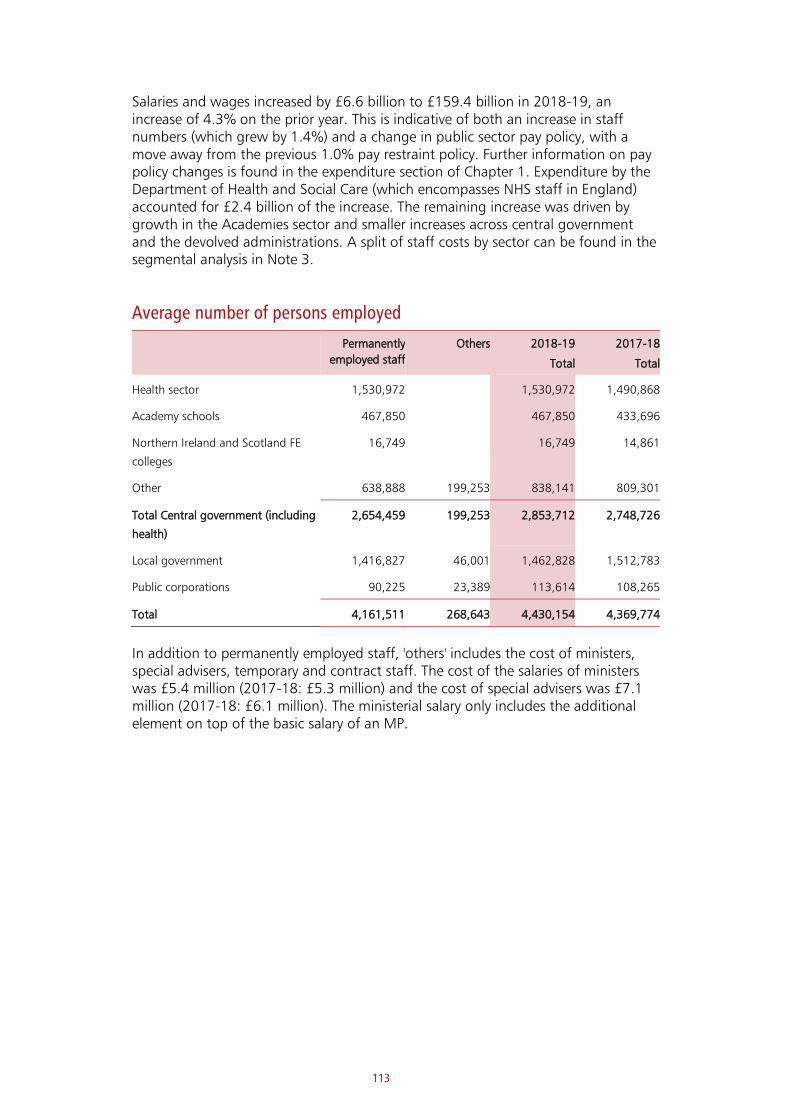
113
Salaries and wages increased by £6.6 billion to £159.4 billion in 2018-19, an increase of 4.3% on the prior year. This is indicative of both an increase in staff numbers (which grew by 1.4%) and a change in public sector pay policy, with a move away from the previous 1.0% pay restraint policy. Further information on pay policy changes is found in the expenditure section of Chapter 1. Expenditure by the Department of Health and Social Care (which encompasses NHS staff in England) accounted for £2.4 billion of the increase. The remaining increase was driven by growth in the Academies sector and smaller increases across central government and the devolved administrations. A split of staff costs by sector can be found in the segmental analysis in Note 3.
Average number of persons employed
Permanently
employed staff
Others 2018-19
Total
2017-18
Total
Health sector 1,530,972 1,530,972 1,490,868
Academy schools 467,850 467,850 433,696
Northern Ireland and Scotland FE
colleges
16,749 16,749 14,861
Other 638,888 199,253 838,141 809,301
Total Central government (including
health)
2,654,459 199,253 2,853,712 2,748,726
Local government 1,416,827 46,001 1,462,828 1,512,783
Public corporations 90,225 23,389 113,614 108,265
Total 4,161,511 268,643 4,430,154 4,369,774
In addition to permanently employed staff, 'others' includes the cost of ministers, special advisers, temporary and contract staff. The cost of the salaries of ministers was £5.4 million (2017-18: £5.3 million) and the cost of special advisers was £7.1 million (2017-18: £6.1 million). The ministerial salary only includes the additional element on top of the basic salary of an MP.
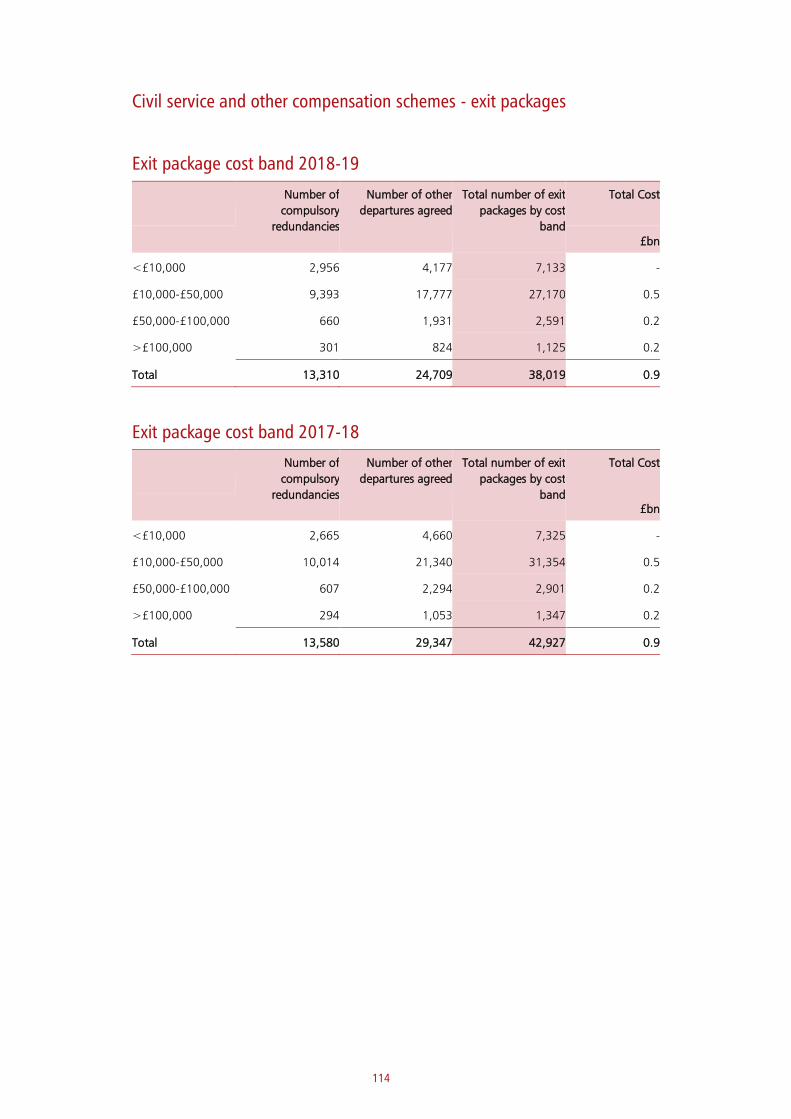
114
Civil service and other compensation schemes - exit packages
Exit package cost band 2018-19
Number of
compulsory
redundancies
Number of other
departures agreed
Total number of exit
packages by cost
band
Total Cost
£bn
<£10,000 2,956 4,177 7,133 -
£10,000-£50,000 9,393 17,777 27,170 0.5
£50,000-£100,000 660 1,931 2,591 0.2
>£100,000 301 824 1,125 0.2
Total 13,310 24,709 38,019 0.9
Exit package cost band 2017-18
Number of
compulsory
redundancies
Number of other
departures agreed
Total number of exit
packages by cost
band
Total Cost
£bn
<£10,000 2,665 4,660 7,325 -
£10,000-£50,000 10,014 21,340 31,354 0.5
£50,000-£100,000 607 2,294 2,901 0.2
>£100,000 294 1,053 1,347 0.2
Total 13,580 29,347 42,927 0.9

115
Note 8. Purchase of goods, services and other expenditure
2018-19
£bn
2017-18
Restated
£bn
Central government
Department of Health and Social Care 62.9
Ministry of Defence 15.5
Academies 5.7
Scottish Government 5.1
Department for Transport 2.9
Welsh Government 3.5
Ministry of Justice 3.2
Home Office 2.7
Department for Education 2.3
Department for Business, Energy & Industrial Strategy 2.2
Other 14.8
Total Central government 120.8 123.8
Local government 77.6 75.8
Public Corporations
British Broadcasting Corporation 2.8
Other 5.3
Total Public Corporations 8.1 7.8
Total purchases of goods, services and other
expenditure
206.5 207.4
The 2017-18 comparatives have been restated to reflect an adjustment to Academies land and buildings, and to reclassify losses on disposal of assets from revenue to expenditure. Further details can be found in Note 33. For 2018-19 the methodology for allocating intra-government transactions was changed, and this means that 2017-18 WGA figures at an entity level are not comparable.
The figures shown in the above table are after elimination of intra-government transactions and WGA accounting adjustments, so will not be reconcilable to individual departmental accounts.
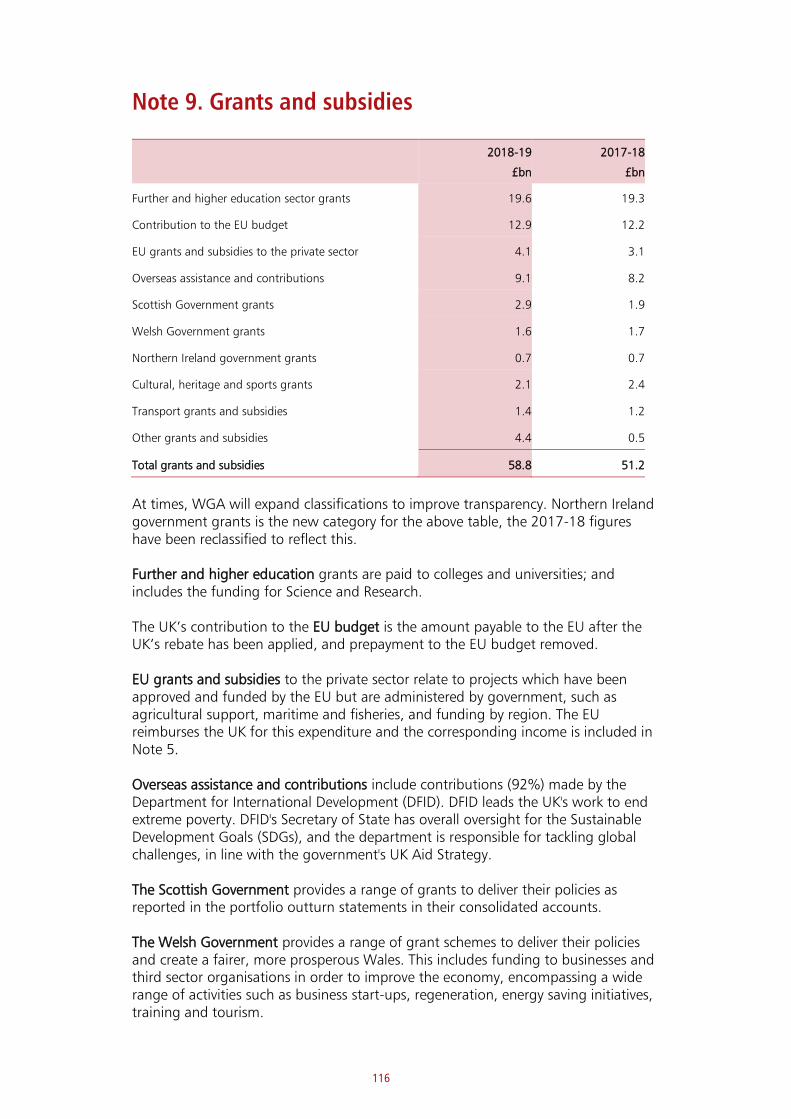
116
Note 9. Grants and subsidies
2018-19
£bn
2017-18
£bn
Further and higher education sector grants 19.6 19.3
Contribution to the EU budget 12.9 12.2
EU grants and subsidies to the private sector 4.1 3.1
Overseas assistance and contributions 9.1 8.2
Scottish Government grants 2.9 1.9
Welsh Government grants 1.6 1.7
Northern Ireland government grants 0.7 0.7
Cultural, heritage and sports grants 2.1 2.4
Transport grants and subsidies 1.4 1.2
Other grants and subsidies 4.4 0.5
Total grants and subsidies 58.8 51.2
At times, WGA will expand classifications to improve transparency. Northern Ireland government grants is the new category for the above table, the 2017-18 figures have been reclassified to reflect this. Further and higher education grants are paid to colleges and universities; and includes the funding for Science and Research. The UK’s contribution to the EU budget is the amount payable to the EU after the UK’s rebate has been applied, and prepayment to the EU budget removed. EU grants and subsidies to the private sector relate to projects which have been approved and funded by the EU but are administered by government, such as agricultural support, maritime and fisheries, and funding by region. The EU reimburses the UK for this expenditure and the corresponding income is included in Note 5. Overseas assistance and contributions include contributions (92%) made by the Department for International Development (DFID). DFID leads the UK's work to end extreme poverty. DFID's Secretary of State has overall oversight for the Sustainable Development Goals (SDGs), and the department is responsible for tackling global challenges, in line with the government's UK Aid Strategy. The Scottish Government provides a range of grants to deliver their policies as reported in the portfolio outturn statements in their consolidated accounts. The Welsh Government provides a range of grant schemes to deliver their policies and create a fairer, more prosperous Wales. This includes funding to businesses and third sector organisations in order to improve the economy, encompassing a wide range of activities such as business start-ups, regeneration, energy saving initiatives, training and tourism.
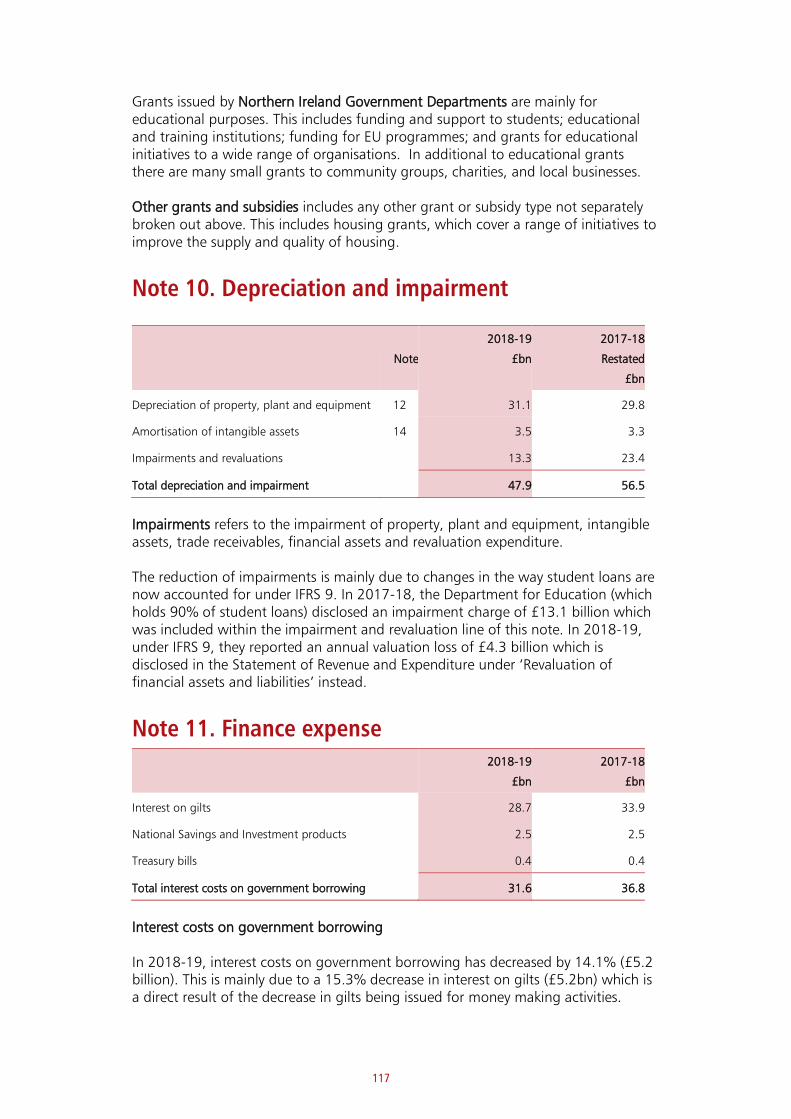
117
Grants issued by Northern Ireland Government Departments are mainly for educational purposes. This includes funding and support to students; educational and training institutions; funding for EU programmes; and grants for educational initiatives to a wide range of organisations. In additional to educational grants there are many small grants to community groups, charities, and local businesses. Other grants and subsidies includes any other grant or subsidy type not separately broken out above. This includes housing grants, which cover a range of initiatives to improve the supply and quality of housing.
Note 10. Depreciation and impairment
Note
2018-19
£bn
2017-18
Restated
£bn
Depreciation of property, plant and equipment 12 31.1 29.8
Amortisation of intangible assets 14 3.5 3.3
Impairments and revaluations 13.3 23.4
Total depreciation and impairment 47.9 56.5
Impairments refers to the impairment of property, plant and equipment, intangible assets, trade receivables, financial assets and revaluation expenditure. The reduction of impairments is mainly due to changes in the way student loans are now accounted for under IFRS 9. In 2017-18, the Department for Education (which holds 90% of student loans) disclosed an impairment charge of £13.1 billion which was included within the impairment and revaluation line of this note. In 2018-19, under IFRS 9, they reported an annual valuation loss of £4.3 billion which is disclosed in the Statement of Revenue and Expenditure under ‘Revaluation of financial assets and liabilities’ instead.
Note 11. Finance expense 2018-19
£bn
2017-18
£bn
Interest on gilts 28.7 33.9
National Savings and Investment products 2.5 2.5
Treasury bills 0.4 0.4
Total interest costs on government borrowing 31.6 36.8
Interest costs on government borrowing In 2018-19, interest costs on government borrowing has decreased by 14.1% (£5.2 billion). This is mainly due to a 15.3% decrease in interest on gilts (£5.2bn) which is a direct result of the decrease in gilts being issued for money making activities.
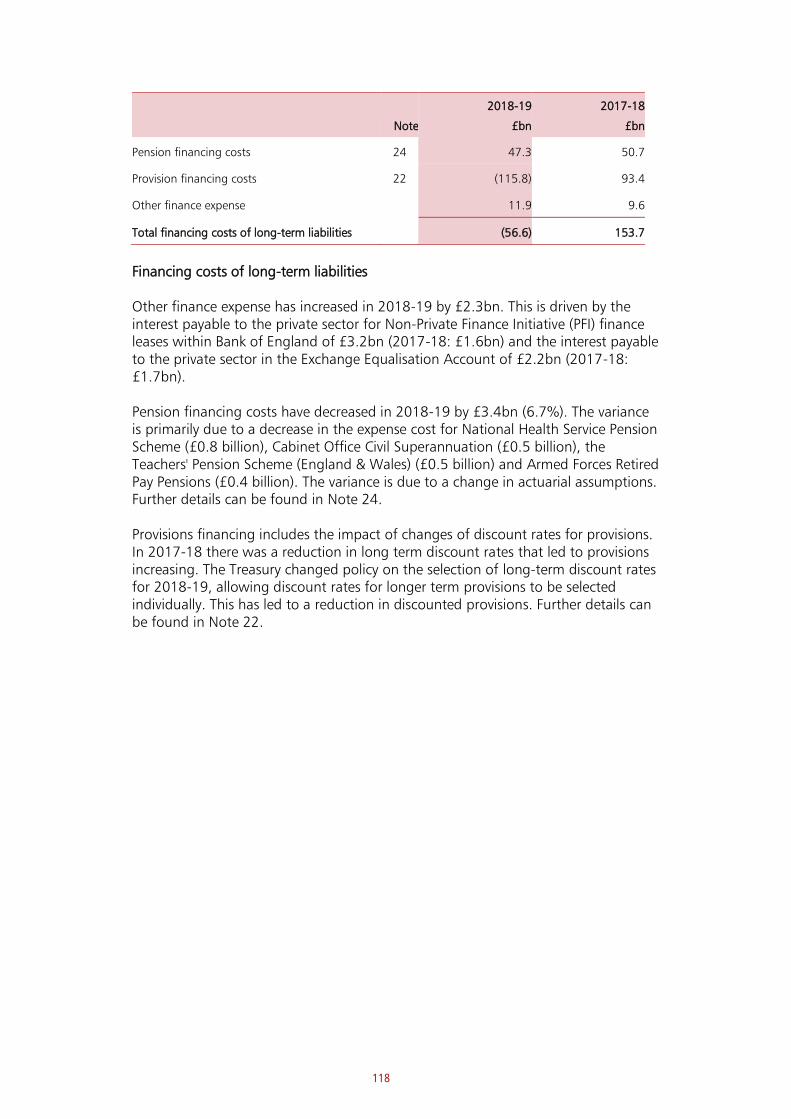
118
Note
2018-19
£bn
2017-18
£bn
Pension financing costs 24 47.3 50.7
Provision financing costs 22 (115.8) 93.4
Other finance expense 11.9 9.6
Total financing costs of long-term liabilities (56.6) 153.7
Financing costs of long-term liabilities
Other finance expense has increased in 2018-19 by £2.3bn. This is driven by the interest payable to the private sector for Non-Private Finance Initiative (PFI) finance leases within Bank of England of £3.2bn (2017-18: £1.6bn) and the interest payable to the private sector in the Exchange Equalisation Account of £2.2bn (2017-18: £1.7bn).
Pension financing costs have decreased in 2018-19 by £3.4bn (6.7%). The variance is primarily due to a decrease in the expense cost for National Health Service Pension Scheme (£0.8 billion), Cabinet Office Civil Superannuation (£0.5 billion), the Teachers' Pension Scheme (England & Wales) (£0.5 billion) and Armed Forces Retired Pay Pensions (£0.4 billion). The variance is due to a change in actuarial assumptions. Further details can be found in Note 24.
Provisions financing includes the impact of changes of discount rates for provisions. In 2017-18 there was a reduction in long term discount rates that led to provisions increasing. The Treasury changed policy on the selection of long-term discount rates for 2018-19, allowing discount rates for longer term provisions to be selected individually. This has led to a reduction in discounted provisions. Further details can be found in Note 22.
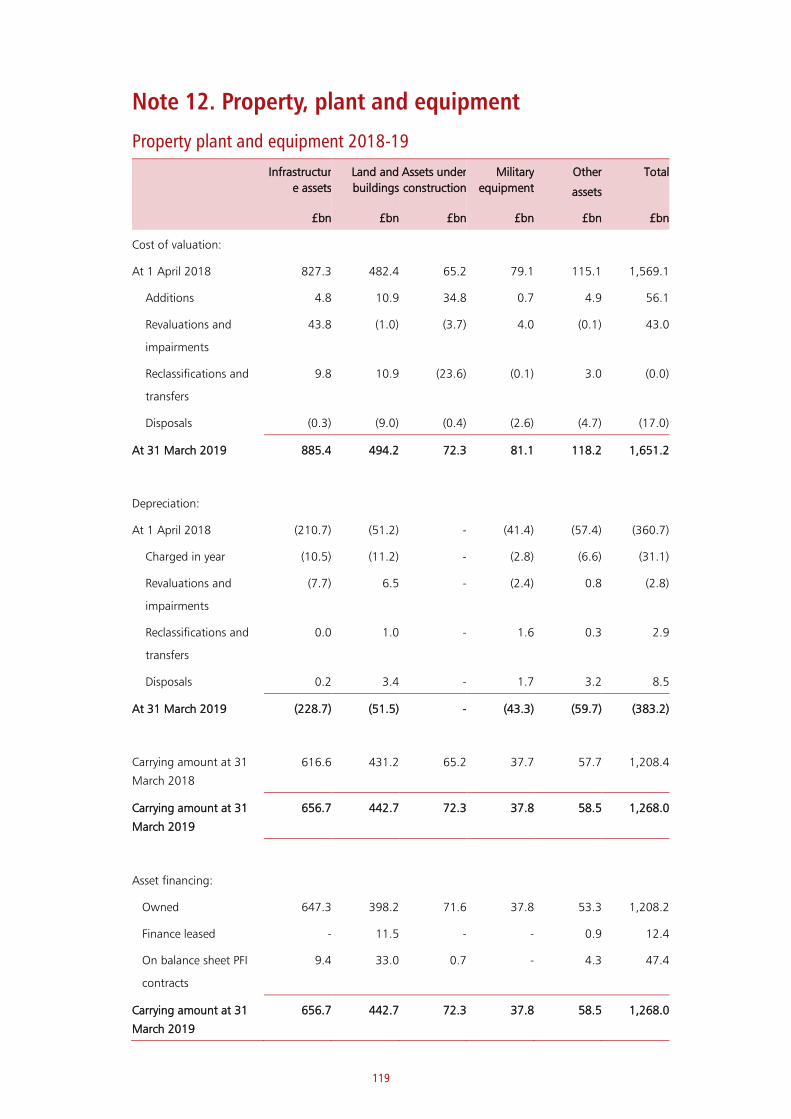
119
Note 12. Property, plant and equipment
Property plant and equipment 2018-19
Infrastructur
e assets
Land and
buildings
Assets under
construction
Military
equipment
Other
assets
Total
£bn £bn £bn £bn £bn £bn
Cost of valuation:
At 1 April 2018 827.3 482.4 65.2 79.1 115.1 1,569.1
Additions 4.8 10.9 34.8 0.7 4.9 56.1
Revaluations and
impairments
43.8 (1.0) (3.7) 4.0 (0.1) 43.0
Reclassifications and
transfers
9.8 10.9 (23.6) (0.1) 3.0 (0.0)
Disposals (0.3) (9.0) (0.4) (2.6) (4.7) (17.0)
At 31 March 2019 885.4 494.2 72.3 81.1 118.2 1,651.2
Depreciation:
At 1 April 2018 (210.7) (51.2) - (41.4) (57.4) (360.7)
Charged in year (10.5) (11.2) - (2.8) (6.6) (31.1)
Revaluations and
impairments
(7.7) 6.5 - (2.4) 0.8 (2.8)
Reclassifications and
transfers
0.0 1.0 - 1.6 0.3 2.9
Disposals 0.2 3.4 - 1.7 3.2 8.5
At 31 March 2019 (228.7) (51.5) - (43.3) (59.7) (383.2)
Carrying amount at 31
March 2018
616.6 431.2 65.2 37.7 57.7 1,208.4
Carrying amount at 31
March 2019
656.7 442.7 72.3 37.8 58.5 1,268.0
Asset financing:
Owned 647.3 398.2 71.6 37.8 53.3 1,208.2
Finance leased - 11.5 - - 0.9 12.4
On balance sheet PFI
contracts
9.4 33.0 0.7 - 4.3 47.4
Carrying amount at 31
March 2019
656.7 442.7 72.3 37.8 58.5 1,268.0
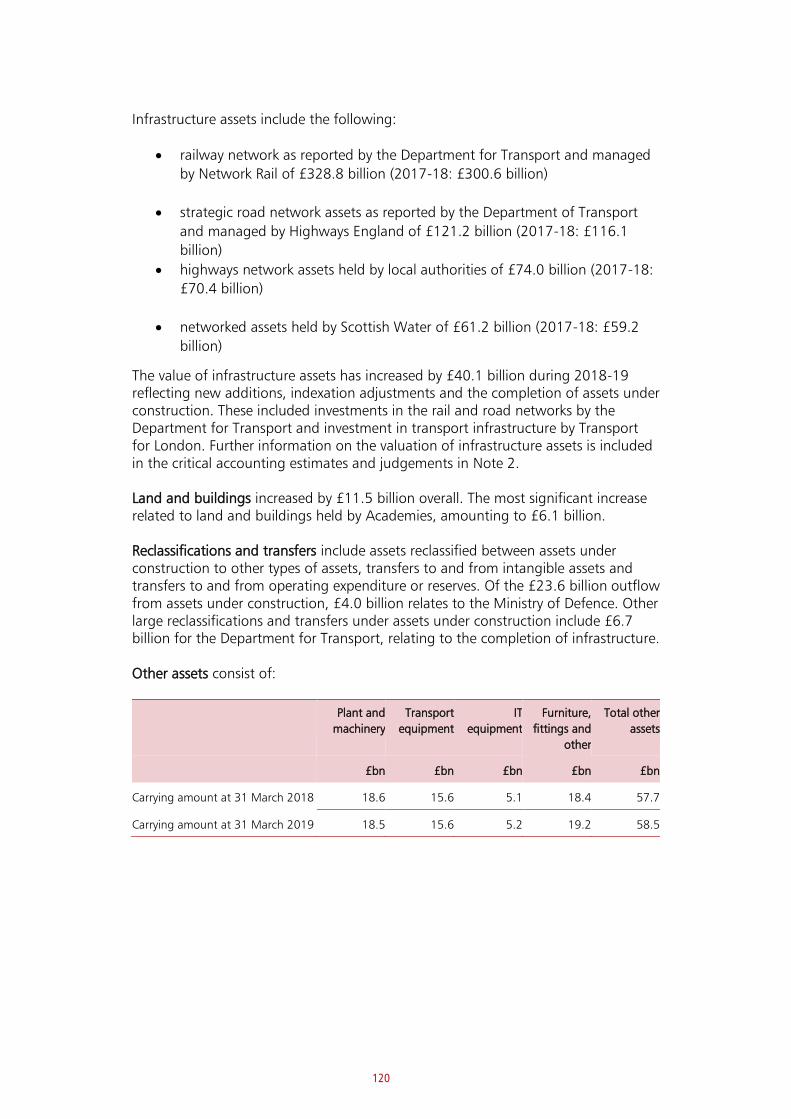
120
Infrastructure assets include the following:
• railway network as reported by the Department for Transport and managed
by Network Rail of £328.8 billion (2017-18: £300.6 billion)
• strategic road network assets as reported by the Department of Transport
and managed by Highways England of £121.2 billion (2017-18: £116.1
billion)
• highways network assets held by local authorities of £74.0 billion (2017-18:
£70.4 billion)
• networked assets held by Scottish Water of £61.2 billion (2017-18: £59.2
billion)
The value of infrastructure assets has increased by £40.1 billion during 2018-19 reflecting new additions, indexation adjustments and the completion of assets under construction. These included investments in the rail and road networks by the Department for Transport and investment in transport infrastructure by Transport for London. Further information on the valuation of infrastructure assets is included in the critical accounting estimates and judgements in Note 2. Land and buildings increased by £11.5 billion overall. The most significant increase related to land and buildings held by Academies, amounting to £6.1 billion. Reclassifications and transfers include assets reclassified between assets under construction to other types of assets, transfers to and from intangible assets and transfers to and from operating expenditure or reserves. Of the £23.6 billion outflow from assets under construction, £4.0 billion relates to the Ministry of Defence. Other large reclassifications and transfers under assets under construction include £6.7 billion for the Department for Transport, relating to the completion of infrastructure. Other assets consist of:
Plant and
machinery
Transport
equipment
IT
equipment
Furniture,
fittings and
other
Total other
assets
£bn £bn £bn £bn £bn
Carrying amount at 31 March 2018 18.6 15.6 5.1 18.4 57.7
Carrying amount at 31 March 2019 18.5 15.6 5.2 19.2 58.5

121
Property, Plant and equipment 2017-18 (restated)
Infrastructure
assets
Land and
buildings
Assets under
construction
Military
equipment
Other
assets
Total
£bn £bn £bn £bn £bn £bn
Cost of valuation:
At 1 April 2017 798.6 460.8 63.1 75.7 111.2 1,509.4
Additions 5.4 11.9 33.3 0.5 4.7 55.8
Revaluations and
impairments
15.3 7.9 (2.6) 0.6 0.4 21.6
Reclassifications and
transfers
8.7 11.0 (28.3) 5.4 2.6 (0.6)
Disposals (0.7) (9.2) (0.3) (3.1) (3.8) (17.1)
At 31 March 2018 827.3 482.4 65.2 79.1 115.1 1,569.1
Depreciation:
At 1 April 2017 (203.0) (49.5) - (42.6) (55.1) (350.2)
Charged in year (10.0) (10.6) - (2.9) (6.3) (29.8)
Revaluations and
impairments
2.0 4.5 - 0.2 0.5 7.2
Reclassifications and
transfers
0.0 1.2 - 0.9 0.3 2.4
Disposals 0.3 3.2 - 3.0 3.2 9.7
At 31 March 2018 (210.7) (51.2) - (41.4) (57.4) (360.7)
Carrying amount at 31
March 2017
595.6 411.3 63.1 33.1 56.1 1,159.2
Carrying amount at 31
March 2018
616.6 431.2 65.2 37.7 57.7 1,208.4
Asset financing:
Owned 609.2 387.9 64.0 37.7 52.6 1,151.4
Finance leased - 10.5 - - 1.2 11.7
On balance sheet PFI
contracts
7.4 32.8 1.2 - 3.9 45.3
Carrying amount at 31
March 2018
616.6 431.2 65.2 37.7 57.7 1,208.4
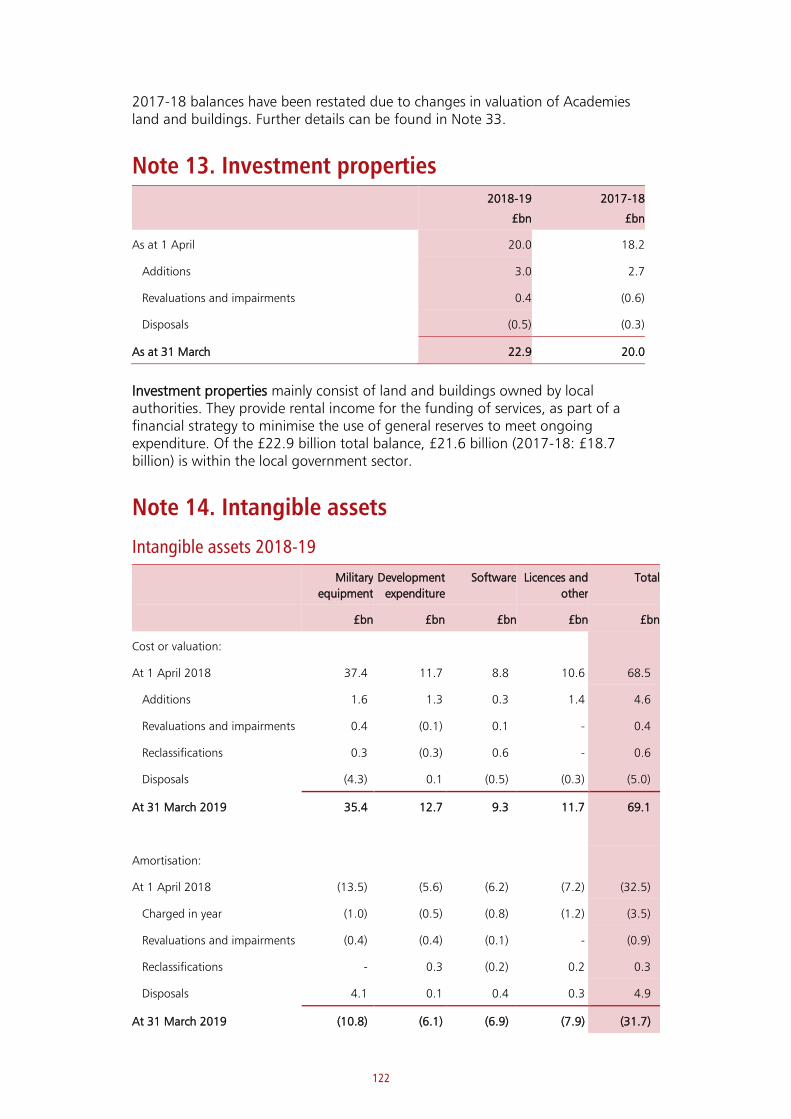
122
2017-18 balances have been restated due to changes in valuation of Academies land and buildings. Further details can be found in Note 33.
Note 13. Investment properties 2018-19
£bn
2017-18
£bn
As at 1 April 20.0 18.2
Additions 3.0 2.7
Revaluations and impairments 0.4 (0.6)
Disposals (0.5) (0.3)
As at 31 March 22.9 20.0
Investment properties mainly consist of land and buildings owned by local authorities. They provide rental income for the funding of services, as part of a financial strategy to minimise the use of general reserves to meet ongoing expenditure. Of the £22.9 billion total balance, £21.6 billion (2017-18: £18.7 billion) is within the local government sector.
Note 14. Intangible assets
Intangible assets 2018-19
Military
equipment
Development
expenditure
Software Licences and
other
Total
£bn £bn £bn £bn £bn
Cost or valuation:
At 1 April 2018 37.4 11.7 8.8 10.6 68.5
Additions 1.6 1.3 0.3 1.4 4.6
Revaluations and impairments 0.4 (0.1) 0.1 - 0.4
Reclassifications 0.3 (0.3) 0.6 - 0.6
Disposals (4.3) 0.1 (0.5) (0.3) (5.0)
At 31 March 2019 35.4 12.7 9.3 11.7 69.1
Amortisation:
At 1 April 2018 (13.5) (5.6) (6.2) (7.2) (32.5)
Charged in year (1.0) (0.5) (0.8) (1.2) (3.5)
Revaluations and impairments (0.4) (0.4) (0.1) - (0.9)
Reclassifications - 0.3 (0.2) 0.2 0.3
Disposals 4.1 0.1 0.4 0.3 4.9
At 31 March 2019 (10.8) (6.1) (6.9) (7.9) (31.7)
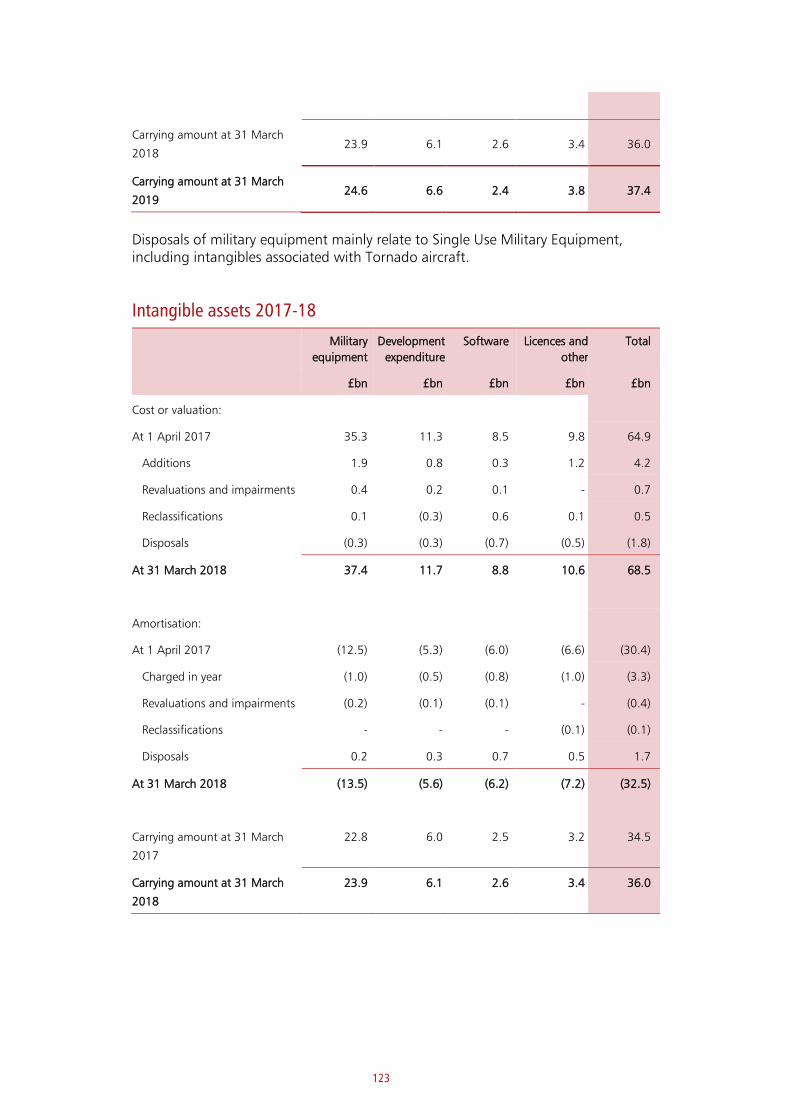
123
Carrying amount at 31 March
2018 23.9 6.1 2.6 3.4 36.0
Carrying amount at 31 March
2019 24.6 6.6 2.4 3.8 37.4
Disposals of military equipment mainly relate to Single Use Military Equipment, including intangibles associated with Tornado aircraft.
Intangible assets 2017-18
Military
equipment
Development
expenditure
Software Licences and
other
Total
£bn £bn £bn £bn £bn
Cost or valuation:
At 1 April 2017 35.3 11.3 8.5 9.8 64.9
Additions 1.9 0.8 0.3 1.2 4.2
Revaluations and impairments 0.4 0.2 0.1 - 0.7
Reclassifications 0.1 (0.3) 0.6 0.1 0.5
Disposals (0.3) (0.3) (0.7) (0.5) (1.8)
At 31 March 2018 37.4 11.7 8.8 10.6 68.5
Amortisation:
At 1 April 2017 (12.5) (5.3) (6.0) (6.6) (30.4)
Charged in year (1.0) (0.5) (0.8) (1.0) (3.3)
Revaluations and impairments (0.2) (0.1) (0.1) - (0.4)
Reclassifications - - - (0.1) (0.1)
Disposals 0.2 0.3 0.7 0.5 1.7
At 31 March 2018 (13.5) (5.6) (6.2) (7.2) (32.5)
Carrying amount at 31 March
2017
22.8 6.0 2.5 3.2 34.5
Carrying amount at 31 March
2018
23.9 6.1 2.6 3.4 36.0
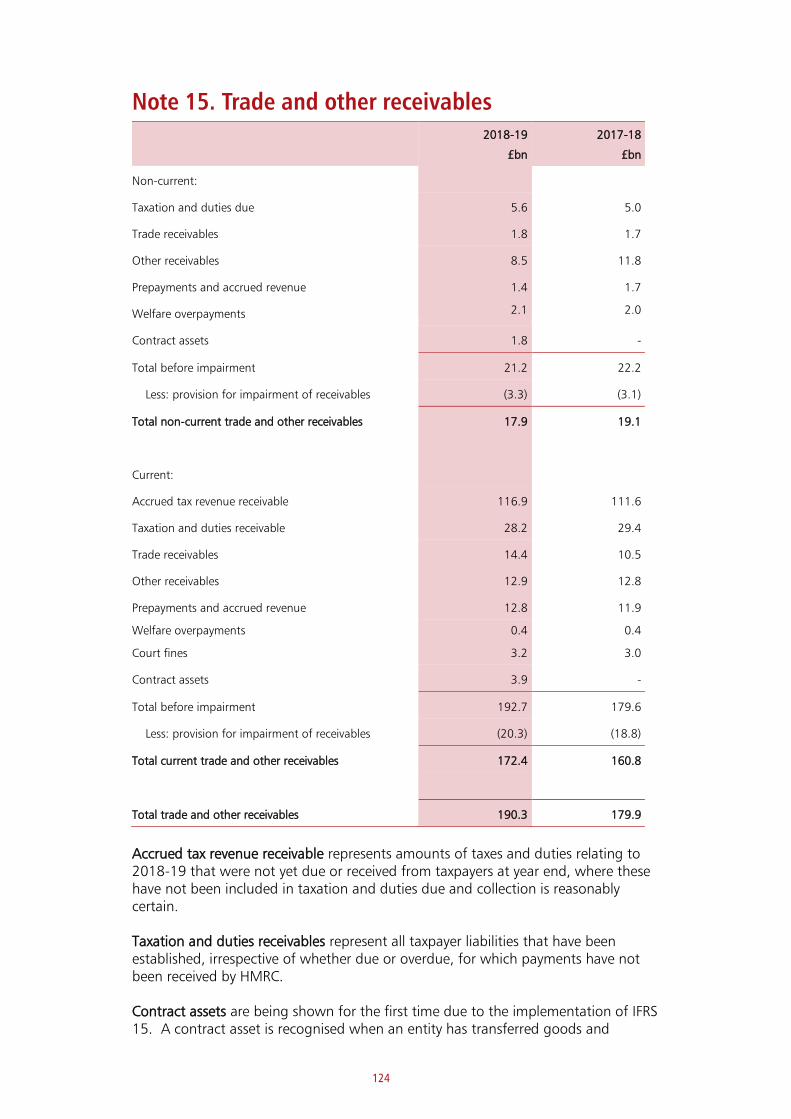
124
Note 15. Trade and other receivables 2018-19
£bn
2017-18
£bn
Non-current:
Taxation and duties due 5.6 5.0
Trade receivables 1.8 1.7
Other receivables 8.5 11.8
Prepayments and accrued revenue 1.4 1.7
Welfare overpayments 2.1 2.0
Contract assets 1.8 -
Total before impairment 21.2 22.2
Less: provision for impairment of receivables (3.3) (3.1)
Total non-current trade and other receivables 17.9 19.1
Current:
Accrued tax revenue receivable 116.9 111.6
Taxation and duties receivable 28.2 29.4
Trade receivables 14.4 10.5
Other receivables 12.9 12.8
Prepayments and accrued revenue 12.8 11.9
Welfare overpayments 0.4 0.4
Court fines 3.2 3.0
Contract assets 3.9 -
Total before impairment 192.7 179.6
Less: provision for impairment of receivables (20.3) (18.8)
Total current trade and other receivables 172.4 160.8
Total trade and other receivables 190.3 179.9
Accrued tax revenue receivable represents amounts of taxes and duties relating to 2018-19 that were not yet due or received from taxpayers at year end, where these have not been included in taxation and duties due and collection is reasonably certain.
Taxation and duties receivables represent all taxpayer liabilities that have been established, irrespective of whether due or overdue, for which payments have not been received by HMRC.
Contract assets are being shown for the first time due to the implementation of IFRS 15. A contract asset is recognised when an entity has transferred goods and
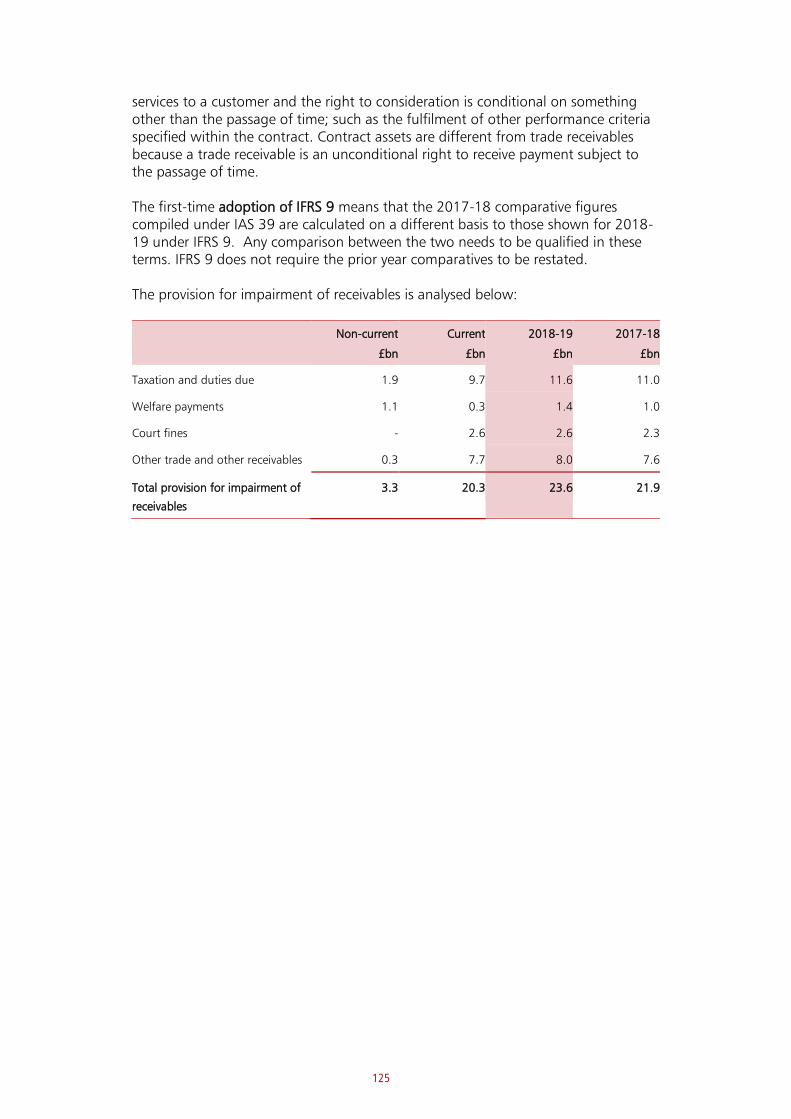
125
services to a customer and the right to consideration is conditional on something other than the passage of time; such as the fulfilment of other performance criteria specified within the contract. Contract assets are different from trade receivables because a trade receivable is an unconditional right to receive payment subject to the passage of time. The first-time adoption of IFRS 9 means that the 2017-18 comparative figures compiled under IAS 39 are calculated on a different basis to those shown for 2018-19 under IFRS 9. Any comparison between the two needs to be qualified in these terms. IFRS 9 does not require the prior year comparatives to be restated. The provision for impairment of receivables is analysed below:
Non-current
£bn
Current
£bn
2018-19
£bn
2017-18
£bn
Taxation and duties due 1.9 9.7 11.6 11.0
Welfare payments 1.1 0.3 1.4 1.0
Court fines - 2.6 2.6 2.3
Other trade and other receivables 0.3 7.7 8.0 7.6
Total provision for impairment of
receivables
3.3 20.3 23.6 21.9

126
Note 16. Other financial assets
2018-19
2017-18
£bn £bn
Non-current:
Loans and deposits 140.7 153.2
Student loans 74.3 67.4
Equity investments 55.4 53.8
IMF quota subscription 21.4 20.8
Derivatives and other financial assets 28.8 28.1
Total non-current other financial assets
320.6 323.3
Current:
Debt securities 105.0 101.9
Loans and deposits 64.6 53.2
Student loans 2.6 2.6
Equity investments 0.9 1.0
IMF Special drawing rights 11.8 9.9
Derivatives and other financial assets 9.4 15.7
Total current other financial assets 194.3 184.3
Total other financial assets 514.9 507.6
This disclosure is only affected in part by the introduction of IFRS 9 and therefore, in
some cases, a meaningful comparison can be made between the current and the
prior year figures. Where IFRS 9 does have an impact on the current year figures this
is detailed in the relevant narrative and any corresponding comparison between
years is qualified accordingly.
Non-current Loans and deposits decreased by £12.5 billion during 2018-19,
primarily due to a series of sales by HM Treasury of loans and mortgages held by
NRAM Ltd (formerly Northern Rock Asset Management plc) and Bradford and
Bingley plc; as part of the government’s programme of returning these assets to the
private sector.
Current Loans and deposits increased by £11.4 billion during 2018-19. Primarily due
to an increase in reverse sale and repurchase agreements held within the Debt
Management Account.
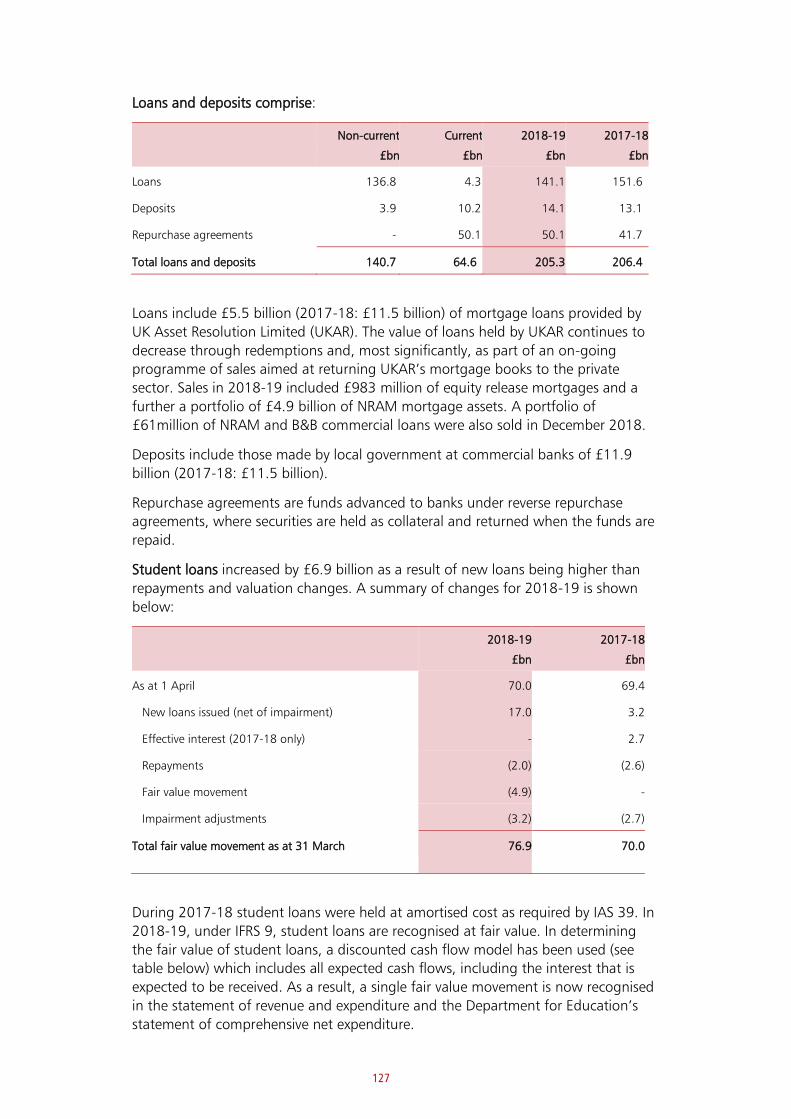
127
Loans and deposits comprise:
Non-current
£bn
Current
£bn
2018-19
£bn
2017-18
£bn
Loans 136.8 4.3 141.1 151.6
Deposits 3.9 10.2 14.1 13.1
Repurchase agreements - 50.1 50.1 41.7
Total loans and deposits 140.7 64.6 205.3 206.4
Loans include £5.5 billion (2017-18: £11.5 billion) of mortgage loans provided by
UK Asset Resolution Limited (UKAR). The value of loans held by UKAR continues to
decrease through redemptions and, most significantly, as part of an on-going
programme of sales aimed at returning UKAR’s mortgage books to the private
sector. Sales in 2018-19 included £983 million of equity release mortgages and a
further a portfolio of £4.9 billion of NRAM mortgage assets. A portfolio of
£61million of NRAM and B&B commercial loans were also sold in December 2018.
Deposits include those made by local government at commercial banks of £11.9
billion (2017-18: £11.5 billion).
Repurchase agreements are funds advanced to banks under reverse repurchase
agreements, where securities are held as collateral and returned when the funds are
repaid.
Student loans increased by £6.9 billion as a result of new loans being higher than
repayments and valuation changes. A summary of changes for 2018-19 is shown
below:
2018-19
£bn
2017-18
£bn
As at 1 April 70.0 69.4
New loans issued (net of impairment) 17.0 3.2
Effective interest (2017-18 only) - 2.7
Repayments (2.0) (2.6)
Fair value movement (4.9) -
Impairment adjustments (3.2) (2.7)
Total fair value movement as at 31 March 76.9 70.0
During 2017-18 student loans were held at amortised cost as required by IAS 39. In
2018-19, under IFRS 9, student loans are recognised at fair value. In determining
the fair value of student loans, a discounted cash flow model has been used (see
table below) which includes all expected cash flows, including the interest that is
expected to be received. As a result, a single fair value movement is now recognised
in the statement of revenue and expenditure and the Department for Education’s
statement of comprehensive net expenditure.
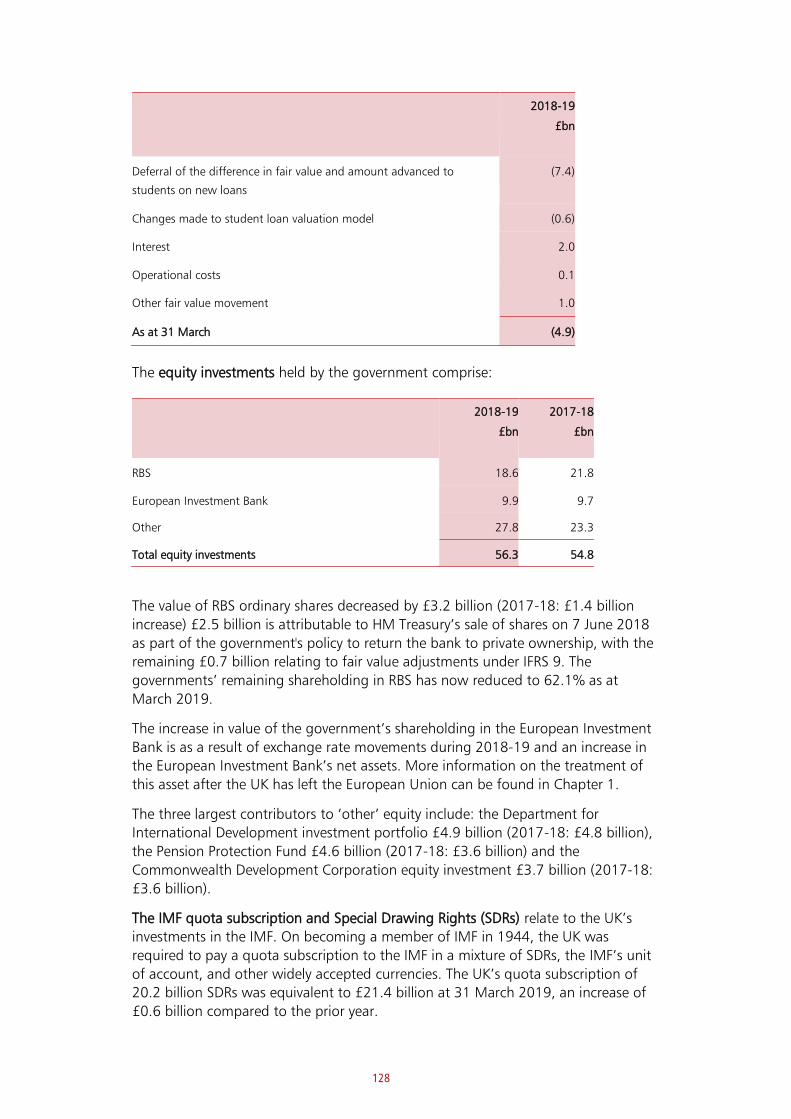
128
2018-19
£bn
Deferral of the difference in fair value and amount advanced to
students on new loans
(7.4)
Changes made to student loan valuation model (0.6)
Interest 2.0
Operational costs 0.1
Other fair value movement 1.0
As at 31 March (4.9)
The equity investments held by the government comprise:
2018-19
£bn
2017-18
£bn
RBS 18.6 21.8
European Investment Bank 9.9 9.7
Other 27.8 23.3
Total equity investments 56.3 54.8
The value of RBS ordinary shares decreased by £3.2 billion (2017-18: £1.4 billion
increase) £2.5 billion is attributable to HM Treasury’s sale of shares on 7 June 2018
as part of the government's policy to return the bank to private ownership, with the
remaining £0.7 billion relating to fair value adjustments under IFRS 9. The
governments’ remaining shareholding in RBS has now reduced to 62.1% as at
March 2019.
The increase in value of the government’s shareholding in the European Investment
Bank is as a result of exchange rate movements during 2018-19 and an increase in
the European Investment Bank’s net assets. More information on the treatment of
this asset after the UK has left the European Union can be found in Chapter 1.
The three largest contributors to ‘other’ equity include: the Department for
International Development investment portfolio £4.9 billion (2017-18: £4.8 billion),
the Pension Protection Fund £4.6 billion (2017-18: £3.6 billion) and the
Commonwealth Development Corporation equity investment £3.7 billion (2017-18:
£3.6 billion).
The IMF quota subscription and Special Drawing Rights (SDRs) relate to the UK’s
investments in the IMF. On becoming a member of IMF in 1944, the UK was
required to pay a quota subscription to the IMF in a mixture of SDRs, the IMF’s unit
of account, and other widely accepted currencies. The UK’s quota subscription of
20.2 billion SDRs was equivalent to £21.4 billion at 31 March 2019, an increase of
£0.6 billion compared to the prior year.
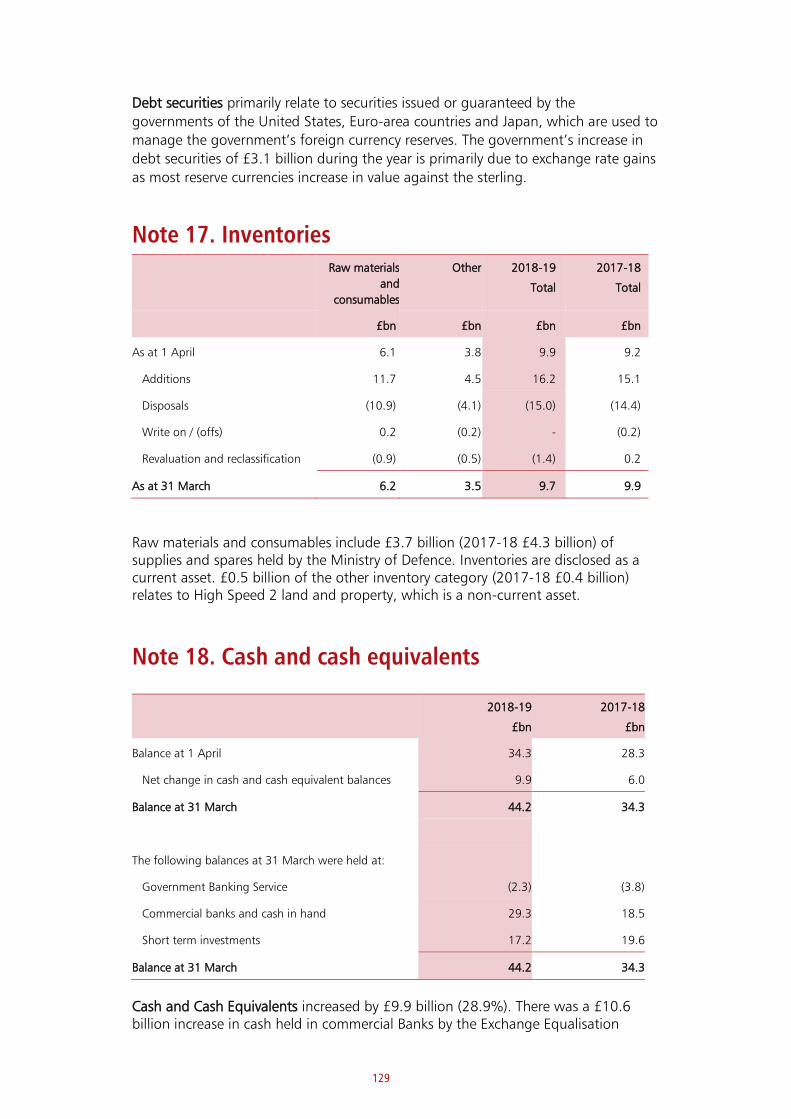
129
Debt securities primarily relate to securities issued or guaranteed by the
governments of the United States, Euro-area countries and Japan, which are used to
manage the government’s foreign currency reserves. The government’s increase in
debt securities of £3.1 billion during the year is primarily due to exchange rate gains
as most reserve currencies increase in value against the sterling.
Note 17. Inventories Raw materials
and
consumables
Other 2018-19
Total
2017-18
Total
£bn £bn £bn £bn
As at 1 April 6.1 3.8 9.9 9.2
Additions 11.7 4.5 16.2 15.1
Disposals (10.9) (4.1) (15.0) (14.4)
Write on / (offs) 0.2 (0.2) - (0.2)
Revaluation and reclassification (0.9) (0.5) (1.4) 0.2
As at 31 March 6.2 3.5 9.7 9.9
Raw materials and consumables include £3.7 billion (2017-18 £4.3 billion) of supplies and spares held by the Ministry of Defence. Inventories are disclosed as a current asset. £0.5 billion of the other inventory category (2017-18 £0.4 billion) relates to High Speed 2 land and property, which is a non-current asset.
Note 18. Cash and cash equivalents
2018-19
£bn
2017-18
£bn
Balance at 1 April 34.3 28.3
Net change in cash and cash equivalent balances 9.9 6.0
Balance at 31 March 44.2 34.3
The following balances at 31 March were held at:
Government Banking Service (2.3) (3.8)
Commercial banks and cash in hand 29.3 18.5
Short term investments 17.2 19.6
Balance at 31 March 44.2 34.3
Cash and Cash Equivalents increased by £9.9 billion (28.9%). There was a £10.6 billion increase in cash held in commercial Banks by the Exchange Equalisation

130
Account (EEA), most of the EEA cash held at commercial banks is held at foreign central banks. The EEA is an account that holds the UK’s reserves of gold, foreign currencies and IMF Special Drawing Rights. There was a decrease in short term investments held by a range of public sector bodies including the Nuclear Liabilities Fund, the National Loans Fund, and the Bank of England. Cash held at the Government Banking Service shows a balance of negative £2.3 billion. This consists of positive balances held by government departments as part of the Government Banking Scheme, offset by a negative balance of £22.9 billion held by the National Loans Fund. The overall balance is negative due to the way that government undertakes cash management.
Note 19. Trade and other payables
2018-19
£bn
2017-18
£bn
Non-current:
Trade and other payables 6.0 9.8
Accruals and deferred income 9.9 12.7
Imputed finance lease element of on-balance sheet PFI
contracts
36.2 37.4
Obligations under finance leases 4.7 4.5
Contract liabilities 1.8 -
Total current trade and other payables 58.6 64.4
Current:
Trade and other payables 43.4 42.4
Accruals and deferred income 50.9 49.2
Refunds of taxation and duties payable 34.7 33.3
Imputed finance lease element of on-balance sheet PFI
contracts
1.7 1.6
Obligations under finance leases 0.3 0.3
Contract liabilities 2.3 -
Total non-current trade and other payables 133.3 126.8
Total trade and other payables 191.9 191.2
Trade and other payables and accruals and deferred income were held across a wide
range of public sector entities and relate to both day-to-day business delivery costs
and other financial obligations.
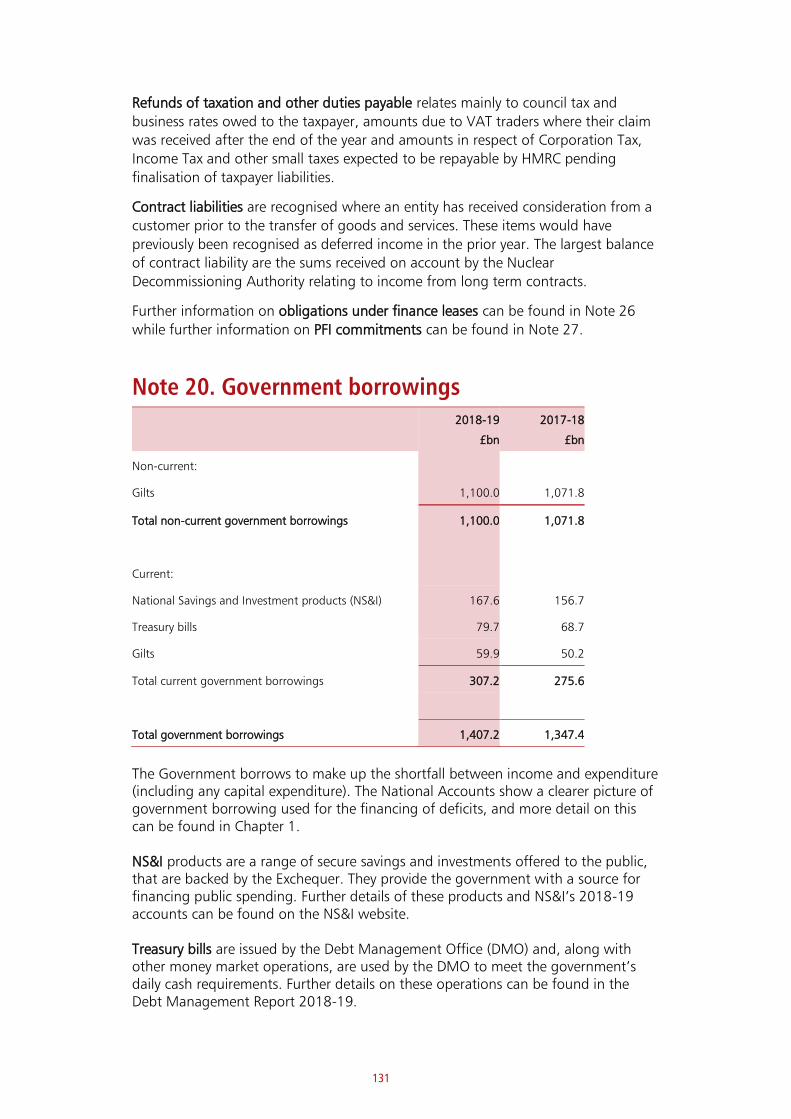
131
Refunds of taxation and other duties payable relates mainly to council tax and
business rates owed to the taxpayer, amounts due to VAT traders where their claim
was received after the end of the year and amounts in respect of Corporation Tax,
Income Tax and other small taxes expected to be repayable by HMRC pending
finalisation of taxpayer liabilities.
Contract liabilities are recognised where an entity has received consideration from a
customer prior to the transfer of goods and services. These items would have
previously been recognised as deferred income in the prior year. The largest balance
of contract liability are the sums received on account by the Nuclear
Decommissioning Authority relating to income from long term contracts.
Further information on obligations under finance leases can be found in Note 26
while further information on PFI commitments can be found in Note 27.
Note 20. Government borrowings 2018-19
£bn
2017-18
£bn
Non-current:
Gilts 1,100.0 1,071.8
Total non-current government borrowings 1,100.0 1,071.8
Current:
National Savings and Investment products (NS&I) 167.6 156.7
Treasury bills 79.7 68.7
Gilts 59.9 50.2
Total current government borrowings 307.2 275.6
Total government borrowings 1,407.2 1,347.4
The Government borrows to make up the shortfall between income and expenditure (including any capital expenditure). The National Accounts show a clearer picture of government borrowing used for the financing of deficits, and more detail on this can be found in Chapter 1. NS&I products are a range of secure savings and investments offered to the public, that are backed by the Exchequer. They provide the government with a source for financing public spending. Further details of these products and NS&I’s 2018-19 accounts can be found on the NS&I website. Treasury bills are issued by the Debt Management Office (DMO) and, along with other money market operations, are used by the DMO to meet the government’s daily cash requirements. Further details on these operations can be found in the Debt Management Report 2018-19.

132
Gilts are UK government sterling denominated listed bonds that are fixed rate or index-linked with the return linked to movements in the Retail Price Index. As the government’s debt manager, the DMO sells gilts to the market to ensure enough funding is available to meet the government’s financial commitments. Gilts held by public sector entities are eliminated on consolidation and removed from the balance above, except for gilts held by funded public sector pension schemes. Further details regarding gilts are available in the Debt Management Report 2018-19 and the 2018-19 accounts of the National Loans Fund.
Further information on the government’s financial risk, including liquidity and funding risk, is included in Note 23.
Note 21. Other financial liabilities 2018-19
£bn
2017-18
£bn
Non-current:
Deposits by banks 2.8 2.3
Bank and other borrowings 70.3 67.2
Debt securities 4.5 4.5
Derivatives 19.3 24.1
Financial guarantees 0.3 0.2
Other financial liabilities 0.9 0.5
Total non-current other financial liabilities 98.1 98.8
Current:
Deposits by banks 554.0 555.8
Banknotes in circulation 74.2 73.3
Bank and other borrowings 7.3 8.3
IMF Special Drawing Rights liability 10.8 10.5
Debt securities 0.9 1.1
Derivatives 4.9 5.0
Total current other financial liabilities 652.1 654.0
Total other financial liabilities 750.2 752.8
Deposits by banks mainly consists of deposits held by the Bank of England. The deposits are the reserves held for banks and building societies, that are repayable on demand, and are the means by which banks and building societies settle transactions.
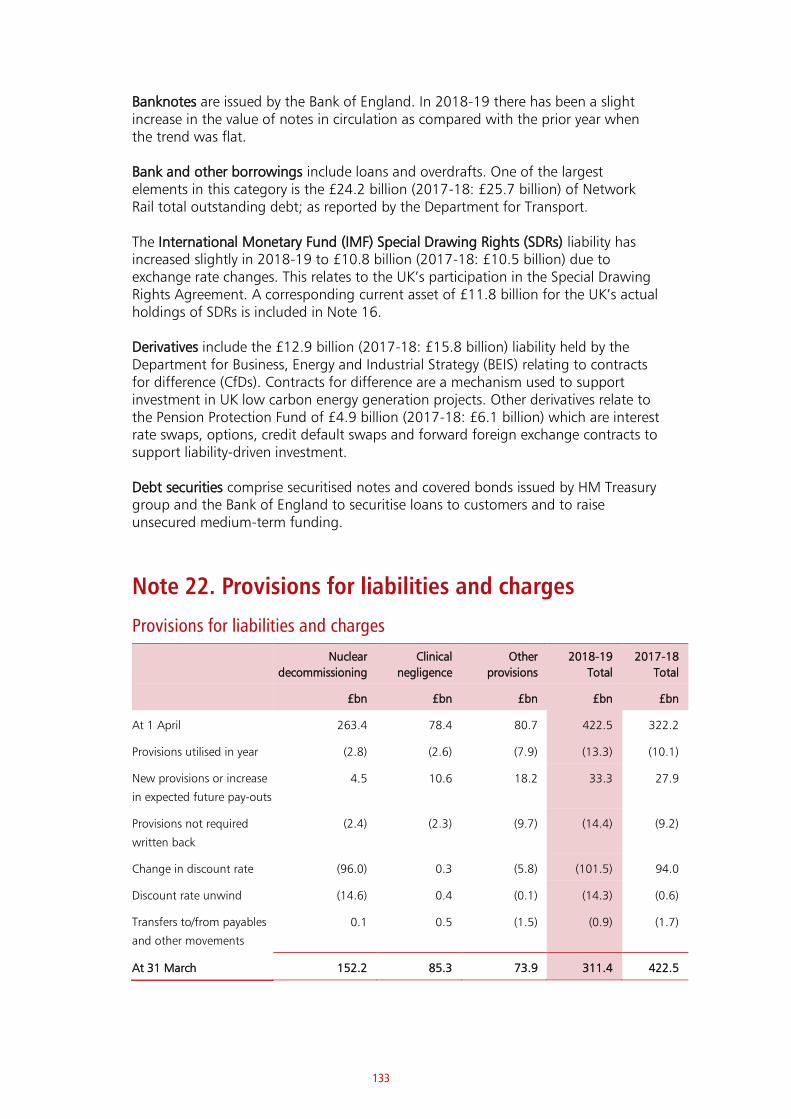
133
Banknotes are issued by the Bank of England. In 2018-19 there has been a slight increase in the value of notes in circulation as compared with the prior year when the trend was flat.
Bank and other borrowings include loans and overdrafts. One of the largest elements in this category is the £24.2 billion (2017-18: £25.7 billion) of Network Rail total outstanding debt; as reported by the Department for Transport.
The International Monetary Fund (IMF) Special Drawing Rights (SDRs) liability has increased slightly in 2018-19 to £10.8 billion (2017-18: £10.5 billion) due to exchange rate changes. This relates to the UK’s participation in the Special Drawing Rights Agreement. A corresponding current asset of £11.8 billion for the UK’s actual holdings of SDRs is included in Note 16.
Derivatives include the £12.9 billion (2017-18: £15.8 billion) liability held by the Department for Business, Energy and Industrial Strategy (BEIS) relating to contracts for difference (CfDs). Contracts for difference are a mechanism used to support investment in UK low carbon energy generation projects. Other derivatives relate to the Pension Protection Fund of £4.9 billion (2017-18: £6.1 billion) which are interest rate swaps, options, credit default swaps and forward foreign exchange contracts to support liability-driven investment.
Debt securities comprise securitised notes and covered bonds issued by HM Treasury group and the Bank of England to securitise loans to customers and to raise unsecured medium-term funding.
Note 22. Provisions for liabilities and charges
Provisions for liabilities and charges
Nuclear
decommissioning
Clinical
negligence
Other
provisions
2018-19
Total
2017-18
Total
£bn £bn £bn £bn £bn
At 1 April 263.4 78.4 80.7 422.5 322.2
Provisions utilised in year (2.8) (2.6) (7.9) (13.3) (10.1)
New provisions or increase
in expected future pay-outs
4.5 10.6 18.2 33.3 27.9
Provisions not required
written back
(2.4) (2.3) (9.7) (14.4) (9.2)
Change in discount rate (96.0) 0.3 (5.8) (101.5) 94.0
Discount rate unwind (14.6) 0.4 (0.1) (14.3) (0.6)
Transfers to/from payables
and other movements
0.1 0.5 (1.5) (0.9) (1.7)
At 31 March 152.2 85.3 73.9 311.4 422.5
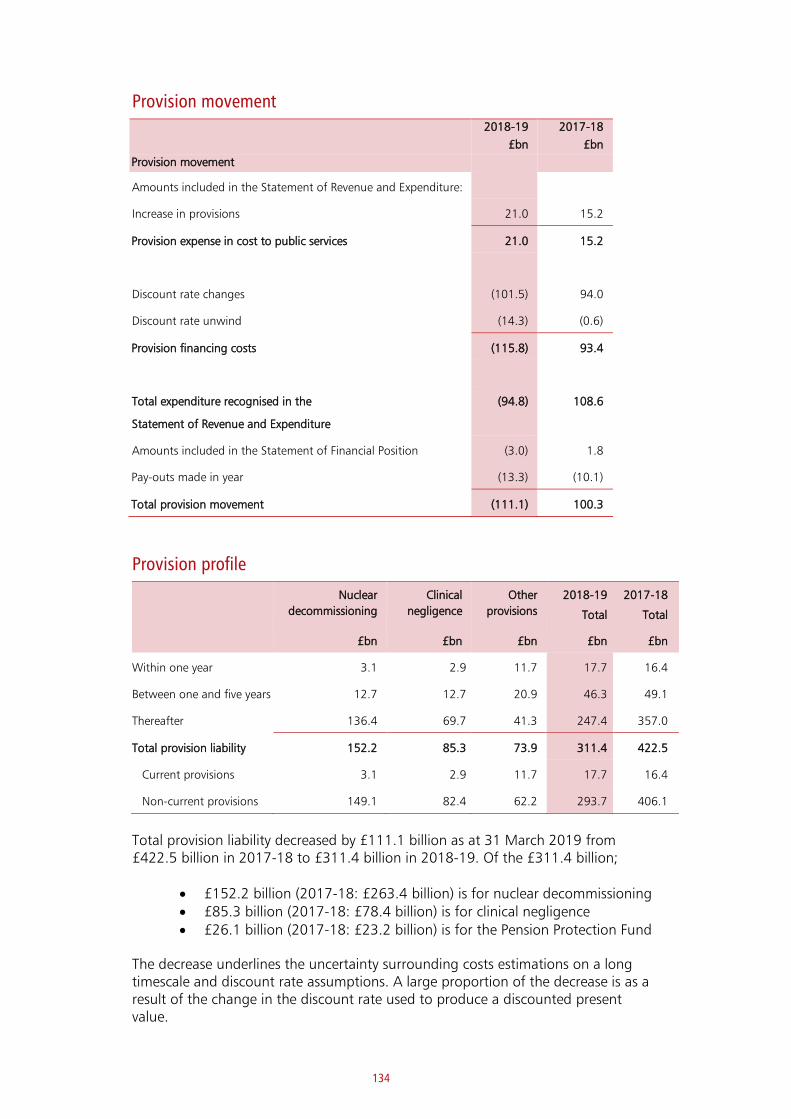
134
Provision movement 2018-19 2017-18
£bn £bn
Provision movement
Amounts included in the Statement of Revenue and Expenditure:
Increase in provisions 21.0 15.2
Provision expense in cost to public services 21.0 15.2
Discount rate changes (101.5) 94.0
Discount rate unwind (14.3) (0.6)
Provision financing costs (115.8) 93.4
Total expenditure recognised in the
Statement of Revenue and Expenditure
(94.8) 108.6
Amounts included in the Statement of Financial Position (3.0) 1.8
Pay-outs made in year (13.3) (10.1)
Total provision movement (111.1) 100.3
Provision profile
Nuclear
decommissioning
Clinical
negligence
Other
provisions
2018-19
Total
2017-18
Total
£bn £bn £bn £bn £bn
Within one year 3.1 2.9 11.7 17.7 16.4
Between one and five years 12.7 12.7 20.9 46.3 49.1
Thereafter 136.4 69.7 41.3 247.4 357.0
Total provision liability 152.2 85.3 73.9 311.4 422.5
Current provisions 3.1 2.9 11.7 17.7 16.4
Non-current provisions 149.1 82.4 62.2 293.7 406.1
Total provision liability decreased by £111.1 billion as at 31 March 2019 from £422.5 billion in 2017-18 to £311.4 billion in 2018-19. Of the £311.4 billion;
• £152.2 billion (2017-18: £263.4 billion) is for nuclear decommissioning• £85.3 billion (2017-18: £78.4 billion) is for clinical negligence• £26.1 billion (2017-18: £23.2 billion) is for the Pension Protection Fund
The decrease underlines the uncertainty surrounding costs estimations on a long timescale and discount rate assumptions. A large proportion of the decrease is as a result of the change in the discount rate used to produce a discounted present value.
135
In addition to expenditure incurred in the period, changes to the discount rate assumption have decreased the provision values and resulted in a significant negative expense.
Provisions are recognised when an entity has a present legal or constructive obligation as a result of a past event, it is probable that the entity will be required to settle the obligation, and a reliable estimate can be made of the amount of the obligation. The amount recognised as a provision is the best estimate of the expenditure required to settle the obligation at the end of the reporting period, considering the risks and uncertainties. Where a provision is measured using the cash flows estimated to settle the obligation, its carrying amount is the present value of those cash flows using discount rates prescribed by HM Treasury.
Treasury gives rates for short, medium, long-term and very long-term general provisions. These are defined as follows:
• short-term rate: A nominal discount rate to be applied to the cash flows of
general provisions in a time boundary between 0 and up to and including 5
years from the Statement of Financial Position date
• medium-term rate: A nominal discount rate to be applied to the cash flows
of general provisions in a time boundary of after 5 and up to and including
10 years from the Statement of Financial Position date
• long-term rate: A nominal discount rate to be applied to the cash flows of
general provisions in a time boundary of after 10 years and up to and
including 40 years from the Statement of Financial Position date
• very long-term rate: A nominal discount rate to be applied to the cash flows
of general provisions in a time boundary exceeding 40 years from the
Statement of Financial Position date
Inflation assumptions
In using nominal rates there is a need to inflate cashflows as such rates do not take a measure of inflation into account unlike real discount rates. HM Treasury provides the Office of Budget Responsibility (OBR) Consumer Price Index (CPI) forecasted inflation rates to be employed to expected cash flows, except where an entity has judged there is a reasoned basis for alternative rates to be employed. They are based on what is judged to be the most statistically reliable measure of inflation.
Impact of changes in discount rate
Some of government priorities carry obligations that are very long-term and will involve expenditure over decades to come. The eventual costs of these long-term projects are uncertain, but entities are required to present a single number in the annual accounts. This single number is based on best estimate of costs, technology and other relevant factors, adjusted to reflect the changing value of money over time. The worth of future cash flows is calculated at present value in accordance with accounting standards. Provision discount rates set by HM Treasury are updated annually and have a material effect on liabilities. Previously HM Treasury issued real rates based upon the real yield of UK index-linked gilts. From 2018-19 onwards, HM Treasury issued nominal rates that do not take account of inflation, unlike real rates. Using these nominal rates, the cash flows are inflated using inflation rates provided by HM Treasury except where a more appropriate forecast has been identified for specific provisions.
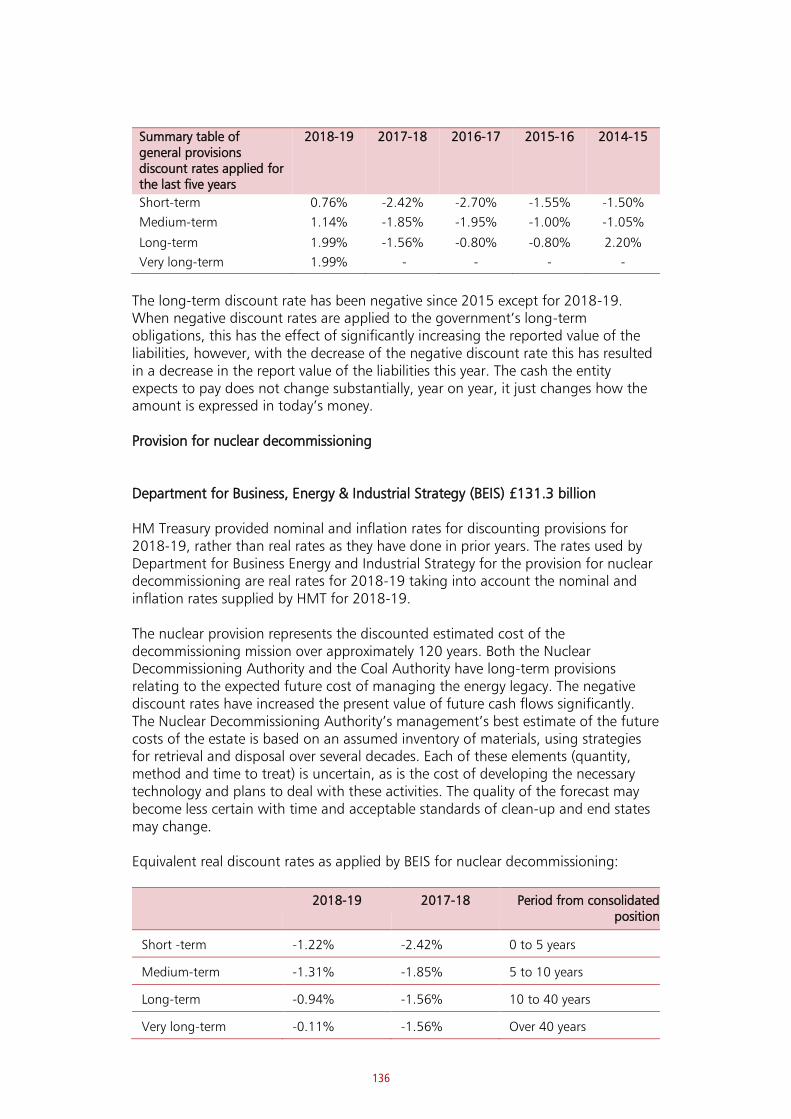
136
Summary table of general provisions discount rates applied for the last five years
2018-19 2017-18 2016-17 2015-16 2014-15
Short-term 0.76% -2.42% -2.70% -1.55% -1.50%
Medium-term 1.14% -1.85% -1.95% -1.00% -1.05%
Long-term 1.99% -1.56% -0.80% -0.80% 2.20%
Very long-term 1.99% - - - -
The long-term discount rate has been negative since 2015 except for 2018-19. When negative discount rates are applied to the government’s long-term obligations, this has the effect of significantly increasing the reported value of the liabilities, however, with the decrease of the negative discount rate this has resulted in a decrease in the report value of the liabilities this year. The cash the entity expects to pay does not change substantially, year on year, it just changes how the amount is expressed in today’s money. Provision for nuclear decommissioning Department for Business, Energy & Industrial Strategy (BEIS) £131.3 billion HM Treasury provided nominal and inflation rates for discounting provisions for 2018-19, rather than real rates as they have done in prior years. The rates used by Department for Business Energy and Industrial Strategy for the provision for nuclear decommissioning are real rates for 2018-19 taking into account the nominal and inflation rates supplied by HMT for 2018-19. The nuclear provision represents the discounted estimated cost of the decommissioning mission over approximately 120 years. Both the Nuclear Decommissioning Authority and the Coal Authority have long-term provisions relating to the expected future cost of managing the energy legacy. The negative discount rates have increased the present value of future cash flows significantly. The Nuclear Decommissioning Authority’s management’s best estimate of the future costs of the estate is based on an assumed inventory of materials, using strategies for retrieval and disposal over several decades. Each of these elements (quantity, method and time to treat) is uncertain, as is the cost of developing the necessary technology and plans to deal with these activities. The quality of the forecast may become less certain with time and acceptable standards of clean-up and end states may change. Equivalent real discount rates as applied by BEIS for nuclear decommissioning:
2018-19
2017-18 Period from consolidated position
Short -term -1.22% -2.42% 0 to 5 years
Medium-term -1.31% -1.85% 5 to 10 years
Long-term -0.94% -1.56% 10 to 40 years
Very long-term -0.11% -1.56% Over 40 years

137
The impact of the change in the discounting approach is included in the “Change in discount rate” movement of provisions. Where expenditure in settlement of a provision is expected to be recovered from a third party, the recoverable amount is treated as a separate asset. Provision charges in the SoCNE are shown net of changes in these recoverable amounts.
Ministry of Defence £11.4 billion
Provisions have been made for the cost of decommissioning facilities and for the treatment, storage, and disposal of nuclear waste arising from operations at Rosyth and Devonport dockyards and at Atomic Weapons Establishment sites. Provisions are also included for the future cost of decommissioning operational nuclear submarines and likewise for the cost of decommissioning those which have reached their out of service date. Provisions have also been made for the cost of the treatment, storage and disposal of the nuclear materials, irradiated fuel and radioactive waste arising from in the Defence Nuclear Programme as well as for the decommissioning of sites, facilities and 30 out of service and operational submarines for which the MOD is ultimately responsible.
The totality of nuclear provisions addresses a programme of work which is currently expected to extend over the next 118 years. In estimating the value of the provision required to settle the Department’s obligations, there remains a significant degree of inherent uncertainty in the future cost estimates and the assumptions that underpin them.
Provision for clinical negligence
The Department of Health and Social Care provides for future costs in several cases where it is the defendant in legal proceedings brought by claimants seeking damages for the effects of alleged clinical negligence. NHS England, NHS Foundation Trusts and NHS Trusts retain legal responsibility for all liabilities covered by the clinical negligence schemes: the Ex-Regional Health Authority Scheme (ex RHA), Existing Liabilities Scheme (ELS) and Clinical Negligence Scheme for Trusts (CNST), but NHS Resolution (NHSR) accounts for all the liabilities under these separate schemes. Actuaries appointed by NHSR undertake regular reviews to identify movements in the value of likely future settlements under these schemes, and these are recorded in the NHSR’s annual accounts.
Calculation of the provision for each scheme is made using:
• probability factors: the probability of a claim having to be settled is assessed
between 10% and 94%. This probability is applied to the gross value to give
the probable cost of each claim
• a discount factor calculated using HM Treasury’s nominal discount rates, RPI
of 3.6% and claims inflation (varying between schemes) of between 4% and
10%, is applied to the probable cost to take into account the likely time to
settlement

138
The difference between the gross value of claims and the amount of the provision is also discounted, considering the likely time to settlement, and is included in contingent liabilities as set out in Note 17 of DHSC accounts.
Due to the long-term nature of the liabilities and the assumptions on which the estimate of the provision is based, some uncertainty about the value of the liability remains. The clinical negligence provision’s value is particularly sensitive to changes in the long-term discount rate given its nature. Other factors affecting the value of the clinical negligence liability which are subject to estimation and assumption include patterns of delay in reporting incidents, assumptions regarding the severity, frequency and/or value inflation of claims, the differential between Retail Price Index (RPI) and Annual Hourly Earnings index over the long-term and life expectancy.
The HM Treasury Public Expenditure System discount rate note from December 2018 states that all cash flows should be assumed to increase in line with the Office for Budget Responsibility (OBR) Consumer Price Index (CPI) inflation rates unless three specific conditions are met. NHS Resolution have determined that in relation to Clinical Negligence the three conditions have been met and have therefore used alternative inflation measures. Further information and detail are available in NHS Resolution’s Annual Report and Accounts.
For 2018-19, general provisions were subject to four separate nominal discount rates as prescribed by HM Treasury, according to the expected timing of cashflows. A nominal short-term rate of positive 0.76% (2017-18 a real rate of negative 2.42%) is applied to expected cash flows in a time boundary of between 0 and up to and including 5 years from the Consolidated Statement of Financial Position date. A nominal medium-term rate of positive 1.14% (2017-18 a real rate of negative 1.85%) is applied to the time boundary of after 5 and up to and including 10 years. A nominal long-term rate of positive 1.99% (2017-18 a real rate of negative 1.56%) is applied to the time boundary of after 10 and up to and including 40 years from the Consolidated Statement of Financial Position date. A nominal very long-term rate of positive 1.99% (2017-18 a real rate of negative 1.56%) is applied to expected cashflows exceeding 40 years from the Consolidated Statement of Financial Position date.
Clinical negligence claims which may succeed, but are less likely or cannot be reliably estimated, are accounted for as contingent liabilities. Known reported claims are individually valued using likely costs to resolve the claim and probability factors to take account of the potential of a successful defence, whilst Incidents Incurred but Not Reported (IBNR) claims are valued using actuarial models to predict likely values. The value of the DHSC provision increased by £6.4 billion in 2018-19 from £76.7 billion at 31 March 2018 to £83.1 billion at 31 March 2019. £0.3 billion of this increase is related to a change in the HMT discount rate, and a £6.1 billion net movement on provisions created and written back in the year, utilised, and unwinding of discount. These provisions represent the English element of the clinical negligence provision shown in the accounts and is the value in today’s prices of the cost of claims arising from harm that occurred up to 31 March 2019. In 2018-19 NHSR received 10,678 new clinical negligence claims, compared to 10,673 in 2017-18, a relatively flat profile with an increase of just five claims (0.08%). As many claims are not paid out immediately but instead involve payments over many years, the liability includes determined claims as well as claims that are considered likely to be determined in the claimant’s favour.
139
Other provisions
Other provisions include a wide range of provisions across all parts of the public sector. These include provisions in relation to: injury benefits, medical costs, criminal injuries compensation, legal costs, compulsory purchases, concessionary fuel allowance to ex-miners, mine water treatment, public safety and subsidence, subsidence pumping stations and tip management, claims in respect of structural damage and diminution of value of properties affected by transport schemes, and compensation payments for termination of employment. The most significant provisions included in this balance are identified below:
Financial Assistance Scheme £5.7 billion (2017-18: £7.6 billion) This is held by the Department for Work and Pensions (DWP). FAS aids members of defined benefit occupational pension schemes that were wound up under-funded when their employers became insolvent during the period 1 January 1997 to 5 April 2005. The FAS assistance scheme provision is to provide for the liabilities arising from any FAS qualifying schemes once the assets from such schemes have transferred to government. The provision is an estimate of the current value of the liability to make payments to pensioners under the FAS scheme. A change in the discount rate during 2018-19 has created the £1.6 billion change in the value of the provision.
Pension Scheme claims £26.1 billion (2017-18: £23.2 billion) This is held by the Pension Protection Fund relating to liabilities to pay compensation to members and claims from pension schemes. The Pension Protection Fund retains the assets of the pension plans it rescues and generates investment growth to support the obligations it acquires. At 31 March 2019, it had £32.1 billion of assets under management, £9 billion in excess of its liabilities
Oil and gas field decommissioning £8.3 billion (2017-18: £12.9 billion) This is where companies decommissioning oil and gas infrastructure in the North Sea are entitled to recover tax previously paid in relation to profits from those oil and gas fields. As at 31 March 2019, HMRC estimates that it will have to repay £8.3 billion (2017-18: £12.9 billion) of tax in relation to oil and gas field decommissioning. This is the estimated amount that HMRC will repay to oil and gas companies and is based on an estimate of the decommissioning costs that they will incur in future periods. In 2018-19, companies recovered £0.5 billion of Petroleum Revenue Tax (PRT) from HMRC in relation to decommissioning losses. In addition to repayments of PRT, HMRC estimates that it will forgo a further £11.1 billion of future tax income because of decommissioning expenditure reducing taxable profits.
Legal Claims £4.7 billion (2017-18: £5.9 billion) This is where taxpayers have disputed the interpretation of legislation through the courts and want the tax payable to be reassessed. The outcome depends on the court ruling. The main reason for the reduction since 2017-18 is that HMRC’s current legal advice indicates that its exposure to ongoing legal cases has reduced.
Note 23. Financial instruments
IFRS 9 introduces new reporting requirements for financial instruments and applies
to annual reporting periods beginning on or after 1 January 2018. IFRS 9 does not
require prior year comparative information to be restated. Therefore, WGA will apply

140
IFRS 9 without the restatement of comparatives from 1 April 2018. This is due to an
adaptation to the government financial reporting manual.
This financial instrument note has two parts. The first part provides information on the significance of financial instruments on the government’s balance sheet. The second part provides information about the nature and extent of risks arising from financial instruments and what the government does to manage these risks.
Financial assets by category 2018-19
Note Cash and cash
equivalents
Amortised
Cost
Fair Value
Through Profit or
loss (FVTPL)
Fair Value
Through Other
Comprehensive
income (FVTOCI)
2018-19
Total
£bn £bn £bn £bn £bn
Cash and cash
equivalents 18 44.2 - - - 44.2
Trade and other
receivables 15 - 190.3 - - 190.3
Debt securities 16 - - 105.0 - 105.0
Loans and deposits
(including REPOS) 16 - 183.0 16.3 6.0 205.3
Student loans 16 - - 76.9 - 76.9
Equity investments 16 - - 29.0 27.3 56.3
IMF quota
subscription 16 - - 21.4 - 21.4
IMF Special
Drawing Rights 16 - - 11.8 - 11.8
Other 16 - 8.9 28.7 0.6 38.2
Total financial
assets 44.2 382.2 289.1 33.9 749.4
Most debt securities (£81.0 billion, 2017-18: £73.6 billion) are held in the EEA, and
comprise the UK’s official holding of international reserves. The government holds
foreign currency reserves on a precautionary basis to meet current policy objectives
to regulate the exchange value of sterling and any potential future changes in
policy.
Other significant financial assets include those lent under the Funding for Lending
Scheme (FLS). Under FLS participating banks and building societies could until
January 2018 borrow Treasury Bills from the Bank of England in exchange for
eligible collateral. As at 31 March 2019, on an amortised cost basis, £23.2 billion
(2017-18: £39.2 billion) of Treasury bills issued for the FLS were outstanding; further
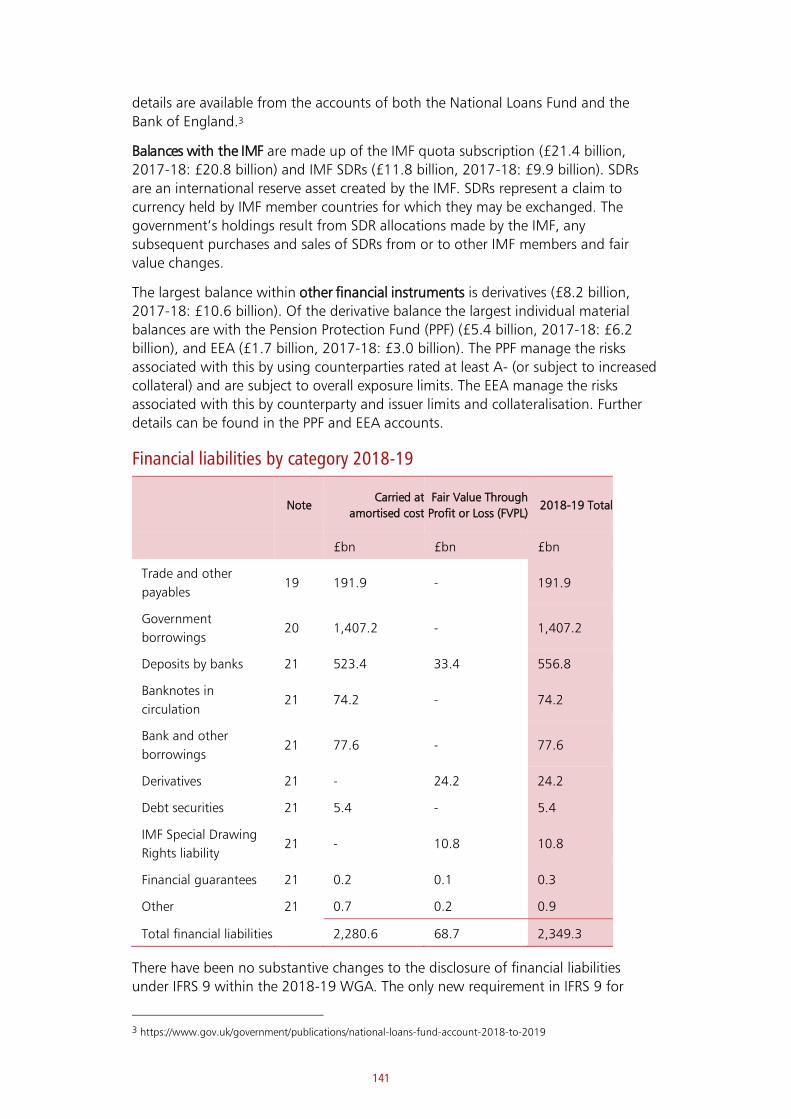
141
details are available from the accounts of both the National Loans Fund and the
Bank of England.3
Balances with the IMF are made up of the IMF quota subscription (£21.4 billion,
2017-18: £20.8 billion) and IMF SDRs (£11.8 billion, 2017-18: £9.9 billion). SDRs
are an international reserve asset created by the IMF. SDRs represent a claim to
currency held by IMF member countries for which they may be exchanged. The
government’s holdings result from SDR allocations made by the IMF, any
subsequent purchases and sales of SDRs from or to other IMF members and fair
value changes.
The largest balance within other financial instruments is derivatives (£8.2 billion,
2017-18: £10.6 billion). Of the derivative balance the largest individual material
balances are with the Pension Protection Fund (PPF) (£5.4 billion, 2017-18: £6.2
billion), and EEA (£1.7 billion, 2017-18: £3.0 billion). The PPF manage the risks
associated with this by using counterparties rated at least A- (or subject to increased
collateral) and are subject to overall exposure limits. The EEA manage the risks
associated with this by counterparty and issuer limits and collateralisation. Further
details can be found in the PPF and EEA accounts.
Financial liabilities by category 2018-19
Note Carried at
amortised cost Fair Value Through
Profit or Loss (FVPL) 2018-19 Total
£bn £bn £bn
Trade and other
payables 19 191.9 - 191.9
Government
borrowings 20 1,407.2 - 1,407.2
Deposits by banks 21 523.4 33.4 556.8
Banknotes in
circulation 21 74.2 - 74.2
Bank and other
borrowings 21 77.6 - 77.6
Derivatives 21 - 24.2 24.2
Debt securities 21 5.4 - 5.4
IMF Special Drawing
Rights liability 21 - 10.8 10.8
Financial guarantees 21 0.2 0.1 0.3
Other 21 0.7 0.2 0.9
Total financial liabilities 2,280.6 68.7 2,349.3
There have been no substantive changes to the disclosure of financial liabilities
under IFRS 9 within the 2018-19 WGA. The only new requirement in IFRS 9 for
3 https://www.gov.uk/government/publications/national-loans-fund-account-2018-to-2019
142
financial liabilities relates to change in the fair value of an entity’s own debt
instruments under the fair value option. This new requirement is to prevent entities
from recognising gains in profit and loss when their own credit quality declines.
In most cases the value of assets and liabilities shown on the statement of financial
position either equals or is a reasonable approximation of fair value. The main
exceptions are government borrowings and the Contracts for Differences (CfD)
liability (included in derivatives in the table above). Gilt-edged securities have a
carrying amount of £1,160.0 billion (2017-18: £1,122.0 billion) and a fair value of
£1,496.1 billion (2017-18: £1,427.1 billion), reflecting the higher amount that
investors are willing to pay in order to secure a certain level of interest payment. The
CfD liability has a carrying value of £12.9 billion (2017-18: £15.8 billion) and a fair
value of £35.2 billion (2017-18: £39.2 billion). The decrease of £4.0 billion in fair
value is mainly due to revisions to the wholesale price electricity forecasts that are
expected to be achieved by generators and payments made during the 2018-19
year. The best estimate of fair value as at 31 March 2019 for the Hinkley Point C
(HPC) CfD liability is £30.3 billion (2017-18: £36.6 billion). However, it should be
noted that this liability has not been recognised in the WGA financial statements.
This is due to the unavoidable uncertainties in creating a fair value estimate for HPC.
Further details can be found in the Department for Business, Energy and Industry
Strategy (BEIS) annual report and accounts4, and in Note 2 of WGA.
The government also has gold holdings which are treated as being like a financial
asset and are reported at fair value based on the sterling equivalent of the dollar
denominated spot bid price as at 31 March 2019. During 2018-19, the price of gold
rose from £943 to £994 per ounce, an increase of 5% giving rise to a revaluation
gain of £508 million.
Fair value hierarchy
Assets and liabilities carried at fair value are valued using a ‘fair value hierarchy’
which gives highest priority to quoted prices in active markets for identical
instruments (level 1 inputs), second priority to valuation techniques based on
observable inputs (level 2) and lowest priority to valuation techniques using
unobservable inputs. Where valuation techniques are based on unobservable inputs
(level 3) then the appropriate valuation technique is chosen, including use of
discounting of future cash flows and the use of the net asset values underlying the
unquoted equity investment. The table below summarises asset and liability fair
values based on the valuation technique used.
4 https://assets.publishing.service.gov.uk/government/uploads/system/uploads/attachment_data/file/824924/beis-
annual-report-accounts-2018-2019-web.pdf

143
Fair value hierarchy 2018-19
Level 1
£bn
Level 2
£bn
Level 3
£bn
2018-19 Total
£bn
Financial assets at fair value:
Debt securities 96.3 5.8 2.9 105.0
Equity investments 30.9 1.1 24.3 56.3
IMF quota - 21.4 - 21.4
IMF Special Drawing Rights 11.8 - - 11.8
Loans and deposits (including
REPO)
10.4 6.4 5.5 22.3
Student loans - - 76.9 76.9
Other 3.8 19.8 5.7 29.3
Financial liabilities at fair value:
Deposits by banks (4.1) (29.3) - (33.4)
IMF SDR allocation (10.8) - - (10.8)
Other (0.1) (11.2) (13.2) (24.5)
The most significant individual level 3 assets balance is student loans which is not
observable market data. Further details can be found in the annual report and
accounts of the Department for Education. Second is the CfD contracts which use a
discounted cash flow methodology, further details can be found in the annual
report and accounts of BEIS.
The most significant level 3 asset within equity investments is in the European
Investment Bank (EIB). The valuation of this asset changes based on the movement
in the EIB’s net assets and changes in exchange rates. Further details can be found
in the accounts of the Consolidated Fund.5
Liquidity risk
The government’s objective when funding its activities is to minimise, over the long
term, the costs of meeting the government’s financing needs considering risk, while
ensuring that debt management policy is consistent with the aims of monetary
policy.
Each year, the government assesses the costs and risks associated with different
possible patterns of debt issuance, considering the most up-to-date evidence and
information about market conditions and demand for debt instruments. This
information is used to set the Debt Management Office’s (DMO’s) financing remit
which is published alongside the Budget and updated during the year to reflect
changes to the government’s cash requirements.
5 https://www.gov.uk/government/publications/consolidated-fund-account-2018-to-2019
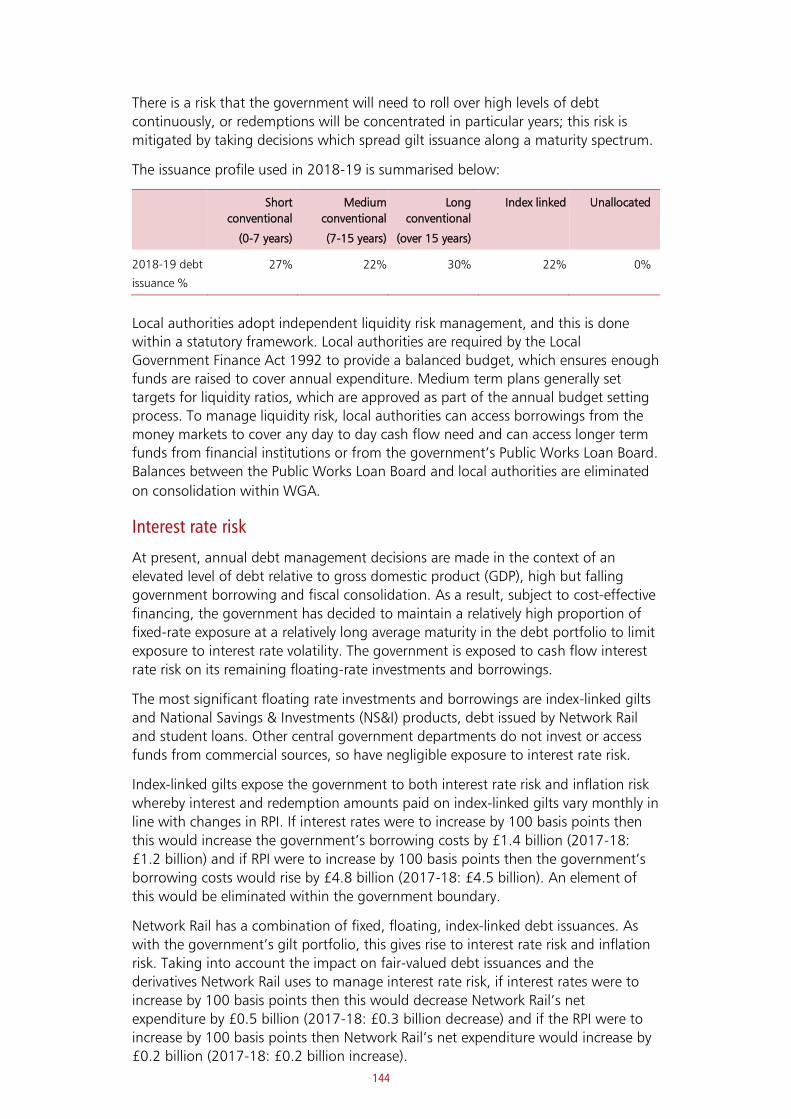
144
There is a risk that the government will need to roll over high levels of debt
continuously, or redemptions will be concentrated in particular years; this risk is
mitigated by taking decisions which spread gilt issuance along a maturity spectrum.
The issuance profile used in 2018-19 is summarised below:
Short
conventional
(0-7 years)
Medium
conventional
(7-15 years)
Long
conventional
(over 15 years)
Index linked Unallocated
2018-19 debt
issuance %
27% 22% 30% 22% 0%
Local authorities adopt independent liquidity risk management, and this is done
within a statutory framework. Local authorities are required by the Local
Government Finance Act 1992 to provide a balanced budget, which ensures enough
funds are raised to cover annual expenditure. Medium term plans generally set
targets for liquidity ratios, which are approved as part of the annual budget setting
process. To manage liquidity risk, local authorities can access borrowings from the
money markets to cover any day to day cash flow need and can access longer term
funds from financial institutions or from the government’s Public Works Loan Board.
Balances between the Public Works Loan Board and local authorities are eliminated
on consolidation within WGA.
Interest rate risk
At present, annual debt management decisions are made in the context of an
elevated level of debt relative to gross domestic product (GDP), high but falling
government borrowing and fiscal consolidation. As a result, subject to cost-effective
financing, the government has decided to maintain a relatively high proportion of
fixed-rate exposure at a relatively long average maturity in the debt portfolio to limit
exposure to interest rate volatility. The government is exposed to cash flow interest
rate risk on its remaining floating-rate investments and borrowings.
The most significant floating rate investments and borrowings are index-linked gilts
and National Savings & Investments (NS&I) products, debt issued by Network Rail
and student loans. Other central government departments do not invest or access
funds from commercial sources, so have negligible exposure to interest rate risk.
Index-linked gilts expose the government to both interest rate risk and inflation risk
whereby interest and redemption amounts paid on index-linked gilts vary monthly in
line with changes in RPI. If interest rates were to increase by 100 basis points then
this would increase the government’s borrowing costs by £1.4 billion (2017-18:
£1.2 billion) and if RPI were to increase by 100 basis points then the government’s
borrowing costs would rise by £4.8 billion (2017-18: £4.5 billion). An element of
this would be eliminated within the government boundary.
Network Rail has a combination of fixed, floating, index-linked debt issuances. As
with the government’s gilt portfolio, this gives rise to interest rate risk and inflation
risk. Taking into account the impact on fair-valued debt issuances and the derivatives Network Rail uses to manage interest rate risk, if interest rates were to increase by 100 basis points then this would decrease Network Rail’s net expenditure by £0.5 billion (2017-18: £0.3 billion decrease) and if the RPI were to increase by 100 basis points then Network Rail’s net expenditure would increase by £0.2 billion (2017-18: £0.2 billion increase).

145
The interest rate on pre 2012 student loans is the lower of RPI and the Bank of
England base rate plus 1%. The amount of interest repayable is therefore subject to
fluctuations in base rates and RPI. The impact of the interest rate risk for student
loan issued under the pre 2012 scheme is factored into the carrying value as the
student loan repayment model calculates the impact of the interest rate on expected
future cash flows. There is inherent risk in forecasting the amount of interest
payable and if the UK experiences base rates that are lower than RPI the future cash
flows will be impaired further. It would require a change in RPI of 3.2% (2017-18:
2.6%) to decrease the value of the pre 2012 loan book by 1%. The same change in
the post 2012 undergraduate full time loan book would require a 4.1% (2017-18:
4.0%) decrease in RPI to increase the value of the loan book by 1%, with a 4.1%
(2017-18: 3.7%) increase in RPI to decrease the value of loan book by 1%.
Credit risk
The categories of financial assets where the main credit risks are found are: loans
and deposits (£205.3 billion) and student loans (£76.9 billion).
Loans and deposits mainly comprise loans provided through the Term Funding
Scheme (TFS) of £121.4bn (2017-18: £127.1bn). The Bank of England manages
credit risk by ensuring that exposures are fully backed by collateral, with appropriate
adjustments made between the asset market value and the value that can be used
for collateral purposes. The range of collateral can include mortgage-backed
securities, covered bonds with preferential terms backed by a pool of mortgages or
public sector securities, or portfolios of loans in unsecured form. The collateral must
meet published eligibility criteria. A summary of eligible criteria is available on the
Bank of England website, and further details can be found in the Bank of England
annual report and accounts.6
A further £50.1 billion (2017-18 £41.7 billion) of loans and deposits arise from reverse sale and repurchase agreements. These agreements are mainly entered into by the Bank of England, DMA, and EEA. Exposures to credit risk are fully collateralised and assets held as collateral are revalued daily. The government returns collateral to the provider of collateral, or requests additional collateral, depending on whether the value of collateral has risen or fallen. Details on collateral held under these agreements can be found in the accounts of the Bank of England, the DMA and the EEA.
Loans and deposits also include mortgage loans made by UKAR (£5.5 billion, 2017-
18: £11.5 billion) which are not rated but are assessed for expected credit loss.
Details on the credit quality of these mortgage loans can be found in UKAR’s
accounts.
Student loans are a source of a credit risk. Eligible students can get loans regardless of their credit rating in order to support the policy aim of encouraging students to enter higher and further education. There is no obligation to repay the loan until the borrower’s income reaches a certain income threshold and there are other circumstances when the loan will be written off, for example based on the age of the student. Therefore, even though most repayments are collected by HMRC as part of the tax collection process, not all the loans will be repaid.
6 https://www.bankofengland.co.uk/asset-purchase-facility/2019/2018-19

146
The total balance sheet value of student loans provided by government, including those via the devolved administrations, is £76.9 billion (2017-18: £70.0 billion). The Department for Education, representing English students, holds £67.9 billion (2017-18: £61.1 billion). The face value of the Department for Education's loan book was £116.8 billion (2017-18: £101.9 billion face value). In December 2018, the government completed the second sale of part of the Department for Education's pre-2012 English student loan book. The balance sheet value of the loans sold was £3.1 billion (2017-18: £2.6 billion) under the revised FVTPL approach, leading to a loss on disposal of £1.1 billion (2017-18: £0.9 billion), this loss has been recorded in the DfE SoCNE. The remaining loan book continues to be accounted for under fair value per IFRS 9. In determining the fair value of student loans, DfE has used a discounted cash flow model and this includes all expected cash flows, including the interest that is expected to be received. As a result, a single fair value movement is now recognised in the DfE statement of comprehensive net expenditure.
The impact of credit risk and policy decisions on repayment conditions on all Department for Education student loans are shown by the following table of fair value assets:
Following the adoption of IFRS 9 Expected credit loss (ECL) “forward-looking model”, it is no longer necessary for a loss event to have occurred before credit losses are recognised. WGA entities are now required to recognise either a 12-month or lifetime ECL, depending on whether there has been a significant increase in credit risk since initial recognition. The ECL model applies to both debt instruments accounted for at amortised cost and at FVTOCI.
Expected Credit loss for assets held at amortised cost
Financial assets impaired
Gross financial assets
Stage 1
Stage 2
Stage 3
Simplified Impairment
rule Net financial
assets
£bn £bn £bn £bn £bn £bn Trade and other receivables 43.2 - - - (8.0) 35.2 Loans held at amortised costs 141.2 (0.5) (0.1) - - 140.6 Total financial assets 184.4 (0.5) (0.1) - (8.0) 175.8
Balance sheet
value
£bn
2018-19 closing
FV adjustment
under IFRS 9
£bn
Balance sheet
value
£bn
2017-18 Revised
FV Provision
£bn
Pre-2012 higher education
loans
22.8 11.4 26.4 12.4
Post 2012 higher education
loans
45.1 37.4 34.7 28.4
IFRS 9 transition cumulative - - (0.5) 0.5
Total student loans held by
Department for Education
67.9 48.8 60.6 41.3
147
Stage 1: assets for which there has been no significant increase in credit risk since the asset’s origination the impairment provision reflects the next 12 months' ECL.
Stage 2: assets for which there has been a significant increase in credit risk since the asset’s origination the impairment provision reflected full lifetime ECL.
Stage 3: assets which are in default, interest income is recognised only in respect of the balance net of impairment.
The above table illustrates:
• The WGA note most affected by the changes to the impairment of financial
assets, under IFRS 9, is note 15 (Trade and other receivables). The format of
this note changes as a result of IFRS 9. However, due to the change in the
impairment methodologies, additional narrative has been added to this note
to clarify that the 2017-18 comparative figures, under IAS 39, are calculated
on different basis to those shown for 2018-19 under IFRS 9; therefore any
comparison between the two needs to be qualified in these terms.
• Entities should apply the simplified expected credit loss model approach to
trade receivables. Contract assets and lease receivables, when they meet
certain criteria, shall always measure the loss allowance at an amount equal
to lifetime expected credit loss. WGA entities can select their own
accounting policy for trade receivables, lease receivables and contract assets
independently. In 2018-19, WGA entities have £8.0 billion expected credit
loss under trade and other receivables.
• Most of loans held at amortised cost consist of Term Funding Scheme loans
(TFS) of £121.4 billion. The Bank of England manages credit risk associated
with these loans by ensuring that exposures are fully backed by collateral.
• Most of the loan liabilities held at amortised cost of £0.5bn are classified as
Stage 1, which means these assets have had no significant increase in credit
risk since the asset’s origination.
Foreign currency assets inevitably carry some element of credit risk. In order to keep
this risk at a low level, the government predominantly invests in securities issued, or
guaranteed by, the national governments of the United States, Euro area countries
and Japan. The EEA debt securities are held at an equivalent external rating of AA
and above (£76.2 billion, 2017-18: £68.9 billion restated) and A to AA (£ 4.8
billion, 2017-18: £4.6 billion restated) and were held within Europe (£30.3 billion,
2017-18: £30.5 billion), North America (£45.9 billion, 2017-18: £38.5 billion), and
Asia-Pacific (£4.7 billion, 2017-18: £4.5 billion). Further details on the government’s
credit risk management of foreign currency reserves can be found in the 2018-19
Exchange Equalisation Account.
Foreign exchange rate risk
The government is mainly exposed to foreign exchange risk on the UK’s official
holdings of international reserves (‘the Official Reserves’). Foreign currency reserves
are held on a precautionary basis that could be used, when necessary, to regulate
the exchange value of sterling, and is the mechanism through which any UK
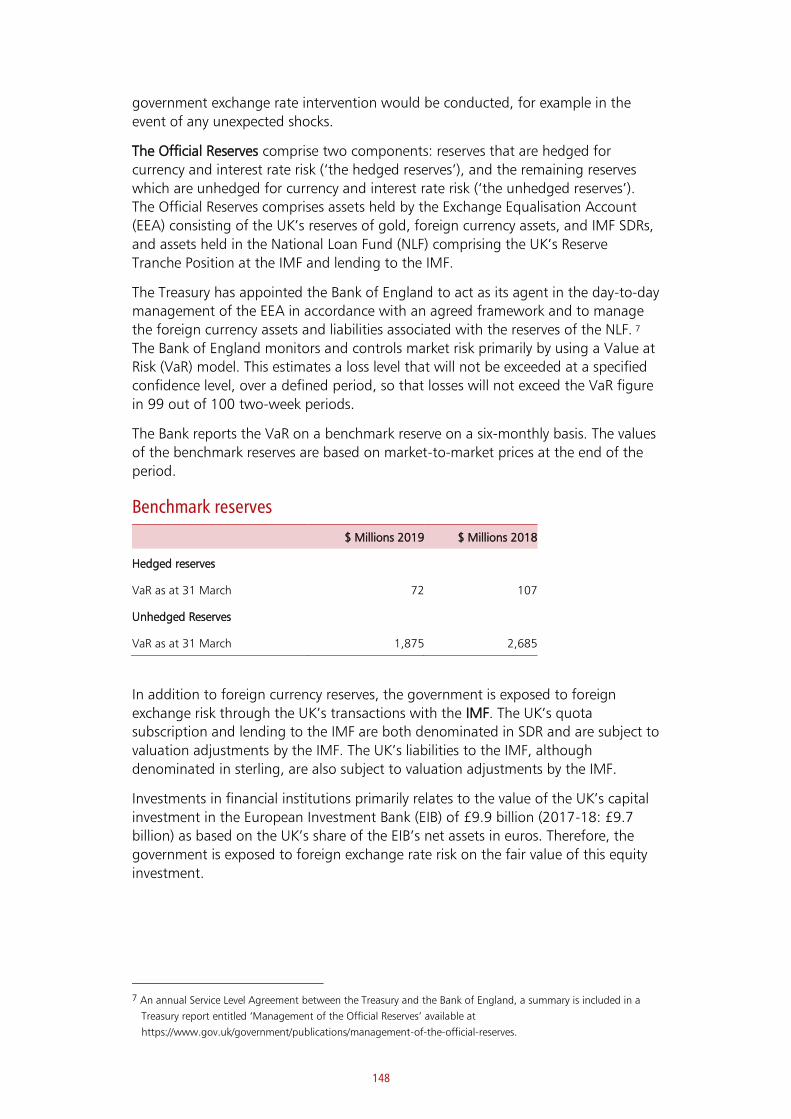
148
government exchange rate intervention would be conducted, for example in the
event of any unexpected shocks.
The Official Reserves comprise two components: reserves that are hedged for
currency and interest rate risk (‘the hedged reserves’), and the remaining reserves
which are unhedged for currency and interest rate risk (‘the unhedged reserves’).
The Official Reserves comprises assets held by the Exchange Equalisation Account
(EEA) consisting of the UK’s reserves of gold, foreign currency assets, and IMF SDRs,
and assets held in the National Loan Fund (NLF) comprising the UK’s Reserve
Tranche Position at the IMF and lending to the IMF.
The Treasury has appointed the Bank of England to act as its agent in the day-to-day
management of the EEA in accordance with an agreed framework and to manage
the foreign currency assets and liabilities associated with the reserves of the NLF. 7
The Bank of England monitors and controls market risk primarily by using a Value at
Risk (VaR) model. This estimates a loss level that will not be exceeded at a specified
confidence level, over a defined period, so that losses will not exceed the VaR figure
in 99 out of 100 two-week periods.
The Bank reports the VaR on a benchmark reserve on a six-monthly basis. The values
of the benchmark reserves are based on market-to-market prices at the end of the
period.
Benchmark reserves
$ Millions 2019 $ Millions 2018
Hedged reserves
VaR as at 31 March 72 107
Unhedged Reserves
VaR as at 31 March 1,875 2,685
In addition to foreign currency reserves, the government is exposed to foreign
exchange risk through the UK’s transactions with the IMF. The UK’s quota
subscription and lending to the IMF are both denominated in SDR and are subject to
valuation adjustments by the IMF. The UK’s liabilities to the IMF, although
denominated in sterling, are also subject to valuation adjustments by the IMF.
Investments in financial institutions primarily relates to the value of the UK’s capital
investment in the European Investment Bank (EIB) of £9.9 billion (2017-18: £9.7
billion) as based on the UK’s share of the EIB’s net assets in euros. Therefore, the
government is exposed to foreign exchange rate risk on the fair value of this equity
investment.
7 An annual Service Level Agreement between the Treasury and the Bank of England, a summary is included in a
Treasury report entitled ‘Management of the Official Reserves’ available at
https://www.gov.uk/government/publications/management-of-the-official-reserves.

149
Price Risk
The government is exposed to price risk on its shareholding in Royal Bank of
Scotland (RBS). The fair value of these UK listed shares fluctuates as a result of
changes in market prices. Market prices for a share may fluctuate due to factors
specific to the individual share or its issuer, or factors affecting all shares traded in
the market. UK Government Investments (a wholly owned subsidiary of HM
Treasury) is responsible for the development and execution of an investment strategy
for disposing of the investments in RBS in an orderly and active way, within the
context of protecting and creating value for the taxpayer.

150
Note 24. Public sector pensions
Pension liabilities
The public sector pension liabilities are summarised in the following table with
figures separated out for each of the workforces. The table also shows the
percentage change in the net liabilities between 2017-18 and 2018-19.
Scheme
liabilities
Scheme
assets
2018-19
Net liabilities
2017-18 Net
liabilities
Change in
scheme
liabilities
£bn £bn £bn £bn %
Unfunded schemes
NHS 620.1 - 620.1 612.6 1.2
Teachers 411.0 - 411.0 412.9 (0.5)
Civil Service 261.1 - 261.1 260.9 0.1
Armed Forces 195.3 - 195.3 195.5 (0.1)
Police 171.6 - 171.6 161.7 6.1
Royal Mail 44.0 - 44.0 46.4 (5.2)
Fire 31.4 - 31.4 29.2 7.5
Other unfunded 21.6 - 21.6 22.6 (4.4)
1,756.1 - 1,756.1 1,741.8 0.8
Funded schemes
Local government 387.5 (268.0) 119.5 106.0 12.7
Other funded 100.8 (82.5) 18.3 17.5 4.6
488.3 (350.5) 137.8 123.5 11.6
Total 2,244.4 (350.5) 1,893.9 1,865.3 1.5
The Local Government Pensions Scheme (LGPS) is the largest funded scheme. The
LGPS (England and Wales) consists of 89 separate funds, with the LGPS (Scotland)
having 11 main funds and a single fund for the LGPS (Northern Ireland). The
individual local authority employers that contributed to these funds recognised their
proportion of the scheme liabilities in their statement of accounts. The local
government funded schemes balance disclosed above includes the portion of the
pension liability of the LGPS that was reported in the financial accounts of the
individual local authority employers.

151
Other unfunded schemes include schemes within the UK Atomic Energy Authority
(UKAEA Pension Scheme) £7.5 billion (2017-18: £8.0 billion); and the Research
Councils (RCPS) £5.2 billion (2017-18: £5.3 billion).
Other funded schemes comprise largely of net liability balances reported by
Academy schools in the Local Government Pension Scheme £6.6 billion (2017-18:
£7.0 billion); Department for Transport - including Network Rail £4.9 billion (2017-
18: £4.3 billion); Ministry of Justice £2.0 billion (2017-18: £1.6 billion); and BBC
£0.5 billion (2017-18: £0.5 billion). It also includes other LGPS net liabilities for
bodies within the WGA boundary which are not local authorities.
In addition to updates provided in annual accounts, public sector pension schemes
carry out periodic full actuarial valuations which are used to set employer
contribution rates. The last actuarial valuations for most of the unfunded pension
schemes were carried out as at 31 March 2016, which set the employer contribution
rates for a 4-year period from 1 April 2019.
Increase in pension liabilities
The table below breaks down the changes in the present value of gross scheme
liabilities over the financial year.
Unfunded
£bn
Funded
£bn
Total
£bn
Gross liability at 1 April 2018 1,741.8 454.2 2,196.0
Current service costs (net of participants’ contribution) 48.4 13.8 62.2
Past service costs 29.4 2.4 31.8
Settlements/curtailments (0.1) (0.5) (0.6)
Interest on scheme liabilities 44.6 11.7 56.3
Contribution by scheme participants 9.6 2.3 11.9
(Gains)/Losses on revaluation:
Experience (gains) and losses arising on liabilities (4.3) 3.3 (1.0)
Changes in assumptions underlying the value of liabilities (70.3) 14.3 (56.0)
Benefits paid (43.3) (12.5) (55.8)
Transfers in/(out) 0.3 (0.7) (0.4)
Gross liability at 31 March 2019 1,756.1 488.3 2,244.4
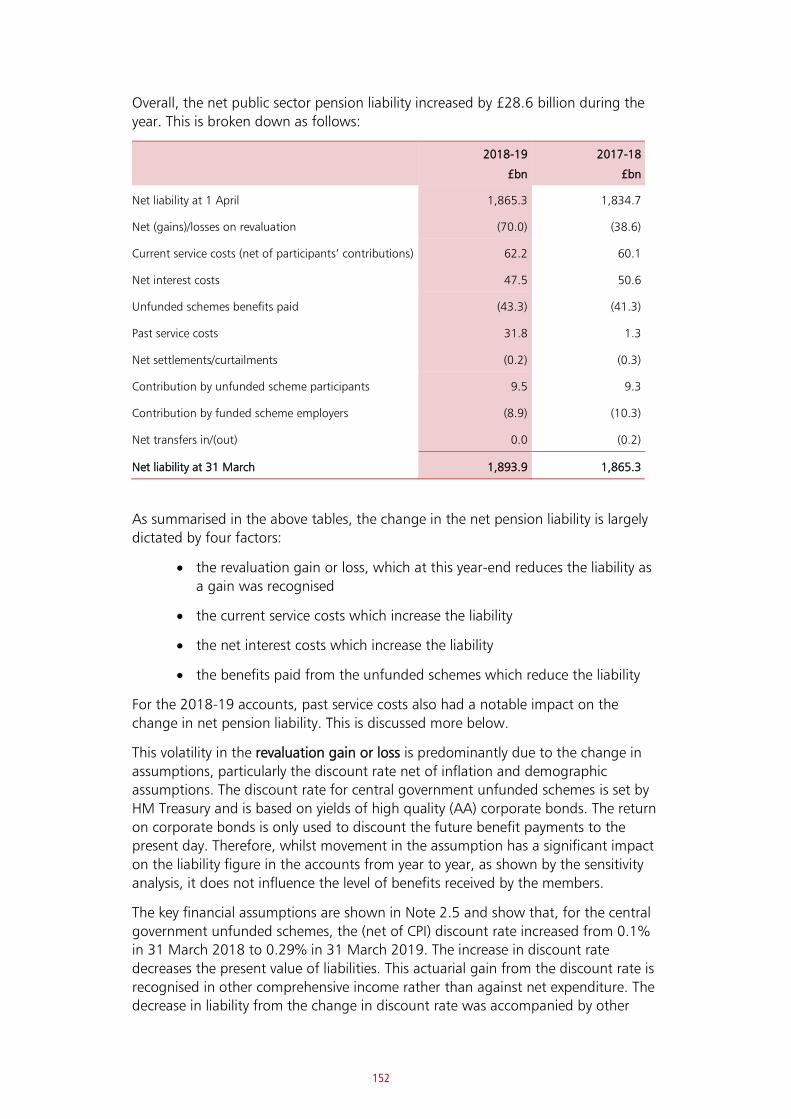
152
Overall, the net public sector pension liability increased by £28.6 billion during the
year. This is broken down as follows:
2018-19
£bn
2017-18
£bn
Net liability at 1 April 1,865.3 1,834.7
Net (gains)/losses on revaluation (70.0) (38.6)
Current service costs (net of participants’ contributions) 62.2 60.1
Net interest costs 47.5 50.6
Unfunded schemes benefits paid (43.3) (41.3)
Past service costs 31.8 1.3
Net settlements/curtailments (0.2) (0.3)
Contribution by unfunded scheme participants 9.5 9.3
Contribution by funded scheme employers (8.9) (10.3)
Net transfers in/(out) 0.0 (0.2)
Net liability at 31 March 1,893.9 1,865.3
As summarised in the above tables, the change in the net pension liability is largely
dictated by four factors:
• the revaluation gain or loss, which at this year-end reduces the liability as
a gain was recognised
• the current service costs which increase the liability
• the net interest costs which increase the liability
• the benefits paid from the unfunded schemes which reduce the liability
For the 2018-19 accounts, past service costs also had a notable impact on the
change in net pension liability. This is discussed more below.
This volatility in the revaluation gain or loss is predominantly due to the change in
assumptions, particularly the discount rate net of inflation and demographic
assumptions. The discount rate for central government unfunded schemes is set by
HM Treasury and is based on yields of high quality (AA) corporate bonds. The return
on corporate bonds is only used to discount the future benefit payments to the
present day. Therefore, whilst movement in the assumption has a significant impact
on the liability figure in the accounts from year to year, as shown by the sensitivity
analysis, it does not influence the level of benefits received by the members.
The key financial assumptions are shown in Note 2.5 and show that, for the central
government unfunded schemes, the (net of CPI) discount rate increased from 0.1%
in 31 March 2018 to 0.29% in 31 March 2019. The increase in discount rate
decreases the present value of liabilities. This actuarial gain from the discount rate is
recognised in other comprehensive income rather than against net expenditure. The
decrease in liability from the change in discount rate was accompanied by other

153
changes in liability from changes in other assumptions, leading to an overall
revaluation gain that reduced the liability.
The table below shows the approximate sensitivity of the unfunded liability to
changes in key assumptions. Opposite changes in the assumptions will produce
approximately equal and opposite changes in the liability. The sensitivity will be
broadly similar for the gross liability of the funded schemes.
% change in value of
unfunded liability
£bn change in
unfunded liability
Increasing the assumption by 0.5% a year:
Discount rate (12.0%) (211.0)
Rate of increase in pensions 8.0% 140.0
Rate of increase in Salaries 2.0% 35.0
Increasing assumed life expectancy in retirement by 1 year 3.0% 53.0
The current service cost is an estimate made by scheme actuaries of the benefits
earned by employees in the year.
The net interest cost reflects the increase in the present value of the pension liability
during the year because the benefits are one period closer to settlement. The
financing cost is based on the discount rate (including inflation) at the start of the
year and is calculated on the net liability. The expense from unwinding the discount
rate is recognised against net expenditure.
Past service costs reflect changes in the present value of scheme liabilities related to
employee service in prior periods that arise in the current period as a result of
changes to retirement benefits.
In December 2018 the Court of Appeal ruled against the government in the two
cases of Sargeant and McCloud, relating to the firefighter unfunded pension
schemes and the pension arrangements for the judiciary. The Court held that the
transitional protections, which were afforded to older members when the reformed
schemes were introduced in 2015, constituted unlawful age discrimination. On 27
June 2019 the Supreme Court refused the government's application for permission
to appeal the ruling.
In respect of public service pensions the government believes that the difference in
treatment will need to be remedied across all the schemes including the NHS, civil
service, local government, teachers, police, armed forces, judiciary and fire and
rescue workers. This would lead to an increase in pension scheme liabilities. In the
2018-19 accounts, actuaries, have estimated the potential increase in scheme
accounting liabilities across the public sector to be £30.5bn. This £30.5bn increase
can be seen under the heading Past service costs.
The central government schemes experiencing the largest McCloud impacts were as
follows:
• National Health Service Pension Scheme: £7.3 billion representing 1.4% of the
overall scheme liability
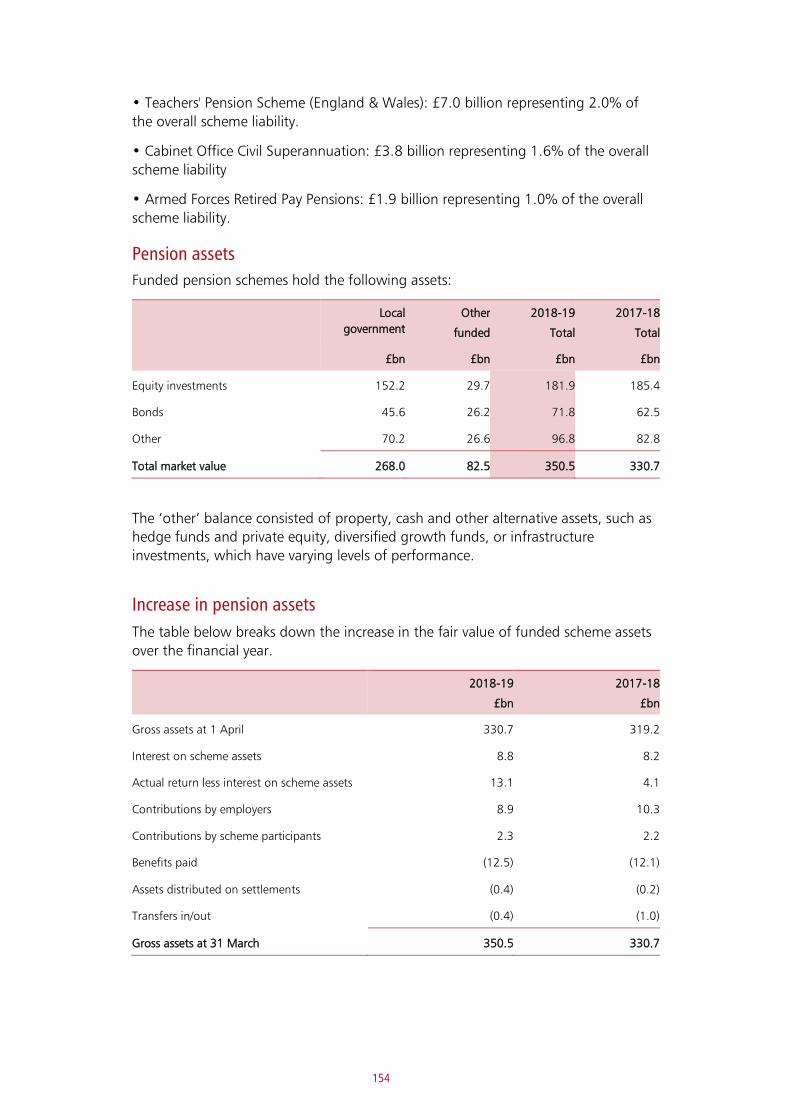
154
• Teachers' Pension Scheme (England & Wales): £7.0 billion representing 2.0% of
the overall scheme liability.
• Cabinet Office Civil Superannuation: £3.8 billion representing 1.6% of the overall
scheme liability
• Armed Forces Retired Pay Pensions: £1.9 billion representing 1.0% of the overall
scheme liability.
Pension assets
Funded pension schemes hold the following assets:
Local
government
Other
funded
2018-19
Total
2017-18
Total
£bn £bn £bn £bn
Equity investments 152.2 29.7 181.9 185.4
Bonds 45.6 26.2 71.8 62.5
Other 70.2 26.6 96.8 82.8
Total market value 268.0 82.5 350.5 330.7
The ‘other’ balance consisted of property, cash and other alternative assets, such as
hedge funds and private equity, diversified growth funds, or infrastructure
investments, which have varying levels of performance.
Increase in pension assets
The table below breaks down the increase in the fair value of funded scheme assets
over the financial year.
2018-19
£bn
2017-18
£bn
Gross assets at 1 April 330.7 319.2
Interest on scheme assets 8.8 8.2
Actual return less interest on scheme assets 13.1 4.1
Contributions by employers 8.9 10.3
Contributions by scheme participants 2.3 2.2
Benefits paid (12.5) (12.1)
Assets distributed on settlements (0.4) (0.2)
Transfers in/out (0.4) (1.0)
Gross assets at 31 March 350.5 330.7
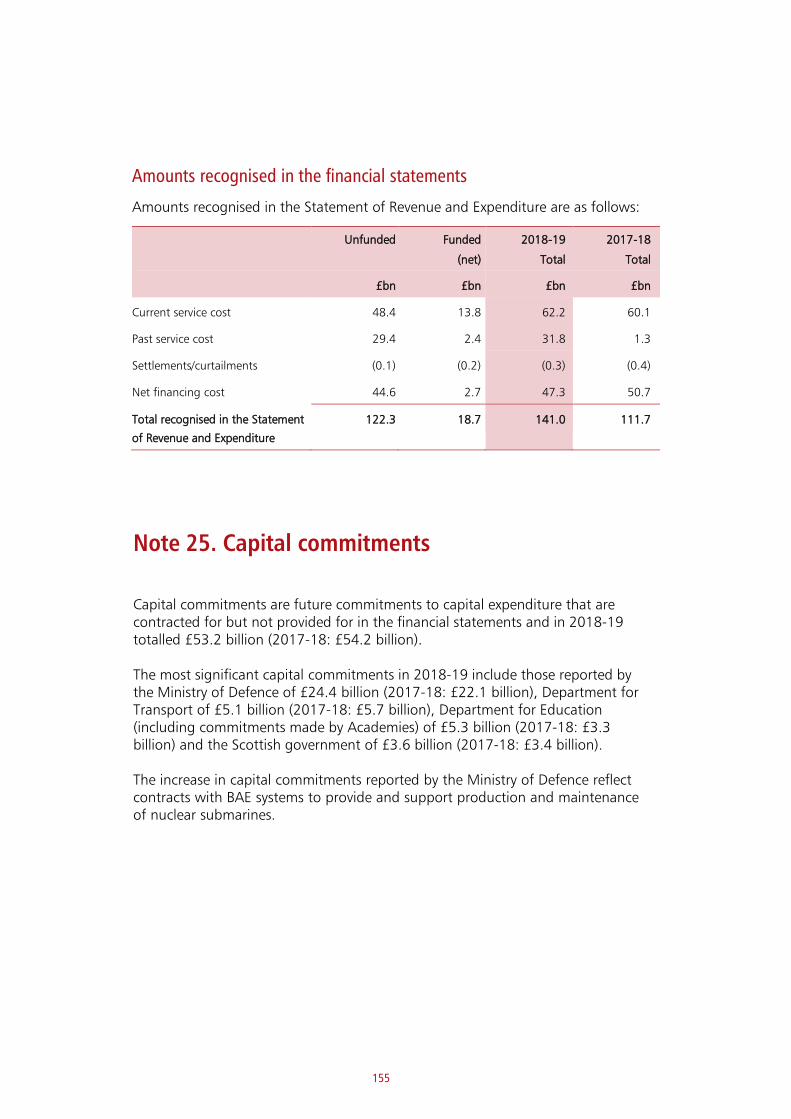
155
Amounts recognised in the financial statements
Amounts recognised in the Statement of Revenue and Expenditure are as follows:
Unfunded Funded
(net)
2018-19
Total
2017-18
Total
£bn £bn £bn £bn
Current service cost 48.4 13.8 62.2 60.1
Past service cost 29.4 2.4 31.8 1.3
Settlements/curtailments (0.1) (0.2) (0.3) (0.4)
Net financing cost 44.6 2.7 47.3 50.7
Total recognised in the Statement
of Revenue and Expenditure
122.3 18.7 141.0 111.7
Note 25. Capital commitments
Capital commitments are future commitments to capital expenditure that are contracted for but not provided for in the financial statements and in 2018-19 totalled £53.2 billion (2017-18: £54.2 billion).
The most significant capital commitments in 2018-19 include those reported by the Ministry of Defence of £24.4 billion (2017-18: £22.1 billion), Department for Transport of £5.1 billion (2017-18: £5.7 billion), Department for Education (including commitments made by Academies) of £5.3 billion (2017-18: £3.3 billion) and the Scottish government of £3.6 billion (2017-18: £3.4 billion).
The increase in capital commitments reported by the Ministry of Defence reflect contracts with BAE systems to provide and support production and maintenance of nuclear submarines.
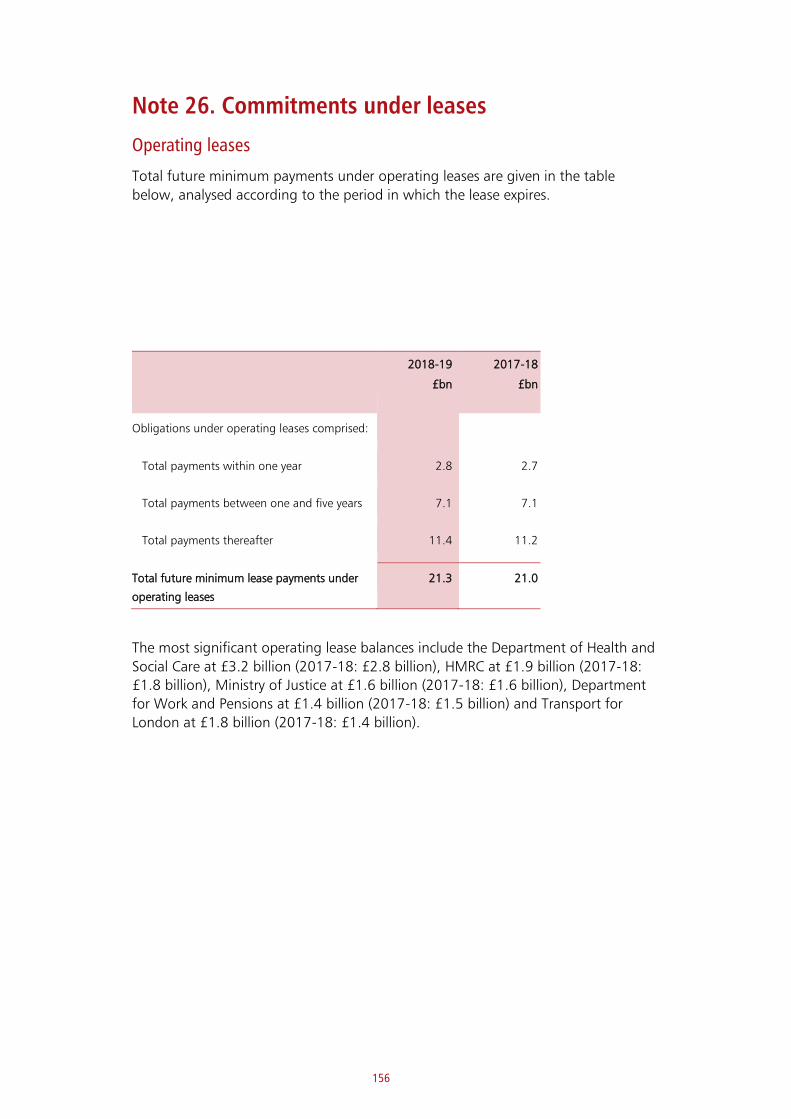
156
Note 26. Commitments under leases
Operating leases
Total future minimum payments under operating leases are given in the table
below, analysed according to the period in which the lease expires.
2018-19
£bn
2017-18
£bn
Obligations under operating leases comprised:
Total payments within one year 2.8 2.7
Total payments between one and five years 7.1 7.1
Total payments thereafter 11.4 11.2
Total future minimum lease payments under
operating leases
21.3 21.0
The most significant operating lease balances include the Department of Health and
Social Care at £3.2 billion (2017-18: £2.8 billion), HMRC at £1.9 billion (2017-18:
£1.8 billion), Ministry of Justice at £1.6 billion (2017-18: £1.6 billion), Department
for Work and Pensions at £1.4 billion (2017-18: £1.5 billion) and Transport for
London at £1.8 billion (2017-18: £1.4 billion).

157
Finance leases
Total future minimum payments under finance leases are given in the table below,
analysed according to the period in which the lease expires.
2018-19
£bn
2017-18
£bn
Obligations under finance leases comprised:
Total payments within one year 0.6 0.5
Total payments between one and five years 1.8 1.8
Total payments thereafter 21.3 21.3
Total 23.7 23.6
Less interest element (18.3) (18.5)
Total present value of obligations 5.4 5.1
The most significant finance lease balance relates to a land and buildings lease for the Ministry of Defence of £1.8 billion for 2018-19 (2017-18: £1.7 billion).
Note 27. Commitments under Private Finance Initiative (PFI) contracts
PFI contracts recognised on the Statement of Financial Position
PFI assets are recognised on the Statement of Financial Position where the government controls or regulates the services, to whom they are provided, the price, and any significant residual interest in the asset at the end of the contract.
The net book value of PFI assets included in the Statement of Financial Position was £47.4 billion (2017-18: £45.3 billion) as at 31 March 2019. The PFI liability for the present value of capital amounts payable was £37.9 billion (2017-18: £39.0 billion). The substance of PFI contracts is that they have three elements: repayments of capital and interest (together representing a finance lease liability), and annual service charges.
Details of the underlying finance lease liability are given in the table below:
2018-19
£bn
2017-18
£bn
Obligations for future periods arise in the following periods:
No later than one year 4.5 4.5
Later than one year and not later than five years 17.2 17.4
Later than five years 47.7 52.3
Gross present value of future finance lease obligations 69.4 74.2
Less interest charges allocated to future periods (30.9) (34.6)
Net present value of future finance lease obligations 38.5 39.6

158
Details of the minimum annual service charge are given in the table below:
2018-19
£bn
2017-18
£bn
Obligations for future periods arise in the following periods:
No later than one year 5.2 5.4
Later than one year and not later than five years 19.3 19.7
Later than five years 56.9 61.2
Total annual service charges 81.4 86.3
The PFI obligations by segment of government were:
2018-19
£bn
2017-18
£bn
Central government departments and entities within the NHS 39.3 41.3
Local authorities 29.0 31.6
Public corporations 1.1 1.3
Gross present value of future finance lease obligations 69.4 74.2
The net present value of PFI obligations represents the liability for capital repayments. The most significant balances amount to £10.9 billion (2017-18: £11.2 billion). These are held by the Department of Health and Social Care. The overall liability for capital repayments decreased by £1.1 billion in 2018-19 in line with repayments made in year. The net present value of PFI obligations is recognised as a liability on the Statement of Financial Position, albeit at £37.9 billion rather than at £38.5 billion as reported above. This is due to differences in recording costs such as contingent rents and lifecycle replacement costs by WGA entities. Interest charges and annual service charges are not recognised as liabilities in the Statement of Financial Position and are disclosed as commitments. These amounts will be recognised in the Statement of Revenue and Expenditure in the year they become due. Details of the government PFI schemes are published on the gov.uk website.8
PFI contracts not recognised on the Statement of Financial Position
During the 2018-19 financial year, some WGA entities had PFI contracts which were
not recognised on the Statement of Financial Position. This is because the private
sector contractor was, on balance, considered to have greater control over the use
of the asset.
HM Treasury has considered whether assets not recognised on the Statement of Financial Position of any one entity should be consolidated as a shared ownership
8 https://www.gov.uk/government/publications/private-finance-initiative-and-private-finance-2-projects-2018-summary-data
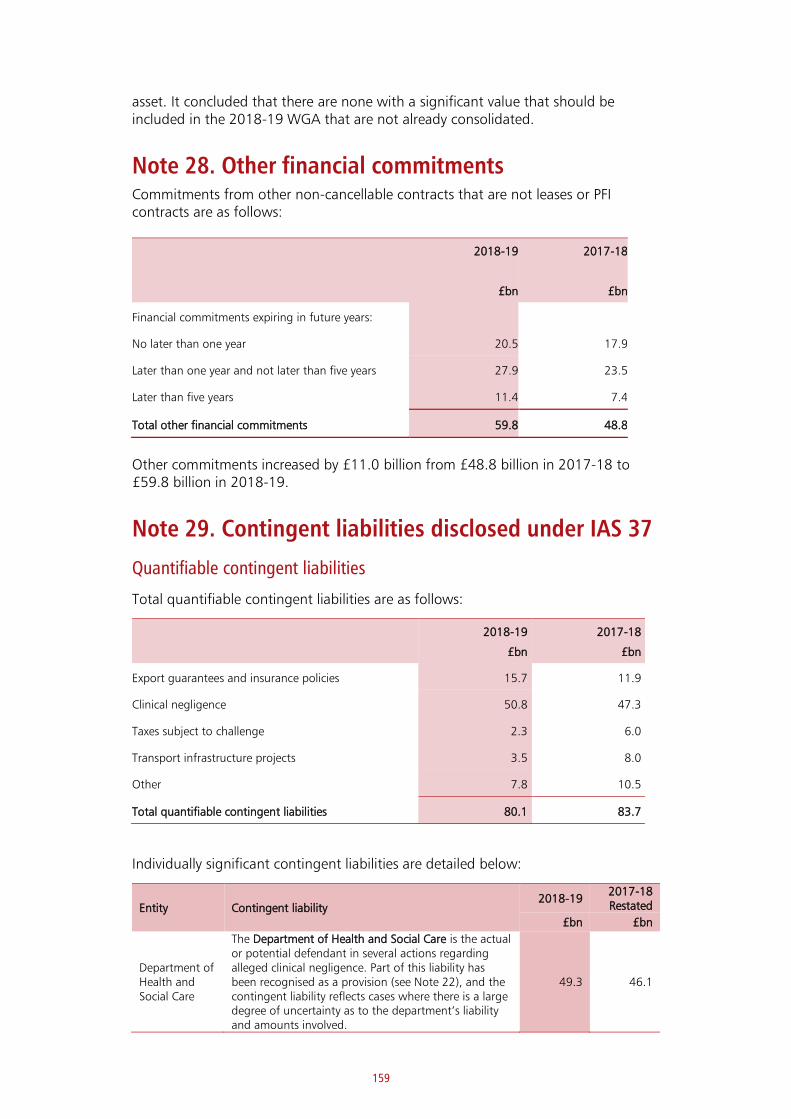
159
asset. It concluded that there are none with a significant value that should be included in the 2018-19 WGA that are not already consolidated.
Note 28. Other financial commitments Commitments from other non-cancellable contracts that are not leases or PFI contracts are as follows:
2018-19
£bn
2017-18
£bn
Financial commitments expiring in future years:
No later than one year 20.5 17.9
Later than one year and not later than five years 27.9 23.5
Later than five years 11.4 7.4
Total other financial commitments 59.8 48.8
Other commitments increased by £11.0 billion from £48.8 billion in 2017-18 to £59.8 billion in 2018-19.
Note 29. Contingent liabilities disclosed under IAS 37
Quantifiable contingent liabilities
Total quantifiable contingent liabilities are as follows:
2018-19
£bn
2017-18
£bn
Export guarantees and insurance policies 15.7 11.9
Clinical negligence 50.8 47.3
Taxes subject to challenge 2.3 6.0
Transport infrastructure projects 3.5 8.0
Other 7.8 10.5
Total quantifiable contingent liabilities 80.1 83.7
Individually significant contingent liabilities are detailed below:
Entity Contingent liability 2018-19
2017-18 Restated
£bn £bn
Department of Health and Social Care
The Department of Health and Social Care is the actual or potential defendant in several actions regarding alleged clinical negligence. Part of this liability has been recognised as a provision (see Note 22), and the contingent liability reflects cases where there is a large degree of uncertainty as to the department’s liability and amounts involved.
49.3 46.1
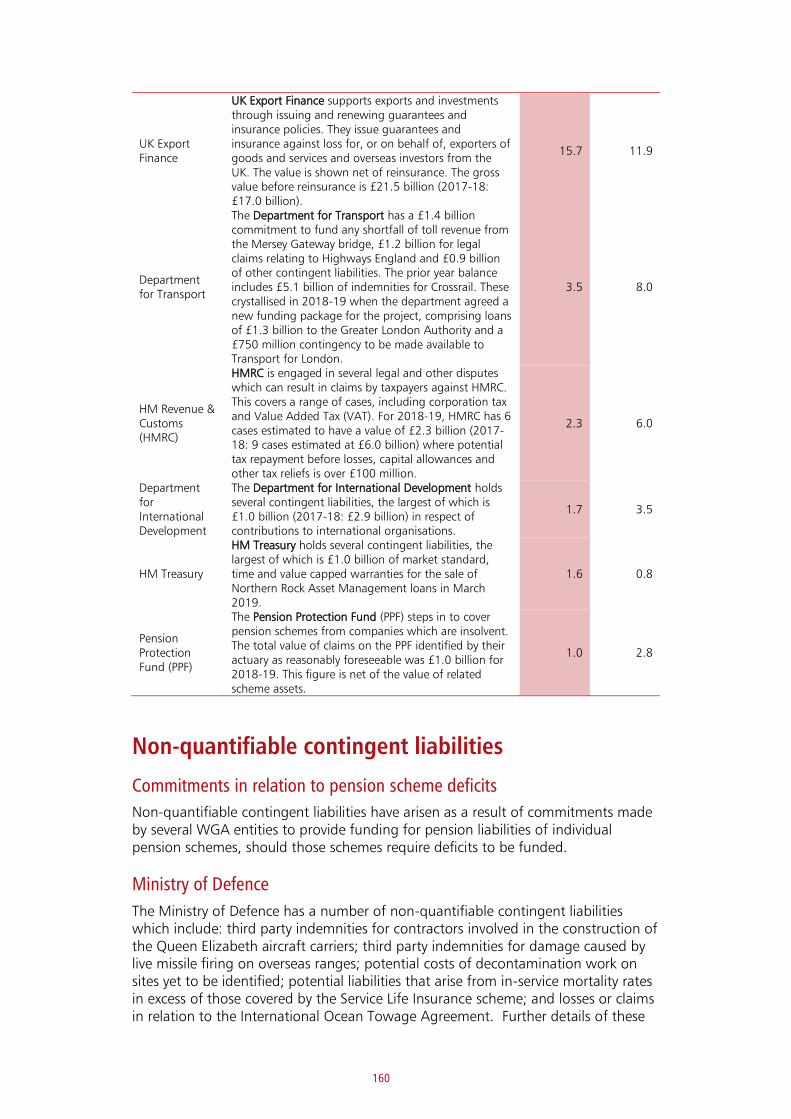
160
UK Export Finance
UK Export Finance supports exports and investments through issuing and renewing guarantees and insurance policies. They issue guarantees and insurance against loss for, or on behalf of, exporters of goods and services and overseas investors from the UK. The value is shown net of reinsurance. The gross value before reinsurance is £21.5 billion (2017-18: £17.0 billion).
15.7 11.9
Department for Transport
The Department for Transport has a £1.4 billion commitment to fund any shortfall of toll revenue from the Mersey Gateway bridge, £1.2 billion for legal claims relating to Highways England and £0.9 billion of other contingent liabilities. The prior year balance includes £5.1 billion of indemnities for Crossrail. These crystallised in 2018-19 when the department agreed a new funding package for the project, comprising loans of £1.3 billion to the Greater London Authority and a £750 million contingency to be made available to Transport for London.
3.5 8.0
HM Revenue & Customs (HMRC)
HMRC is engaged in several legal and other disputes which can result in claims by taxpayers against HMRC. This covers a range of cases, including corporation tax and Value Added Tax (VAT). For 2018-19, HMRC has 6 cases estimated to have a value of £2.3 billion (2017-18: 9 cases estimated at £6.0 billion) where potential tax repayment before losses, capital allowances and other tax reliefs is over £100 million.
2.3 6.0
Department for International Development
The Department for International Development holds several contingent liabilities, the largest of which is £1.0 billion (2017-18: £2.9 billion) in respect of contributions to international organisations.
1.7 3.5
HM Treasury
HM Treasury holds several contingent liabilities, the largest of which is £1.0 billion of market standard, time and value capped warranties for the sale of Northern Rock Asset Management loans in March 2019.
1.6 0.8
Pension Protection Fund (PPF)
The Pension Protection Fund (PPF) steps in to cover pension schemes from companies which are insolvent. The total value of claims on the PPF identified by their actuary as reasonably foreseeable was £1.0 billion for 2018-19. This figure is net of the value of related scheme assets.
1.0 2.8
Non-quantifiable contingent liabilities
Commitments in relation to pension scheme deficits
Non-quantifiable contingent liabilities have arisen as a result of commitments made by several WGA entities to provide funding for pension liabilities of individual pension schemes, should those schemes require deficits to be funded.
Ministry of Defence
The Ministry of Defence has a number of non-quantifiable contingent liabilities which include: third party indemnities for contractors involved in the construction of the Queen Elizabeth aircraft carriers; third party indemnities for damage caused by live missile firing on overseas ranges; potential costs of decontamination work on sites yet to be identified; potential liabilities that arise from in-service mortality rates in excess of those covered by the Service Life Insurance scheme; and losses or claims in relation to the International Ocean Towage Agreement. Further details of these
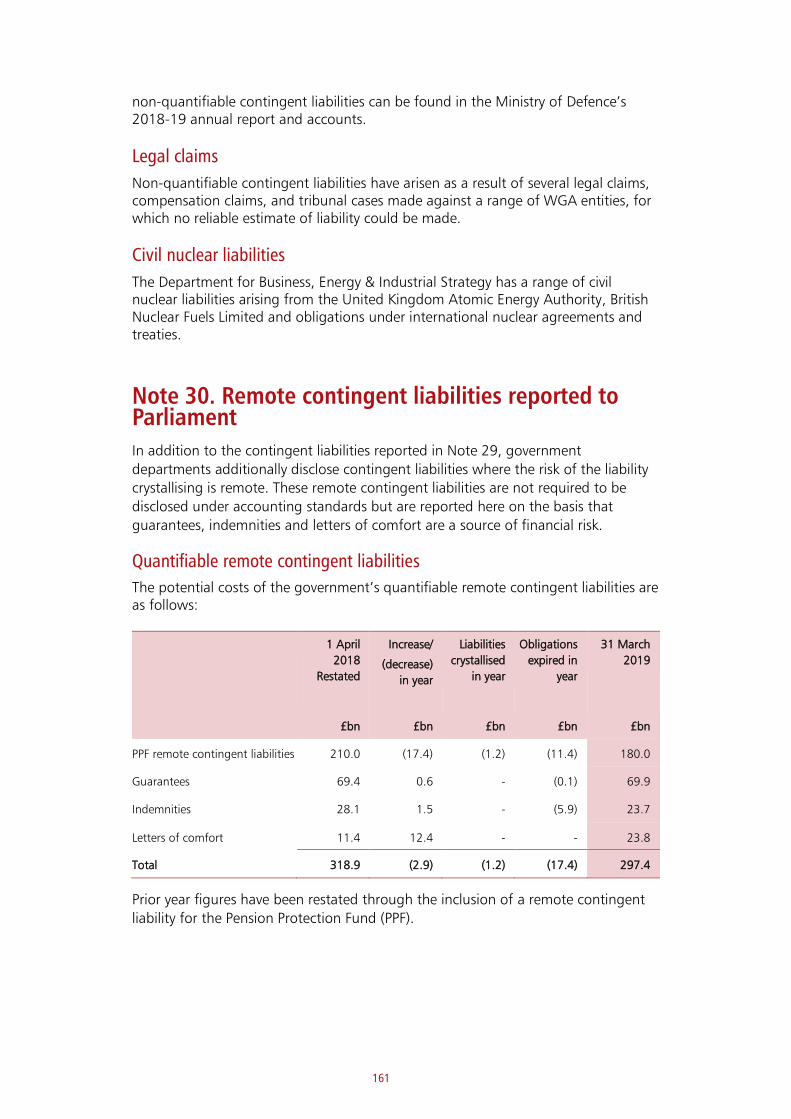
161
non-quantifiable contingent liabilities can be found in the Ministry of Defence’s 2018-19 annual report and accounts.
Legal claims
Non-quantifiable contingent liabilities have arisen as a result of several legal claims, compensation claims, and tribunal cases made against a range of WGA entities, for which no reliable estimate of liability could be made.
Civil nuclear liabilities
The Department for Business, Energy & Industrial Strategy has a range of civil nuclear liabilities arising from the United Kingdom Atomic Energy Authority, British Nuclear Fuels Limited and obligations under international nuclear agreements and treaties.
Note 30. Remote contingent liabilities reported to Parliament
In addition to the contingent liabilities reported in Note 29, government
departments additionally disclose contingent liabilities where the risk of the liability
crystallising is remote. These remote contingent liabilities are not required to be
disclosed under accounting standards but are reported here on the basis that
guarantees, indemnities and letters of comfort are a source of financial risk.
Quantifiable remote contingent liabilities
The potential costs of the government’s quantifiable remote contingent liabilities are as follows:
1 April
2018
Restated
Increase/
(decrease)
in year
Liabilities
crystallised
in year
Obligations
expired in
year
31 March
2019
£bn £bn £bn £bn £bn
PPF remote contingent liabilities 210.0 (17.4) (1.2) (11.4) 180.0
Guarantees 69.4 0.6 - (0.1) 69.9
Indemnities 28.1 1.5 - (5.9) 23.7
Letters of comfort 11.4 12.4 - - 23.8
Total 318.9 (2.9) (1.2) (17.4) 297.4
Prior year figures have been restated through the inclusion of a remote contingent
liability for the Pension Protection Fund (PPF).
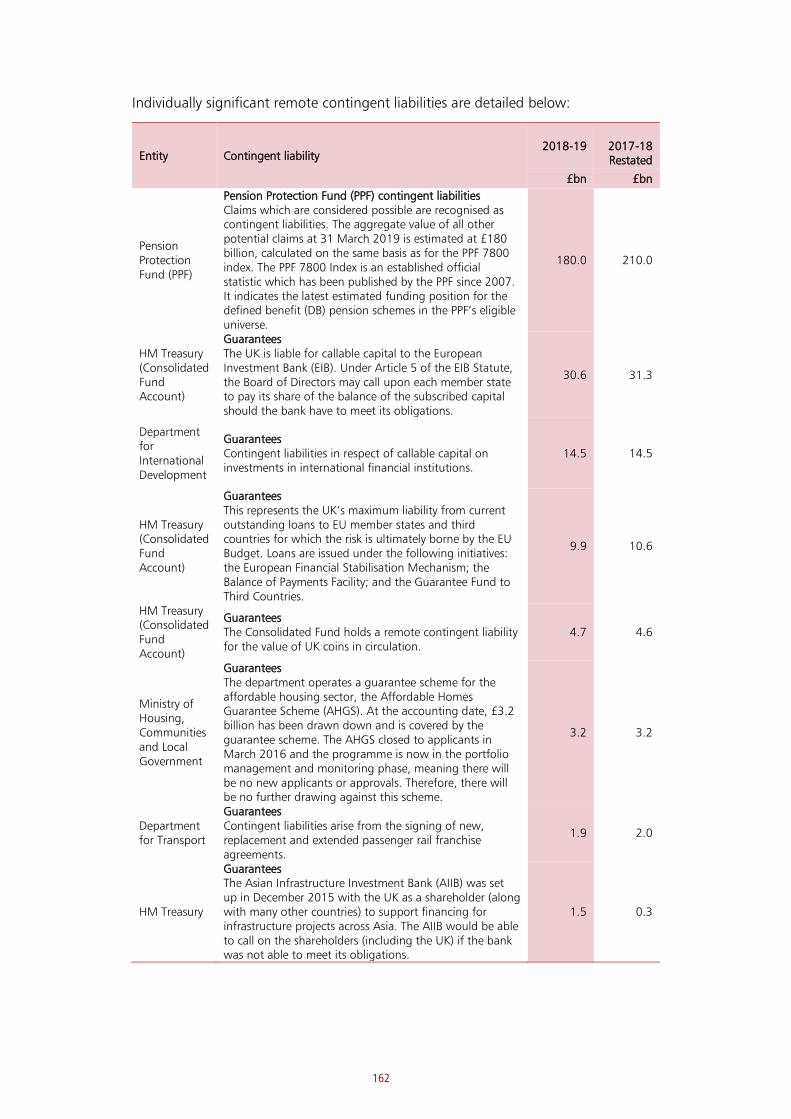
162
Individually significant remote contingent liabilities are detailed below:
Entity Contingent liability 2018-19
2017-18 Restated
£bn £bn
Pension Protection Fund (PPF)
Pension Protection Fund (PPF) contingent liabilities Claims which are considered possible are recognised as contingent liabilities. The aggregate value of all other potential claims at 31 March 2019 is estimated at £180 billion, calculated on the same basis as for the PPF 7800 index. The PPF 7800 Index is an established official statistic which has been published by the PPF since 2007. It indicates the latest estimated funding position for the defined benefit (DB) pension schemes in the PPF’s eligible universe.
180.0 210.0
HM Treasury (Consolidated Fund Account)
Guarantees The UK is liable for callable capital to the European Investment Bank (EIB). Under Article 5 of the EIB Statute, the Board of Directors may call upon each member state to pay its share of the balance of the subscribed capital should the bank have to meet its obligations.
30.6 31.3
Department for International Development
Guarantees Contingent liabilities in respect of callable capital on investments in international financial institutions.
14.5 14.5
HM Treasury (Consolidated Fund Account)
Guarantees This represents the UK’s maximum liability from current outstanding loans to EU member states and third countries for which the risk is ultimately borne by the EU Budget. Loans are issued under the following initiatives: the European Financial Stabilisation Mechanism; the Balance of Payments Facility; and the Guarantee Fund to Third Countries.
9.9 10.6
HM Treasury (Consolidated Fund Account)
Guarantees The Consolidated Fund holds a remote contingent liability for the value of UK coins in circulation.
4.7 4.6
Ministry of Housing, Communities and Local Government
Guarantees The department operates a guarantee scheme for the affordable housing sector, the Affordable Homes Guarantee Scheme (AHGS). At the accounting date, £3.2 billion has been drawn down and is covered by the guarantee scheme. The AHGS closed to applicants in March 2016 and the programme is now in the portfolio management and monitoring phase, meaning there will be no new applicants or approvals. Therefore, there will be no further drawing against this scheme.
3.2 3.2
Department for Transport
Guarantees Contingent liabilities arise from the signing of new, replacement and extended passenger rail franchise agreements.
1.9 2.0
HM Treasury
Guarantees The Asian Infrastructure Investment Bank (AIIB) was set up in December 2015 with the UK as a shareholder (along with many other countries) to support financing for infrastructure projects across Asia. The AIIB would be able to call on the shareholders (including the UK) if the bank was not able to meet its obligations.
1.5 0.3

163
HM Treasury
Guarantees The Help to Buy Scheme was launched to address the shortage of high loan-to-value mortgages. The scheme closed to new loan applications on 31 December 2016. A portion of the liability would crystallise if the following events occurred: 1) a borrower defaults on their mortgage 2) the sale proceeds from property are less than the outstanding principal and interest repayments owing; and 3) the lender makes a claim to HM Treasury for the difference. During the life of the scheme there have been 11 successful claims totalling £120,000.
1.4 1.4
HM Treasury
Guarantees The UK Guarantee scheme was set up to support infrastructure projects that may have stalled due to adverse credit conditions.
1.0 1.0
Department for Transport
Indemnities In 2012 the Secretary of State at the Department for Transport agreed to quantifiable (disclosed) and unquantifiable assurances, warranties, indemnities and potential losses under the Inter City Express Rolling Stock contracts with Agility Consortium and Network Rail.
6.0 5.9
Department for Transport
Indemnities The High Speed 1 (HS1) concession agreement specifies that compensation will be paid if the contract were terminated due to legal or governmental changes.
4.8 4.5
Department for Transport
Indemnities To support the Thameslink programme there are a series of assurances, warranties, indemnities and potential losses.
1.0 1.2
HM Treasury
Letters of comfort To facilitate each sale of UK Asset Resolution (UKAR's) Bradford and Bingley (B&B) and Northern Rock Asset Management (NRAM) assets, HM Treasury has offered certain market standard warranties that have created remote contingent liabilities. The crystallisation of any liability is dependent on the occurrence and identification of any defects covered by the warranties. Given their nature, such occurrence is considered remote. The value has increased in 2018-19 due to many sales during the year.
23.8 11.4
Department for Digital, Culture, Media and Sport
Letters of comfort The Government Indemnity Scheme indemnifies lenders to museums, galleries and other institutions when mounting exhibitions or taking long-term loans for study or display. This figure also includes non-statutory indemnities granted in respect of art on loan from the Royal Collection.
8.5 12.2
Ministry of Defence
Letters of comfort Under contract terms the Ministry of Defence may indemnify or limit a contractor's liability in relation to a specific area. These include damage to government property, damage to issued property, default, deferment, termination and indirect and consequential losses. This value covers the potential value relating to damage caused on government property.
1.6 2.0
Non-quantifiable remote contingent liabilities
Remote contingent liabilities can also be unquantifiable. The most significant liabilities are detailed below:
164
Notification to leave the EU – Article 50
On 29 March 2017 the UK government submitted its notification to leave the EU in accordance with Article 50. The triggering of Article 50 started a negotiation process between the UK and the EU, during which the UK remains a full member of the EU with all the rights and obligations arising from membership. The negotiations are ongoing and as such have not given rise to any legal or constructive obligation for any components of the Whole of Government Accounts 2018-19. Further information on the EU withdrawal can be found in Chapter 1.
There are a number of unquantifiable remote contingent liabilities disclosed in the individual 2018-19 annual reports and accounts of central government bodies reflecting the remote possibility at the reporting date that they may be required to settle any liabilities arising from changes in legislation, regulation and funding arrangements resulting from EU exit on behalf of the UK government.
Further information on events subsequent to 31 March 2019 in relation to EU exit can be found in Note 32. The impact of these events is not reflected in the 2018-19 WGA, as the UK remained a member of the EU during the 2018-19 financial year.
Regional development banks and funds
The Department for International Development has entered into non-quantifiable contingent liabilities relating to the maintenance of the value of subscriptions paid to the capital stock of regional development banks and funds, such as the African and Asian Development Banks.
National Health Service
The Department of Health and Social Care has entered into a number of unquantifiable or unlimited contingent liabilities with various health bodies and private companies. There were 19 unquantifiable indemnities. None of these are a contingent liability within the meaning of IAS 37 since the possibility of a transfer of economic benefit in settlement is too remote.
Nuclear matter
Indemnities have been given to UK Atomic Energy Authority (UKAEA) by the Department for Business, Energy and Industrial Strategy to cover indemnities given to carriers against certain claims for damage caused by nuclear matter in the course of carriage.
Decommissioning offshore installations
Under the United Nations Convention on the Law of the Sea (UNCLOS) 1982, OSPAR decision 98/3, the Energy Act 2004 and the Petroleum Act 1998, the government would become responsible for decommissioning most oil, gas and renewable energy installations in the event that operators are unable to fulfil their decommissioning commitments.
Hinkley Point C
A remote contingent liability provides protections in certain scenarios where the Hinkley Point C nuclear plant is shut down for reasons that are political or certain changes in law and insurance contracts.
165
UK Space Agency
UK Space Agency has an unquantifiable contingent liability arising from the international United Nations convention which requires the UK government to be ultimately liable for third party costs from accidental damage arising from UK space agencies.
Student loans sale
Each sale of student loans necessitated separate but similar warranties and indemnities to secure interest and obtain value for money from investors into the securitisation transactions. Further details can be found in the accounts of the Department for Education.
Department of Transport
The Department of Transport is party to a North Atlantic Treaty Organisation (NATO) agreement relating to indemnification of civil aircraft in respect of their use on NATO tasks in times of crisis and war.
The department has a statutory responsibility for the maintenance of all railway structures. The contingent liability for this responsibility applies to structures that have been sold to, and are controlled by, third parties. There have been no claims and there is no reasonable basis under which to quantify this risk.
Ministry of Defence
Indemnities have been provided to several companies relating to the handling of fissile materials, nuclear risk and risks under the Nuclear Installations Act 1965.
British Telecom (BT) pension scheme
When BT was privatised in 1984, the government gave a guarantee (contained in the Telecommunications Act 1984) in respect of certain liabilities of the privatised company. Following High Court and Court of Appeal proceedings on the terms and scope of the Crown Guarantee, which would only apply if BT were to enter insolvent winding-up, the contingent liability is approximately the size of the BT pension scheme (BTPS) deficit. The last triennial actuarial valuation of the pension scheme as at 30 June 2017 valued the deficit at £11.3 billion. BT has decided to close the BTPS for future accruals of benefit from 1 June 2018, as a result the liabilities covered by the Crown guarantee will be limited to those relating to benefits accrued before that date (together with indexing and any legally required increments). These liabilities remain with BT plc and so legislation is no longer required on the scope of the guarantee. The contingent liability largely consists of the considerable deficit on the BTPS fund, however providing BT takes steps to reduce that, possible growth in the liability should now be limited.
Underwriting the Commonwealth Games
The UK government was successful in its bid for the 2022 Commonwealth Games. As part of the successful bid to host the Games, the Department for Digital, Culture, Media and Sport has taken on a contingent liability by guaranteeing to financially underwrite the organisation and staging of the Games

166
Contingent liabilities for reinsurance arising from acts of terrorism
Pool Re and Pool Re (Nuclear) are mutual reinsurance companies owned by insurers. They provide insurance cover to industrial and commercial property and nuclear facilities for damage and consequent business interruption arising from terrorist attacks in Great Britain. HM Treasury carries the contingent liability for the risk that the losses incurred by Pool Re or Pool Re (Nuclear) exceed their available resources. These arrangements are set out in the Reinsurance (Acts of Terrorism) Act 1993. Maximum potential liabilities under this arrangement are considered unquantifiable.
Note 31. Related party transactions
Related parties in the context of WGA are public sector entities that have not been
consolidated into the 2018-19 WGA. Further information regarding non-
consolidated entities can be found in Annex 2 and Annex 3 to the account.
The most significant WGA related party is the Royal Bank of Scotland Group plc. In
the course of normal business, WGA entities entered into arms-length banking
transactions with this institution, including loans, deposits, reimbursement of
related expenses, payment of management fees, interest receipts and dividends. The
volume and diversity of these transactions make comprehensive disclosure
impractical.
Due to the nature of HM Revenue and Customs’ business, it had many transactions
relating to taxation income with other public sector entities not within the WGA
boundary.
Local government entities had transactions with municipal ports, airports and parish
councils, primarily through the provision of funding. They also had transactions with
local government pension schemes and record their share of the scheme’s assets
and liabilities in their accounts. Further details are available in the 2018-19 accounts
of the individual entities.
The Department for Education, through the Education and Skills Funding Agency,
and local authorities, provided funding to further education colleges in England and
Wales for research and provision of further education courses. Through the Office
for Students, it provided funding for higher education courses.
The Department for Business, Energy and Industrial Strategy, through UK Research
and Innovation, provided funding for science and research to universities and
research organisations.
Note 32. Events after the reporting period The following events that have occurred after the reporting period have been
identified as significant to WGA. The Government Financial Reporting Manual (the
FReM) modifies financial reporting requirements for the purposes of WGA in that
the requirement that the financial statements be adjusted for significant
transactions, or events that occur between the date of the consolidated entity’s
reporting date and the WGA reporting date, do not apply, and therefore all such
events are non-adjusting.

167
EU Exit
The European Union (Withdrawal Agreement) Act 2020 received Royal Assent on 23
January 2020. Liabilities as a result of the Withdrawal Agreement are recognised at
this point. As this was after 31 March 2019, it is considered an event after the
reporting period for 2018-19. The financial position as at 31 March 2019 has not
been adjusted for this information. An estimate of the financial impact of this event
is set out below.
Scope of the financial settlement
The financial settlement addresses mutual obligations that arose primarily as a
consequence of the UK’s participation in the EU budget, and commitments related
to the UK’s broader membership of the EU. It does not cover the costs of facilitating
withdrawal or new administrative arrangements that may result from the UK’s exit.
There is also no obligation in the financial settlement to pay for the relocation of EU
bodies previously located in the UK.
The financial settlement does not cover costs that might be associated with the UK’s
future relationship with the EU. The government has been clear throughout this
period that there are some specific European programmes in which the UK may
want to participate. If so, and this will be for the UK to decide, it is reasonable that
an appropriate contribution should be made. These decisions are subject to
negotiations on our future relationship with the EU, and future decisions of
Parliament.
The financial settlement has three main components:
• First, the UK will continue to participate in EU annual budgets to 31
December 2020. This means that the UK will continue to make its
contribution and get receipts from EU budget programmes under the
normal rules. The financial impact of this will be reflected as an in year cost
in the 2019-20 and 2020-21 accounts of the Consolidated Fund,
departments administering certain EU programme receipts and WGA, and
are not reflected in the figures in the table below.
• Second, the UK will then pay its share of the EU’s outstanding
commitments at the end of 2020 (the so-called RAL- ‘reste à liquider’) and
again will benefit from some of these commitments.
• Third, the UK will pay a share of the EU’s liabilities as at the end of 2020,
and any materialising contingent liabilities, and in return will benefit from a
share of relevant EU assets. This includes eligible pension liabilities. These
are shown in the ‘pensions’, ‘EIB paid in capital’ and ‘other’ lines in the
table below.
Valuation of the financial settlement
An estimate of the assets and liabilities that would be recognised in the accounts of
HM Treasury and also of those disclosed in the Consolidated Fund in respect of the
EIB as a result of the financial settlement, as at 31 March 2020, is provided in the
table below. This only includes those elements of the financial settlement that are
recognised under applicable accounting standards and therefore, for example, the
first element (contributions and receipts from the 2020 EU Budget) are not

168
included. A fuller presentation of all elements of the financial settlement can be
found in European Union Finances, published by HM Treasury.6
Valuation of the financial settlement as at 31 March 2020
Element Asset (£bn) Liability (£bn) Maturity profile
RAL - (30.3) To 2027-28
Pensions - (8.2) Various
EIB paid in capital 2.5 - To 2031-32
Other 0.2 - To 2022-23
Total (net) (35.8)
Source: HM Treasury
The UK's shareholding in the EIB is recognised as a financial asset with a value of
£9.9 billion in WGA 2018-19. The figure of £2.5 billion represents the return of the
UK's paid-in capital in the EIB (€3.5 billion undiscounted). 2018-19 values in WGA
have not been restated.
Remote contingent liabilities relating to the UK's callable capital commitment from
membership of the European Investment Bank (EIB) are valued at £31.6bn (as at 31st
March 2020). This commitment was previously disclosed in 2017-18 WGA. In
addition, the UK will maintain a contingent liability in respect of the returned paid in
capital, which will wind down in relation to the amortisation of EIB operations
approved before withdrawal. Remote contingent liabilities to the EU Budget in Note
30 of WGA are treated in combination with the UK’s share of the associated pre-
paid guarantee funds in accordance with the terms of the Withdrawal Agreement,
which in some cases gives rise to contingent assets. Contingent assets and liabilities
are not included in the table above.
The financial provisions of the Withdrawal Agreement also include other elements
that will be recognised as expenditure and income in WGA in future reporting
periods. For example, UK participation in EU annual budgets to 2020 do not give
rise to material assets or liabilities. UK contributions and public sector receipts from
EU programmes accrue in the year to which they relate. Further information on the
financial effects arising from the financial provisions of the Withdrawal Agreement
can be found in the European Union Finances, published by HM Treasury.9
Sensitivities and assumptions
These assets and liabilities represent payments and receipts to be recognised several
years into the future. There are a number of key sensitivities and assumptions which
may affect future valuations.
The asset and liability valuations are sensitive to changes in the discount rates
applied under the applicable accounting standards. The obligations of the financial
settlement are principally denominated in Euros and therefore the sterling
valuations are sensitive to changes in the Sterling/Euro exchange rate. The
9 https://www.gov.uk/government/collections/eu-annual-statement

169
accounting valuations for the pension related liabilities are sensitive to actuarial
assumptions (e.g. life expectancy, inflation) for defined benefit pension obligations.
The value of the RAL is also sensitive to the level of implementation of EU Budget
commitments (not all commitments necessarily translate into payments). All the
items disclosed in the table above, with the exception of those in relation to the EIB,
are sensitive to the UK’s financing share (the average proportion of the EU Budget
that the UK has financed over the 2014-20 period). The key sensitivities are set out
in the table below.
Key Sensitivities
Sensitivity component
Assumption Change
Degree of Uncertainty
Sensitivity to Changes
Financial Impact
(£bn)
Further Commentary
Financing Share-the
average proportion
of the EU Budget
over 14-20
financed by the UK
The UK’s
Financing Share
on Post-2020
obligations
increases by 1%a
from the current
forecast
Low Moderate 0.4 The UK’s Post-2020
Financing Share is an average
of its Own Resources share as
a contributor to the EU
budget for the years 2014-
20. At the time of reporting
only the final 2020 Financing
Share has yet to be
determined. This means the
remaining uncertainty around
this assumption is limited.
Changes to the Post-2020
Financing Share effect the
value of all provision liabilities
(RAL and Pension)
Exchange Rate –
Sterling/Euro
exchange rate
The effect of a
1% depreciation/
appreciation of
Sterling against
the Euro
High Moderate 0.4 A depreciation of Sterling
against the Euro results in the
value of the provision liability
(RAL, Pension) increasing. An
appreciation of Sterling has
the opposite effect. This
models a 1%
depreciation/appreciated
from the 31st March 2020
exchange rate.
Decommitments –
the proportion of
EU budgetary
commitments in
the RAL that are
not implemented
The proportion of
RAL that is
estimated to be
decommitted
changes by 1% in
absolute terms.
Moderate Moderate 0.3 A decrease in
decommitments increases the
value of the RAL liability. An
increase in decommitments
will have the opposite effect.
Discount Rate – the
discount rate
applied to future
The effect of a
0.1% decrease in
the discount rate
Moderate Moderate 0.3 Provisions are discounted in
accordance with the
requirements of the Financial
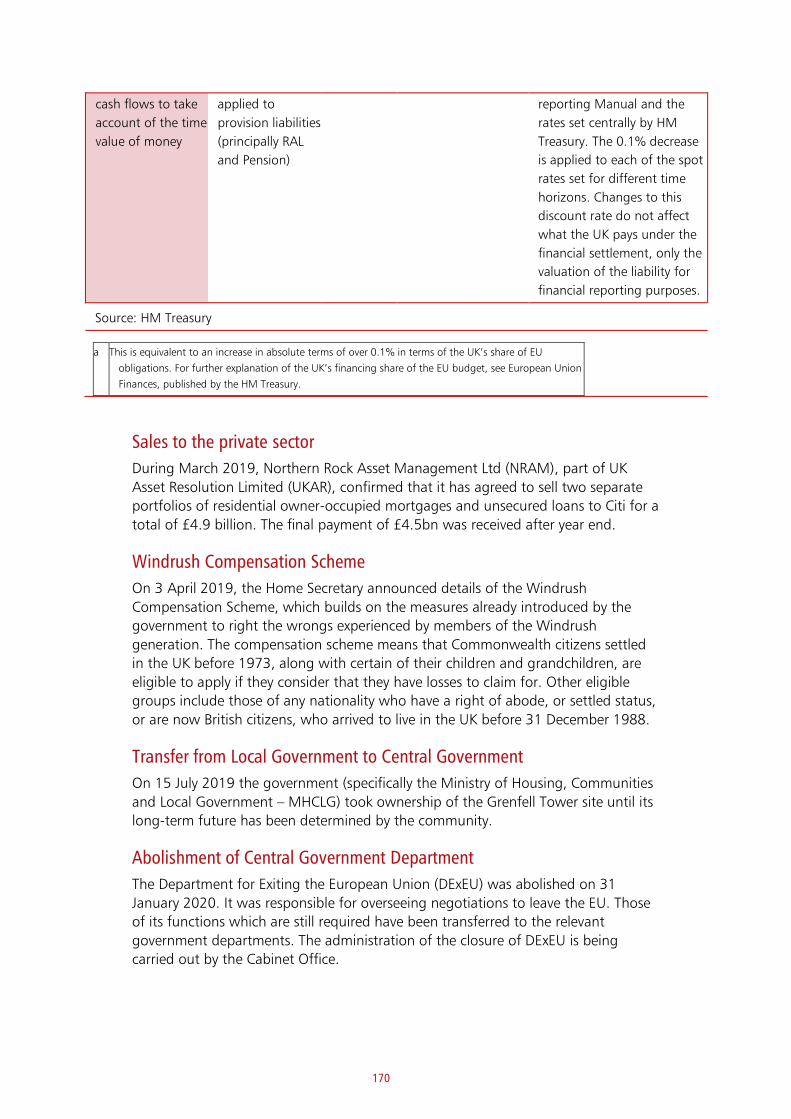
170
cash flows to take
account of the time
value of money
applied to
provision liabilities
(principally RAL
and Pension)
reporting Manual and the
rates set centrally by HM
Treasury. The 0.1% decrease
is applied to each of the spot
rates set for different time
horizons. Changes to this
discount rate do not affect
what the UK pays under the
financial settlement, only the
valuation of the liability for
financial reporting purposes.
Source: HM Treasury
a This is equivalent to an increase in absolute terms of over 0.1% in terms of the UK’s share of EU
obligations. For further explanation of the UK’s financing share of the EU budget, see European Union
Finances, published by the HM Treasury.
Sales to the private sector
During March 2019, Northern Rock Asset Management Ltd (NRAM), part of UK
Asset Resolution Limited (UKAR), confirmed that it has agreed to sell two separate
portfolios of residential owner-occupied mortgages and unsecured loans to Citi for a
total of £4.9 billion. The final payment of £4.5bn was received after year end.
Windrush Compensation Scheme
On 3 April 2019, the Home Secretary announced details of the Windrush
Compensation Scheme, which builds on the measures already introduced by the
government to right the wrongs experienced by members of the Windrush
generation. The compensation scheme means that Commonwealth citizens settled
in the UK before 1973, along with certain of their children and grandchildren, are
eligible to apply if they consider that they have losses to claim for. Other eligible
groups include those of any nationality who have a right of abode, or settled status,
or are now British citizens, who arrived to live in the UK before 31 December 1988.
Transfer from Local Government to Central Government
On 15 July 2019 the government (specifically the Ministry of Housing, Communities
and Local Government – MHCLG) took ownership of the Grenfell Tower site until its
long-term future has been determined by the community.
Abolishment of Central Government Department
The Department for Exiting the European Union (DExEU) was abolished on 31
January 2020. It was responsible for overseeing negotiations to leave the EU. Those
of its functions which are still required have been transferred to the relevant
government departments. The administration of the closure of DExEU is being
carried out by the Cabinet Office.
171
Merger of Central Government Departments
On 16 June 2020 the Prime Minister announced that the Department for
International Development (DFID) and the Foreign and Commonwealth Office (FCO)
will merge, uniting development and diplomacy in one new department that brings
together Britain’s international effort.
Work will begin immediately on the merger. The new Department will be called the
Foreign, Commonwealth and Development Office – it will be established in early
September 2020 and will be led by the Foreign Secretary.
Ministry of Defence review of Financial Commitments Disclosures
The Ministry of Defence (MOD) are undertaking an ongoing review of their other
commitments disclosure, and audited figures are unlikely to be available until much
closer to the laying of the MOD 2019-20 accounts. Current estimates indicate
figures of approximately £10.9 billion, an increase of £5.6 billion.
Bank of England Asset Purchase Facility Fund Limited
At its special meeting on 19 March 2020 the Monetary Policy Commitee voted to
approve the proposition that the Bank of England should, as soon as was
operationally possible and consistent with improved market functioning, increase
the stock of asset purchases, financed by the issuance of central bank reserves, by
£200 billion to a total of £645 billion. The company began purchases on 25 March
2020.
COVID-19 Pandemic
The government has implemented a number of measures to support the economy,
business, individuals, and vital public services through the COVID-19 pandemic.
Some of these will be reflected in the 2019-20 annual accounts of the relevant
organisations, as they were announced prior to 31 March 2020 or create liabilities
on entities’ statements of financial position. Other announced support measures will
not be fully recognised until the 2020-21 accounts, as they came into effect after 31
Match 2020, or relate to ongoing spending that will not be fully recognised in the
2019-20 accounts.
The main announced measures, and their financial impact, are set out below.
Support for business
On 11 March 2020 the government announced that employers with fewer than 250
employees will be eligible for a rebate of up to two weeks of Statutory Sick Pay (SSP)
per employee who has COVID-19 or is self-isolating.
On 11 March 2020 the government announced the Small Business Grant Fund and
Retail, Hospitality and Leisure Grant Fund Schemes to support small businesses and
businesses in the retail, hospitality and leisure sectors with grants of either £10,000
or £25,000 per business, the amount to depend on published eligibility criteria.
On 11 March 2020 the government announced the Coronavirus Business
Interruption Loan Scheme (CBILS) under which the government will assist small and
medium-sized businesses to obtain loan finance up to a maximum of £5 million by
172
providing guarantees to lenders for 80% of the amount lent, and government
payments to cover lender-levied charges and the first twelve months of interest
charges.
On 17 March 2020 the government announced that eligible businesses would pay
no business rates for 12 months from 1 April 2020.
On 17 March 2020 the government announced that businesses eligible for Small
Business Rates Relief or Rural Rates Relief will receive a £10,000 grant. In addition,
business properties used for retail, hospitality, or leisure purposes will receive a
£10,000 grant if their rateable value is £15,000 or under, and a £25,000 grant if
their rateable value is between £15,000 and £51,000.
On 17 March 2020 the government announced the COVID-19 Corporate Financing
Facility. This will provide support for business by buying short term corporate debt
from larger companies. This will give them access to liquidity during the period of
disruption caused by the COVID-19 pandemic.
On 20 March 2020 the government announced that UK VAT registered businesses
which have a VAT payment due between 20 March 2020 and 30 June 2020, have
the option to defer the payment until a later date or pay the VAT due as normal.
On 3 April 2020 the government announced the Coronavirus Large Business
Interruption Loan Scheme under which the government will assist larger businesses
to obtain loan finance up to a maximum of £50 million by providing guarantees to
lenders for 80% of the amount lent.
On 20 April 2020 the government announced the Future Fund to make government
loans from £125,000 to £5 million available to UK based companies that drive
innovation and development, subject to match funding from private investors, and
to accelerate and increase existing financing arrangements for companies.
On 27 April 2020 the government announced the Bounce Back Loan Scheme under
which the government will assist small and medium-sized businesses to obtain loan
finance up to a maximum of £50,000 by providing guarantees to lenders for 100%
of the amount lent, government payments to cover lender-levied charges and the
first twelve months of interest charges, during which time repayments will not be
required, and by working with lenders to agree low rates of interest for loan terms
after twelve months.
On 1 May 2020 the Government announced the Local Authority Discretionary
Grants Fund. The additional fund is aimed at small businesses who were not eligible
for the Small Business Grant Fund or the Retail, Leisure and Hospitality Fund. Local
authorities will have discretion to pay grants of £25,000, £10,000 or any amount
below £10,000 per business.
On 4 June 2020 the government announced the Trade Credit Reinsurance scheme
backed by a £10 billion guarantee. This will provide cover to hundreds of thousands
of business to business transactions.
173
On 5 July 2020 the government announced a £1.57 billion support package to
protect cultural and heritage organisations. The money, which represents the
biggest ever one-off investment in UK culture, will provide a lifeline to vital cultural
and heritage organisations across the country hit hard by the pandemic.
On 8 July 2020 the government announced a support package, which had the
following measures for businesses:
• New Jobs Retention Bonus was introduced to help firms keep furloughed
workers in employment. UK Employers are due to receive a one-off bonus
of £1,000 for each furloughed employee who is still employed as of 31
January 2021. At the time of the speech, there were 9 billion furloughed
workers. The government have allocated up to £9.4 billion to this scheme.
• Kick Start Scheme is available for those aged 16-24, claiming Universal
Credit and at risk of long-term unemployment. Funding will be available for
each six-month job placement and will cover 100% of the National
Minimum Wage for 25 hours a week – and employers will be able to top
this wage up. The government allocated up to £2.1 billion for the scheme.
• New Apprenticeships – is an activity included in a £1.6 billion employment
support scheme: boosting worksearch, skills and apprenticeships.
Businesses will be given £2,000 for each new apprentice they hire under
the age of 25. Plus, a new bonus of £1,500 for businesses who hire
apprentices over the age of 25.
• VAT will be reduced from 20% to 5% for businesses in the hospitality and
tourism sector.
• Eat Out to Help Out is a discount scheme to provide a 50% reduction for
sit-down meals in cafes, restaurants and pubs across the UK from Monday
to Wednesday every week throughout August 2020.
Support for individuals
On 4 March 2020 the existing Statutory Sick Pay (SSP) scheme was extended to be
the Coronavirus Statutory Sick Pay (SSP) Rebate Scheme. This is now payable from
day 1 of sickness absence (it had been payable from day 4 in the past).
On 11 March 2020 changes to the existing Universal Credit (UC) regime were
announced. This included relaxing requirements to be eligible for UC and removal of
the 7 waiting days for contributory Employment and Support Allowance for COVID-
19 and self-isolator cases. Increases in the housing element of Universal Credit and
housing benefit, and an increase in standard allowances were announced on 20
March 2020.
On 20 March 2020 the Coronavirus Job Retention Scheme (CJRS) was announced by
the government. This allows employers to furlough their employees. The
government will pay the employer a cash grant of up to 80% of the employees’
wages (up to a maximum of £2,500 a month), providing they keep the worker
employed.
174
On 26 March 2020 the Self-Employed Income Support Scheme (SEISS) was
announced by the government. This provides grants to individuals who are self-
employed or members of a partnership. This grant provides up to 80% of their
trading profits/partnership trading profits (averaged from 2016-17, 2017-18 and
2018-19 tax years where applicable), up to a maximum of £2,500 a month.
On 31 March 2020, the government announced a voucher scheme for schools
providing free school meals. Weekly shopping vouchers worth £15 to spend at
supermarkets while schools are closed due to COVID-19. On the 25 June 2020,
guidance was published on the COVID Summer Food Fund. Providing vouchers for
eligible pupils in the summer holiday period.
On 28 April 2020, the Secretary of State for Health announced that staff who are
performing vital frontline NHS or social care work during the Coronavirus (COVID-
19) outbreak may be eligible for a life assurance scheme, £60,000 per family.
On 29 May 2020, the Chancellor announced eligible individuals for SEISS will be
able to claim a second and final taxable grant when the scheme reopens for
applications in August. Individuals will be able to claim a taxable grant worth 70%
of their average monthly trading profits, paid out in another single instalment
covering three months’ worth of profits, and capped at £6,570 in total.
From 1 July 2020, employers can bring back to work employees that have been
furloughed for any amount of time and any shift pattern, while still being able to
claim Coronavirus Job Retention Scheme (CJRS) grant for the hours not worked.
In June and July 2020, the government will pay 80% of wages up to a cap of
£2,500 as well as employer National Insurance (ER NICs) and pension contributions
for the hours the employee doesn’t work. Employers will have to pay employees for
the hours they work.
On 8 July 2020, the government announce a support package which had the
following measures for individuals:
• The Green Homes Grant Scheme will pay for green improvements such as
loft, wall and floor insulation. From September homeowners and landlords,
can apply for vouchers – covering 2/3 of cost up to £5,000. For low income
households cover 100% up to £10,000. The government have allocated
£2.0 billion to the scheme.
• Stamp duty holiday, a temporary increase to the Nil Rate Band of
Residential SDLT (Stamp Duty) from £125,000 to £500,000 until 31 March
2021. The government estimate costs to be £3.8 billion.
In August, the government will pay 80% of wages up to a cap of £2,500 and
employers will pay ER NICs and pension contributions for the hours the employee
does not work - 5% of average gross employment costs.
From August 2020, the level of the grant will be slowly tapered to reflect that
people will be returning to work.

175
In September, the government will pay 70% of wages up to a cap of £2,187.50 for
the hours the employee does not work. Employers will pay ER NICs and pension
contributions and 10% of wages to make up 80% total up to a cap of £2,500.
In October, the government will pay 60% of wages up to a cap of £1,875 for the
hours the employee does not work. Employers will pay ER NICs and pension
contributions and 20% of wages to make up 80% total up to a cap of £2,500.
Support for public services
Budget 2020 announced £5 billion contingency funding for the NHS and other
public services. On 13 April 2020 this was increased to £14.5 billion, and was
further increased to over £16 billion on 27 April 2020. This will be used to support
public services, including the NHS and local authorities.
On 8 July 2020 the government announced a £160 billion support package, £49
billion extra funding for public services.
The Department for Health and Social Care (DHSC) put in place a plan to source the
required equipment and resources necessary to tackle the pandemic. The plan incurs
a significant increase in expenditure which will be reflected in the 2020 -21
accounts.
It is currently not possible to estimate the financial impact of these measures. This is
because they are either demand led, or dependant on the spread of COVID-19 or its
secondary impacts on the economy.
Note 33. Prior period adjustments There are several restatements in WGA, largely relating to presenting prior year figures differently to allow for consistent comparatives with current year figures. There is also a restatement processed in 2017-18 relating to valuation changes in the Academies sector. The Academic Year 2016-17 Academies Sector Annual Report and Accounts (SARA) that feeds into the 2017-18 WGA was qualified on the basis of the valuation of land and buildings. However, the closing balance for academy land and buildings was considered materially true and fair. The exercise to evaluate land and buildings valuations led to a one-off charge of £8.4 billion in the 2017-18 WGA, disclosed as other expenditure. For the 2017-18 SARA (which feeds into the 2018-19 WGA), the Department for Education undertook an exercise to identify which elements of this charge related to years prior to 2016-17. This has led to the removal of the one-off charge to other expenditure, and adjustments to reserves and PPE. Only prior year reserves figures have been restated, as although there are restatements to PPE these do not affect the closing balances as at 31 March 2018. A summary of the adjustments to WGA is provided below. To improve clarity of presentation, losses on disposals of assets (£3.6 billion in 2017-18) have been moved from other revenue to purchase of goods, services and other expenditure.
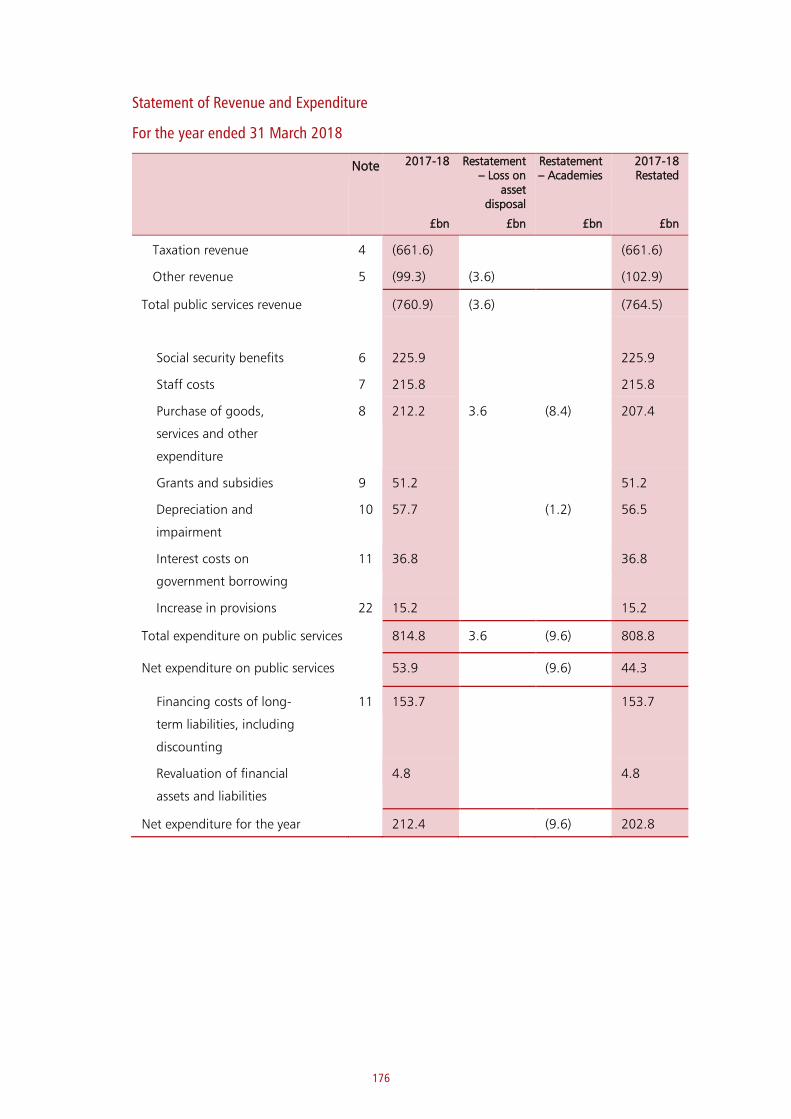
176
Statement of Revenue and Expenditure
For the year ended 31 March 2018
Note 2017-18
£bn
Restatement – Loss on
asset disposal
£bn
Restatement – Academies
£bn
2017-18 Restated
£bn
Taxation revenue 4 (661.6) (661.6)
Other revenue 5 (99.3) (3.6) (102.9)
Total public services revenue (760.9) (3.6) (764.5)
Social security benefits 6 225.9 225.9
Staff costs 7 215.8 215.8
Purchase of goods,
services and other
expenditure
8 212.2 3.6 (8.4) 207.4
Grants and subsidies 9 51.2 51.2
Depreciation and
impairment
10 57.7 (1.2) 56.5
Interest costs on
government borrowing
11 36.8 36.8
Increase in provisions 22 15.2 15.2
Total expenditure on public services 814.8 3.6 (9.6) 808.8
Net expenditure on public services 53.9 (9.6) 44.3
Financing costs of long-
term liabilities, including
discounting
11 153.7 153.7
Revaluation of financial
assets and liabilities
4.8 4.8
Net expenditure for the year 212.4 (9.6) 202.8
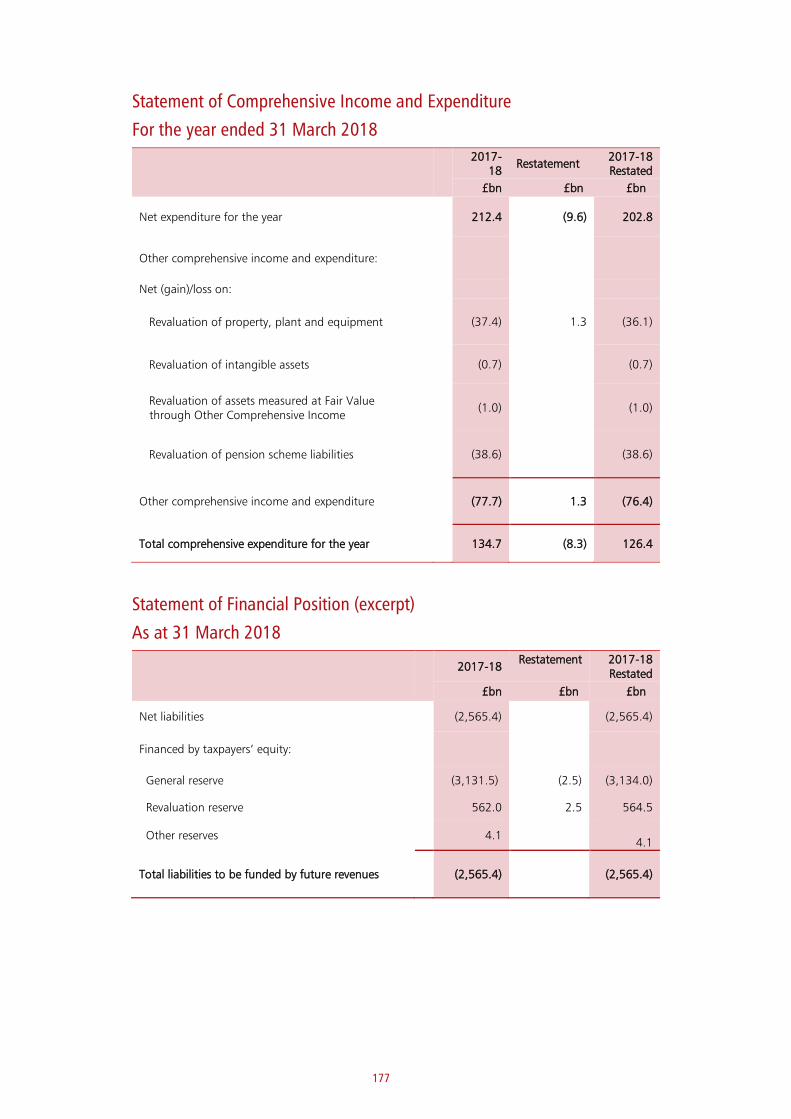
177
Statement of Comprehensive Income and Expenditure
For the year ended 31 March 2018
2017-18
Restatement 2017-18 Restated
£bn £bn £bn
Net expenditure for the year 212.4 (9.6) 202.8
Other comprehensive income and expenditure:
Net (gain)/loss on:
(37.4) 1.3 (36.1)
(0.7) (0.7)
(1.0) (1.0)
Revaluation of property, plant and equipment
Revaluation of intangible assets
Revaluation of assets measured at Fair Value through Other Comprehensive Income
Revaluation of pension scheme liabilities (38.6) (38.6)
Other comprehensive income and expenditure (77.7) 1.3 (76.4)
Total comprehensive expenditure for the year 134.7 (8.3) 126.4
Statement of Financial Position (excerpt)
As at 31 March 2018
2017-18 Restatement 2017-18
Restated
£bn £bn £bn
Net liabilities (2,565.4) (2,565.4)
Financed by taxpayers’ equity:
General reserve (3,131.5) (2.5) (3,134.0)
Revaluation reserve 562.0 2.5 564.5
Other reserves 4.1 4.1
Total liabilities to be funded by future revenues (2,565.4) (2,565.4)
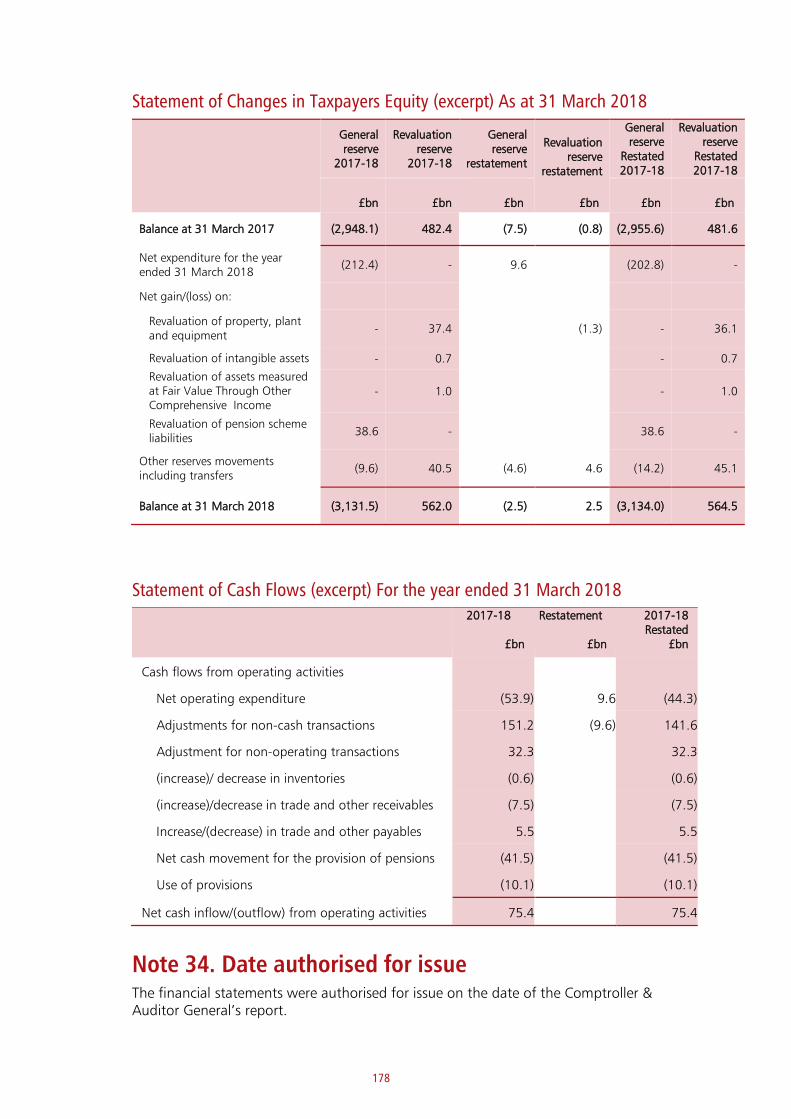
178
Statement of Changes in Taxpayers Equity (excerpt) As at 31 March 2018
General reserve
2017-18
Revaluation reserve
2017-18
General reserve
restatement
Revaluation reserve
restatement
General reserve
Restated 2017-18
Revaluation reserve
Restated 2017-18
£bn £bn £bn £bn £bn £bn
Balance at 31 March 2017 (2,948.1) 482.4 (7.5) (0.8) (2,955.6) 481.6
Net expenditure for the year ended 31 March 2018
(212.4) - 9.6 (202.8) -
Net gain/(loss) on:
- 37.4 (1.3) - 36.1
- 0.7 - 0.7
- 1.0 - 1.0
Revaluation of property, plant and equipment
Revaluation of intangible assets
Revaluation of assets measured at Fair Value Through Other Comprehensive Income
Revaluation of pension scheme liabilities
38.6 - 38.6 -
Other reserves movements including transfers
(9.6) 40.5 (4.6) 4.6 (14.2) 45.1
Balance at 31 March 2018 (3,131.5) 562.0 (2.5) 2.5 (3,134.0) 564.5
Statement of Cash Flows (excerpt) For the year ended 31 March 2018 2017-18
£bn
Restatement
£bn
2017-18 Restated
£bn
Cash flows from operating activities
Net operating expenditure (53.9) 9.6 (44.3)
Adjustments for non-cash transactions 151.2 (9.6) 141.6
Adjustment for non-operating transactions 32.3 32.3
(increase)/ decrease in inventories (0.6) (0.6)
(increase)/decrease in trade and other receivables (7.5) (7.5)
Increase/(decrease) in trade and other payables 5.5 5.5
Net cash movement for the provision of pensions (41.5) (41.5)
Use of provisions (10.1) (10.1)
Net cash inflow/(outflow) from operating activities 75.4 75.4
Note 34. Date authorised for issue The financial statements were authorised for issue on the date of the Comptroller & Auditor General’s report.

179
Chapter 5
Certificate and Report of the Comptroller and Auditor General to the House of Commons

180
Certificate and Report of the Comptroller and Auditor General to the House of Commons
Qualified opinion on financial statements I certify that I have audited the financial statements of the Whole of Government Accounts (the WGA) for the year ended 31 March 2019 under the Government Resources and Accounts Act 2000. The financial statements comprise: the consolidated Statements of Revenue and Expenditure; Comprehensive Income and Expenditure; Financial Position; Cash Flows; Changes in Taxpayers’ Equity; and the related notes, including the significant accounting policies. These financial statements have been prepared under the accounting policies set out within them.
In my opinion, except for the effects of the matters described in the basis for qualified opinion on financial statements paragraph:
• the financial statements give a true and fair view of the state of the whole of government’s affairs as at 31 March 2019 and of its net income for the year then ended; and
• the financial statements have been properly prepared in accordance with the Government Resources and Accounts Act 2000 and HM Treasury directions issued thereunder.
Basis for qualified opinion on financial statements Qualification arising from disagreements on the definition and application of the accounting boundary
The Government Resources and Accounts Act 2000 (the Act) requires HM Treasury to produce a set of accounts for a group of bodies which appears to HM Treasury to exercise functions of a public nature or to be entirely or substantially funded from public money. The Act also states that the accounts should present a true and fair view and conform to generally accepted accounting practice, subject to such adaptations as are necessary. HM Treasury has adopted a framework for the accounts which is based on International Financial Reporting Standards adapted for the public sector context.
However, in Note 1.3 to the accounts, HM Treasury defines the accounting boundary with reference to those bodies classified as being in the public sector by the Office for National Statistics. I consider that it would be more appropriate to assess the accounting boundary with reference to the accounting standards.
I also consider that HM Treasury’s accounting policy has not been applied consistently in 2018-19. A number of significant bodies, including the Royal Bank of Scotland, have not been included in the accounts, even though they are classified by the Office for National Statistics as being in the public sector, which I also consider should be included in the accounts in line with applicable accounting standards.
Although I cannot quantify the effect of these omissions on the accounts with certainty, as I do not have the information needed to identify the transactions that would have to be eliminated to provide a consolidated view, the most significant impact would be on the Statement of Financial Position. The exclusion of the following categories of bodies could affect this Statement, which illustrates the potential impact:
• Royal Bank of Scotland which, as at 31 December 2018, had gross assets of £694.2 billion and
181
gross liabilities of £647.7 billion; and
• other bodies which have estimated gross assets of £26.1 billion and gross liabilities of £11.2 billion.
Qualification arising from a disagreement relating to inconsistent application of accounting policies
A number of bodies consolidated in the WGA do not adopt the same framework under which the WGA accounts are prepared. These bodies fall under the following categories:
• bodies in the local government sector follow the Code of Practice on Local Authority Accounting in the UK;
• bodies that follow either pure IFRS or UK GAAP; and
• bodies that follow the Charities Statement of Recommended Practice.
Accounting standards require that, where the effect of such inconsistent accounting policies is material, adjustments should be made on consolidation. HM Treasury has not provided a full analysis of these differences and has not been able to quantify fully the impact of the different accounting frameworks or accounting policies on the WGA, but it is material in some areas. The most significant example of the use of different accounting policies is where assets included in the WGA are not valued on a consistent basis, for example infrastructure assets held by local authorities. In 2018-19 we estimate the value of this impact to be at least £58.8 billion (£47.8 billion in 2017-18).
Qualification arising from underlying statutory audits of bodies falling within the accounts
The external auditors of the financial statements of a number of bodies that are consolidated into the WGA accounts qualified their audit opinion. Of these, only one is materially significant to the WGA, arising from qualification of the accounts of the Ministry of Defence.
The Ministry of Defence has not undertaken sufficient work to enable compliance with the financial reporting framework and to account for the expenditure, assets and liabilities arising from certain contracts in accordance with International Accounting Standard 17 ‘Leases’. Consequently, I have concluded that the Ministry of Defence has omitted a material value of leased assets and lease liabilities from its Statement of Financial Position as at 31 March 2019 and for the relevant comparative figures. I am unable to quantify the impact on the financial statements because the Ministry of Defence has not obtained the records or information required to comply with International Financial Reporting Standards in this respect.
Qualification arising from disagreement relating to the consolidation of components with non-coterminous year ends
International Financial Reporting Standard 10 ‘Consolidated financial statements’ (IFRS 10) presumes that, in order to present a true and fair view, the accounting reference date for component bodies consolidated into group accounts should be no more than three months different from the date of the group accounts. Where the accounting reference date is different, IFRS 10 requires that component bodies should prepare, for consolidation purposes, additional financial information as at the same date as the group accounts;
The most recent Academies Sector Annual Report and Accounts (SARA) were prepared by the Department for Education for the year to 31 August 2018. This represents a difference of seven months compared to the accounting reference date of 31 March 2019 for the WGA accounts. In preparing the WGA accounts, HM Treasury has consolidated the SARA for the year to 31 August 2018.
182
HM Treasury has not complied with the requirements of IFRS 10 in consolidating the SARA. In my view the extent of non-compliance has resulted in a level of misstatement and uncertainty which I consider to be material to the WGA and I have, therefore, qualified my opinion in that respect.
My report includes more details of the matters leading to my qualified opinion.
Emphasis of matter – nuclear decommissioning provisions and Hinkley Point C Contract for Difference (CfD)
Without qualifying my opinion further, I draw attention to the disclosures made in Notes 2.6 and 22 to the accounts concerning the uncertainties inherent in the provisions relating to the costs of dealing with nuclear decommissioning liabilities. As set out in these notes, given the complexity and the very long timescales involved, a considerable degree of uncertainty remains over the value of the liabilities. Significant changes to the liabilities could occur as a result of subsequent information and events which are different from the current assumptions adopted.
I also draw attention to the disclosures made in Notes 2.9 and 23 to the accounts concerning the measurement of liabilities relating to the contract for difference in respect of Hinkley Point C. As these notes describe, the fair value of this liability is highly sensitive to assumptions regarding future prices and volumes, particularly in view of the long timescales involved. As disclosed in Note 23, the uncertainty over the valuation of the Hinkley Point C contract for difference is such that the liability is not considered to meet the recognition criteria set out in the Conceptual Framework for Financial Reporting.
Basis of opinion I conducted my audit in accordance with International Standards on Auditing (ISAs) (UK) and Practice Note 10 ‘Audit of Financial Statements of Public Sector Entities in the United Kingdom. My responsibilities under those standards are further described in the Auditor’s responsibilities for the audit of the financial statements section of my certificate. Those standards require me and my staff to comply with the Financial Reporting Council’s Revised Ethical Standard 2016. I am independent of HM Treasury in accordance with the ethical requirements that are relevant to my audit and the financial statements in the UK. My staff and I have fulfilled our other ethical responsibilities in accordance with these requirements. I believe that the audit evidence I have obtained is sufficient and appropriate to provide a basis for my opinion.
Conclusions relating to going concern I have nothing to report in respect of the following matters in relation to which the ISAs (UK) require me to report to you where:
• HM Treasury’s use of the going concern basis of accounting in the preparation of the financial statements is not appropriate; or
• HM Treasury has not disclosed in the financial statements any identified material uncertainties that may cast significant doubt on the appropriateness of the presentation of the WGA using the going concern basis of accounting for a period of at least twelve months from the date when the financial statements are authorised for issue.
Responsibilities of the Accounting Officer for the financial statements As explained more fully in the Statement of Accounting Officer’s Responsibilities, the Accounting Officer is responsible for the preparation of the financial statements and for being satisfied that they give a true and fair view.
183
Auditor’s responsibilities for the audit of the financial statements My responsibility is to audit, certify and report on the financial statements in accordance with the Government Resources and Accounts Act 2000.
An audit involves obtaining evidence about the amounts and disclosures in the financial statements sufficient to give reasonable assurance that the financial statements are free from material misstatement, whether caused by fraud or error. Reasonable assurance is a high level of assurance, but is not a guarantee that an audit conducted in accordance with ISAs (UK) will always detect a material misstatement when it exists. Misstatements can arise from fraud or error and are considered material if, individually or in the aggregate, they could reasonably be expected to influence the economic decisions of users taken on the basis of these financial statements.
As part of an audit in accordance with ISAs (UK), I exercise professional judgment and maintain professional scepticism throughout the audit. I also:
• identify and assess the risks of material misstatement of the financial statements, whether due to fraud or error, design and perform audit procedures responsive to those risks, and obtain audit evidence that is sufficient and appropriate to provide a basis for my opinion. The risk of not detecting a material misstatement resulting from fraud is higher than for one resulting from error, as fraud may involve collusion, forgery, intentional omissions, misrepresentations, or the override of internal control.
• obtain an understanding of internal control relevant to the audit in order to design audit procedures that are appropriate in the circumstances, but not for the purpose of expressing an opinion on the effectiveness of HM Treasury’s internal control.
• evaluate the appropriateness of accounting policies used and the reasonableness of accounting estimates and related disclosures made by management.
• evaluate the overall presentation, structure and content of the financial statements, including the disclosures, and whether the consolidated financial statements represent the underlying transactions and events in a manner that achieves fair presentation.
• obtain sufficient appropriate audit evidence regarding the financial information of the entities within the WGA group to express an opinion on the group financial statements. I am responsible for the direction, supervision and performance of the group audit. I remain solely responsible for my audit opinion.
• conclude on the appropriateness of HM Treasury’s use of the going concern basis of accounting and, based on the audit evidence obtained, whether a material uncertainty exists related to events or conditions that may cast significant doubt on the appropriateness of the presentation of the WGA using a going concern basis of accounting. If I conclude that a material uncertainty exists, I am required to draw attention in my report to the related disclosures in the financial statements or, if such disclosures are inadequate, to modify my opinion. My conclusions are based on the audit evidence obtained up to the date of my report. However, future events or conditions may cause HM Treasury to cease preparing the WGA using a going concern basis of accounting.
I communicate with those charged with governance regarding, among other matters, the planned scope and timing of the audit and significant audit findings, including any significant deficiencies in internal control that I identify during my audit.
Other Information The Accounting Officer is responsible for the other information. The other information comprises information included in the Overview and Performance Analysis, the Statement of Accounting Officer’s Responsibilities,

184
the Governance Statement and the Annex. My opinion on the financial statements does not cover the other information and I do not express any form of assurance conclusion thereon. In connection with my audit of the financial statements, my responsibility is to read the other information and, in doing so, consider whether the other information is materially inconsistent with the financial statements or my knowledge obtained in the audit or otherwise appears to be materially misstated. If, based on the work I have performed, I conclude that there is a material misstatement of this other information, I am required to report that fact. I have nothing to report in this regard.
Opinion on other matters In my opinion:
• in the light of the knowledge and understanding of the group and its environment obtained in thecourse of the audit, I have not identified any material misstatements in the Overview and PerformanceAnalysis, the Statement of Accounting Officer’s Responsibilities, the Governance Statement or the Annex;and
• the information given in the Overview and Performance Analysis, the Statement of AccountingOfficer’s Responsibilities, the Governance Statement and the Annex for the financial year for which thefinancial statements are prepared is consistent with the financial statements.
Matters on which I report by exception I have nothing to report in respect of the following matters which I report to you if, in my opinion:
• adequate accounting records have not been kept or returns adequate for my audit have not beenreceived from branches not visited by my staff; or
• the financial statements are not in agreement with the accounting records and returns; or
• I have not received all of the information and explanations I require for my audit; or
• the Governance Statement does not reflect compliance with HM Treasury’s guidance.
Gareth Davies 21 July 2020
Comptroller and Auditor General
National Audit Office 157-197 Buckingham Palace RoadVictoriaLondonSW1W 9SP

185
Report of the Comptroller and Auditor General
1 The Whole of Government Accounts (WGA) continues to provide the most complete and accurate picture of the financial performance and position of the UK public sector. The WGA for the year ended 31 March 2019 consolidates the accounts of over 9,000 bodies across the public sector. HM Treasury aim to consolidate the financial information in accordance with International Financial Reporting Standards (IFRS) as adapted for the public sector context. HM Treasury first published the WGA for the year ended 31 March 2010. I have qualified my opinion on the WGA for the year ended 31 March 2019 because, in a number of significant areas, the WGA does not comply with IFRS as adapted for the public sector context, and this has a material effect on the figures presented. The areas that led to the qualification of my audit opinion are longstanding financial reporting issues I have reported on for a number of years.
2 The longstanding qualifications to my audit opinion in relation to the accounting boundary and inconsistent accounting policies will remain for the foreseeable future. I can only consider removing the qualification on the accounting boundary when government sells its stake in the Royal Bank of Scotland (RBS). Until then, HM Treasury chooses not to consolidate the significant value of RBS assets and liabilities as it would provide a distorted view of government’s financial position and performance over time. The qualification in respect of inconsistent accounting policies is driven by local government infrastructure valuation. Local government uses an accounting framework – the Chartered Institute of Public Finance & Accountancy’s Code of Practice on Local Authority Accounting in the United Kingdom – which is inconsistent with the framework used by the WGA. HM Treasury considers that the cost and work required for each local government body to prepare valuations that are consistent with both accounting frameworks would not be appropriate. I outline more detail to these qualifications in the Appendix to my report.
3 The work carried out by HM Treasury and the Department for Education indicates I will not be able to remove the qualification to my audit opinion that arises from the consolidation of the academies sector for a number of years. HM Treasury has been working with the Department for Education (DfE) and the National Audit Office to review options to resolve the qualification that arises due to the different financial reporting period used by the academies sector compared to the rest of government. Given concerns over the reasonableness of the cost and effort associated with resolving the issue, HM Treasury and DfE are only considering options to remove this qualification without changing the financial reporting periods of academies (which are aligned with the academic year) and without commissioning additional audited information. This makes it challenging to prepare sufficiently robust information showing the financial position and performance of academies as at the reporting date. Trend data that could have been used to support preparation of financial information for the academies sector as at 31 March each year may now be less relevant due to the disruption to the academy landscape as a result of the COVID-19 pandemic.
4 The Ministry of Defence needs to carry out more work to enable HM Treasury to address the qualification to my audit opinion in relation to omission of assets and liabilities arising from leasing arrangements. IFRS 16 Leases, the new accounting standard replacing the current IAS 17 Leases standard, is directed at improving transparency on lease assets and liabilities and takes effect for the majority of the public sector from 1 April 2021. The Ministry of Defence is working towards compliance with IFRS 16 Leases and has identified contracts that could potentially fall within the scope of the new standard, including a number of strategic arrangements with certain contractors to procure specialist defence platforms on a non-competitive basis. These strategic arrangements may provide for the exclusive, or near exclusive,

186
use of industrial assets and capability, which could result in additional assets and liabilities being recognised in the Ministry of Defence’s accounts. The Ministry of Defence is not in a position to assess whether it will be able to comply with IFRS 16 Leases by the 2021-22 accounting year as required to enable HM Treasury to address the historic qualification. The Ministry of Defence also does not plan to reassess its compliance with the current IAS 17 Leases standard in respect of the 2019-20 and 2020-21 accounting years. If the Ministry of Defence does not have a full understanding of assets and liabilities that arise from carrying out its activities, its management of those assets and liabilities is unlikely to be effective.
5 HM Treasury’s ability to bring forward the publication date of the WGA is constrained by sustainability issues in the local government audit market. HM Treasury is dependent on audits of central and local government bodies being completed in a timely fashion to support the consolidation of audited financial information to form the WGA. More than 40% (210 out of 486) of audit opinions on local government statements of accounts for 2018-19 were not available by the target date of 31 July 20191. This comparable position in relation to 2017-18 was 13%. Public Sector Audit Appointments Limited (PSAA), the body responsible for appointing auditors to 98% of local government, police and fire bodies believes there are a number of factors driving this deterioration in performance. In some cases there has been a shortage of appropriately skilled and experienced auditors. In others, auditors reported that the standard and timeliness of draft accounts, associated working papers, and responses to audit queries has been lacking. These issues led to HM Treasury receiving audited financial information later than anticipated, delaying its planned accounts production timetable.
6 The failure to complete audits of local government bodies in a timely fashion has led to a lower quality picture of the financial performance and position of the UK public sector. Where audited financial information is not available for a public sector body, HM Treasury will seek to consolidate unaudited financial information. If unaudited financial information is unavailable, the relevant public sector body will be omitted from the WGA. Due to the issues in the local government audit market, there has been an increase in both the value of unaudited financial information consolidated as part of the WGA and an increase in the number of bodies omitted from the WGA. As a result of the increase in the value of unaudited information in the WGA, HM Treasury needed to carry out additional work to provide assurance that there was no risk of material misstatement in relation to these bodies. An increase in the number of bodies omitted from the WGA affects both the completeness and accuracy of the financial statements for the year ending 31 March 2019 and the ability to conduct trend analysis of the government’s financial performance and position over time.
7 Challenges to sustainability in the local government audit market may continue to affect the quality and timeliness of the WGA in the future. PSAA commissioned an independent review of the sustainability of the local government audit market and published it in February 20202. The report highlighted a number of key factors presenting a challenge to sustainability including the unprecedented scrutiny and significant regulatory pressure on the auditing profession; the challenges of a demanding timetable for publication of audited accounts; and the impacts of austerity on local public bodies including its consequences for the complexity of issues auditors face and its effect on the capacity of local finance teams. It also found that audit fees have not risen to compensate for these challenges that firms perceive they face. In response, PSAA carried out a market engagement process in June 2020 with audit firms registered with ICAEW or ICAS as local auditors under the Local Audit and Accountability Act 2014 to provide views and feedback to inform its consideration of whether a further procurement would be appropriate to improve sustainability of the local government audit market. But the challenges to sustainability remain and, consequently, may impact the preparation of the WGA for the year ending 31 March 2020.
8 The scale and nature of the government’s response to the current COVID-19 pandemic is likely
1 https://www.psaa.co.uk/wp-content/uploads/2019/08/PSAA-press-release-2018-19-audited-accounts-1.pdf 2 https://www.psaa.co.uk/2020/03/news-item-independent-review-of-the-sustainability-of-the-local-government-audit-market/

187
to have a significant impact on the government’s future financial position. The government has incurred significant costs in the 2019-20 and 2020-21 financial years to support activities across five response areas in relation to COVID-19: health and social care; other public services and emergency responses; support for individuals; support for businesses; and other support. There will be significant uncertainty about the valuation of assets and liabilities as at 31 March 2020 across the public sector and there is a risk that the statutory account information used by HM Treasury to produce the WGA may be either qualified by the statutory auditor, or that the auditor’s opinion may limited due to uncertainties in specific balances.
9 The COVID-19 pandemic will present challenges to the timely production of the WGA. To alleviate the pressure on central government finance teams during the COVID-19 pandemic, HM Treasury extended the administrative deadline for laying 2019-20 Annual Reports and Accounts from 30 June 2020 to 30 September 2020. Similarly, the Ministry of Housing, Communities and Local Government informed local authority chief executives that the publication date for final, audited, accounts will move from 31 July for Category 1 authorities and 30 September for Category 2 authorities to 30 November 2020 for all local authority bodies. Consequently, HM Treasury has extended its deadlines for submission of the audited financial information required for the WGA to 4 December 2020, compared to 13 September in the prior year. As outlined by the Accounting Officer in the Governance Statement, the process for producing the WGA is a complex undertaking and the extension to the submission deadline will impact on the publication timetable for the WGA. Should component bodies fail to meet the extended deadline, this will further impact on HM Treasury’s ability to deliver the WGA for the year ending 31 March 2020 in a timely manner.
10 HM Treasury intend to use a new IT system to carry out the consolidation of financial information to produce the WGA for the year ended 31 March 2020. HM Treasury’s new consolidation system is designed to both improve the quality of government financial data and support quicker delivery of the WGA through efficiencies in the account production process. HM Treasury has achieved its ambition to use the new IT system in the production of the WGA for the year ending 31 March 2020. While this is a significant milestone in the development of the WGA, HM Treasury still has to complete all its planned testing, such as a test of the process that demonstrates the information it consolidates reconciles to audited financial statements. HM Treasury continues to develop this aspect of the process, which is some months away from being required. The absence of a full test of the process at this stage does increase the risk associated with the production of the next WGA.
11 HM Treasury has more to do to enable the public and Parliament to use the WGA to assess the success, or otherwise, of the delivery of public policy. In its letter of 2 September 2019, the Public Accounts Committee (the Committee) set out the need for WGA to provide better insight into how well the government is managing risks to fiscal sustainability and how well the government is performing against its key policy objectives relating to managing fiscal risks and other performance measures. The Committee also highlighted the need for the WGA to ensure users of the accounts have access to the information they find valuable in the WGA. HM Treasury has sought to make improvements to its report and has included an assessment of the current and potential future impact of the COVID-19 pandemic on the government’s financial position to help the user of the accounts to understand how the position as at 31 March 2019 may change. However, the report still does not meet the Committee’s request to allow the user to understand the nature of government’s objectives in the period and then what it achieved against these objectives. In its response to the Committee’s letter, HM Treasury stated it would consider adopting information set out in the 2019 Spending Round to provide more insight in the WGA for the year ending 31 March 2020.

188
Appendix
Details supporting longstanding qualifications of the Comptroller and Auditor General’s audit opinion Summary 1 This appendix outlines details supporting longstanding qualifications of my audit opinion on the WGA: my qualification relating the WGA boundary and my qualification relating to the inconsistent application of accounting policies. I also outline some issues that have been identified in statutory audits of bodies within WGA but that do lead to a qualification of my audit opinion.
Qualified audit opinion relating to the WGA boundary 2 I have qualified my opinion because, in my view, the Treasury has not complied with applicable accounting standards in determining which bodies to include in the WGA. Significant assets and liabilities have, therefore, been omitted from the financial statements.
3 In my previous Reports3, I have noted that in determining the boundary for the WGA, the Treasury has adopted the classifications of public bodies used by the Office for National Statistics (ONS), rather than apply accounting standards which require the inclusion of bodies that are subject to government control and that define control as ‘the power to govern the financial and operating policies of an entity so as to obtain benefits from its activities’.4
4 As a consequence of the Treasury adopting statistical, rather than accounting, standards when it comes to defining ‘control’, the WGA excludes a number of significant bodies. The Treasury has also not applied its own criteria consistently as there are a number of bodies that fall within both statistical and accounting definitions of government ‘control’ but have not been included in the WGA. These include:
• a number of small bodies that have not been consolidated on the basis of size;
• other bodies that are partly or wholly owned by the government, such as the Royal Bank of Scotland (RBS); and
• bodies that have not provided data for consolidation.
5 In accordance with the accounting framework, I consider that these bodies should be included in the WGA. However, despite the government's controlling shareholding in RBS which means I need to include it within the qualification on technical grounds, I support the Treasury's exclusion of RBS from the WGA as its scale and the nature of its activities would distort the reflection of government's core activities within the financial statements.
6 I cannot quantify the impact of this on the WGA with certainty, as I do not have information needed to identify the transactions that would have to be eliminated to provide a consolidated view. However, for illustrative purposes, I have examined the impact of aggregating the gross assets, liabilities, income and expenditure published in the individual accounts of public sector bodies that the Treasury did not include in 3 https://assets.publishing.service.gov.uk/government/uploads/system/uploads/attachment_data/file/803751/WGA_2017-18_WEB_1.pdf#page=186 4 International Financial Reporting Standard 10 – Consolidated Financial Statements.
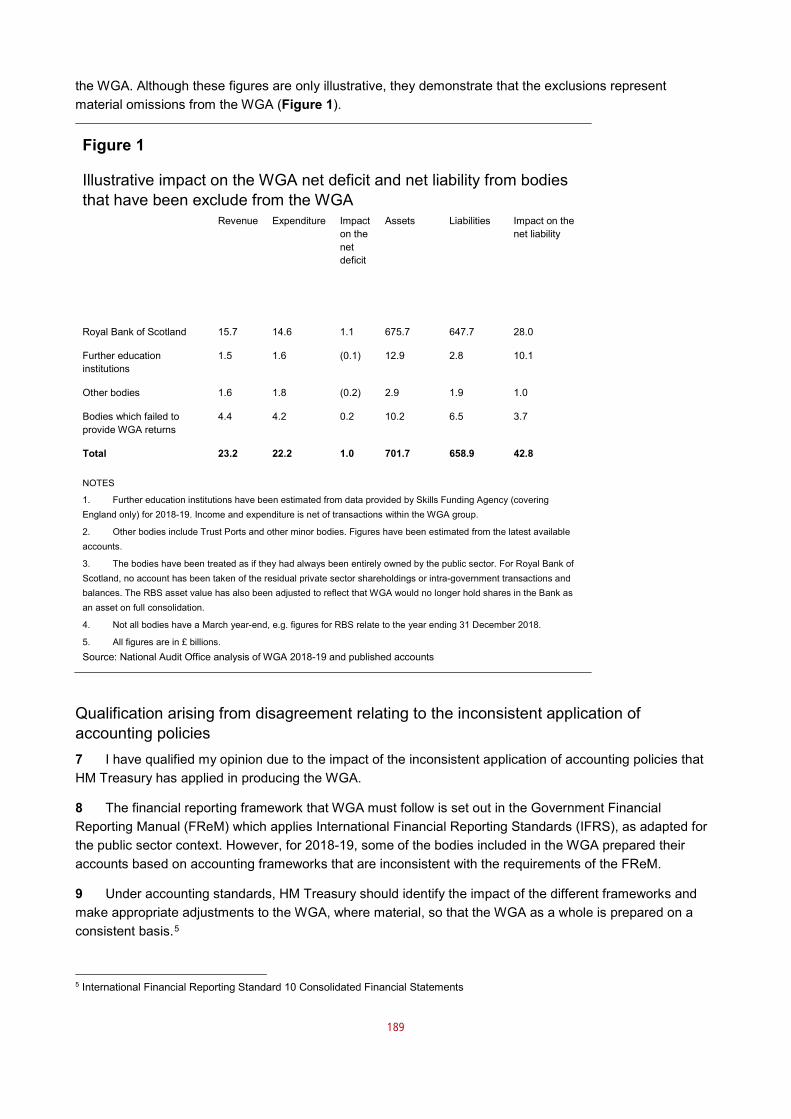
189
the WGA. Although these figures are only illustrative, they demonstrate that the exclusions represent material omissions from the WGA (Figure 1).
Figure 1
Illustrative impact on the WGA net deficit and net liability from bodies that have been exclude from the WGA Revenue Expenditure Impact
on the net deficit
Assets Liabilities Impact on the net liability
Royal Bank of Scotland 15.7 14.6 1.1 675.7 647.7 28.0
Further education institutions
1.5 1.6 (0.1) 12.9 2.8 10.1
Other bodies 1.6 1.8 (0.2) 2.9 1.9 1.0
Bodies which failed to provide WGA returns
4.4 4.2 0.2 10.2 6.5 3.7
Total 23.2 22.2 1.0 701.7 658.9 42.8
NOTES
1. Further education institutions have been estimated from data provided by Skills Funding Agency (covering England only) for 2018-19. Income and expenditure is net of transactions within the WGA group.
2. Other bodies include Trust Ports and other minor bodies. Figures have been estimated from the latest available accounts.
3. The bodies have been treated as if they had always been entirely owned by the public sector. For Royal Bank of Scotland, no account has been taken of the residual private sector shareholdings or intra-government transactions and balances. The RBS asset value has also been adjusted to reflect that WGA would no longer hold shares in the Bank as an asset on full consolidation.
4. Not all bodies have a March year-end, e.g. figures for RBS relate to the year ending 31 December 2018.
5. All figures are in £ billions. Source: National Audit Office analysis of WGA 2018-19 and published accounts
Qualification arising from disagreement relating to the inconsistent application of accounting policies 7 I have qualified my opinion due to the impact of the inconsistent application of accounting policies that HM Treasury has applied in producing the WGA.
8 The financial reporting framework that WGA must follow is set out in the Government Financial Reporting Manual (FReM) which applies International Financial Reporting Standards (IFRS), as adapted for the public sector context. However, for 2018-19, some of the bodies included in the WGA prepared their accounts based on accounting frameworks that are inconsistent with the requirements of the FReM.
9 Under accounting standards, HM Treasury should identify the impact of the different frameworks and make appropriate adjustments to the WGA, where material, so that the WGA as a whole is prepared on a consistent basis.5
5 International Financial Reporting Standard 10 Consolidated Financial Statements
190
10 Material misstatement in the WGA arises from differences between the financial reporting frameworks used by local government and public corporations, which require infrastructure assets to be valued using historical cost, and the requirements of the FReM, which determines that central government should value these assets at their depreciated replacement cost.
11 Local authority infrastructure assets consist primarily of local highways infrastructure but also other assets such as coastal defences, airports and light rail, including the London Underground network.
12 HM Treasury estimates the impact of this inconsistency with reference to a calculation made by the Office for National Statistics (ONS) in its National Accounts estimate,6 which as at 31 December 2018 valued the local authority road network at £131 billion (£128 billion restated in 2017). The value of local government infrastructure reported in the WGA for the year ended 31 March 2019 is £72.2 billion. HM Treasury therefore considers the undervaluation of these assets to be at least £58.8 billion (£47.8 billion in 2017-18).
13 In the 2016 National Accounts estimates, the ONS changed its methodology for calculating the value of the local authority network due to requirements from Eurostat to provide estimates of land values separately from the related assets. Its estimations therefore do not include the valuation of any land underlying the infrastructure assets which would be required to be included in a depreciated replacement cost valuation as prescribed by the FReM. It is therefore likely that the valuation error in the WGA for the year ended 31 March 2019 is significantly higher than the £58.8 billion calculated using data from the current ONS methodology.
14 Key to local authorities producing depreciated replacement cost valuations of their infrastructure network is robust information on: the extent and location of the authorities’ assets, the current condition of these assets, and up-to-date costs required to maintain and rebuild the network. This information is also vital to good asset management. The development and recording of this information would benefit local authorities looking to make strategic decisions regarding maintenance and capital investment in their road networks, and help the Treasury and other government departments such as the Department for Transport to develop a holistic view of the condition of this vital infrastructure across the UK.
15 In addition to the misstatement arising from the differences between the valuation of infrastructure in the local and central government settings, the discrepancy also arises between central government and public corporations which follow IFRS rather than the FReM. There are a number of bodies where this discrepancy may be material and these are adjusted by HM Treasury. In the case of Northern Ireland Water Limited, the value of its infrastructure held at the year end has not been adjusted. Whilst it is not possible to determine the precise value of this misstatement, based on bodies of a similar nature and size we estimate that the understatement of infrastructure assets is material to the WGA.
Other issues on which I have not qualified my opinion 16 There are two other issues that I wish to draw attention to, neither of which have led to a qualification of my audit opinion.
17 The external auditor of 10 accounts for the year ending 31 March 2019 (2017-18: 10) included in the WGA qualified its audit opinions owing to the existence of material irregular transactions; that is, not using resources in accordance with Parliamentary intentions. Of these, two are of significance to the WGA and cover error and fraud in benefit payments and tax credit payments. These irregularities have led me to qualify my regularity opinion on the financial statements of the Department for Work & Pensions7 and HM Revenue & Customs.8 Because the scope of my audit of the WGA, which is set out in the Government Resources and Accounts Act 2000, does not require me to provide an opinion on regularity, irregular
6 Office for National Statistics, The UK national balance sheet: 2018 estimates, Table 9, November 2019 7 Department for Work and Pensions Annual Report and Accounts 2018/19, HC 2281, 27 June 2019 8 HM Revenue and Customs Annual Report and Accounts 2018-19, HC 2394, 18 July 2019

191
transactions do not lead to a qualification of my audit opinion on the WGA.
18 Parliament authorises central government departments’ proposed cash spending and use of resources. HM Treasury is responsible for monitoring and overseeing central government departments’ compliance with the limits authorised by Parliament and for controlling adjustments to the approved limits during the financial year. If a department needs to adjust its budget during the year it has one opportunity to do so via a Supplementary Estimate, which is approved by Parliament towards the end of the financial year. Parliament expects departments to stay within the limits they are voted. Any expenditure outside the limits authorised by Parliament potentially undermines parliamentary control over public spending.
19 Where these limits are exceeded, I qualify my regularity opinion on the financial statements since this means government departments have incurred expenditure that is not in line with Parliament’s intentions. Both the Department for Education9 and the Northern Ireland Office10 incurred excess expenditure against approved limits for the 2018-19 reporting period. These irregularities have led me to qualify my regularity opinion on the financial statements of the Department for Education and Northern Ireland Office. Because the scope of my audit of the WGA, which is set out in the Government Resources and Accounts Act 2000, does not require me to provide an opinion on regularity, these transactions do not lead to a qualification of my audit opinion on the WGA.
9 https://assets.publishing.service.gov.uk/government/uploads/system/uploads/attachment_data/file/819715/DfE_ARA_2018-19_web__1_.pdf#page=114 10https://assets.publishing.service.gov.uk/government/uploads/system/uploads/attachment_data/file/841932/NIO_Annual_Report_and_Account_for_laying_on_2410191_-_certified_by_C_AG_on_231019__2_.pdf#page=93
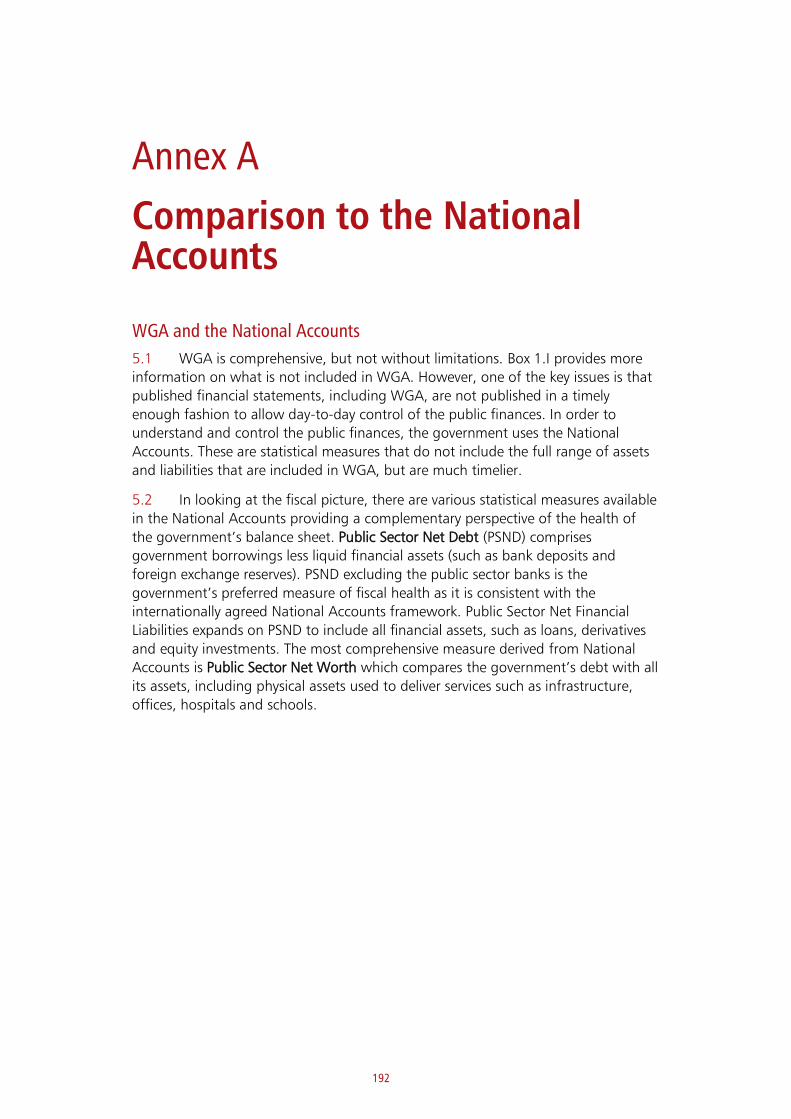
192
Annex A
Comparison to the National Accounts
WGA and the National Accounts
5.1 WGA is comprehensive, but not without limitations. Box 1.I provides more
information on what is not included in WGA. However, one of the key issues is that
published financial statements, including WGA, are not published in a timely
enough fashion to allow day-to-day control of the public finances. In order to
understand and control the public finances, the government uses the National
Accounts. These are statistical measures that do not include the full range of assets
and liabilities that are included in WGA, but are much timelier.
5.2 In looking at the fiscal picture, there are various statistical measures available
in the National Accounts providing a complementary perspective of the health of
the government’s balance sheet. Public Sector Net Debt (PSND) comprises
government borrowings less liquid financial assets (such as bank deposits and
foreign exchange reserves). PSND excluding the public sector banks is the
government’s preferred measure of fiscal health as it is consistent with the
internationally agreed National Accounts framework. Public Sector Net Financial
Liabilities expands on PSND to include all financial assets, such as loans, derivatives
and equity investments. The most comprehensive measure derived from National
Accounts is Public Sector Net Worth which compares the government’s debt with all
its assets, including physical assets used to deliver services such as infrastructure,
offices, hospitals and schools.
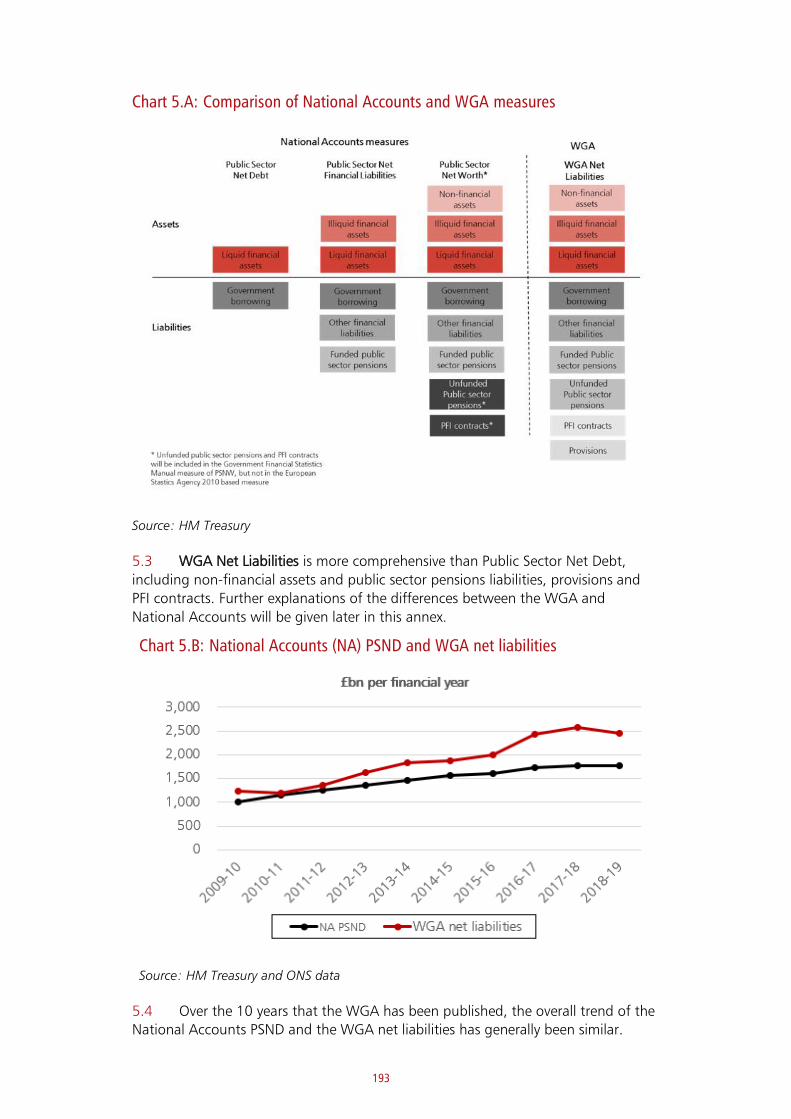
193
Chart 5.A: Comparison of National Accounts and WGA measures
Source: HM Treasury
5.3 WGA Net Liabilities is more comprehensive than Public Sector Net Debt,
including non-financial assets and public sector pensions liabilities, provisions and
PFI contracts. Further explanations of the differences between the WGA and
National Accounts will be given later in this annex.
Chart 5.B: National Accounts (NA) PSND and WGA net liabilities
Source: HM Treasury and ONS data
5.4 Over the 10 years that the WGA has been published, the overall trend of the
National Accounts PSND and the WGA net liabilities has generally been similar.
0
200
400
600
800
1,000
1,200
1,400
1,600
1,800
2,000
£bn per financial year
NA PSND
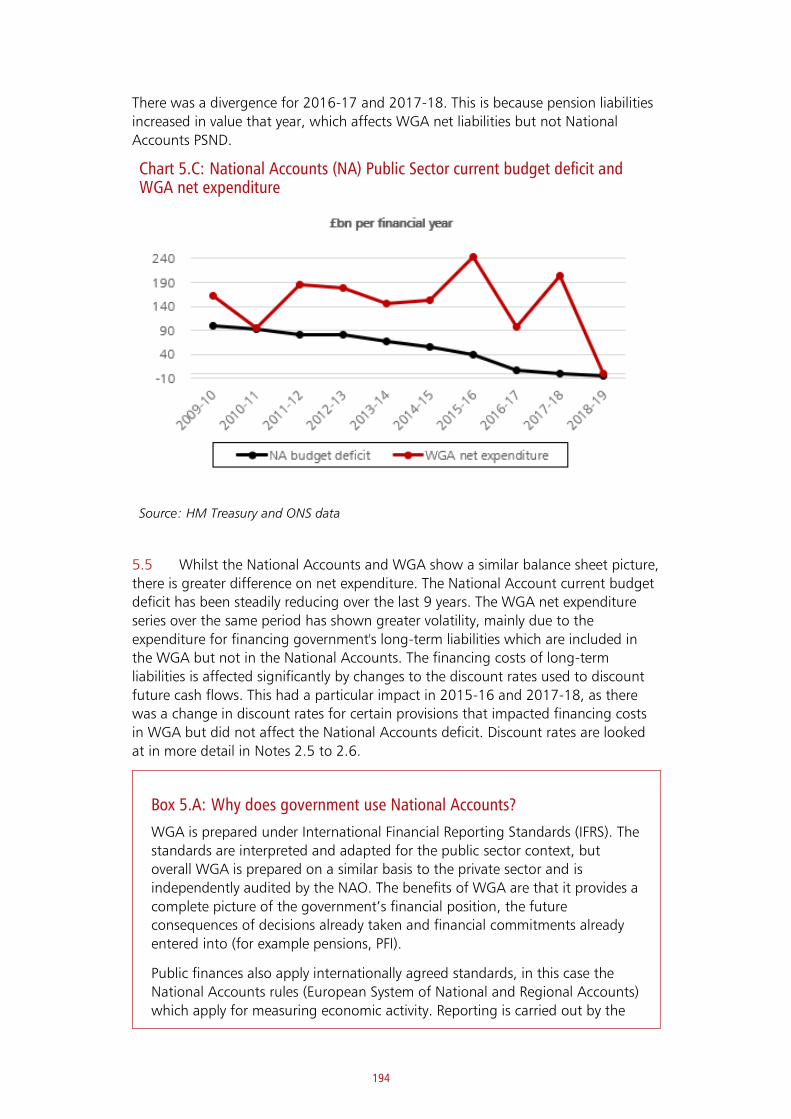
194
There was a divergence for 2016-17 and 2017-18. This is because pension liabilities
increased in value that year, which affects WGA net liabilities but not National
Accounts PSND.
Chart 5.C: National Accounts (NA) Public Sector current budget deficit and WGA net expenditure
Source: HM Treasury and ONS data
5.5 Whilst the National Accounts and WGA show a similar balance sheet picture,
there is greater difference on net expenditure. The National Account current budget
deficit has been steadily reducing over the last 9 years. The WGA net expenditure
series over the same period has shown greater volatility, mainly due to the
expenditure for financing government's long-term liabilities which are included in
the WGA but not in the National Accounts. The financing costs of long-term
liabilities is affected significantly by changes to the discount rates used to discount
future cash flows. This had a particular impact in 2015-16 and 2017-18, as there
was a change in discount rates for certain provisions that impacted financing costs
in WGA but did not affect the National Accounts deficit. Discount rates are looked
at in more detail in Notes 2.5 to 2.6.
Box 5.A: Why does government use National Accounts?
WGA is prepared under International Financial Reporting Standards (IFRS). The
standards are interpreted and adapted for the public sector context, but
overall WGA is prepared on a similar basis to the private sector and is
independently audited by the NAO. The benefits of WGA are that it provides a
complete picture of the government’s financial position, the future
consequences of decisions already taken and financial commitments already
entered into (for example pensions, PFI).
Public finances also apply internationally agreed standards, in this case the
National Accounts rules (European System of National and Regional Accounts)
which apply for measuring economic activity. Reporting is carried out by the
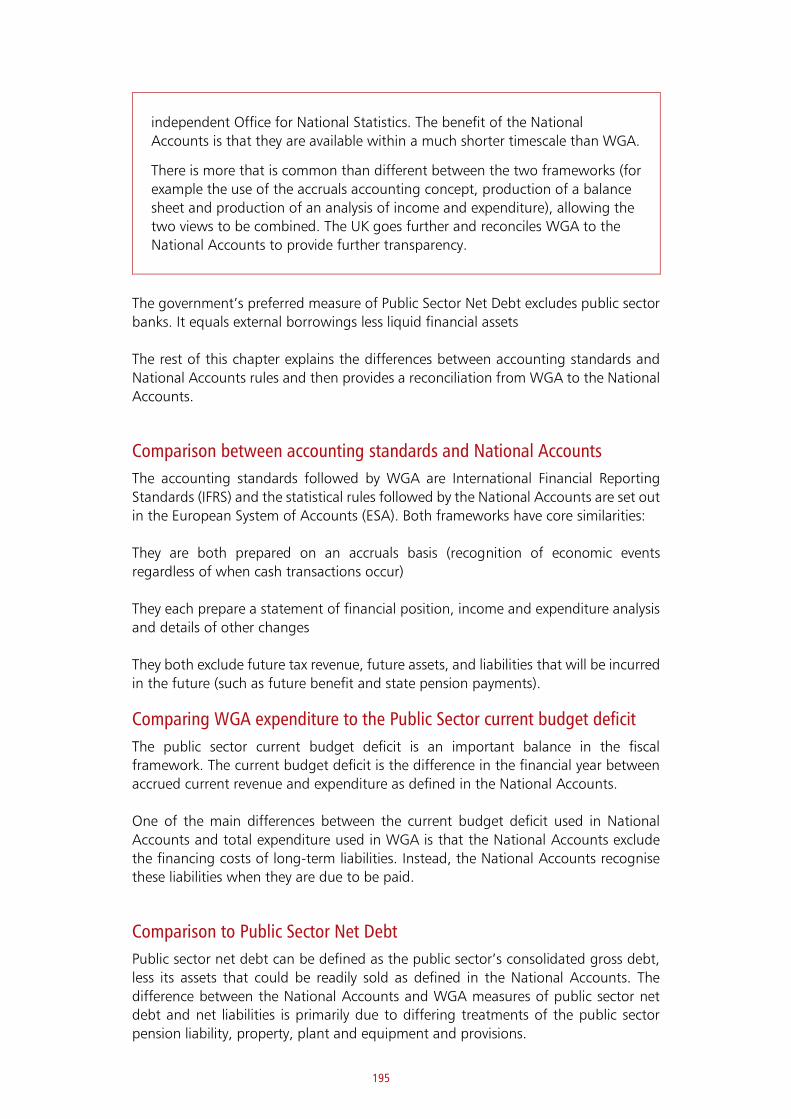
195
independent Office for National Statistics. The benefit of the National
Accounts is that they are available within a much shorter timescale than WGA.
There is more that is common than different between the two frameworks (for
example the use of the accruals accounting concept, production of a balance
sheet and production of an analysis of income and expenditure), allowing the
two views to be combined. The UK goes further and reconciles WGA to the
National Accounts to provide further transparency.
The government’s preferred measure of Public Sector Net Debt excludes public sector
banks. It equals external borrowings less liquid financial assets
The rest of this chapter explains the differences between accounting standards and
National Accounts rules and then provides a reconciliation from WGA to the National
Accounts.
Comparison between accounting standards and National Accounts
The accounting standards followed by WGA are International Financial Reporting
Standards (IFRS) and the statistical rules followed by the National Accounts are set out
in the European System of Accounts (ESA). Both frameworks have core similarities:
They are both prepared on an accruals basis (recognition of economic events
regardless of when cash transactions occur)
They each prepare a statement of financial position, income and expenditure analysis
and details of other changes
They both exclude future tax revenue, future assets, and liabilities that will be incurred
in the future (such as future benefit and state pension payments).
Comparing WGA expenditure to the Public Sector current budget deficit
The public sector current budget deficit is an important balance in the fiscal
framework. The current budget deficit is the difference in the financial year between
accrued current revenue and expenditure as defined in the National Accounts.
One of the main differences between the current budget deficit used in National
Accounts and total expenditure used in WGA is that the National Accounts exclude
the financing costs of long-term liabilities. Instead, the National Accounts recognise
these liabilities when they are due to be paid.
Comparison to Public Sector Net Debt
Public sector net debt can be defined as the public sector’s consolidated gross debt,
less its assets that could be readily sold as defined in the National Accounts. The
difference between the National Accounts and WGA measures of public sector net
debt and net liabilities is primarily due to differing treatments of the public sector
pension liability, property, plant and equipment and provisions.

196
Differences between WGA and National Accounts
The differences between IFRS and ESA in how they recognise, and value certain assets,
liabilities and items of expenditure are summarised below:
Area WGA treatment National Accounts treatment
Grants to fund
capital expenditure
Is recognised as an expense in-year as it
does not result in an asset for
government
Is always capitalised on the basis that it
results in an asset in the wider economy
Research and
development
expenditure
Can be capitalised if it is likely to result
in an asset but is frequently recognised
as an expense in-year
Is capitalised more frequently on the
basis that it is an investment lasting for
more than one year
PFI Most PFI assets and liabilities are
recognised on balance sheet after
assessing control of the assets. PFI
payments are apportioned between
repaying debt, paying interest and
paying for services
Most PFI assets and liabilities are not
recognised on the balance sheet after
assessing risks and rewards. Payments
under PFI contracts are recognised as a
current expense in-year for off balance
sheet schemes and a capital expense in-
year for on balance sheet schemes.
Depreciation of
assets
Is calculated for each asset individually
based on its estimated useful economic
life and residual value
Is calculated using standard statistical
models, high level data and asset life
assumptions.
Revaluation and
impairment of
assets
Assets are revalued as set out in Note 1
of the WGA. Assets are assessed
annually for impairment compared to
their carrying value
Assets are recognised at cost less
depreciation and are not revalued. Only
impairments caused by obsolescence or
accidental damage are recognised
Profit or loss on
sale of assets
Recognised as income or expenditure Proceeds of sale are recognised but not
the profit or loss
Gilts WGA bodies hold gilts at fair value,
these are eliminated on consolidation
and all the remaining gilts are held at
amortised cost
Gilts are included based on their
redemption price
Public sector
pensions
Recognises expenditure when rights
accrue to employees, even though
payment is not due
Recognises expenditure as it is paid to
retirees. The future liability for current
employees is not recognised
Provisions Recognises expenditure when it
becomes probable that a payment will
be needed because of past events
Recognises provisions only when they
are settled (i.e. there are actual
payments). Amounts expected to be
paid out in future because of past
events are not recognised
Effects of
discounting future
liabilities
Future cash flows are discounted to
estimate the value of the liability.
Changes to the cash flows and discount
rate are recognised in-year
Not included

197
Transactions within
government
Transactions are eliminated entity by
entity in a process that takes several
months. The residual elimination error is
quantified and subject to audit
Transactions are eliminated using a
quicker and higher-level approach. The
residual elimination error cannot be
quantified
Asset Purchase
Facility
Shows gilt purchases at fair value Records the gilt purchases at nominal
value
UK Asset Resolution
(UKAR)
Includes both the liabilities and the
assets.
Includes UKAR’s own debts to the
private sector and excludes their non-
liquid financial and other assets
Housing associations Not included within the WGA boundary Housing Associations used to be
included in the National Accounts but
are no longer
Reconciliation to Public Sector Net Debt
Public Sector Net Debt is a measure that is calculated from the National Accounts.
The same figures can be compiled from WGA, but the total net liabilities recognised
within WGA are more extensive than those recognised in Public Sector Net Debt. This
is partly because Public Sector Net Debt is only part of the National Accounts balance
sheet and partly because WGA recognises additional assets and liabilities which are
not included on the National Accounts balance sheet.
The reconciling amounts included in the table above are calculated as the difference
between the value of a balance in WGA and the value of the same balance in the
National Accounts. These amounts are therefore not directly comparable to the
amounts included in the Financial Statements in Chapter 4.

198
2018-19 2017-18 2016-17
£bn £bn £bn
Public Sector Net Debt (National Accounts) 1,774 1,779 1,727
Add liabilities not recognised in National Accounts:
Net public sector pensions liability 1,894 1,865 1,835
Provisions 311 422 322
PFI contracts 32 33 33
Adjust assets measured differently in national accounts:
Asset Purchase Facility (194) (200) (127)
Unamortised premia on gilts 56 54 51
UK Asset Resolution (UKAR) net impact on net debt (2) (10) (24)
Add assets and liabilities excluded from measure of PSND:
Property, plant and equipment (1,268) (1,208) (1,168)
Investment property (23) (20) (18)
Intangible assets (37) (36) (35)
Trade and other receivables (41) (42) (49)
Prepayments and accrued income (108) (103) (91)
Inventories (10) (10) (9)
Investments (53) (52) (51)
Trade and other payables 51 53 51
Accruals and deferred income 61 62 59
Deduct liabilities not yet recognised in WGA
Housing associations - - (70)
Other adjustments including eliminations 12 (22) (15)
Net liabilities (WGA) 2,456 2,565 2,421
Reconciliation to Public Sector Current Budget Deficit
Public Sector Current Budget Deficit is also calculated from the National Accounts and
the government’s preferred measure excludes public sector banks. Total net
expenditure in WGA is higher than the Public Sector Current Budget Deficit primarily
because it includes expenditure on long-term liabilities.
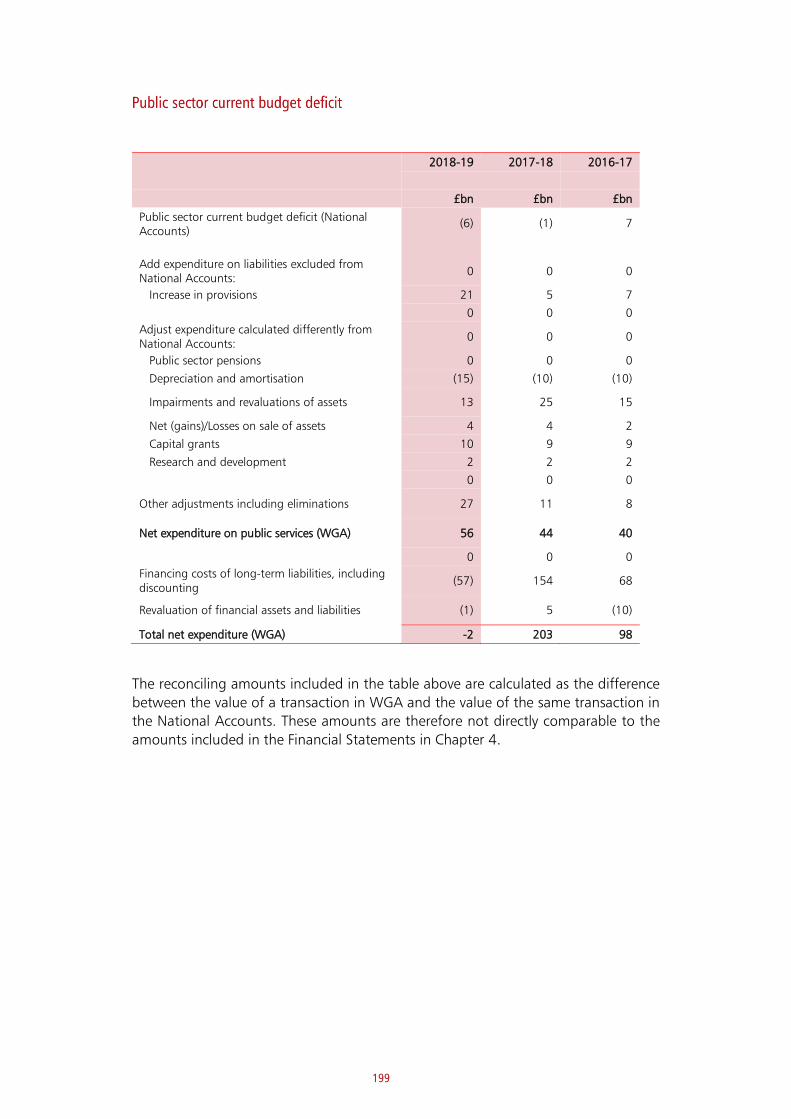
199
2018-19 2017-18 2016-17
£bn £bn £bn
Public sector current budget deficit (National Accounts)
(6) (1) 7
Add expenditure on liabilities excluded from National Accounts:
0 0 0
Increase in provisions 21 5 7
0 0 0
Adjust expenditure calculated differently from National Accounts:
0 0 0
Public sector pensions 0 0 0
Depreciation and amortisation (15) (10) (10)
Impairments and revaluations of assets 13 25 15
Net (gains)/Losses on sale of assets 4 4 2
Capital grants 10 9 9
Research and development 2 2 2
0 0 0
Other adjustments including eliminations 27 11 8
Net expenditure on public services (WGA) 56 44 40
0 0 0
Financing costs of long-term liabilities, including discounting
(57) 154 68
Revaluation of financial assets and liabilities (1) 5 (10)
Total net expenditure (WGA) -2 203 98
The reconciling amounts included in the table above are calculated as the difference
between the value of a transaction in WGA and the value of the same transaction in
the National Accounts. These amounts are therefore not directly comparable to the
amounts included in the Financial Statements in Chapter 4.

HM Treasury contacts
This document can be downloaded from www.gov.uk
If you require this information in an alternative format or have
general enquiries about HM Treasury and its work, contact:
Correspondence Team
HM Treasury
1 Horse Guards Road London SW1A 2HQ
Tel: 020 7270 5000
Email: [email protected]


