

20.11.2017
© 2017 Willis Towers Watson. All rights reserved.
CEEMEA Compensation Market TrendsWebcast
Willis Towers Watson Data Services

Agenda
2© 2017 Willis Towers Watson. All rights reserved. Proprietary and Confidential. For Willis Towers Watson and Willis Towers Watson client use only.
Introduction
2017 CEEMEA market trends and insight from the latest survey results
How to find us
Our Compensation Analytics

We are an integrated advisory, broking and solutions company organized around four business segments designed to meet our clients’ risk and people needs
3© 2017 Willis Towers Watson. All rights reserved. Proprietary and Confidential. For Willis Towers Watson and Willis Towers Watson client use only.
Willis Towers Watson
Talent and Rewards
Health and Benefits
Technology and Administrative
Solutions
Retirement
Global Network Group
Human Capital & Benefits

We are an Integrated Solutions Provider
• Compensation Software:
Ø Market Analysis & Compensation Design module
Ø Data Interactive module
• Access to global network of Data Services, Rewards and HR Software consultants
• Compensation, Benefits & HR Practices Data
• Delivered through an integrated software platform
We are an Integrated Solutions Provider
4
=Data Software Advisory
+ +Valuable and unique proposition for our clients to address the entire annual compensation cycle
© 2017 Willis Towers Watson. All rights reserved. Proprietary and Confidential. For Willis Towers Watson and Willis Towers Watson client use only.

Compensation, Benefits & HR Practices Data offerings
© 2017 Willis Towers Watson. All rights reserved. Proprietary and Confidential. For Willis Towers Watson and Willis Towers Watson client use only. 5
Central Eastern Europe, the Middle East & Africa:
Survey Data
Benefits Design PracticesRetirement § DB, DC or hybrid schemes
Healthcare § Medical, dental and vision
Wellness§ Medical check up§ Employee Assistance Program
Risk benefit plans§ Death, accident, disability § Critical illness
Paid time offMeal benefitsFlexible benefits
HR Policies and Practices§Compensation policies and
practices§ Starting salaries§ Variable pay§Company cars§Guaranteed payments, cash
allowances and perquisites§ Sales force policies and practices§ Education, training and professional
development§Working hours§ Business travel and relocation§ Attraction, retention and termination§ Length of service award
CompensationPosition Information§ Employee location§ Geographic responsibility
Salary Information§ Base pay§ Guaranteed bonus§ Allowances§ Variable pay (actual and target)§ Long-term incentives
Methodology§ Career Bands/Levels + Global
Grades grouped by job Functions + Disciplines (areas of specialization)
BDPHRPComp
59Countries
521,449Incumbents
2,939+Participants

2017 CEEMEA market trends and insight from the latest survey results
© 2017 Willis Towers Watson. All rights reserved. Proprietary and Confidential. For Willis Towers Watson and Willis Towers Watson client use only. 6

Common market trends
© 2017 Willis Towers Watson. All rights reserved. Proprietary and Confidential. For Willis Towers Watson and Willis Towers Watson client use only.
Skills Shortage
Challenges in attraction and
retention of right talent
EconomicGrowth
Stronger GDP, lower inflation and
decreasingunemployment
Legislative Changes
New tax laws and other governmental
changes are impacting pay and
benefits
7

CEEMEA Macroeconomic KPI’s
0%
5%
10%
15%
20%
25%
30%
35%
CEEMEA Annual GDP Growth and CPI % 2018
CPI % GDP %
CPI%Nigeria: 14.2%Egypt: 18.9%Rep. of Congo: 31.9%2018 Q1 Median Q3
GDP % 1.9 2.9 3.3
CPI % 2.2 3.8 6.2
! 2018 Median CPI % for region projected at ~3.8%
© 2017 Willis Towers Watson. All rights reserved. Proprietary and Confidential. For Willis Towers Watson and Willis Towers Watson client use only.
Source: Economist Intelligence Unit, November 13, 2017
8

CEEMEA Macroeconomic KPI’s
0,6%
28,1%
0%
5%
10%
15%
20%
25%
30%
35%
CEEMEA Unemployment % 2017 - 2018
20172018 (forecast)
Source: Economist Intelligence Unit, November 1, 2017
CEEMEA Unemployment % 2017-2018
Median
2017 9.02018 8.2
© 2017 Willis Towers Watson. All rights reserved. Proprietary and Confidential. For Willis Towers Watson and Willis Towers Watson client use only. 9

Challenges attracting employees in key workforce segments remain high overallEven more so for organizations operating in emerging economies
10© 2017 Willis Towers Watson. All rights reserved. Proprietary and Confidential. For Willis Towers Watson and Willis Towers Watson client use only.
Mature Markets Emerging Markets
28%
45%
55% 54% 56%
44%
57%
66%
77% 76%
0%
10%
20%
30%
40%
50%
60%
70%
80%
90%
All employees Diverseemployee
populations
Critical-skillemployees
High-potentialemployees
Top-performingemployees
All employees Diverseemployee
populations
Critical-skillemployees
High-potentialemployees
Top-performingemployees
Attraction Challenges
Nearly half (48%)of employers report
hiring activity increased
EMEA
Source: Willis Towers Watson 2016 Talent Management & Rewards Study – Global

Retaining key employee groups remains difficult, especially in emerging markets Close to three quarters of employers have trouble retaining high potentials
11© 2017 Willis Towers Watson. All rights reserved. Proprietary and Confidential. For Willis Towers Watson and Willis Towers Watson client use only.
Mature Markets Emerging Markets
20%
28%
37%
47%44% 41%
47%
59%
70%65%
0%
10%
20%
30%
40%
50%
60%
70%
80%
All employees Diverseemployee
populations
Critical-skillemployees
High-potentialemployees
Top-performingemployees
All employees Diverseemployee
populations
Critical-skillemployees
High-potentialemployees
Top-performingemployees
Retention Challenges
One-third (35%) of employers report
turnover activity increased
EMEA
Source: Willis Towers Watson 2016 Talent Management & Rewards Study – Global

Legislative Changes 2017 -2018
12© 2017 Willis Towers Watson. All rights reserved. Proprietary and Confidential. For Willis Towers Watson and Willis Towers Watson client use only.
UAE to implement VAT on 1 January 2018VAT to be introduced at a rate of 5% with some limited exceptions including basic food items, healthcare and education. The UAE are planning to implement on 1 January 2018 - other GCC countries may do so at the same time or by 1 January 2019 at the latest.
Kenya clarifies tax treatment of select benefits and perksThe Kenya Revenue Authority's revised PAYE Guide, issued March 1, 2017, clarifies tax treatment of certain perks and benefits including company-provided housing, meals (up to KES 4,000 per month) and the tax exemption for retirement benefits, bonuses, and overtime allowances for low-wage workers (earning under KES 11,180 per month).
Romania to change tax and social security contributions1. Local currency equivalent of 400 euros per year in employer-paid medical service subscriptions for employees and
their dependents are exempt from personal income tax and social security contributions for employees. (since 03.09.2017)
2. Substantial increase in monthly minimum wage in 2018: Increase to RON 1,900/month as of 2018 (currently RON 1,450)
3. Social security contribution and taxation changed• Significant proportion of employer social security contributions shifted to employees, meaning employees’
contributions on pay would increase from 16.5% to 35% of covered pay• Flat personal income tax reduced from 16% to 10%
Russia increased fines for data protection violations (7/2017)
South Africa changes regulations for retirement fundsDefault regulations for retirement funds took effect as of September 1, 2017, requiring that all DC plans include an appropriate and reasonably-priced default investment fund option, a default preservation strategy for employees leaving service with the employer and annuity default strategy. Mandatory annuitization is scheduled to being from March 2018 but the matter is still under advisement, with the target date likely to be pushed back to 2019.

Trends by sub region
© 2017 Willis Towers Watson. All rights reserved. Proprietary and Confidential. For Willis Towers Watson and Willis Towers Watson client use only. 13
14
29,000+ поданных сотрудников
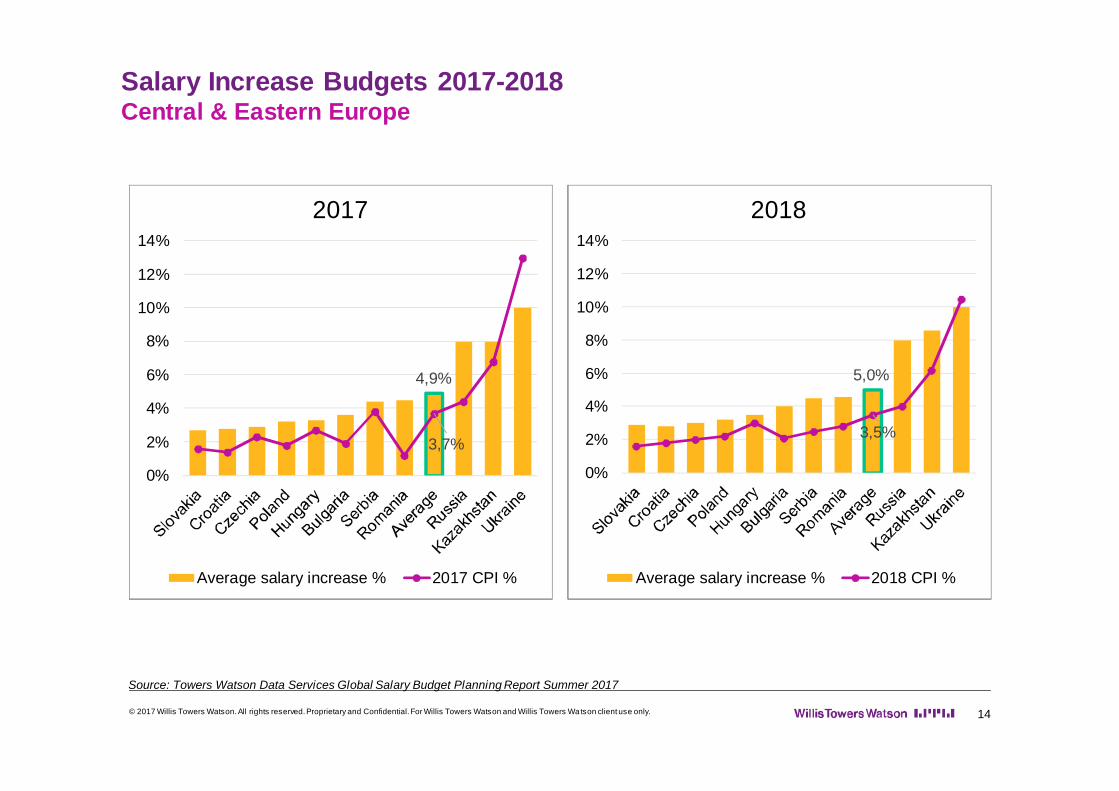
Salary Increase Budgets 2017-2018Central & Eastern Europe
4,9%
3,7%
0%
2%
4%
6%
8%
10%
12%
14%
2017
Average salary increase % 2017 CPI %
5,0%
3,5%
0%
2%
4%
6%
8%
10%
12%
14%
2018
Average salary increase % 2018 CPI %
Source: Towers Watson Data Services Global Salary Budget Planning Report Summer 2017
© 2017 Willis Towers Watson. All rights reserved. Proprietary and Confidential. For Willis Towers Watson and Willis Towers Watson client use only.

Regional Staff Turnover RatesCEE Region
15© 2017 Willis Towers Watson. All rights reserved. Proprietary and Confidential. For Willis Towers Watson and Willis Towers Watson client use only.
6
2
8
5
7
6
2
6
4
4
10
6
3
13
10
8
10
8
8
9
8
9
9
5
4
3
Voluntary Involuntary Top Retention / Attraction Drivers
Reasons to Leave§ Base pay / Salary
§ Career advancement opportunities
§ Physical work environment
§ Job security
§ Ability to manage work-related stress
Reasons to Stay§ Base pay / Salary
§ Job security
§ Career advancement opportunities
§ Challenging work
§ Opportunities to learn new skills
Source: 2016 Willis Towers Watson General Industry Survey - HR Policies and Practices Report2017 Willis Towers Watson Global Talent Management & Rewards and Global Workforce Studies
Kazakhstan
Romania
Serbia
Bulgaria
Russia
Czechia
Slovakia
Ukraine
Poland
Hungary
Greece
Slovenia
Croatia
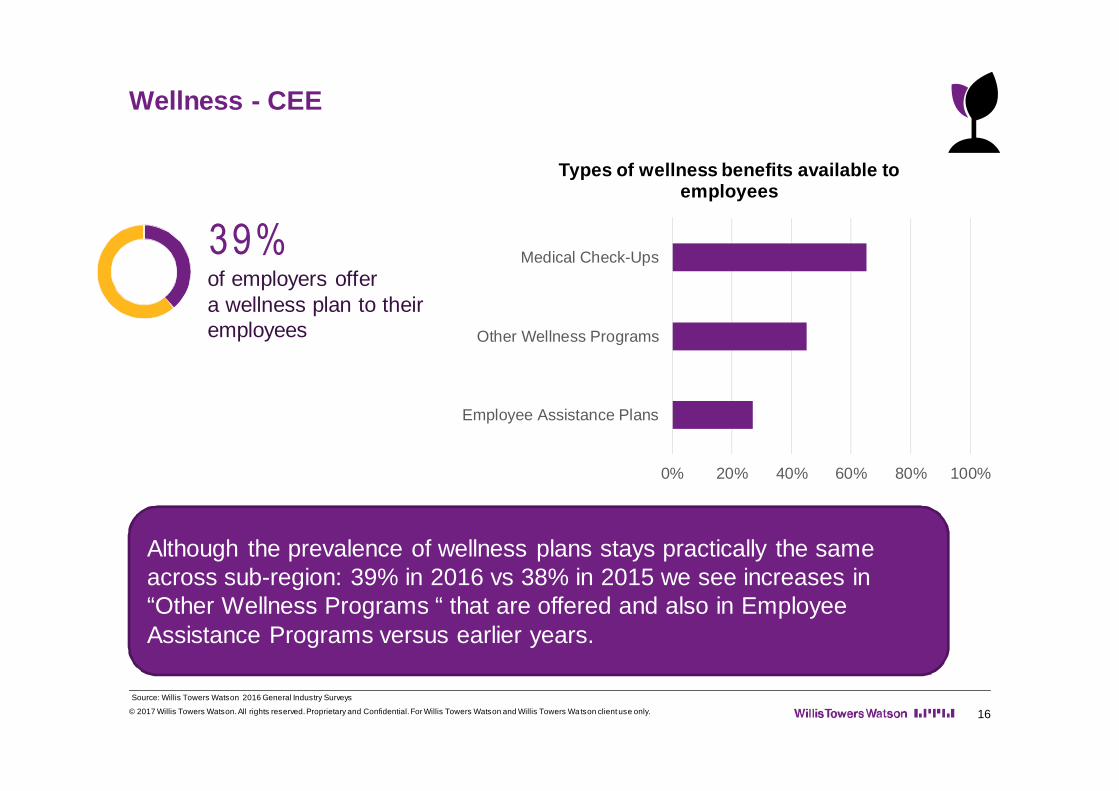
Wellness - CEE
16
39%of employers offer a wellness plan to theiremployees
Although the prevalence of wellness plans stays practically the same across sub-region: 39% in 2016 vs 38% in 2015 we see increases in “Other Wellness Programs “ that are offered and also in Employee Assistance Programs versus earlier years.
Source: Willis Towers Watson 2016 General Industry Surveys
0% 20% 40% 60% 80% 100%
Employee Assistance Plans
Other Wellness Programs
Medical Check-Ups
Types of wellness benefits available to employees
© 2017 Willis Towers Watson. All rights reserved. Proprietary and Confidential. For Willis Towers Watson and Willis Towers Watson client use only.

6,3%
6,0%
0%
2%4%
6%
8%
10%12%
14%
16%18%
20%
2018
Average salary increase % 2018 CPI %
5,2%
5,2%
0%2%4%6%8%
10%12%14%16%18%20%
2017
Average salary increase % 2017 CPI %
17
Salary Increase Budgets 2017-2018Middle East
Source: Towers Watson Data Services Global Salary Budget Planning Report Summer 2017
© 2017 Willis Towers Watson. All rights reserved. Proprietary and Confidential. For Willis Towers Watson and Willis Towers Watson client use only.

Current challenges in the Middle East
18© 2017 Willis Towers Watson. All rights reserved. Proprietary and Confidential. For Willis Towers Watson and Willis Towers Watson client use only.
No Coverage
PartialCoverage
Full Coverage
70%
26%
4%
Expat feesin KSA …
Source: Willis Towers Watson Expat Levy Pulse Survey – August 2017
EGP Devaluationin Egypt …
Source: Willis Towers Watson EGP Devaluation Pulse Survey – March 2017
Embargo in Qatar … Tax introductionin the UAE …
Egypt currency devaluation Results from Pulse Survey available now!
2,9 1,9
2017 2018
GDP CPI
4,0 4,8
2017 2018
Salary Increases
3,3 3,6
2017 2018Source: Economist Intelligence Unit – September 2017
Excise tax: 1 October 201750% 100%
Carbonated beverages Tobacco & Energy drinks
VAT: 1 January 2018
Majority of transactions of goods and services5%
• Majority of companies adjusted pay during the period January - April
• 2017 review indicated a typical 16% increase, at Median

Africa Overview: How large is Africa?
19
…Comparison against other countries§ Greater land mass than US, China,
Eastern Europe, much of Western Europe and India COMBINED;
§ Twice the size of Russia;§ Over 1 billion people, speaking over
1,000 languages, with 41% under the age of 15;
§ 42 cities of at least 1m people:§ Mobile phone penetration of 67%;§ 7% of people classified as “middle class”;§ 8% of world’s oil reserves, gold reserves
of $1.5 trillion;§ Average inflation during 2000s was
around 10%, further decrease in 2010-2017;
§ Average gross government debt as a percentage of GDP was 67% in 2000s. During the same period, average budget balances have narrowed.
© 2017 Willis Towers Watson. All rights reserved. Proprietary and Confidential. For Willis Towers Watson and Willis Towers Watson client use only.
The true size of Africa

20
29,000+ поданных сотрудников
Salary Increase Budgets 2017-2018Africa
6,2%
10,0%
0%
5%
10%
15%
20%
25%R
epub
lic o
f the
Con
go
Bot
swan
a
Zim
babw
e
Mor
occo
Tuni
sia
Ave
rage
Alg
eria
Sou
th A
frica
Ken
ya
Moz
ambi
que
Ang
ola
Nig
eria
Egy
pt
2017
Average salary increase % 2017 CPI %
6,7%
7,8%
0%
5%
10%
15%
20%
25%
Zim
babw
e
Rep
ublic
of t
he C
ongo
Mor
occo
Bot
swan
a
Tuni
sia
Moz
ambi
que
Ave
rage
Alg
eria
Sou
th A
frica
Ken
ya
Ang
ola
Nig
eria
Egy
pt
2018
Average salary increase % 2018 CPI %
Source: Towers Watson Data Services Global Salary Budget Planning Report Summer 2017
© 2017 Willis Towers Watson. All rights reserved. Proprietary and Confidential. For Willis Towers Watson and Willis Towers Watson client use only.

0,014%0,018%0,024%0,03%0,033%0,037%0,04%0.041%0,063%0,068%
0,102%0,134%
0,173%0,326%
0,714%1,268%
1,563%1,611%
1,763%
TanzaniaGhana
UgandaEthiopia
MozambiqueZambiaMalawi
LesothoNigeria
CameroonDRC
KenyaSenegal
South AfricaPolandRussiaSpain
NetherlandsGermany
R&D Personnel as a % of Labor Force
People Challenges in Africa: Supply
21
Specific Skills Are Hard to Get
Such youthful markets makes experience rare
And if that experience was
abroad…?
Source: Towers Watson analysis of Economist Intelligence Unit and UNESCO data, 2017
Candidates with either know their
value
© 2017 Willis Towers Watson. All rights reserved. Proprietary and Confidential. For Willis Towers Watson and Willis Towers Watson client use only.
10
15
20
25
30
35
40
45
50
Average Age
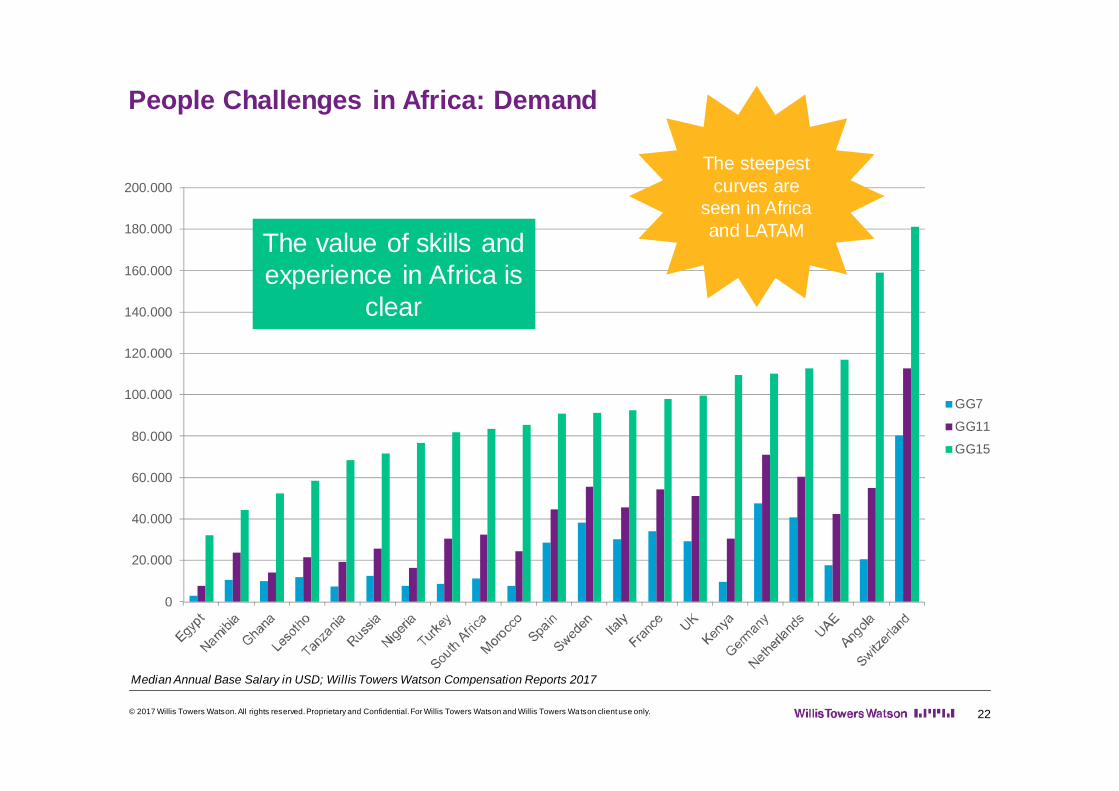
People Challenges in Africa: Demand
22
0
20.000
40.000
60.000
80.000
100.000
120.000
140.000
160.000
180.000
200.000
GG7
GG11
GG15
Median Annual Base Salary in USD; Willis Towers Watson Compensation Reports 2017
The value of skills and experience in Africa is
clear
The steepest curves are
seen in Africa and LATAM
© 2017 Willis Towers Watson. All rights reserved. Proprietary and Confidential. For Willis Towers Watson and Willis Towers Watson client use only.

23© 2017 Willis Towers Watson. All rights reserved. Proprietary and Confidential. For Willis Towers Watson and Willis Towers Watson client use only.
Global Labor Markets: How is Africa doing in this world?
0
10000
20000
30000
40000
50000
60000
70000
80000
90000
Ukr
aine
Egy
ptIn
dia
Phi
lippi
nes
Indo
nesi
aB
elar
usK
azak
hsta
nM
aurit
ius
Thai
land
Pak
ista
nTu
nisi
aR
ussi
aM
alay
sia
Rom
ania
Moz
ambi
que
Uga
nda
Nig
eria
Mor
occo
Alg
eria
Bos
nia-
Her
zego
vina
Turk
eyH
unga
ryC
olom
bia
Chi
na (
Bei
jing)
Bul
garia
Ecu
ador
Slo
vaki
aTa
nzan
iaP
olan
dS
eneg
alC
zech
iaS
outh
Afri
caC
osta
Ric
aB
razi
lP
eru
Arg
entin
aK
enya
Taiw
anU
rugu
ayC
roat
iaG
reec
eC
hile
Por
tuga
lS
pain
Slo
veni
aA
ngol
aIta
lyH
ong
Kon
gB
ahra
inJa
pan
Kor
eaS
inga
pore
Om
anIre
land
Uni
ted
Kin
gdom
Net
herla
nds
Uni
ted
Ara
b E
mira
tes
Fran
ceB
elgi
umFi
nlan
dS
audi
Ara
bia
Sw
eden
New
Zea
land
Can
ada
Kuw
ait
Isra
elA
ustri
aLu
xem
bour
gA
ustra
liaQ
atar
Ger
man
yN
orw
ayU
nite
d S
tate
sD
enm
ark
Sw
itzer
land
Med
ian
Median
Source: 2017 WTW Compensation Surveys
2. Compensation Trends
ZAF: ($15k) CHE: ($89k)
NGA: ($11k)Annual Guaranteed Pay in USD; entry level
EGY: ($5k)
ANG: ($22k)

Our Compensation Analytics Offering
© 2017 Willis Towers Watson. All rights reserved. Proprietary and Confidential. For Willis Towers Watson and Willis Towers Watson client use only. 24

Compensation Analytics service offering
© 2017 Willis Towers Watson. All rights reserved. Proprietary and Confidential. For Willis Towers Watson and Willis Towers Watson client use only.
Pay Mix Analysis
Bonus Pool FundingOverall Market Positioning
Quartile Analysis
25

Compensation Analytics service offering
26© 2017 Willis Towers Watson. All rights reserved. Proprietary and Confidential. For Willis Towers Watson and Willis Towers Watson client use only.
How it fits with WTW’s broader data and consulting offerings
• General Industry & Sector-Specific Surveys
• Executive Surveys
• Bespoke & Club Surveys
• Rewards philosophy• Salary structure design• HR Policies & Procedures• Organisation Structure
Design• Job Evaluation• Compensation Software• Benefits Optimisation• Total Rewards Optimisation• Segmentation approach• Entitlement• Variable Pay Design• Performance Management• Sales effectiveness• Employee engagement
surveys• Employee value proposition• Executive Compensation
NEWCompensation Analytics
• Pay Competitiveness Report
• Pay for Performance Assessment Report
• Cost Optimisation Report
• Pay Increase Trends Report
• Executive Compensation Report
Managing pay across countries
Optimising employment costs
Managing pay increase budgets
Pay for Performance
Attracting and retaining talent
Managing Executive C&B
Managing Blue Collar C&B

How to find us
© 2017 Willis Towers Watson. All rights reserved. Proprietary and Confidential. For Willis Towers Watson and Willis Towers Watson client use only. 27
Contact Details
© 2017 Willis Towers Watson. All rights reserved. Proprietary and Confidential. For Willis Towers Watson and Willis Towers Watson client use only. 28
Léonie WeyGlobal Data Services Leader [email protected]
View our product range: www.wtwdataservices.com
See our latest insightswww.willistowerswatson.com/en/insights
https://www.linkedin.com/company/willistowerswatson
https://www.facebook.com/willistowerswatson/
https://twitter.com/WTWhr


