

PCB Mass Loading Phase IIWilmington Rolling Mill PropertySIRS ID: DE-1198Wilmington, Delaware
Appendix 29
WILMINGTON ROLLING MILL PROPERTYWILMINGTON, DELAWARE
SIRS ID: DE-1198

PCB Mass Loading Phase IIWilmington Rolling Mill PropertySIRS ID: DE-1198Wilmington, Delaware
GENERAL SITE INFORMATIONSite Name: Wilmington Rolling Mill Property
SIRS ID Number: DE-1198
Site Location and Description:
The Wilmington Rolling Mill Property is located at 1020 Church Street in Wilmington, Delaware(Figure 1). The site is approximately 2.8 acres in size and is comprised of two parcels(#2603630706 and #2603630707). The site is bounded to the north by a City of Wilmington parcel to the east by the Brandywine Creek, to the south by O’Brien Industries, and to the west by Church Street.
Based on the 2004 Remedial Investigation, surface water from the Site is expected to flow east towards the Brandywine Creek.
The property is currently owned by 920, LLC. There are two buildings on the property from the 1800s as well as a small welding storage shed.
Previous Site Uses:
The Wilmington Rolling Mill Property was used for industrial purposes starting in the mid to late 1800s. The Seidel and Hastings Company (Wilmington Plate Iron Rolling Mills) was indicated as the occupant of the property on an 1884 map. Historic research indicates that Seidel and Hastings owned the property as early as 1864. Seidel and Hastings manufactured steel plates. Historic maps indicate that by 1893, a railway and a coal yard were present on the northern and eastern portions of the property. At some point between 1893 and 1901, John Hamilton took ownership of the coal yard on the northern portion of the property and several buildings were constructed. The southern portion of the site was still owned by Seidel and Hastings. By 1927, the property had become part of the estate of Samuel Hilles and the former occupants were no longer operating at the property. Between 1929 and 1971, a variety of companies occupied the site including Consolidated Machine Tool Company, Diamond Ice and Coal Company, and McCormick Supply & Equipment, Inc. The site was unoccupied for some time and it was a part of the estate of George Horn. It was later sold and used for different commercial purposes, one of them being steel storage by RC Fabricators, Inc.
File: 0985.69.51 Page 1 of 11 June 2014

PCB Mass Loading Phase IIWilmington Rolling Mill PropertySIRS ID: DE-1198Wilmington, Delaware
Site Regulatory Status:
This section briefly summarizes previous investigations performed on the site through the SIRSprogram. A current SIRS regulatory status is also included.
Brownfield Preliminary Assessment II (DNREC, 2000)
In June 2000, DNREC SIRB performed site visits to the property to identify topographic features at the site and to determine sampling locations for an investigation of the property. During the initial site investigation, between 50 and 60 abandoned 55-gallon drums were discovered in a stone and cinderblock building located near a pumping station owned by the City Wilmington. GuardianEnvironmental Services (GES) was contracted by DNREC Emergency Response Branch (ERB) to characterize the contents of the drums. GES sampled the drums on July 12, 2000 and none of the drums were found to contain hazardous materials. Twenty-one drums were found to contain rainwater, 22 drums were empty, 10 drums were found to contain non-PCB oil mixed with rainwater, and three drums were found to contain grease and rainwater. On July 11 and 12, 2000, DNREC collected 24 soil samples from 12 test pits at the property, 8 surface soil samples, and three sediment samples from the Brandywine Creek located adjacent to the property. Soil samples were field screened for PCBs by DNREC using immunoassay test kits. Based on results of the field screening, one surface soil sample and one sediment sample were sent for laboratory PCB analysis. The surface soil sample (WRM-SS2) was found to contain Aroclor 1260 at a concentration of 1.1 mg/kg. The sediment sample (WRM-SED3) was also found to contain Aroclor 1260 at a concentration 2,500 mg/kg. Sediment sample WRM-SED3 was reportedly collected from below a stormwater outfall for the property which discharged to the Brandywine Creek. Based on the results of the BPA II, DNREC recommended that additional investigation of the property be performed prior to any redevelopment activities at the property.
Tank Closure Documentation (DNREC, 2001)
In August 2001five USTs were removed from the site and soil samples were collected. Analyses showed detections above the DNREC Tier 0 Action Levels for TPH-GRO and xyleneconcentrations at Tank 1. The UST system was granted “No Further Action” status by DNREC but a contaminated soil management plan is required if any future excavation takes place.
File: 0985.69.51 Page 2 of 11 June 2014
PCB Mass Loading Phase IIWilmington Rolling Mill PropertySIRS ID: DE-1198Wilmington, Delaware
Remedial Investigation Report (Environmental Alliance, 2004)
Environmental Alliance, Inc. (Environmental Alliance) conducted a Remedial Investigation (RI) at the property in 2004. The RI was conducted through the Voluntary Cleanup Program under DNREC-SIRB oversight. Soil and groundwater testing was performed in 33 locations to determine impacts, if any, from previous industrial uses.
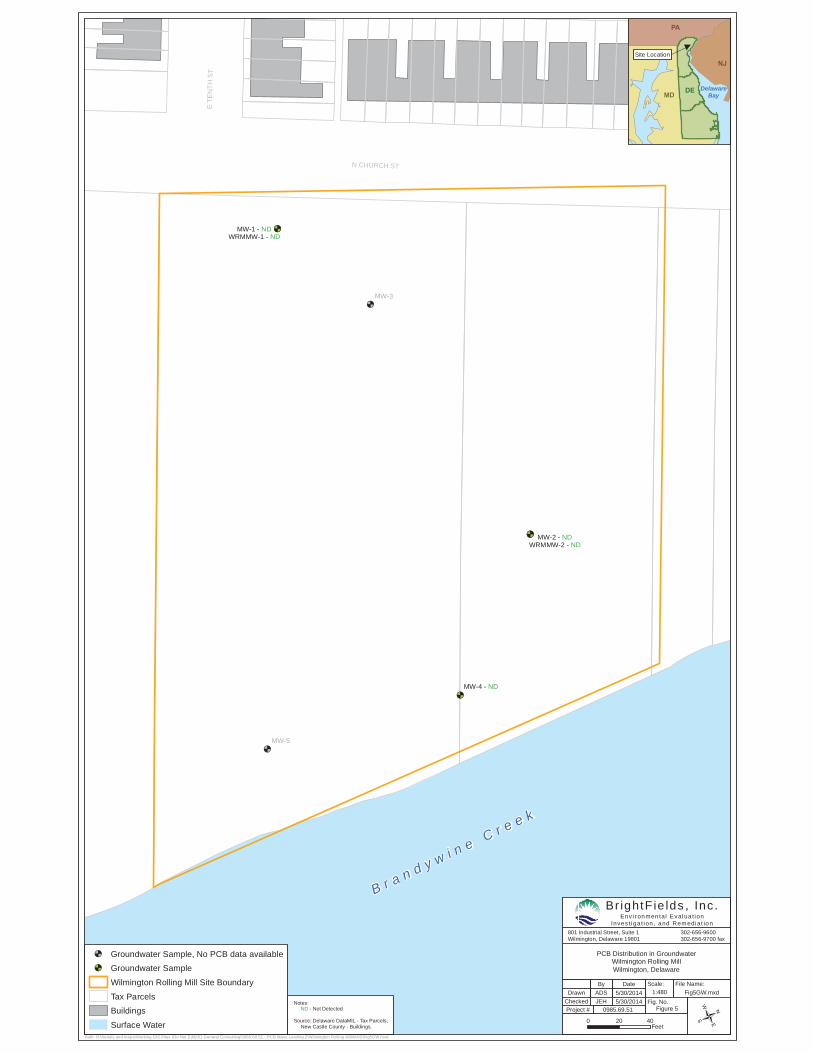
A total of 50 soil and sediment samples were collected. All soil samples were screened then selected samples were submitted for confirmatory analyses. PCBs were not detected in any of the surface or subsurface soil samples during screening. Two samples were submitted for further analysis and PCBs were detected in surface soil sample S-17 (0-2 feet below ground surface) below URS unrestricted values for surface soils. Three sediment samples were submitted as well but none of the concentrations exceeded the URS for Protection of the Environment value. Five groundwater samples were collected from monitoring wells, two from existing wells and three from temporary monitoring wells installed by Environmental Alliance for the RI. Total and dissolved PCBs analysis was performed on samples from the wells. PCBs were not detected above the URS guidance values in any groundwater sample.
Overall, the RI determined that PCBs were not a contaminant of concern at the Wilmington Rolling Mill site and additional PCB evaluation was not recommended.
Current Regulatory Status:
Brownscapes, LLC had plans to purchase the site and commissioned Environmental Alliance to perform the RI in October 2003. Review of information obtained from the DNREC Environmental Navigator indicates that a Brownfields Remedial Action Plan was proposed for the site in 2011.There are no additional records of progress since then.
File: 0985.69.51 Page 3 of 11 June 2014

PCB Mass Loading Phase IIWilmington Rolling Mill PropertySIRS ID: DE-1198Wilmington, Delaware
SUMMARY OF SITE PCB INFORMATIONSite Investigation PCB Findings:
PCBs were detected in two surface soil samples, S-17 (0 to 2 feet below ground surface (bgs)) and WRMSS-2 (0 to 2 feet bgs), at concentrations of 0.16 mg/kg and 1.1 mg/kg, respectively.Additional detections in screened surface soil samples include six samples with PCBs present at a concentration <0.5 mg/kg and one samples with unconfirmed PCBs. In the unsaturated subsurface soil, PCBs were present based on screening analysis at a concentration less than 0.5 mg/kg for one sample, WRMTP-3 (8 feet bgs). In the saturated subsurface soil, PCBs were present based on screening analysis at a concentration less than 0.5 mg/kg in two samples, WRMTP-10 (6 feet bgs) and WRMTP-12 (12 to 12.5 feet bgs).
Due to the fact that there were only two detections in the surface soil, the maximum detected value (1.1 mg/kg) was used in the overland flow calculations instead of calculating the 95% upper confidence limit (UCL) of the mean of the concentration of total PCBs observed in the surface soil. There were no PCBs detected in groundwater.
Concentrations of PCBs on Site
Sample Matrix CorrespondingFigure
Analytical Methods
Range of Total PCBs
Surface Soil Figure 2 Method 8082 and Screening Data
Not detected to 1.1 mg/kg
Subsurface Soil (unsaturated) Figure 3 Screening Data Not detected to <0.5 mg/kg
Subsurface Soil (saturated) Figure 4 Screening Data Not detected to <0.5 mg/kg
Groundwater Figure 5 Method 8082 Not DetectedA summary of all samples collected for PCB analyses are presented in Tables 1 through 3.
Acreage where PCBs detected:
The estimated surface soil area impacted by PCBs is 0.52 acres (Figure 2). In the subsurface unsaturated soil, 0.28 acres are impacted by PCBs (Figure 3). The estimated subsurface saturated soil area impacted by PCBs is 0.90 acres (Figure 4). Based on the data available and reviewed by BrightFields, the groundwater is not impacted by PCBs.
File: 0985.69.51 Page 4 of 11 June 2014

PCB Mass Loading Phase IIWilmington Rolling Mill PropertySIRS ID: DE-1198Wilmington, Delaware
PCB Remediation Status:
A Brownfields Remedial Action Plan has been proposed for the site but there is no record of remediation to date.
File: 0985.69.51 Page 5 of 11 June 2014

PCB Mass Loading Phase IIWilmington Rolling Mill PropertySIRS ID: DE-1198Wilmington, Delaware
PCB MASS LOADING SUMMARYThe PCB mass loading rate to surface water via overland flow and groundwater transport was estimated for the Wilmington Rolling Mill Property. A summary of the results is included below and the details of the calculations are included as attachments to this Appendix.
Overland Flow:
Overland flow has been determined on this site by using the Revised Universal Soil Loss Equation (RUSLE). The RUSLE predicts the long term average annual rate of erosion on an area based on rainfall patterns, soil type, topography, cover/canopy factors and support management practices. These specific factors are site specific and rely on local information of the site. A breakdown of the individual factors is presented below with a brief explanation of their choice.
Ground Cover and Canopy:
The surface cover and flow paths were assessed through aerial photography and available contour mapping (Delaware Data Mil, 2007). The cover/management factor (C) assigned to the erodible area and associated flow paths was 0.17, which corresponds to areas instituting a vegetative cover primarily consisting of tall weeds with approximately 25% coverage and ground cover of grass or grass-like vegetation over 20% of the area.
Site Sediment and Erosion Control Practices:
Based on the aerial photography evaluation and review of site documents it does not appear that any sediment and erosion control practices are being implemented on Site.
Input Factors and Results:
A breakdown of the individual factors is presented below with a brief explanation of their choice.
File: 0985.69.51 Page 6 of 11 June 2014

PCB Mass Loading Phase IIWilmington Rolling Mill PropertySIRS ID: DE-1198Wilmington, Delaware
Wilmington Rolling Mill Property
RUSLE Factors Values Provided Explanation of choice
R = rainfall-runoff erosivity index (102 ft-tonf-in/ac-hr-yr) 175
An appropriate value for R for the Site was determined using the Isoerodent Map of the Eastern U.S. from the Stormwater Phase II Final Rule Construction Rainfall Erosivity
Waiver (USEPA, 2012).
K = soil erodibility (0.01 ton-ac-hr/ac-ft-tonf-in) 0.35
The soil erodibility factors were selected from the National Resource Conservation
Soil Survey Geographic Database (SSURGO) and a raster was created using
the values 0.12, 0.42, and 0.25, with a weighted average of 0.35.
ls = topographic factor (dimensionless) 0.32
The topographic factor was derived based on the slope and flow accumulation grids
created in ArcGIS. An output LS grid was created and the average value for the grid is
provided.
C = cover/management factor (dimensionless) 0.17
The cover/management factor C assigned to the erodible area was 0.17, which
corresponds to areas instituting a vegetative cover primarily consisting of tall weeds with
approximately 25% coverage and ground cover of grass or grass-like vegetation over
20% of the area.
P = support practice factor (dimensionless) 1
No documentation was provided indicating that any sediment and erosion controls are in
place.
A = average annual soil loss estimate(ton/ac-yr) 5.0
The average soil loss estimate was generated by ArcGIS using the input factors listed
above.
Erodible Area (acres) 0.15The erodible area was calculated based on
the pervious surfaces within the area of concern polygon for surface soil (Figure 6).
For factors that were not consistent across the site, rasters were used to characterize the variations. Due to the methodology utilized to derive the soil loss estimate, the numbers listed above cannot simply be multiplied.
The total estimated PCB loading via overland flow for the Wilmington Rolling Mill Property is 0.74 grams per year. Please see attached table for specific variables.
File: 0985.69.51 Page 7 of 11 June 2014

PCB Mass Loading Phase IIWilmington Rolling Mill PropertySIRS ID: DE-1198Wilmington, Delaware
Uncertainty Analysis Associated with Overland Flow:
Specific Areas and Degree of Uncertainty for the Wilmington Rolling Mill Property
* Primary analysis used in the historical samples
Sources of uncertainty for the Wilmington Rolling Mill Property include: The majority of the data utilized for the overland flow analysis was Immunoassay screening data, with a few samples that had Aroclor lab data. There was limited access to the site for a site assessment, however the site is small which allowed for an adequate assessment of site coverage. The sample locations were taken from well scaled maps. Based on this evaluation the level of uncertainty associated with overland flow PCB mass loading from the Wilmington Rolling Mill Property is Moderate.
Groundwater Discharge Analysis:
Groundwater discharge is based on the hydraulic conductivity of the soil, the groundwater gradient, and the cross-sectional area of the aquifer. A breakdown of the individual factors used in the Darcy equation is presented below. A groundwater discharge map is included as Figure 7.
Because PCBs were detected in saturated soil, but not in groundwater, the calculated concentration of PCBs in pore water, based on partitioning, was used to calculate the mass loading.
The calculations are presented in Table B in the groundwater transport calculations attachment.
Samples Per Acre
(site)
Chemical Data
Quality*
Soil Type
Site Coverage
Map Quality
Average Distance to Discharge
PointSite Specific Information 18.7 Screening
DataSoil
Database
Based on a limited site assessment
Well Scaled Maps
Approximately 23 feet
Degree of Uncertainty Low High Low Low to
ModerateLow to
Moderate Low
File: 0985.69.51 Page 8 of 11 June 2014

PCB Mass Loading Phase IIWilmington Rolling Mill PropertySIRS ID: DE-1198Wilmington, Delaware
Input Factors:
A breakdown of the individual factors is presented below with a brief explanation of their choice.
Groundwater Transport Factors
Value Used Justification/Derivation of Value Usedmin max
K = Hydraulic Conductivity (ft/day) 0.28 5.7
Drilling logs from Geoprobe® borings were used to evaluate the lithology beneath the site.
Groundwater being monitored is within the fill zone. The fill unit ranges in composition from clayey sand and clayey gravel to fine-to coarse-
grained sand. The hydraulic conductivity for coarse sandy silt ranges from approximately 1 x10⁻⁴ to 2 x 10⁻³ cm/sec (Cernica, 1995). This
converts to 0.28 to 5.7 ft/day.I = Horizontal
Groundwater Gradient 0.031 0.031 Estimated from EA data, flowing east toward Brandywine Creek.
Saturated Thickness (ft) 7 8
Based on the borings logs from Environmental Alliance, groundwater appears to have been
generally encountered at between 7 to 8 feet bgs. A clay unit was encountered at 14 feet bgs.
Lateral Discharge Distance (ft) 202 244
The lateral discharge distance was estimated to be equal to the length of the PCB-impacted soil measured perpendicular to groundwater flow.
A= Cross-Sectional Area (ft2) 1,410 1,950 Calculated from the saturated thickness and lateral
discharge distance.
Groundwater PCB Concentration (μg/L) 0.055 0.27
One half of the “present but < 0.5 mg/kg” designation concentration estimated in the saturated
subsurface soil (0.250 mg/kg) was used to determine the estimated concentration in
groundwater.
Distance to Discharge point (ft) Directly adjacent
Approximate distance from property boundary to closest surface water location. Brandywine Creek
is adjacent.
Mass Loading Via Groundwater Transport Result:
The groundwater discharge is 347 to 9,800 L/day (see attached Table A). The maximum detected PCB concentration (0.25 mg/kg) was used to calculate the groundwater concentrations for the loading estimate (Table B). The estimated minimum and maximum contaminant mass loading contributions shown in Table C assume that there are no contaminant losses due to degradation, dispersion, sorption, volatilization, etc.
File: 0985.69.51 Page 9 of 11 June 2014

PCB Mass Loading Phase IIWilmington Rolling Mill PropertySIRS ID: DE-1198Wilmington, Delaware
The total PCB loading via groundwater discharge is estimated to be between 0.03 and 1 gram per year (Table C).
Uncertainty Analysis Associated with Groundwater Transport:
Specific Areas and Degree of Uncertainty for the Wilmington Rolling Mill Property
Groundwater PCB
Concentration
Sampling Density
Hydraulic Conductivity
Horizontal Groundwater
Gradient
Saturated Thickness
Lateral Discharge Distance
Distance to
Discharge Point
Site Specific Information
Partitioning based on
maximum concentration observed in
saturated soil
1.8; Possible data gaps
Based on detailed site
logs
Multiple points with numerous groundwater
measurements
Good quality logs
Good groundwater
gradient defined and a moderate
number of samples
collected onsite
Directly Adjacent
Degree of Uncertainty High Moderate Moderate Low to
Moderate Moderate Moderate Low
Based on this evaluation the level of uncertainty associated with groundwater transport PCB mass loading from the Wilmington Rolling Mill Property is Moderate.
File: 0985.69.51 Page 10 of 11 June 2014

PCB Mass Loading Phase IIWilmington Rolling Mill PropertySIRS ID: DE-1198Wilmington, Delaware
Site References:
Delaware Department of Natural Resources and Environmental Control (DNREC), 2000,Brownfield Preliminary Assessment II, Wilmington Iron Plate Rolling Mill, September 2000.
DNREC, 2008, Revised Plan of Remedial Action, March 2008.
Delaware Geological Survey, 2013, Delaware Data Mil,<http://datamil.delaware.gov/geonetwork/srv/en/main.home>, May 2013.
Environmental Alliance, Inc., 2004, Remedial Investigation Report, 1000-1020 Church Street,February 2004.
File: 0985.69.51 Page 11 of 11 June 2014

PCB Mass Loading Phase IIWilmington Rolling Mill PropertySIRS ID: DE-1198Wilmington, Delaware
Figures

!(
!(
!(
!(
!(
!(
!(
!(
&<
!(
!(
!(
!(
!(
!(
!(
!(
&<
!(
&<
!(
!(
!(
!(
&<!(
!(
!(!(
!(
#*#*
!(
!(
!(
!(
#*
!(
!(
!(
!(
!(
!(
&<
!(
#*
!(
!(
!(
!(
!(
!(
!(
!(
#*
&<
!(
!(
!(
&<!(
!(
!(
!(
!(
#*
!(!(
!(
B r a n d y w i n e C r e e k
S-6
S-5
S-4
S-1
S-3
S-2
S-9
S-7
SED1
S-23
S-16
S-15
S-22
S-13
S-14
S-25
MW-3
MW-1WRMMW-1
SED2
MW-4
S-10
SED3S-18S-21
S-17
MW-5
S-19
S-20
S-24
S-11
S-12
SED-4
SED-5SED-6
WRMSS-1WRMSS-3
WRMSS-2
WRMMW-2WRMTP-8
WRMTP-3
WRMTP-7
WRMTP-4
WRMTP-2
WRMSS-4
WRMSS-6
WRMSS-5
WRMSS-8
WRMSS-7
WRMTP-6
WRMTP-5
WRMTP-1
WRMTP-10
WRMTP-13WRMTP-11
WRMTP-12
N CHURCH ST
ETE
NTH
ST
Path: N:\Aerials and maps\Working GIS Files (Do Not Edit)\51 General Consulting\0985.69.51 - PCB Mass Loading 2\Wilmington Rolling Mill\MXD\Fig1SiteLoc.mxd
Br ightF ie lds , Inc .Env i ronmen tal Evalua t ion
Inves t iga t ion , and Remediat ion801 Industrial Street, Suite 1Wilmington, Delaware 19801
302-656-9600302-656-9700 fax
Historic Sample Locationsand Aerial Photograph (2012)
Wilmington Rolling MillWilmington, Delaware
ByDrawn
Checked
Date
Project #
Scale: File Name:
Fig. No.ADSJPR
0985.69.51 Figure 1
0 20 40Feet
Fig1SiteLoc.mxd
DelawareBayMD
DE
NJSite Location
PA
/
5/30/20145/30/2014
1:480
Source: Delaware DataMIL - Aerial 2012, Tax Parcels.
!( Soil Sample
&< Groundwater Sample#* Sediment Sample
Wilmington Rolling Mill Site Boundary (2.83 ac)

!(
!(
!(
!(
!(
!(
!(
!(
!(
!(
!(
!(
!(
!(
!(
!(
!(
!(
!(
!(
!(
!(!(
!(
!(
!(
!(
!(
!(
!(
!(
!(
!(!(
!(
!(
!(
!(
!(
!(
!(
!(!(
!(
B r a n d y w i n e C r e e k
WRMTP-1
WRMTP-11
S-10 - ND (0.0'-2.0')
S-7 - (ND)
S-1 - (ND)S-5 - (ND)
S-4 - (ND)
S-3 - (ND)
S-6 - (ND)
S-9 - (ND)
S-21 - (ND) S-18 - (ND)
S-19 - (ND)
S-20 - (ND)
S-24 - (ND)
S-11 - (ND)
S-12 - (ND)
S-2 - (ND)
S-25 - (ND)
S-23 - (ND)
S-16 - (ND)
S-15 - (ND)
S-14 - (ND)
S-13 - (ND)
S-22 - (ND)
S-17 - 0.16 (0.0'-2.0')
WRMSS-6 - (ND)
WRMTP-5 - (ND)
WRMTP-3 - (ND)
WRMSS-1 - (ND)
WRMSS-2 - 1.1 (0.0'-2.0')
WRMTP-7 - (ND)
WRMTP-4 - (ND)
WRMTP-6 - (ND)
WRMSS-4 - (ND)
WRMSS-5 - (ND)
WRMTP-10 - (ND)
WRMSS-7 - (PCBs Present (<0.5 ppm))
WRMSS-8 - (PCBs Present (<0.5 ppm))
WRMTP-2 - (PCBs Present (<0.5 ppm))
WRMSS-3 - (PCBs Present (<0.5 ppm))
WRMTP-8 - (PCBs Present (<0.5 ppm))
WRMTP-12 - (PCBs Present (<0.5 ppm))
WRMTP-13 - (PCBs Present (<0.5 ppm))
N CHURCH ST
E TE
NTH
ST
Path: N:\Aerials and maps\Working GIS Files (Do Not Edit)\51 General Consulting\0985.69.51 - PCB Mass Loading 2\Wilmington Rolling Mill\MXD\Fig2DistSurf.mxd
Br igh tF ie lds , Inc .Environmenta l Eva luat ion
Invest igat ion, and Remedia t ion801 Industrial Street, Suite 1Wilmington, Delaware 19801
302-656-9600302-656-9700 fax
PCB Distribution in Surface Soil (0' - 2' bgs)Wilmington Rolling MillWilmington, Delaware
ByDrawn
Checked
Date
Project #
Scale: File Name:
Fig. No.ADSJPR
0985.69.51 Figure 2
0 20 40Feet
Fig2DistSurf.mxd
DelawareBayMD DE
NJSite Location
PA
/
7/8/20137/8/2013
1:480Notes: 0.58 (0') - Total PCB Concentration (mg/kg) and Sample Depth. ND - Not Detected Screening data is in parentheses and italicized.
Source: Delaware DataMIL - Tax Parcels; New Castle County - Buildings.
!( Soil Sample, No PCB data available
!( Soil SampleEstimated PCB DistributionWilmington Rolling Mill Site BoundaryTax ParcelsBuildingsSurface Water

!(
!(
!(
!(
!(
!(
!(
B r a n d y w i n e C r e e k
N CHURCH ST
E T
EN
TH S
T
WRMTP-1
WRMTP-4 - (ND)
WRMTP-6 - (ND)
WRMTP-5 - (ND)
WRMTP-2 - (ND)
WRMTP-11 - (ND)
WRMTP-3 - (PCBs Present (<0.5 ppm))
Path: N:\Aerials and maps\Working GIS Files (Do Not Edit)\51 General Consulting\0985.69.51 - PCB Mass Loading 2\Wilmington Rolling Mill\MXD\Fig3SS_UnSat.mxd
Br igh tF ie lds , Inc .Environmenta l Eva luat ion
Invest igat ion, and Remedia t ion801 Industrial Street, Suite 1Wilmington, Delaware 19801
302-656-9600302-656-9700 fax
PCB Distribution in Subsurface Unsaturated SoilWilmington Rolling MillWilmington, Delaware
ByDrawn
Checked
Date
Project #
Scale: File Name:
Fig. No.ADSJPR
0985.69.51 Figure 3
0 20 40Feet
Fig3SS_UnSat.mxd
DelawareBayMD DE
NJSite Location
PA
/
12/17/201312/17/2013
1:480Notes: Screening data (mg/kg) is in parentheses and italicized. ND - Not Detected
Source: Delaware DataMIL - Tax Parcels; New Castle County - Buildings.
!( Soil Sample, No PCB data available
!( Soil SampleEstimated PCB DistributionWilmington Rolling Mill Site BoundaryTax ParcelsBuildingsSurface Water

!(
!(
!(
!(
!(
B r a n d y w i n e C r e e k
N CHURCH ST
E TE
NTH
ST
WRMTP-8 - (ND)
WRMTP-7 - (ND)
WRMTP-13 - (ND)
WRMTP-12 - PCBs Present (not confirmed)
WRMTP-10 - (PCBs Present (<0.5 ppm))
Path: N:\Aerials and maps\Working GIS Files (Do Not Edit)\51 General Consulting\0985.69.51 - PCB Mass Loading 2\Wilmington Rolling Mill\MXD\Fig4SS_Sat.mxd
Br igh tF ie lds , Inc .Environmenta l Eva luat ion
Invest igat ion, and Remedia t ion801 Industrial Street, Suite 1Wilmington, Delaware 19801
302-656-9600302-656-9700 fax
PCB Distribution in Subsurface Saturated SoilWilmington Rolling MillWilmington, Delaware
ByDrawn
Checked
Date
Project #
Scale: File Name:
Fig. No.ADSJPR
0985.69.51 Figure 4
0 20 40Feet
Fig4SS_Sat.mxd
DelawareBayMD DE
NJSite Location
PA
/
12/17/201312/17/2013
1:480Notes: Screening data (mg/kg) is in parentheses and italicized. ND - Not Detected
Source: Delaware DataMIL - Tax Parcels; New Castle County - Buildings.
!( Soil SampleEstimated PCB DistributionWilmington Rolling Mill Site BoundaryTax ParcelsBuildingsSurface Water
&<
&<
&<
&<
&<&<
&<
B r a n d y w i n e C r e e k
MW-5
MW-3
MW-4 - ND
MW-2 - NDWRMMW-2 - ND
MW-1 - NDWRMMW-1 - ND
N CHURCH ST
ETE
NTH
ST
Notes: ND - Not Detected
Source: Delaware DataMIL - Tax Parcels; New Castle County - Buildings.
Path: N:\Aerials and maps\Working GIS Files (Do Not Edit)\51 General Consulting\0985.69.51 - PCB Mass Loading 2\Wilmington Rolling Mill\MXD\Fig5GW.mxd
Br ightF ie lds , Inc .Env i ronmen tal Evalua t ion
Inves t iga t ion , and Remediat ion801 Industrial Street, Suite 1Wilmington, Delaware 19801
302-656-9600302-656-9700 fax
PCB Distribution in GroundwaterWilmington Rolling MillWilmington, Delaware
ByDrawn
Checked
Date
Project #
Scale: File Name:
Fig. No.ADSJEH
0985.69.51 Figure 5
0 20 40Feet
Fig5GW.mxd
DelawareBayMD
DE
NJSite Location
PA
/
5/30/20145/30/2014
1:480
&< Groundwater Sample, No PCB data available
&< Groundwater Sample
Wilmington Rolling Mill Site Boundary
Tax ParcelsBuildings
Surface Water

B r a n d y w i n e C r e e k
OverlandFlow
Distance=
45ft
OverlandFlow
Distance=
0ft
N CHURCH ST
ETE
NTH
ST
Path: N:\Aerials and maps\Working GIS Files (Do Not Edit)\51 General Consulting\0985.69.51 - PCB Mass Loading 2\Wilmington Rolling Mill\MXD\Fig6SoilLoss.mxd
Br ightF ie lds , Inc .Env i ronmen tal Evalua t ion
Inves t iga t ion , and Remediat ion801 Industrial Street, Suite 1Wilmington, Delaware 19801
302-656-9600302-656-9700 fax
Soil Loss EstimatesWilmington Rolling MillWilmington, Delaware
ByDrawn
Checked
Date
Project #
Scale: File Name:
Fig. No.ADSKEP
0985.69.51 Figure 6
0 20 40Feet
Fig6SoilLoss.mxd
DelawareBayMD
DE
NJSite Location
PA
/
6/18/20146/18/2014
1:480
Source: Delaware DataMIL - Aerial 2012, Tax Parcels.
Overland FlowWilmington Rolling Mill Site Boundary
Tax ParcelsTons/Year/Acre of Soil Loss Estimated
High : 60.65
Low : 0

!(
!(
!(
!(
!(
B r a n d y w i n e C r e e k166'
92'
110'
78'
N CHURCH ST
E T
EN
TH S
T
WRMTP-8 - (ND)
WRMTP-7 - (ND)
WRMTP-13 - (ND)
WRMTP-12 - PCBs Present (not confirmed)
WRMTP-10 - (PCBs Present (<0.5 ppm))
Path: N:\Aerials and maps\Working GIS Files (Do Not Edit)\51 General Consulting\0985.69.51 - PCB Mass Loading 2\Wilmington Rolling Mill\MXD\Fig7Discharge.mxd
Br igh tF ie lds , Inc .Environmenta l Eva luat ion
Invest igat ion, and Remedia t ion801 Industrial Street, Suite 1Wilmington, Delaware 19801
302-656-9600302-656-9700 fax
Groundwater Discharge MapWilmington Rolling MillWilmington, Delaware
ByDrawn
Checked
Date
Project #
Scale: File Name:
Fig. No.ADSJPR
0985.69.51 Figure 7
0 20 40Feet
Fig7Discharge.mxd
DelawareBayMD DE
NJSite Location
PA
/
12/17/201312/17/2013
1:480Notes: Screening data (mg/kg) is in parentheses and italicized. ND - Not Detected
Source: Delaware DataMIL - Tax Parcels; New Castle County - Buildings.
!( Soil SampleGroundwater Discharge Distance (feet)Groundwater Discharge LimitGroundwater Flow DirectionEstimated PCB DistributionWilmington Rolling Mill Site BoundaryTax ParcelsBuildingsSurface Water

PCB Mass Loading Phase IIWilmington Rolling Mill PropertySIRS ID: DE-1198Wilmington, Delaware
Tables

Tabl
e 1
PCB
Scr
eeni
ng R
esul
ts F
or S
oil
Wilm
ingt
on R
ollin
g M
ill P
rope
rty
(DE-
1198
)W
ilmin
gton
, DE
Brig
htFi
elds
Pro
ject
#: 0
985.
69.5
1P
age
1 of
2Ju
ne 2
014
Tota
l PC
Bs
DN
REC
-SIR
S Sc
reen
ing
Leve
l (J
anua
ry 2
014)
(mg/
kg)
NC
AS
-10.
0'-2
.0'
Env
ironm
enta
l Allia
nce,
Inc.
Rem
edia
l Inv
esti g
atio
n R
epor
tFe
b-04
ND
S-2
0.
0'-2
.0'
Env
ironm
enta
l Allia
nce,
Inc.
Rem
edia
l Inv
esti g
atio
n R
epor
tFe
b-04
ND
S-3
0.0'
-2.0
'E
nviro
nmen
tal A
llianc
e, In
c.R
emed
ial I
nves
ti gat
ion
Rep
ort
Feb-
04N
DS
-40.
0'-2
.0'
Env
ironm
enta
l Allia
nce,
Inc.
Rem
edia
l Inv
esti g
atio
n R
epor
tFe
b-04
ND
S-5
0.0'
-2.0
'E
nviro
nmen
tal A
llianc
e, In
c.R
emed
ial I
nves
ti gat
ion
Rep
ort
Feb-
04N
DS
-60.
0'-2
.0'
Env
ironm
enta
l Allia
nce,
Inc.
Rem
edia
l Inv
esti g
atio
n R
epor
tFe
b-04
ND
S-7
0.0'
-2.0
'E
nviro
nmen
tal A
llianc
e, In
c.R
emed
ial I
nves
ti gat
ion
Rep
ort
Feb-
04N
DS
-90.
0'-2
.0'
Env
ironm
enta
l Allia
nce,
Inc.
Rem
edia
l Inv
esti g
atio
n R
epor
tFe
b-04
ND
S-1
00.
0'-2
.0'
Env
ironm
enta
l Allia
nce,
Inc.
Rem
edia
l Inv
esti g
atio
n R
epor
tFe
b-04
ND
S-1
10.
0'-2
.0'
Env
ironm
enta
l Allia
nce,
Inc.
Rem
edia
l Inv
esti g
atio
n R
epor
tFe
b-04
ND
S-1
20.
0'-2
.0'
Env
ironm
enta
l Allia
nce,
Inc.
Rem
edia
l Inv
esti g
atio
n R
epor
tFe
b-04
ND
S-1
30.
0'-2
.0'
Env
ironm
enta
l Allia
nce,
Inc.
Rem
edia
l Inv
esti g
atio
n R
epor
tFe
b-04
ND
S-1
40.
0'-2
.0'
Env
ironm
enta
l Allia
nce,
Inc.
Rem
edia
l Inv
esti g
atio
n R
epor
tFe
b-04
ND
S-1
50.
0'-2
.0'
Env
ironm
enta
l Allia
nce,
Inc.
Rem
edia
l Inv
esti g
atio
n R
epor
tFe
b-04
ND
S-1
60.
0'-2
.0'
Env
ironm
enta
l Allia
nce,
Inc.
Rem
edia
l Inv
esti g
atio
n R
epor
tFe
b-04
ND
S-1
70.
0'-2
.0'
Env
ironm
enta
l Allia
nce,
Inc.
Rem
edia
l Inv
esti g
atio
n R
epor
tFe
b-04
ND
S-1
80.
0'-2
.0'
Env
ironm
enta
l Allia
nce,
Inc.
Rem
edia
l Inv
esti g
atio
n R
epor
tFe
b-04
ND
S-1
90.
0'-2
.0'
Env
ironm
enta
l Allia
nce,
Inc.
Rem
edia
l Inv
esti g
atio
n R
epor
tFe
b-04
ND
S-2
00.
0'-2
.0'
Env
ironm
enta
l Allia
nce,
Inc.
Rem
edia
l Inv
esti g
atio
n R
epor
tFe
b-04
ND
S-2
10.
0'-2
.0'
Env
ironm
enta
l Allia
nce,
Inc.
Rem
edia
l Inv
esti g
atio
n R
epor
tFe
b-04
ND
S-2
20.
0'-2
.0'
Env
ironm
enta
l Allia
nce,
Inc.
Rem
edia
l Inv
esti g
atio
n R
epor
tFe
b-04
ND
S-2
30.
0'-2
.0'
Env
ironm
enta
l Allia
nce,
Inc.
Rem
edia
l Inv
esti g
atio
n R
epor
tFe
b-04
ND
S-2
40.
0'-2
.0'
Env
ironm
enta
l Allia
nce,
Inc.
Rem
edia
l Inv
esti g
atio
n R
epor
tFe
b-04
ND
S-2
50.
0'-2
.0'
Env
ironm
enta
l Allia
nce,
Inc.
Rem
edia
l Inv
esti g
atio
n R
epor
tFe
b-04
ND
WR
MS
S-1
0.0'
-2.0
'D
NR
ECBr
ownf
ield
Pre
limin
ary
Ass
essm
ent I
IS
ep-0
0N
DW
RM
SS
-20.
0'-2
.0'
DN
REC
Brow
nfie
ld P
relim
inar
y A
sses
smen
t II
Sep
-00
PC
Bs
Pre
sent
(<0.
5 pp
m)
WR
MS
S-3
0.0'
-2.0
'D
NR
ECBr
ownf
ield
Pre
limin
ary
Ass
essm
ent I
IS
ep-0
0P
CB
s P
rese
nt (<
0.5
ppm
)W
RM
SS
-40.
0'-2
.0'
DN
REC
Brow
nfie
ld P
relim
inar
y A
sses
smen
t II
Sep
-00
ND
WR
MS
S-5
0.0'
-2.0
'D
NR
ECBr
ownf
ield
Pre
limin
ary
Ass
essm
ent I
IS
ep-0
0N
DW
RM
SS
-60.
0'-2
.0'
DN
REC
Brow
nfie
ld P
relim
inar
y A
sses
smen
t II
Sep
-00
ND
WR
MS
S-7
0.0'
-2.0
'D
NR
ECBr
ownf
ield
Pre
limin
ary
Ass
essm
ent I
IS
ep-0
0P
CB
s P
rese
nt (<
0.5
ppm
)W
RM
SS
-80.
0'-2
.0'
DN
REC
Brow
nfie
ld P
relim
inar
y A
sses
smen
t II
Sep
-00
PC
Bs
Pre
sent
(<0.
5 pp
m)
WR
MTP
-21.
0'-1
.5'
DN
REC
Brow
nfie
ld P
relim
inar
y A
sses
smen
t II
Sep
-00
PC
Bs
Pre
sent
(<0.
5 pp
m)
WR
MTP
-212
.5'-1
3.0'
DN
RE
CB
row
nfie
ld P
relim
inar
y A
sses
smen
t II
Sep
-00
ND
WR
MTP
-30.
5'-1
.0'
DN
REC
Brow
nfie
ld P
relim
inar
y A
sses
smen
t II
Sep
-00
ND
WR
MTP
-38.
0'D
NR
ECBr
ownf
ield
Pre
limin
ary
Ass
essm
ent I
IS
ep-0
0P
CB
s P
rese
nt (<
0.5
ppm
)W
RM
TP-4
1.5'
DN
REC
Brow
nfie
ld P
relim
inar
y A
sses
smen
t II
Sep
-00
ND
WR
MTP
-49.
0'D
NR
ECBr
ownf
ield
Pre
limin
ary
Ass
essm
ent I
IS
ep-0
0N
DW
RM
TP-5
0.5'
-1.0
'D
NR
ECBr
ownf
ield
Pre
limin
ary
Ass
essm
ent I
IS
ep-0
0N
DW
RM
TP-5
10.0
'D
NR
ECBr
ownf
ield
Pre
limin
ary
Ass
essm
ent I
IS
ep-0
0N
DW
RM
TP-6
1.0'
-1.5
'D
NR
ECBr
ownf
ield
Pre
limin
ary
Ass
essm
ent I
IS
ep-0
0N
DW
RM
TP-6
12.0
'D
NR
ECBr
ownf
ield
Pre
limin
ary
Ass
essm
ent I
IS
ep-0
0N
D
Rep
ort
Dat
e Sa
mpl
e Id
entif
icat
ion
Sam
ple
Dep
th
(feet
bgs
)Sa
mpl
ing
Com
pany
Rep
ort N
ame

Tabl
e 1
PCB
Scr
eeni
ng R
esul
ts F
or S
oil
Wilm
ingt
on R
ollin
g M
ill P
rope
rty
(DE-
1198
)W
ilmin
gton
, DE
Brig
htFi
elds
Pro
ject
#: 0
985.
69.5
1P
age
2 of
2Ju
ne 2
014
Tota
l PC
Bs
DN
REC
-SIR
S Sc
reen
ing
Leve
l (J
anua
ry 2
014)
(mg/
kg)
NC
A
Rep
ort
Dat
e Sa
mpl
e Id
entif
icat
ion
Sam
ple
Dep
th
(feet
bgs
)Sa
mpl
ing
Com
pany
Rep
ort N
ame
WR
MTP
-71.
0'-1
.5'
DN
REC
Brow
nfie
ld P
relim
inar
y A
sses
smen
t II
Sep
-00
ND
WR
MTP
-78.
0'D
NR
ECBr
ownf
ield
Pre
limin
ary
Ass
essm
ent I
IS
ep-0
0N
DW
RM
TP-8
1.0'
-1.5
'D
NR
ECBr
ownf
ield
Pre
limin
ary
Ass
essm
ent I
IS
ep-0
0P
CB
s P
rese
nt (<
0.5
ppm
)W
RM
TP-8
9.0'
DN
REC
Brow
nfie
ld P
relim
inar
y A
sses
smen
t II
Sep
-00
ND
WR
MTP
-10
1.0'
-2.0
'D
NR
ECBr
ownf
ield
Pre
limin
ary
Ass
essm
ent I
IS
ep-0
0N
DW
RM
TP-1
06.
0'D
NR
ECBr
ownf
ield
Pre
limin
ary
Ass
essm
ent I
IS
ep-0
0P
CB
s P
rese
nt (<
0.5
ppm
)W
RM
TP-1
19.
0'-1
0.0'
DN
REC
Brow
nfie
ld P
relim
inar
y A
sses
smen
t II
Sep
-00
ND
WR
MTP
-12
1.0'
-1.5
'D
NR
ECBr
ownf
ield
Pre
limin
ary
Ass
essm
ent I
IS
ep-0
0P
CB
s P
rese
nt (<
0.5
ppm
)W
RM
TP-1
212
.0'-1
2.5'
DN
REC
Bro
wnf
ield
Pre
limin
ary
Ass
essm
ent I
IS
ep-0
0P
CB
s P
rese
ntW
RM
TP-1
31.
5'D
NR
ECBr
ownf
ield
Pre
limin
ary
Ass
essm
ent I
IS
ep-0
0P
CB
s P
rese
nt (<
0.5
ppm
)W
RM
TP-1
37.
5'D
NR
ECBr
ownf
ield
Pre
limin
ary
Ass
essm
ent I
IS
ep-0
0N
D
Qua
lifie
rs:
bgs
- Bel
ow g
roun
d su
rface
ND
- N
ot d
etec
ted
NC
A -
No
crite
ria a
vaila
ble
Not
e: A
ll re
sults
repo
rted
in m
g/kg
.

Tabl
e 2
PCB
Ana
lytic
al R
esul
ts F
or S
oil
Wilm
ingt
on R
ollin
g M
ill P
rope
rty
(DE-
1198
)W
ilmin
gton
, DE
Brig
htFi
elds
Pro
ject
#: 0
985.
69.5
1P
age
1 of
1Ju
ne 2
014
Tota
l PC
Bs
DN
REC
-SIR
S Sc
reen
ing
Leve
l (J
anua
ry 2
014)
(m
g/kg
)
NC
AS
-10
0.0'
-2.0
'E
nviro
nmen
tal A
llian
ce, I
nc.
Rem
edia
l Inv
estig
atio
n R
epor
tFe
b-04
NA
NA
NA
NA
NA
NA
NA
ND
S-1
70.
0'-2
.0'
Env
ironm
enta
l Alli
ance
, Inc
.R
emed
ial I
nves
tigat
ion
Rep
ort
Feb-
04N
AN
AN
AN
A0.
027
0.02
3J
0.11
0.16
WR
MS
S-2
0.0'
-2.0
'D
NR
EC
Bro
wnf
ield
Pre
limin
ary
Ass
essm
ent I
IS
ep-0
00.
043
U0.
088
U0.
043
U0.
043
U0.
043
U0.
043
U1.
11.
1
Qua
lifie
rs:
Bol
d an
d sh
aded
- E
xcee
ds D
NR
EC
-SIR
S J
anua
ry 2
014
Scr
eeni
ng L
evel
s
DN
REC
-SIR
S Sc
reen
ing
Leve
l (J
anua
ry 2
014)
(m
g/kg
)
J - E
stim
ated
val
ue
DN
REC
-SIR
S Sc
reen
ing
Leve
l (J
anua
ry 2
014)
(m
g/kg
)
DN
REC
-SIR
S Sc
reen
ing
Leve
l (J
anua
ry 2
014)
(m
g/kg
)
DN
REC
-SIR
S Sc
reen
ing
Leve
l (J
anua
ry 2
014)
(m
g/kg
)
U -
Sam
ple
not d
etec
ted
abov
e th
e la
bora
tory
met
hod
dete
ctio
n lim
it
Not
e: A
ll re
sults
repo
rted
in m
g/kg
.
DN
REC
-SIR
S Sc
reen
ing
Leve
l (J
anua
ry 2
014)
(m
g/kg
)
ND
- N
ot d
etec
ted
Rep
ort
Dat
e Sa
mpl
e Id
entif
icat
ion
Sam
ple
Dep
th
(feet
bgs
)Sa
mpl
ing
Com
pany
Rep
ort N
ame
bgs
- Bel
ow g
roun
d su
rface
NA
- Not
ava
ilabl
e fro
m re
ports
pro
vide
d to
Brig
htfie
lds
NC
A -
No
crite
ria a
vaila
ble
DN
REC
-SIR
S Sc
reen
ing
Leve
l (J
anua
ry 2
014)
(m
g/kg
)
0.22
Aroc
lor-
1016
Aroc
lor-
1221
Aroc
lor-
1232
0.11
0.39
0.14
0.14
0.22
0.22
Aroc
lor-
1242
Aroc
lor-
1248
Aroc
lor-
1254
Aroc
lor-
1260
DN
REC
-SIR
S Sc
reen
ing
Leve
l (J
anua
ry 2
014)
(m
g/kg
)

Tabl
e 3
PCB
Ana
lytic
al R
esul
ts F
or G
roun
dwat
er
Wilm
ingt
on R
ollin
g M
ill P
rope
rty
(DE-
1198
)W
ilmin
gton
, DE
Brig
htFi
elds
Pro
ject
#: 0
985.
69.5
1P
age
1 of
1Ju
ne 2
014
Tota
l PC
Bs
DN
REC
-SIR
S Sc
reen
ing
Leve
l (J
anua
ry 2
014)
(u
g/L)
NC
AM
W-1
14.0
'-24.
0'E
nviro
nmen
tal A
llian
ce, I
nc.
Rem
edia
l Inv
estig
atio
n R
epor
tFe
b-04
NA
NA
NA
NA
NA
NA
NA
ND
MW
-25.
5'-1
5.5'
Env
ironm
enta
l Alli
ance
, Inc
.R
emed
ial I
nves
tigat
ion
Rep
ort
Feb-
04N
AN
AN
AN
AN
AN
AN
AN
DM
W-4
NA
Env
ironm
enta
l Alli
ance
, Inc
.R
emed
ial I
nves
tigat
ion
Rep
ort
Feb-
04N
AN
AN
AN
AN
AN
AN
AN
DW
RM
MW
-114
.0'-2
4.0'
DN
RE
CB
row
nfie
ld P
relim
inar
y A
sses
smen
t II
Sep
-00
1U
2U
1U
1U
1U
1U
1U
ND
WR
MM
W-2
5.5'
-15.
5'D
NR
EC
Bro
wnf
ield
Pre
limin
ary
Ass
essm
ent I
IS
ep-0
01
U2.
1U
1U
1U
1U
1U
1U
ND
Qua
lifie
rs:
U -
Sam
ple
not d
etec
ted
abov
e th
e la
bora
tory
met
hod
dete
ctio
n lim
itN
D -
Not
det
ecte
d
* - S
cree
ning
leve
l lik
ely
belo
w th
e ro
utin
e m
etho
d de
tect
ion
limit
DN
REC
-SIR
S Sc
reen
ing
Leve
l (J
anua
ry 2
014)
(u
g/L)
DN
REC
-SIR
S Sc
reen
ing
Leve
l (J
anua
ry 2
014)
(u
g/L)
Sam
ple
Iden
tific
atio
n
Scre
en
Dep
th
(feet
bgs
)Sa
mpl
ing
Com
pany
Rep
ort N
ame
bgs
- Bel
ow g
roun
d su
rface
0.03
4*
Rep
ort
Dat
e
NA
- N
ot a
vaila
ble
from
repo
rts p
rovi
ded
to B
right
field
s
Aro
clor
-101
6A
rocl
or-1
221
0.00
4*
Aro
clor
-126
0D
NR
EC-S
IRS
Scre
enin
g Le
vel
(Jan
uary
201
4)
(ug/
L)0.
034*
0.03
1*
DN
REC
-SIR
S Sc
reen
ing
Leve
l (J
anua
ry 2
014)
(u
g/L)
DN
REC
-SIR
S Sc
reen
ing
Leve
l (J
anua
ry 2
014)
(u
g/L)
0.03
4*
Aro
clor
-123
2A
rocl
or-1
242
Aro
clor
-124
8A
rocl
or-1
254
NC
A -
No
crite
ria a
vaila
ble
DN
REC
-SIR
S Sc
reen
ing
Leve
l (J
anua
ry 2
014)
(u
g/L)
DN
REC
-SIR
S Sc
reen
ing
Leve
l (J
anua
ry 2
014)
(u
g/L)
0.11
0.00
4*
Not
e: A
ll re
sults
repo
rted
in u
g/L.

PCB Mass Loading Phase IIWilmington Rolling Mill PropertySIRS ID: DE-1198Wilmington, Delaware
Site Photographs

PCB Mass Loading Phase IIWilmington Rolling Mill PropertySIRS ID: DE-1198Wilmington, Delaware
The western corner of the site along N Church Street with tall weeds and small saplings.
The entrance to the site on the southern boundary with gravel and limited vegetation.

PCB Mass Loading Phase IIWilmington Rolling Mill PropertySIRS ID: DE-1198Wilmington, Delaware
Looking north from the southern site boundary into debris piles and areas with patchy vegetation.
PCB Mass Loading Phase IIWilmington Rolling Mill PropertySIRS ID: DE-1198Wilmington, Delaware
Overland Flow Calculations

PCB Loading Calculations from the Revised Universal Soil Loss Equation (RUSLE)Wilmington Rolling Mill Property (DE-1198)
Wilmington, DE
BrightFields File #: 0985.69.51 Page 1 of 1 June 2014
Surface PCB Concentration 1.1 mg/kg
Symbol Factor Value Units
R Rainfall/Runoff Erosivity Index 175 102 ft-tonf-in/ac-hr-yr
K Soil Erodibility 0.35 0.01 ton-ac-hr/ac-ft-tonf-in
Erodible Area 0.15 Acres
LS Topographic Factor 0.32 Dimensionless
C Cover and Management Factor 0.17 Dimensionless
P Support Practice Factor 1 Dimensionless
A Average Annual Soil Loss 5.0 ton/ac-yr
PCB Loading via Overland Flow 0.74 grams/year - PCBs

PCB Mass Loading Phase IIWilmington Rolling Mill PropertySIRS ID: DE-1198Wilmington, Delaware
Groundwater Transport Calculations

PCB Loading Calculations - Groundwater Discharge to Surface WaterWilmington Rolling Mill Property (DE-1198)
Wilmington, DE
TABLE AGroundwater Discharge Calculations
Hydraulic Conductivity (K)
(ft/day)
Horizontal Gradient
(i)(ft/ft)
Cross-sectional Area (A)
(ft2)
Groundwater Discharge*
Liters/day Gallons/day
Minimum 0.28 0.031 1,410 347 92
Maximum 5.7 0.031 1,950 9,800 2,600
* - Groundwater Discharge (Q) = KiA
TABLE BPotential Groundwater PCB Concentration Calculation
Maximum Soil PCB(μg/kg)
fOC(fraction of
organic carbon)
Pore Water PCB(μg/L)
Maximum Minimum250 0.01 0.05 0.27 0.055
TABLE CEstimated Mass Loadings of PCBs in Groundwater to the
Brandywine Creek
Maximum Estimated GroundwaterConcentration
(μg/L)
Estimated PCB Mass Loading(g/yr)
Minimum Maximum
0.27 0.03 1.0
BrightFields File: # 0985.69.51 1 of 1 June 2014


