
UNION BUILDING EASTWINGGOVERNMENT AVENUE
PRIVATE BAG X944PRETORIA
0001
ENQUIRIES: (012) 312 0327SWITHBOARD (011) 312 0000
www.thepresidency-dpme.gov.zaRP325/2015
ISBN 978-0-621-4430-0
UNION BUILDING
EASTWING
GOVERNMENT AV
ENUE
PRIVATE BAG X94
4PRETORI
A 0001
ENQUIRIES: (012)
312 0327
SWITHBOARD (01
1) 312 0000
www.thepresiden
cy-dpme.gov.za
RP325/2015
ISBN 978-0-621-4
430-0
RP193/2016 ISBN: 978-0-621-44673-9
UNION BUILDING EASTWINGGOVERNMENT AVENUE
PRIVATE BAG X944PRETORIA
0001
ENQUIRIES: (012) 312 0011SWITHBOARD (011) 312 1200
www.dpme.gov.za
ANNUAL REPORT 2015 | 2016

PAGE 1
PAGE NO.
PART A: GENERAL INFORMATION 2
1. DEPARTMENT GENERAL INFORMATION 3
2. LIST OF ABBREVIATIONS/ACRONYMS 4
3. FOREWORD BY THE MINISTER 5
4. DEPUTY MINISTER STATEMENT 7
5. REPORT OF THE ACCOUNTING OFFICER 9
6.STATEMENT OF RESPONSIBILITY AND CONFIRMATION OF ACCURACY FOR THE ANNUAL REPORT
13
7. STRATEGIC OVERVIEW 14
7.1 Vision 14
7.2 Mission 14
7.3 Values 14
8. LEGISLATIVE AND OTHER MANDATES 15
9. ORGANISATIONAL STRUCTURE 16
10. ENTITIES REPORTING TO THE MINISTER/MEC 16
PART B: PERFORMANCE INFORMATION 18
1. AUDITOR-GENERAL’S REPORT: PREDETERMINED OBJECTIVES 19
2. OVERVIEW OF DEPARTMENTAL PERFORMANCE 19
2.1 Service Delivery Environment 19
2.2 Service Delivery Improvement Plan 19
2.3 Organisational environment 22
2.4 Key policy developments and legislative changes 22
3. STRATEGIC OUTCOME ORIENTED GOALS 22
4. PERFORMANCE INFORMATION BY PROGRAMME 22
PART C: GOVERNANCE 60
PART D: HUMAN RESOURCE MANAGEMENT 66
1. INTRODUCTION 68
2. OVERVIEW OF HUMAN RESOURCES 68
3. HR OVERSIGHT STATISTICS 70
PART E: FINANCIAL INFORMATION 95
DEPARTMENT OF PLANNING, MONITORING AND EVALUATION(Vote 8)
ANNUAL REPORTFor the Period 1 April 2015 to 31 March 2016
Index

PAGE 2
DEPARTMENT OF PLANNING, MONITORING AND EVALUATION Annual Report 2015/2016
PART A

PAGE 3
1. DEPARTMENT GENERAL INFORMATION PHYSICAL ADDRESS 1: Union Buildings, East Wing
Government Avenue
Arcadia
Pretoria
PHYSICAL ADDRESS 2: 330 Grosvenor Street
Hatfield
Pretoria
POSTAL ADDRESS: Private Bag X944
Pretoria
0001
Mr Tshediso MatonaDirector-General (Acting)
Tel: 012 312 0010e-mail: [email protected]
Mr Clement MadaleHead of the Office of the DG
Tel: 012 312 0011e-mail: [email protected]
Mr Thulani Masilela Deputy Director-General (Acting): OME
Tel: 012 312 0100e-mail: [email protected]
Dr Ntsiki Tshayingca-Mashiya Deputy Director-General: IPME
Tel: 012 312 0202e-mail: [email protected]
Mr Pieter PretoriusChief Financial Officer
Tel: 012 312 0400e-mail: [email protected]
Ms Kelebogile ThulareChief Information Officer
Tel: 012 312 0500e-mail: [email protected]
Mr Ntabozuko Nomlala Director: Human Resources
Tel: 012 312 0452e-mail: [email protected]
Ms Mmabatho RamompiChief Director: Communications
Tel: 012 312 0190e-mail: [email protected]
Mr. Tshediso MatonaNPC Secretariat
Tel: 012 312 0235e-mail: [email protected]
Dr Bernice HlagalaDirector: Youth Desk
Tel: 012 312 0280e-mail: [email protected]
WEBSITE ADDRESS www.dpme.gov.za
PART A GENERAL INFORMATION

PAGE 4
DEPARTMENT OF PLANNING, MONITORING AND EVALUATION Annual Report 2015/2016
2. LIST OF ABBREVIATIONS/ACRONYMSAGSA Auditor-General South Africa
APP Annual Performance Plan
BBBEE Broad Based Black Economic Empowerment
CFO Chief Financial Officer
DIRCO Department of International Relations and Cooperation
DPME Department of Planning, Monitoring and Evaluation
DPSA Department of Public Service and Administration
EU European Union
FOSAD Forum of South African Directors General
GIS Geographic Information System
GWM&E Government Wide Monitoring and Evaluation
HOD Head of Department
HSRC Human Sciences Research Council
IPM&E Institutional Performance Monitoring and Evaluation
MAT Municipal Assessment Tool
MEC Member of Executive Council
MPAT Management Performance Assessment Tool
MTEF Medium Term Expenditure Framework
MTSF Medium Term Strategic Framework
OME Outcomes Monitoring and Evaluation
OPSC Office of the Public Service Commission
PCC President’s Coordinating Council
PFMA Public Finance Management Act
PoA Programme of Action
PPP Public Private Partnership
PPPFA Preferential Procurement Policy Framework Act
SAMEA South African Monitoring and Evaluation Association
SASSA South African Social Security Agency
SCM Supply Chain Management
SDIP Service Delivery Improvement Plan
SITA State Information Technology Agency
SMME Small Medium and Micro Enterprises
TR Treasury Regulations
NPC National Planning Commission
NYDA National Youth Development Agency

PAGE 5
I am pleased to present the Annual Report for the financial year 2015/16 for the Department of Planning, Monitoring and Evaluation (DPME). The Annual Report reflects the work that was started in 2009 to improve government’s planning capacity, monitoring the implementation of government plans and programmes, and evaluating the impact of government programmes in fighting inequality, poverty and joblessness.
To advance our planning and implementation capacity, in September 2015, we appointed new commissioners to serve on the National Planning Commission for a period of five years following the successful conclusion of the term of office of the first group of commissioners. The mandate of the Commission is:
(a) to promote and advance the implementation of the National Development Plan (NDP) across different sectors of society; (b) undertake detailed planning in a selected number of sectors; (c) conduct regular engagements with various sectors of society on all matters pertaining to the long-term development of the
country; (d) facilitate stakeholder engagements aimed at forging a social compact towards more effective implementation of the NDP; (e) take a cross-cutting view, undertake research into long-term trends, analyse implementation of short- to medium-term plans;
and (f) contribute to the development of international partnerships and networks on national planning.
The main focus of the planning, monitoring and evaluations programmes is to implement the NDP through the Medium Term Strategic Framework (MTSF) 2014-2019.
This entails:
(a) establishing robust systems, policy and legislative frameworks and processes for planning and monitoring in government as a whole;
(b) developing requisite institutional capacity for planning and implementing government plans and programmes;
(c) supporting the development of evidence-based policies and plans that draw on monitoring and evaluation and other data sources;
(d) ensuring that planning sets the priorities that inform the allocation of resources and
(e) influencing the planning philosophy of the country, in all spheres.
"We have also made progress in improving planning and implementation of policies and programmes. We successfully launched Operation Phakisa in the Ocean Economy as well as in the health sector for the Ideal Clinic."
3. FOREWORD BY THE MINISTER
Mr. Jeff Radebe (MP)Minister: Department of Planning, Monitoring and Evaluation

PAGE 6
DEPARTMENT OF PLANNING, MONITORING AND EVALUATION Annual Report 2015/2016
The Department made progress in implementing the different elements of planning, monitoring and evaluation. In the planning side, the Department has:
(a) completed a research project in collaboration with the University of the Witwatersrand (Wits) and 10 young researchers focusing on urban innovation. The research results will be published in an edited volume in the course of 2016/17;
(b) concluded with the study of investigating the feasibility and modalities for a national minimum wage policy.
(c) continued with the National Income Dynamic Study (NIDS) whose results of the fourth survey will be released in the second half of 2016/17. The NIDS enables us to get a better understanding of the changing income dynamics in our society. It answers the questions related to who is getting ahead and who is falling behind, thus enabling a better targeted policy. The study is continuing and the fifth survey of the study will get underway in the course of the financial year 2016/17;
(d) the Department is working with the Department of Water and Sanitation (DWS) to develop an integrated water plan as mandated by Cabinet. We aim to finalise the plan in the course of 2016/17;
(e) the Department has started engagements with the Departments of Rural Development and Land Reform and Cooperative Governance to relocate the spatial planning and land use management functions
The Operation Phakisa initiative which focuses government programmes towards results, is continuing to add value in our planning and monitoring approaches. Substantial progress is being made through the methodology in regard to South Africa’s ocean economy, and the Health, Education and Mining sectors.
On the evaluations programme, four provincial departments have developed provincial evaluation plans. Six evaluation reports were produced and eight evaluation improvement plans were developed with the aim of improving programme performance during the 2015/16 financial year.
Our programme of monitoring management practices across the whole of government, using the Local Government Management Improvement Model (LGMIM) and Management Practices Assessment Tool (MPAT) suggests that there is organisational learning, and that many departments find value in the self-assessment methods. The LGMIM programme has enrolled 30 municipalities across six provinces in the past financial year. Similarly, MPAT secured 100% participation (155 national and provincial departments) on the assessment of management practices.
Despite the achievements reported in this Annual Report, DPME still has a lot to do to improve the performance of government as a whole, and to ensure that government plans and programmes respond to the NDP priorities, and that their implementation is closely monitored and evaluated. To this end, DPME has embarked on a strategy review process that also involves the creation of requisite capacity to carry out its work.
I take this opportunity to thank the former Acting Director-General Ms Nolwazi Gasa, the acting Director-General Mr Tshediso Matona, my office, senior management and all officials for their support and in making it possible for the Department to work.
Mr. Jeff Radebe (MP)Minister : Department of Planning, Monitoring and EvaluationDate: 25 August 2016

PAGE 7
4. DEPUTY MINISTER STATEMENT
In financial year 2015/2016, the National Youth Policy 2020 (NYP 2020) built on the five key pillars of the enabling economic participation and transformation; facilitating education, skills development and second chances; health care and combating substance abuse; facilitating nation building and social cohesion, and optimising the youth development machinery was approved by Cabinet.
The policy is being implemented and monitored at the highest level of government. In June 2015, the President established the Presidential Working Group on Youth comprising of Deputy Ministers to monitor and drive the implementation of the NYP 2020. Work streams, comprising of business, civil society, and government departments were set up in each of the five priority areas. These partners act as catalysts in ensuring that the NYP 2020 is implemented and monitored. Implementation is gaining momentum and indeed every sector of society is beginning to understand that youth development is everyone’s business. Progress on the five pillars is as follow:
(a) On education, skills development and second chances: A sector plan for the introduction of second chance programmes for all learners that have not succeeded in Matric or Grade 12 is being implemented; a policy to ensure that there is articulation between schools, community colleges, TVET colleges and universities is being finalised in the 2016/17 financial year. Since the inception of the National Skills Accord in 2011, State Owned Enterprises have collectively trained young people in various scarce and critical skills.
(b) On economic participation: Since the advent of the Youth Employment Accord, employment of young people in agriculture increased to 418 360, increase in employment of young people in construction is 158 000 and government has employed an additional 126 000.
(c) Health care and combating substance abuse: The building of substance abuse treatment centres is ongoing with funds availed to ensure that each province has a treatment centre. Seven centres are operational and two centres in the Northern Cape and Free State will be complemented in next two years. The Drug Master Plan is being reviewed to ensure consistency in policy approach to substance abuse and funding being sourced for research to ensure that the war on drugs is informed by evidence.
(d) Nation building and social cohesion: Initiatives are to be implemented to foster nation building and social cohesion through the National Youth Service Programme. We intend to work towards enrolling one million young people in the National Youth Service Programme by 2020. Through this initiative, we hope that the youth will discover their common humanity. They will use their energy to build our nation and provide valuable services to communities.
(e) National Youth Service Programme: A draft National Youth Service Programme framework has been developed and a process of nation-wide consultation on the draft framework will be rolled out during 2016. We hope to submit the framework to Cabinet for approval during 2016.
"The analysis of the results of the follow-up visits shows that in over 65% of the cases, facilities managers have acted on the recommendations for improvements"
Mr. Buti Manamela (MP)Deputy Minister: Departmet of Planning, Monitoring and Evaluation

PAGE 8
DEPARTMENT OF PLANNING, MONITORING AND EVALUATION Annual Report 2015/2016
DPME implements programmes to assess the experience of citizens with service delivery, such as, the Presidential Hotline, unannounced visits and citizen-based monitoring.
The Presidential Hotline provides a channel for citizens to seek redress when service delivery fails. The Hotline logs an average of 2 000 cases per month. The cumulative resolution rate for Hotline cases stands at 98%.
Our work demands that we are visible in service delivery sites, beyond interacting with departments to monitor their plans and programmes. In the past year, we assessed over 100 facilities and conducted improvement monitoring in 120 facilities.
These unannounced visits also help to highlight various institutional challenges, and enable DPME to advise the relevant departments on measures to be taken to remedy the situation.
In the previous financial year, we completed a two-year action learning process to develop a citizen-based monitoring method. We have published a toolkit for citizen-based monitoring and we will be supporting government departments to implement this method, which puts the citizen experience at the centre of service delivery.
I want to thank the Minister, staff in my office and departmental management for their support in making a success out of our efforts.
Mr. Buti Manamela (MP)Deputy Minister : Department of Planning, Monitoring and Evaluation Date: 25 August 2016

PAGE 9
5. REPORT OF THE ACCOUNTING OFFICER
"The national macro organization of the state that took place after the general elections in May 2014 has resulted in the merging of the National Planning Secretariat and the Department of Performance Monitoring and Evaluation. These changes resulted in the development of a new Strategic Plan and Annual Performance Plan of the new Department of Planning, Monitoring and Evaluation."
5.1 Overview of the operations of the Department
The Annual Report is an account of the financial and service delivery performance of DPME as outlined in the Annual Performance Plan (APP) for 2015/16. Over and above its APP targets, DPME embarked on a strategy review process out of the recognition that to be effective, planning, monitoring and evaluation needs to be periodically reviewed. The strategy review process is at an advanced stage and DPME plans to start implementing the revised strategy in the 2016/17 financial year onward.
DPME will continuously assess the relevance of its work and the service delivery environment to enhance its impact in monitoring the implementation of the NDP through the MTEF. The Department is also continuously seeking creative ways to do more with limited resources against competing demands. DPME strives to continuously improve the performance and developmental impact of the state on citizens. To achieve this, will require:
§ Improved policy coherence and direction
§ Seamless and mutually reinforcing planning, monitoring and evaluation systems and practices that clearly spell out the outcomes and targets to be achieved, accountability for the achievement of the targets, rigorous monitoring of progress and evaluation of the impacts
§ Effective mechanisms and an enabling environment for coordinated action, collaboration and partnering across departments and with agents outside of government
DPME seeks to contribute to this capacity through the development of planning and monitoring frameworks, systems and capacity development initiatives.
In the financial year 2015/16, DPME was able to achieve an aggregated 80% of its targets. and 99.3% of budget spent We are looking forward to improve on this performance in 2016/17.
Mr. Tshediso MatonaActing Director-General: Department of Planning, Monitoring and Evaluation
PAGE 10
DEPARTMENT OF PLANNING, MONITORING AND EVALUATION Annual Report 2015/2016
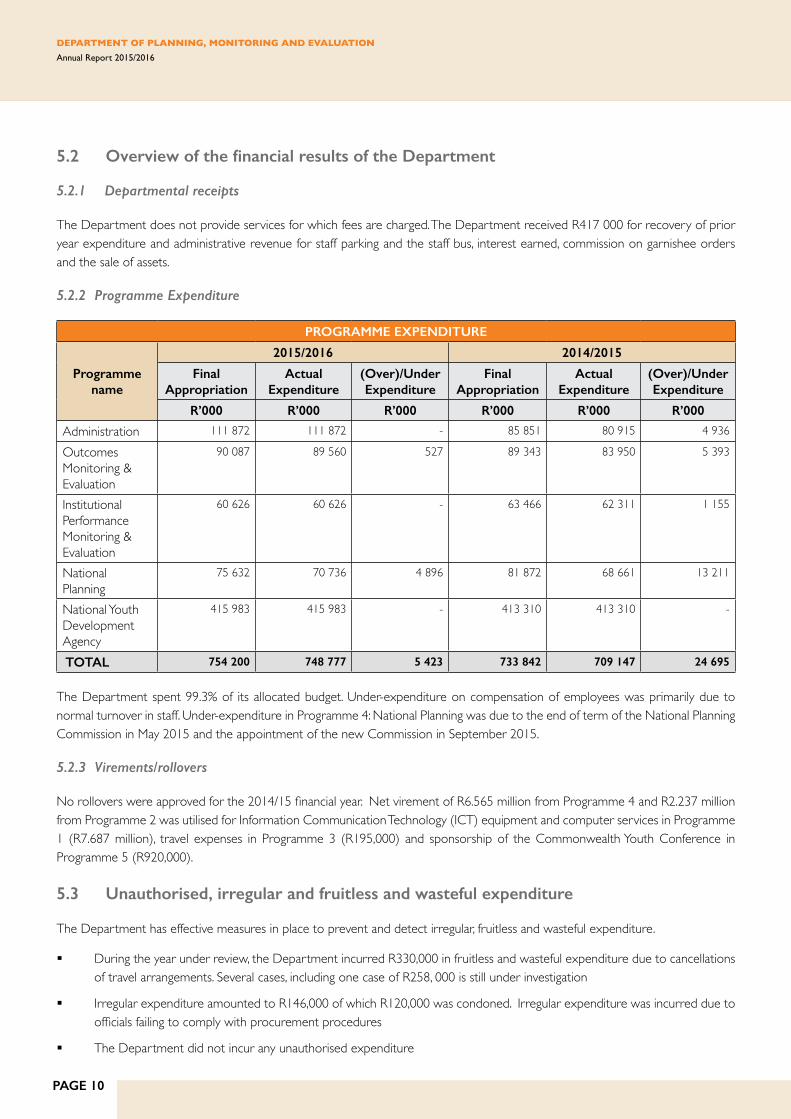
5.2 Overview of the financial results of the Department
5.2.1 Departmental receipts
The Department does not provide services for which fees are charged. The Department received R417 000 for recovery of prior year expenditure and administrative revenue for staff parking and the staff bus, interest earned, commission on garnishee orders and the sale of assets.
5.2.2 Programme Expenditure
PROGRAMME EXPENDITURE
Programme name
2015/2016 2014/2015
Final Appropriation
ActualExpenditure
(Over)/Under Expenditure
Final Appropriation
ActualExpenditure
(Over)/Under Expenditure
R’000 R’000 R’000 R’000 R’000 R’000
Administration 111 872 111 872 - 85 851 80 915 4 936
Outcomes Monitoring & Evaluation
90 087 89 560 527 89 343 83 950 5 393
Institutional Performance Monitoring & Evaluation
60 626 60 626 - 63 466 62 311 1 155
National Planning
75 632 70 736 4 896 81 872 68 661 13 211
National Youth Development Agency
415 983 415 983 - 413 310 413 310 -
TOTAL 754 200 748 777 5 423 733 842 709 147 24 695
The Department spent 99.3% of its allocated budget. Under-expenditure on compensation of employees was primarily due to normal turnover in staff. Under-expenditure in Programme 4: National Planning was due to the end of term of the National Planning Commission in May 2015 and the appointment of the new Commission in September 2015.
5.2.3 Virements/rollovers
No rollovers were approved for the 2014/15 financial year. Net virement of R6.565 million from Programme 4 and R2.237 million from Programme 2 was utilised for Information Communication Technology (ICT) equipment and computer services in Programme 1 (R7.687 million), travel expenses in Programme 3 (R195,000) and sponsorship of the Commonwealth Youth Conference in Programme 5 (R920,000).
5.3 Unauthorised, irregular and fruitless and wasteful expenditure
The Department has effective measures in place to prevent and detect irregular, fruitless and wasteful expenditure.
§ During the year under review, the Department incurred R330,000 in fruitless and wasteful expenditure due to cancellations of travel arrangements. Several cases, including one case of R258, 000 is still under investigation
§ Irregular expenditure amounted to R146,000 of which R120,000 was condoned. Irregular expenditure was incurred due to officials failing to comply with procurement procedures
§ The Department did not incur any unauthorised expenditure

PAGE 11
Detailed information on irregular, fruitless and wasteful expenditure is available under Part E: Financial Information disclosure notes to the annual financial statements 2015/16 notes 22 and 23.
5.4 Future plans of the Department
The Department management team under the guidance of the Minister and Deputy Minister identified the need for the Department to shift its focus from an ‘arm’s length’ planning, monitoring and evaluation role to a more ‘hands-on’ role, given the need to accelerate the implementation of government’s apex priorities as espoused in the NDP and to closely monitor the delivery processes. In the guidance that the Minister provided for the strategy review process, he highlighted the following as key areas of focus for DPME going forward:
§ Expand on the ground monitoring, intelligence and visibility at service delivery points
§ Factoring youth development into the work of the Department as a special constituency because of its increased alienation and marginalisation. This is a top priority for the country to benefit from the demographic dividend of a youthful population
§ Monitoring and reporting on the 30 day payment commitment
§ Reforming the mining sector
§ Ensuring sector plans for strategic sectors are developed and implemented
§ Monitoring the performance and effectiveness of Development Finance Institutions and State Owned Enterprises in directing their resources towards the country’s development goals and objectives
§ Alignment of the National budget to key priorities
Further, the discussions identified as a core problem that despite major investments in services and infrastructure, government is not achieving the desired impact on its citizens. The major challenge in the delivery value chain is that there are duplications, inefficiencies and gaps in services delivered to the citizens.
5.5 Public Private Partnerships
The Department did not enter into or participate in any PPP contracts for the period under review.
5.6 Discontinued activities/activities to be discontinued
The Department did not discontinue any of its activities during the 2015/16 financial year.
5.7 New or proposed activities
The key activities to address the challenges identified in the next five years are as follows:
§ Promote the use of evidence in policy making and design of government programmes. There is insufficient use of evidence to inform policy and planning, and thus departmental plans and policies are weak and not likely to achieve the intended outcomes
§ Improve planning, monitoring and evaluation. Poor planning, monitoring and evaluation affects the design of what government does, and its ability to learn and improve
§ Improve the planning and alignment of government programmes. The degree to which the NDP and MTSF are directing government’s work is inadequate
§ Improve policy coherence. Fragmentation in policies and implementation across government and thus the need to further strengthen implementation of the Socio-Economic Impact Assessment
§ Develop and implement an approach to proactively identify service delivery bottlenecks and proactively tackle them. Problems are not resolved quickly to improve delivery.

PAGE 12
DEPARTMENT OF PLANNING, MONITORING AND EVALUATION Annual Report 2015/2016
§ Increase communication of the NDP and MTSF. There is insufficient communication of the NDP and MTSF as guiding frameworks intended to focus government’s work
§ Improve resource allocation for priority government programmes. Resource allocation is not sufficiently aligned to the NDP/MTSF, and with fiscal constraints we are not sufficiently focusing our resources hence the need to focus in this area in amore co-ordinated and concerted manner
§ Co-ordinate and play a secretarial role for the assessment of Directors-General (DGs) and Heads of Departments (HoDs)
5.8 Supply chain management
No unsolicited bid proposals were concluded by the Department. The Departmental Supply Chain Management (SCM) system has matured significantly since 2011 and the Department continues to improve its policies and internal controls to prevent and detect irregular and fruitless and wasteful expenditure. The SCM unit currently does not experience any significant challenges but will require additional capacity if the Department continues to grow.
5.9 Gifts and Donations received in kind from non-related parties
Gifts and donations received from non-related parties are disclosed in the Annexures to Part E: Financial Information.
5.10 Exemptions and deviations received from the National Treasury
The Department did not request any exemption from the PFMA/Treasury Regulations or from financial reporting requirements during the financial year.
5.11 Events after the reporting date
None
5.12 Conclusion
The Department acknowledges the contributions Ms Nolwazi Gasa who was the Acting Director-General in the first half of the year. I wish to express my heartfelt appreciation to the Minister and the Deputy Minister for their strategic leadership and guidance at all times and for ensuring that the Department gives effect to the work that the Office of the President has mandated us with. I take this opportunity to say thank you to the DPME team for their contribution to the success of the Department.
Mr Tshediso MatonaActing Director-GeneralDate: 22 August 2016

PAGE 13
6. STATEMENT OF RESPONSIBILITY AND CONFIRMATION OF ACCURACY FOR THE ANNUAL REPORT
To the best of my knowledge and belief, I confirm the following:
All information and amounts disclosed throughout the Annual Report are consistent.
The Annual Report is complete, accurate and is free from any omissions.
The Annual Report has been prepared in accordance with the guidelines on the Annual Report as issued by National Treasury.
The Annual Financial Statements (Part E) have been prepared in accordance with the modified cash standard and the relevant frameworks and guidelines issued by the National Treasury.
The Accounting Officer is responsible for the preparation of the Annual Financial Statements and for the judgements made in this information.
The Accounting Officer is responsible for establishing and implementing a system of internal control that has been designed to provide reasonable assurance as to the integrity and reliability of the performance information, the human resources information and the Annual Financial Statements.
The external auditors are engaged to express an independent opinion on the Annual Financial Statements.
In my opinion, the Annual Report fairly reflects the operations, the performance information, the human resources information and the financial affairs of the Department for the financial year ended 31 March 2016.
Yours faithfully
Mr Tshediso MatonaActing Director-GeneralDate: 22 August 2016

PAGE 14
DEPARTMENT OF PLANNING, MONITORING AND EVALUATION Annual Report 2015/2016
7. STRATEGIC OVERVIEW7.1 Vision
Improved government outcomes and impact on society
7.2 Mission
To facilitate, influence and support effective planning, monitoring and evaluation of government programmes aimed at improving service delivery, outcomes and impact on society
7.3 Values
A learning organisation
Our values are inspired by our desire to be a learning organisation. We value innovation, partnerships and feedback. We do not do the same things over and over when they are clearly not working
Our staff
We value our employees and therefore we strive to create an environment that allows them to grow and to be innovative. We will create an environment that enables our staff to:
§ Act with integrity
§ Practice Ubuntu
§ Respect self and others
Our customers
We shall at all times be exemplary in all respects. This includes being people-centred and service-oriented.
Our performance culture
Our performance culture is influenced by our commitment to:
§ be outcome oriented
§ pursue progressive and quality management practices in order to achieve value for money, efficiency and effectiveness
§ produce quality outputs
§ be compliant with prescripts
§ pay attention to the basics, such as:
– not being late for meetings
– running meetings efficiently
– responding to e-mails, phone messages and all other requests timeously
§ be accountable and transparent
PAGE 15
8. LEGISLATIVE AND OTHER MANDATESThere was no change in the mandate for the current reporting cycle. The mandate of the Department of Planning, Monitoring and Evaluation is derived from section 85(2) (b-c) of the Constitution of the Republic of South Africa, which states that:
“The President exercises Executive Authority, together with other members of Cabinet, by
(a) Implementing national legislation.
(b) Developing and implementing national policy.
(c) Co-ordinating the functions of state departments and administrations.
(d) Preparing and initiating legislation.
(e) Performing any other executive function provided for in the Constitution or in national legislation.”
This has been given concrete expression by the President in his 2010 and 2011 State of the Nation Addresses as well as various Cabinet decisions; and by the “Policy Framework on Performance Monitoring and Evaluation - Our Approach” document and the “Revised Green Paper: National Planning Commission”, which were tabled in Parliament.
DPME has also been delegated the function of regulating Strategic Plans and Annual Performance Plans by the National Treasury in line with Treasury Regulation and the PFMA.

PAGE 16
DEPARTMENT OF PLANNING, MONITORING AND EVALUATION Annual Report 2015/2016
9. ORGANISATIONAL STRUCTURE
Director-General
BranchOutcomes
Monitoring and Evaluation
Branch
Office of the DG
Institutional Performance Monitoring &
Evaluation
BranchPlanning & Secretariat National Planning
Commission
Chief Directorate:
Chief Information
Chief Directorate: Chief Financial
Directorate: Human Resource
Management
Directorate: Youth
Development
Directorate: Internal Audit and Risk Management
10. ENTITIES REPORTING TO THE MINISTERThe table below indicates the entities, in addition to the Presidency, that reported to the Minister during the financial year under consideration. The Office of the Minister and Deputy Minister were transferred from the Presidency to DPME in July 2015.
Related party transactions are included in the disclosure notes to the Annual Financial Statements (Part E).
NAME OF ENTITY LEGISLATIVE MANDATEFINANCIAL
RELATIONSHIPNATURE OF
OPERATIONS
National Youth Development Agency (NYDA)
NYDA Act Transfer paymentsSupport youth empowerment
Statistics South AfricaStatistics Act, 1999 (Act No. 6 of 1999)
None
The purpose of this Act is to advance the planning, production, analysis, documentation, storage, dissemination and use of official and other statistics

PAGE 17

PAGE 18
DEPARTMENT OF PLANNING, MONITORING AND EVALUATION Annual Report 2015/2016
PART B

PAGE 19
1. AUDITOR-GENERAL’S REPORT: PREDETERMINED OBJECTIVES
The Auditor-General of South Africa (AGSA) currently performs certain audit procedures on the performance information to provide reasonable assurance in the form of an audit conclusion. The audit conclusion on the performance against predetermined objectives is included in the report to management, with material findings being reported under the Predetermined Objectives heading in the Report on other legal and regulatory requirements section of the Auditor’s Report.
Refer to pages 96-98 of the Report of the Auditor-General of South Africa, in Part E: Financial Information.
2. OVERVIEW OF DEPARTMENTAL PERFORMANCE2.1 Service Delivery Environment
The overarching outcome that DPME must achieve is to improve the performance and developmental impact of the state on citizens. To achieve this, will require:
§ Improved policy coherence and direction
§ Seamless and mutually reinforcing planning, monitoring and evaluation systems and practices that clearly spell out the outcomes and targets to be achieved, accountability for the achievement of the targets, rigorous monitoring of progress and evaluation of the impacts
§ Effective mechanisms and an enabling environment for coordinated action, collaboration and partnering across departments and with agents outside of government
The DPME was able to achieve most its financial and service delivery targets in the period under review. There is an acknowledgment that to achieve its intended impact on the state, more still needs to be done. For this reason, in the period under review, DPME has engaged in a strategy review process to strengthen its capacity and sharpen its strategies for delivering on its mandate.
2.2 Service Delivery Improvement Plan
The service delivery improvement plan for DPME is work in progress. This requires an injection of financial resources to increase its capacity over the next three years. The Department has completed a service delivery improvement plan based on the current operations. The identified improvement areas have been incorporated into the APP targets for the reporting period under review. The tables below highlight the service delivery plan and the achievements to date.
PART B PERFORMANCE INFORMATION

PAGE 20
DEPARTMENT OF PLANNING, MONITORING AND EVALUATION Annual Report 2015/2016
Main services and standards
PROGRAMME OUTCOMES MONITORING AND EVALUATION
Main services Beneficiaries Current/actual standard of service
Desired standard of service
Actual achievement
Briefing notes on other departments’ Cabinet memos
President
Deputy President
Ministers
Secretariat of Cabinet
All briefing notes are submitted 1 day (Monday) before cabinet committee meeting
Maintain the standard Standard met
DPME Cabinet memos Ministers and Cabinet Cabinet memos are submitted 7 days before cabinet committee meetings
Maintain the standard Standard met
Briefing notes for Presidential visits
President
Deputy President
Ministers
Briefing notes are compiled within 30 days before visit
Maintain the standard Standard met
Programme Public Sector Oversight
Presidential Hotline cases
All complainants
President
Deputy President
Ministers
FOSAD Manco
Complaints received are acknowledged within 5 days of receipt in the majority of cases
Preliminary investigations of complaints are conducted within 7 days and referred to relevant department or institution
Complaints received are acknowledged within 5 days of receipt
Preliminary investigations of complaints are conducted within 7 days and referred to relevant department or institution
Achieved
Strategic plan analysis All national departments
Reports on compliance of strategic plans with delivery agreements are submitted to the relevant department within 22 days after submission by the relevant department
Maintain the standard Standard met
MPAT assessments All national and provincial departments
President
Deputy President
Ministers
Secretariat of Cabinet
100%

PAGE 21
PROGRAMME OUTCOMES MONITORING AND EVALUATION
Programme M&E Systems Coordination and Support
Well-functioning Data forums and M&E forums
All outcomes co-ordinating departments
Data forums are convened on a quarterly basis for 10 Outcomes
Data forums are convened on a quarterly basis for 10 Outcomes
Achieved
Well-functioning M&E for provincial and national departments
National and provincial departments
M&E forums for national and provincial departments convened quarterly
M&E forums for national and provincial departments convened quarterly
Achieved
Batho Pele arrangements with beneficiaries (Consultation and access)
CURRENT/ACTUAL ARRANGEMENTS
DESIRED ARRANGEMENTS ACTUAL ACHIEVEMENT
DPME website Site developed and deployed for access by members of the public and client departments
Achieved
Presidential Hotline Members of the public can access us through the Presidential Hotline
Achieved
Service delivery information tool
CURRENT/ACTUAL INFORMATION TOOLS
DESIRED INFORMATION TOOLS ACTUAL ACHIEVEMENT
Programme of Action Programme of Action Achieved
Management Performance Assessment Tool
Management Performance Assessment Tool Achieved
Presidential Hotline Presidential Hotline Achieved
Complaints mechanism
CURRENT/ACTUAL COMPLAINTS MECHANISM
DESIRED COMPLAINTS MECHANISM
ACTUAL ACHIEVEMENT
Members of the public can access us through the Presidential Hotline by telephone, facsimile, e-mail and written correspondence
Members of the public can access us through the Presidential Hotline by telephone, facsimile, e-mail and written correspondence
Achieved
Dedicated e-mail address for compliments/complaints monitored by the Office of the Director-General
Dedicated e-mail address for compliments/complaints monitored by the Office of the Director-General
Achieved

PAGE 22
DEPARTMENT OF PLANNING, MONITORING AND EVALUATION Annual Report 2015/2016
2.3 Organisational environment
Organisationally, no major changes took place during the reporting period. However, the Department absorbed the Ministry into the organisational structure of the Department. A number of posts were also added in the organisational structure of the Department to create capacity in areas of need. This resulted in the Department missing its targets of a 10% vacancy rate in its establishment.
2.4 Key policy developments and legislative changes
Since the merging of DPME and National Planning Commission Secretariat resulting in the legislation governing both the National Planning Commission (NPC) Secretariat and the DPME, there were no new developments in the legislative area affecting the work of new DPME.
3. STRATEGIC OUTCOME ORIENTED GOALSThere were no changes in the strategic outcome oriented goals during the financial year under review. The key strategic outcome oriented goals of the Department remains “To advance the strategic and developmental agenda of government through monitoring, reporting and recommending corrective measures on the implementation of the NDP and the MTSF targets and evaluating key government programmes “. The focus of the Department remains the implementation of the NDP 2030 through the MTSF. To this end, the review of the MTSF chapters to respond to the changing environment, is work in progress.
4. PERFORMANCE INFORMATION BY PROGRAMMEThe activities of the Department were organised according to the following programmes for the financial year under review:
Programme 1: Administration
Programme 2: Outcomes Monitoring and Evaluation (OME)
Programme 3: Institutional Performance Monitoring and Evaluation (IPME)
Programme 4: National Planning Commission (NPC)
Programme 5: National Youth Development Programme
4.1 Programme 1: Administration
Purpose of the Programme: The programme is responsible for providing strategic leadership, management, administrative, financial management, human resource and information technology services to enable the Department to achieve its strategic and operational goals.
The programme is made up of the following sub-programmes:

PAGE 23
Sub-programmes:
§ Departmental Management
§ Internal Audit and Risk Management
§ Corporate and Financial Services
§ Information Technology Support
Strategic objectives, performance indicators, planned targets and actual achievements
The tables below highlight the strategic objectives and performance against outputs, performance indicators and the planned targets to achieve the above strategic oriented goal.
4.1.1 Sub-programme: Departmental Management
STRATEGIC OBJECTIVE: TO CO-ORDINATE PLANNING, MONITORING AND REPORTING ON THE IMPLEMENTATION OF DEPARTMENTAL PLANS
The outputs, performance indicators and the planned targets below are meant to achieve this objective as stated in the Strategic Plan and Annual Performance Plan reported on.
2015/2016 2014/2015 2015/2016
OutputsPerformance
Indicator
Actual Achievement
(where applicable)
Planned Annual Target
Actual Achievement
Deviation from Planned
Target to Actual
Achievement
Comment on deviations
DPME Strategic and Annual Performance Plans
Approved Strategic and APP
Achieved
2014-2019 Strategic Plan and 2015/16 APP developed according to National Treasury guidelines and approved by the Executive Authority and submitted to Parliament on time according to the deadlines set by Parliament
Conduct annual review of Strategic Plans and APP as prescribed by the relevant planning frameworks
Achieved
The APP 2016/17 was developed and tabled in line with the planning framework
The strategic plan 2015-2020 was reviewed and no changes were made
- -

PAGE 24
DEPARTMENT OF PLANNING, MONITORING AND EVALUATION Annual Report 2015/2016
STRATEGIC OBJECTIVE: TO CO-ORDINATE PLANNING, MONITORING AND REPORTING ON THE IMPLEMENTATION OF DEPARTMENTAL PLANS
The outputs, performance indicators and the planned targets below are meant to achieve this objective as stated in the Strategic Plan and Annual Performance Plan reported on.
2015/2016 2014/2015 2015/2016
OutputsPerformance
Indicator
Actual Achievement
(where applicable)
Planned Annual Target
Actual Achievement
Deviation from Planned
Target to Actual
Achievement
Comment on deviations
Progress reports on implementation of plans
Number of quarterly implementation reports
Achieved
4 quarterly progress reports approved by the Executive Authority and submitted to National Treasury within 30 days of the end of the quarter
Quarterly reports submitted to the Executing Authority, National Treasury and DPME within 30 days from the end of the quarter
Achieved
4 quarterly progress reports approved by the Executive Authority and submitted to National Treasury within 30 days from the end of each the quarter
- -
Annual Report Audited Annual Report
Achieved
Audited Annual Report approved and submitted to National Treasury and Parliament within stipulated time frames
Produce AR and submit to AGSA for audit and to NT and Parliament by the due dates
Achieved
Audited Annual Report 2014/15 was approved and submitted to National Treasury and Parliament within stipulated time frames
- -
Communication plans and reports of public engagement activities
Number of communication plans, reports and stakeholder engagements
Achieved
70% communication activities
implemented in the communication plan
Produce a communication plan annually and report on its implementation within 30 days at the end of each quarter of the financial year
Partially Achieved
A communication plan with 4 key performance areas was developed but implementation of activities 24 communication activities and events took place during the period under review
Implementation of activities were not based against the approved annual communication plan
The Communication Unit had capacity constraints and it is currently being capitated to function effectively

PAGE 25
STRATEGIC OBJECTIVE: TO CO-ORDINATE PLANNING, MONITORING AND REPORTING ON THE IMPLEMENTATION OF DEPARTMENTAL PLANS
The outputs, performance indicators and the planned targets below are meant to achieve this objective as stated in the Strategic Plan and Annual Performance Plan reported on.
2015/2016 2014/2015 2015/2016
OutputsPerformance
Indicator
Actual Achievement
(where applicable)
Planned Annual Target
Actual Achievement
Deviation from Planned
Target to Actual
Achievement
Comment on deviations
Progress reports on implementation of plans
Number of quarterly implementation reports
Achieved
4 quarterly progress reports approved by the Executive Authority and submitted to National Treasury within 30 days of the end of the quarter
Quarterly reports submitted to the Executing Authority, National Treasury and DPME within 30 days from the end of the quarter
Achieved
4 quarterly progress reports approved by the Executive Authority and submitted to National Treasury within 30 days from the end of each the quarter
- -
Annual Report Audited Annual Report
Achieved
Audited Annual Report approved and submitted to National Treasury and Parliament within stipulated time frames
Produce AR and submit to AGSA for audit and to NT and Parliament by the due dates
Achieved
Audited Annual Report 2014/15 was approved and submitted to National Treasury and Parliament within stipulated time frames
- -
Communication plans and reports of public engagement activities
Number of communication plans, reports and stakeholder engagements
Achieved
70% communication activities
implemented in the communication plan
Produce a communication plan annually and report on its implementation within 30 days at the end of each quarter of the financial year
Partially Achieved
A communication plan with 4 key performance areas was developed but implementation of activities 24 communication activities and events took place during the period under review
Implementation of activities were not based against the approved annual communication plan
The Communication Unit had capacity constraints and it is currently being capitated to function effectively
4.1.2 Sub-programme: Corporate and Financial Services
STRATEGIC OBJECTIVE: TO ACHIEVE AN UNQUALIFIED AUDIT OPINION ON FINANCIAL STATEMENTS
The outputs, performance indicators and the planned targets below are meant to achieve this objective as stated in the Strategic Plan and Annual Performance Plan reported on.
2015/2016 2014/2015 2015/2016
OutputsPerformance
Indicator
Actual Achievement
(where applicable)
Planned Annual Target
Actual Achievement
Deviation from Planned
Target to Actual
Achievement
Comment on deviations
Financial statements and reports
Monthly and annual financial reports and statements
- Obtain an unqualified audit opinion and no material findings on financial statements annually
Achieved
The Department obtain a clean audit opinion for the 2014/15 Annual Report and no material findings on financial statements
- -
Reports on payment of suppliers
Percentage of invoices paid within 30 days
- All valid invoices paid within 30 days
Partially Achieved
All but 5 invoices were paid within 30 days of receipt of a valid invoice
5 invoices were not paid within 30 days
The internal control processes were not followed. Disciplinary action was taken against the responsible officials

PAGE 26
DEPARTMENT OF PLANNING, MONITORING AND EVALUATION Annual Report 2015/2016
4.1.3 Sub-programme: Human Resource management and development
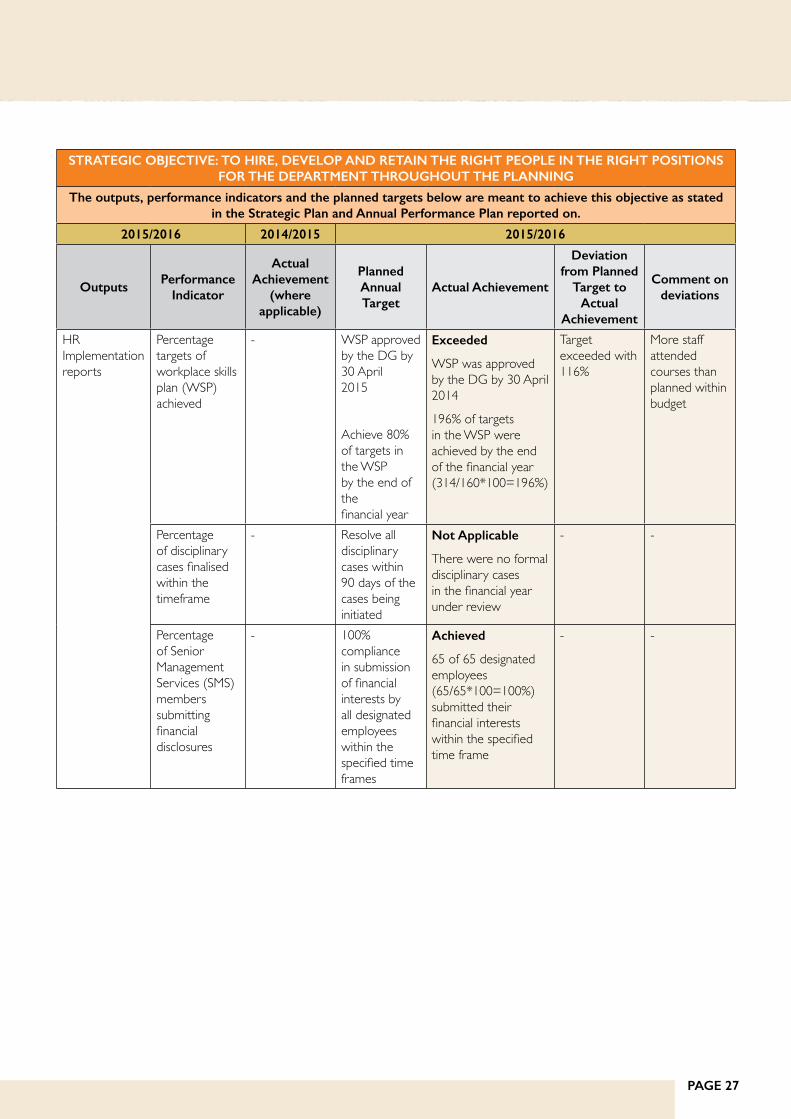
STRATEGIC OBJECTIVE: TO HIRE, DEVELOP AND RETAIN THE RIGHT PEOPLE IN THE RIGHT POSITIONS FOR THE DEPARTMENT THROUGHOUT THE PLANNING
The outputs, performance indicators and the planned targets below are meant to achieve this objective as stated in the Strategic Plan and Annual Performance Plan reported on.
2015/2016 2014/2015 2015/2016
OutputsPerformance
Indicator
Actual Achievement
(where applicable)
Planned Annual Target
Actual Achievement
Deviation from Planned
Target to Actual
Achievement
Comment on deviations
HR Implementation reports
Average percentage of funded posts in PERSAL which are vacant over a quarter (Vacancy rate)
- 10% or less on average over the full financial year
Not Achieved
16.7% average over the full financial year achieved
(Average number of post filled divided by average number of funded vacancies expressed as a percenta ge i.e. (57/341*100=16.7%)
Target missed by 6.7%
Additional 52 posts were added to the structure, resulting in a total of 341 funded posts which took longer to fill
In addition, 30 employees exited the Department during the quarters
Number of interns enrolled on annual basis
- 5% or more (of the approved funded post establishment) of interns are appointed annually in the Department
Exceeded
9% of interns were appointed against the approved funded post establishment (26/280*100 = 9%)
Target exceeded by 4%
More units required the services of interns than planned to compensate for higher vacancy rate
% of performance agreements and reports submitted on time
Achieved
90% submissions of Performance Agreements, Reviews and Assessments by due dates
Achieve 90% submissions of performance agreements, reviews and assessments by due dates
Exceeded
100% assessment for 2014-15 was achieved 97% (274/282*100= 97%) of staff submitted their performance agreements for 2015/16
Assessments to 2014/15 exceeded by 100%
Submission of Pas exceeded by 7%
Higher rate of compliance was achieved due to follow-ups with programme heads
PAGE 27
STRATEGIC OBJECTIVE: TO HIRE, DEVELOP AND RETAIN THE RIGHT PEOPLE IN THE RIGHT POSITIONS FOR THE DEPARTMENT THROUGHOUT THE PLANNING
The outputs, performance indicators and the planned targets below are meant to achieve this objective as stated in the Strategic Plan and Annual Performance Plan reported on.
2015/2016 2014/2015 2015/2016
OutputsPerformance
Indicator
Actual Achievement
(where applicable)
Planned Annual Target
Actual Achievement
Deviation from Planned
Target to Actual
Achievement
Comment on deviations
HR Implementation reports
Percentage targets of workplace skills plan (WSP) achieved
- WSP approved by the DG by 30 April 2015
Achieve 80% of targets in the WSP by the end of the financial year
Exceeded
WSP was approved by the DG by 30 April 2014
196% of targets in the WSP were achieved by the end of the financial year (314/160*100=196%)
Target exceeded with 116%
More staff attended courses than planned within budget
Percentage of disciplinary cases finalised within the timeframe
- Resolve all disciplinary cases within 90 days of the cases being initiated
Not Applicable
There were no formal disciplinary cases in the financial year under review
- -
Percentage of Senior Management Services (SMS) members submitting financial disclosures
- 100% compliance in submission of financial interests by all designated employees within the specified time frames
Achieved
65 of 65 designated employees (65/65*100=100%) submitted their financial interests within the specified time frame
- -

PAGE 28
DEPARTMENT OF PLANNING, MONITORING AND EVALUATION Annual Report 2015/2016
4.1.4 Sub-programme: Information Technology Support
STRATEGIC OBJECTIVE: TO IMPLEMENT AND REALISE BENEFITS FROM ICT SOLUTIONS IN DOING THE WORK OF THE DEPARTMENT
The outputs, performance indicators and the planned targets below are meant to achieve this objective as stated in the Strategic Plan and Annual Performance Plan reported on.
2015/2016 2014/2015 2015/2016
OutputsPerformance
Indicator
Actual Achievement
(where applicable)
Planned Annual Target
Actual Achievement
Deviation from Planned
Target to Actual
Achievement
Comment on deviations
Secure ICT systems and effective infrastructure plan
Percentage achievement of ICT systems standards as stipulated in the standards document
Achieved
85% achievement of ICT systems standards on average, during the course of the financial year
Produce 4 quarterly reports annually indicating 85% achievement of ICT systems standards on average, during the course of the financial year
Exceeded
20 of 23 application ICT systems standards achieved (20/23*100= 87%)
Target exceeded by 2%
More effort was made in meeting the target
ICT business applications development, enhancement and maintenance
Percentage of systems availability
Achieved
80% of activities in the plan implemented by the end of the financial year
Achieve an average of 85% systems availability on an annual basis, measured by reports produced quarterly as generated by the system
Exceeded
20 of 21 projects in the Business Application plan were achieved
(20/21*100=95%)
17 projects in the Business Application plan and 3 ad-hoc projects were achieved, namely, NPC Website, MPAT toolkit and the Evidence Mapping projects for the Research Unit which gives a total of 20 out of 21 projects, 95%
Target exceeded by 10%
Additional projects added to the Business Application plan due to the urgency

PAGE 29
4.1.5 Sub-programme: Internal Audit and Risk Management
STRATEGIC OBJECTIVE: TO PROMOTE GOOD CORPORATE GOVERNANCE PRACTICES AND MANAGEMENT
The outputs, performance indicators and the planned targets below are meant to achieve this objective as stated in the Strategic Plan and Annual Performance Plan reported on.
2015/2016 2014/2015 2015/2016
OutputsPerformance
Indicator
Actual Achievement
(where applicable)
Planned Annual Target
Actual Achievement
Deviation from Planned
Target to Actual
Achievement
Comment on deviations
Risk plan and quarterly risk management reports
Approved risk plan and risk management reports
- Conduct annual risk assessment/review and produce a 3-year rolling strategic risk management plan
Produce annual risk implementation plan and quarterly risk implementation reports
Partially Achieved
Annual risk assessment conducted
Risk report linked to 3 year rolling audit plans which were finalised and approved in June 2015
Assessments conducted after due date and only quarter 3 report served in the Risk Management Committee
Risk assessments finalised after due date and only 2 reports served in the Risk and Audit Committee
There were delays in the finalisation of assessments and meetings were cancelled due to competing demands
Management has remedied the situation by linking risk management meetings to coincide with executive management meetings
Internal audit plan and quarterly monitoring reports
Approved internal audit plan and quarterly monitoring reports
- Produce a 3-year rolling strategic internal audit plan and submit to the Audit Committee for approval by 30 June 2015
Quarterly audit implementation reports approved by the Executing Authority
Achieved
3-year rolling strategic plan was approved by the Audit Committee
Quarterly implementation reports we submitted to the Audit Committee
- -

PAGE 30
DEPARTMENT OF PLANNING, MONITORING AND EVALUATION Annual Report 2015/2016
Strategy to overcome areas of under performance
Most targets in Programme 1 were achieved. Those that were not achieved have most instances been achieved. The DPME is currently engaged in the restructuring exercise and a recruitment plan to reduce the vacancy rate has been developed.
Changes to planned targets
There were no changes to the planned targets during the financial year.
Linking performance with budgets
PROGRAMME 1
2015/16 2014/15
Final Appropriation
Actual Expenditure
(Over)/Under
Expenditure
Final Appropriation
Actual Expenditure
(Over)/Under Expenditure
R‘000 R‘000 R‘000 R‘000 R‘000 R‘000
Departmental Management 8 217 8 217 - 16 405 12 091 4 314
Corporate and Financial Services 38 466 38 466 - 40 822 40 631 191
Information Technology Support
26 006 26 006 - 25 648 25 289 359
Internal Auditing 3 138 3 138 - 2 976 2 904 72 Ministerial Support 36 045 36 045 - - - -
TOTAL 111 872 111 872 - 85 851 80 915 4 936
4.2 Programme 2: Outcomes Monitoring and Evaluation (OME)
Purpose: Coordination of government’s strategic agenda through the development of performance agreements between the President and Ministers, facilitation of the development of plans or delivery agreements for priority outcomes, and monitoring and evaluation of the implementation of the delivery agreements. The programme is made up of the following sub-programmes:
Sub-programmes:
§ Programme Management for OME
§ Outcomes Support
§ Evaluation and Research

PAGE 31
Strategic objectives, performance indicators, planned targets and actual achievements
The tables below highlight the strategic objectives and performance against outputs, performance indicators and the planned targets to achieve the above strategic oriented goal.
4.2.1 Sub-programme: Outcomes Support
STRATEGIC OBJECTIVES:
§ To pursue the development and advance the agenda of government through outcomes planning, monitoring and reporting
§ The outputs, performance indicators and the planned targets below are meant to achieve this objective as stated in the strategic plan and annual performance plan reported on.
2015/2016 2014/2015 2015/2016
OutputsPerformance
Indicator
Actual Achievement
(where applicable)
Planned Annual Target
Actual Achievement
Deviation from Planned
Target to Actual
Achievement
Comment on deviations
MTSF and delivery agreements
Number of revised MTSF chapters and/or related delivery agreement
- MTSF and/or delivery agreements reviewed when necessary
Not Applicable
No revisions were required for the 14 chapters for the period under view
All 14 outcomes not revised
Consultations with sector departments are ongoing to review the chapters where required
Outcome monitoring reports
Number of outcomes progress report submitted to Cabinet
- Produce 3 reports per outcome (42 reports) by 31 March 2016
Achieved
42 outcomes reports were produced and submitted to Cabinet for briefing by 31 March 2016
- -

PAGE 32
DEPARTMENT OF PLANNING, MONITORING AND EVALUATION Annual Report 2015/2016
STRATEGIC OBJECTIVES:
§ To pursue the development and advance the agenda of government through outcomes planning, monitoring and reporting
§ The outputs, performance indicators and the planned targets below are meant to achieve this objective as stated in the strategic plan and annual performance plan reported on.
2015/2016 2014/2015 2015/2016
OutputsPerformance
Indicator
Actual Achievement
(where applicable)
Planned Annual Target
Actual Achievement
Deviation from Planned
Target to Actual
Achievement
Comment on deviations
Summary outcomes report
Summary outcomes report submitted to Cabinet
- Produced 1 summary report on the implementation of the outcome (14 reports) by 31 March 2016
Exceeded
2 summary reports on the implementation of the 14 outcomes produced
1 report was a presentation to July Lekgotla and a narrative report was produced in the 4th quarter by 31 March 2016
A presentation was produced to report progress on the EXCO Lekgotla
There was a need for a report to be presented to the Lekgotla in July
Update Programme of Action (PoA) displaying progress reports against the MTSF targets for the outcomes
Number of outcomes reports displayed to the public on the PoA system
- 3 reports for each outcome on the PoA system (excluding outcomes for which the reports are classified) by 31 March 2016
Achieved
3 reports for each outcome on the PoA system were produced by 31 March 2016
- -

PAGE 33
STRATEGIC OBJECTIVES:
§ To pursue the development and advance the agenda of government through outcomes planning, monitoring and reporting
§ The outputs, performance indicators and the planned targets below are meant to achieve this objective as stated in the strategic plan and annual performance plan reported on.
2015/2016 2014/2015 2015/2016
OutputsPerformance
Indicator
Actual Achievement
(where applicable)
Planned Annual Target
Actual Achievement
Deviation from Planned
Target to Actual
Achievement
Comment on deviations
Outcomes data and reporting quality assessment report
Report on outcome data and reporting quality
- Produce one report on quality assessment of outcomes data and reporting by 31 March 2016 and present to the combined data forum
Not Achieved
Report on outcome data and reporting quality was not produced by 31 March 2016 and not presented to the combined data forum
Report not presented to the data forum
Quality assessment report was only presented to the combined data forum in March 2016. The report is scheduled to be presented to OME Branch in April 2016
Development indicators publication
Development indicators publication
- Development indicators produced and posted on DPME website by 31 March 2016
Achieved
Development indicators 2014 were produced, released in September 2015 and posted on DPME website by 31 March 2016
- -
Operation Phakisa Labs
Number of reports produced on Operation Phakisa Labs conducted
- Produce 2 Operation Phakisa Labs reports by 31 March 2016
Partially Achieved
2 Operation Phakisa Labs Ideal Clinic and ICT in Education reports were produced by 31 March 2016 but not uploaded on the website
Reports not uploaded on the website
There were delays in uploading the reports. Verification of data took longer than expected

PAGE 34
DEPARTMENT OF PLANNING, MONITORING AND EVALUATION Annual Report 2015/2016
STRATEGIC OBJECTIVES:
§ To pursue the development and advance the agenda of government through outcomes planning, monitoring and reporting
§ The outputs, performance indicators and the planned targets below are meant to achieve this objective as stated in the strategic plan and annual performance plan reported on.
2015/2016 2014/2015 2015/2016
OutputsPerformance
Indicator
Actual Achievement
(where applicable)
Planned Annual Target
Actual Achievement
Deviation from Planned
Target to Actual
Achievement
Comment on deviations
Operation Phakisa monitoring reports
Number of Operation Phakisa monitoring reports
- Produce 2 Operation Phakisa interactive dashboard reports per lab and publish on the Operation Phakisa website by 31 March 2016
Achieved
2 Operation Phakisa interactive dashboards for the health and ocean labs were produced and published on the Operation Phakisa website by 31 March 2016
- -

PAGE 35
4.2.2 Sub-programme: Advisory Services
STRATEGIC OBJECTIVES:
§ To provide advisory services and support to the executive
§ The outputs, performance indicators and the planned targets below are meant to achieve this objective as stated in the Strategic Plan and Annual Performance Plan reported on.
2015/2016 2014/2015 2015/2016
OutputsPerformance
Indicator
Actual Achievement
(where applicable)
Planned Annual Target
Actual Achievement
Deviation from Planned
Target to Actual
Achievement
Comment on deviations
Briefing notes and reports
Percentage of Cabinet memoranda and requests from political principals for specific reports for which briefing notes and reports are prepared
Achieved
An average of 85% of briefing notes (182 of 155) on Cabinet memoranda were produced throughout the quarters of the financial year
Provide quality advice to political principals by preparing briefing notes on 75% of Cabinet memoranda and 100% of requests from political principals
Achieved
An average of 75% of briefing notes (139 of 185) on Cabinet memoranda were produced throughout the quarters of the financial year
100% (3 of 3) briefings for which requests were made were prepared for Eersterus, Bushbuckridge and Nelson Mandela Bay to advice political principals
- -
Percentage of Presidency executive monitoring visits for which briefing notes and reports are prepared and submitted to the executive
- Produce an average of 80% of briefing notes on executive visits throughout the quarters of the financial year
Exceeded
An average of 93%
(27 of 29) briefing notes on executive visits were produced throughout the quarters of the financial year
Target exceeded by 13%
More requests required briefing notes were received and had to be complied with
No cancellation of the visits for which briefing notes were required

PAGE 36
DEPARTMENT OF PLANNING, MONITORING AND EVALUATION Annual Report 2015/2016
STRATEGIC OBJECTIVES:
§ To provide advisory services and support to the executive
§ The outputs, performance indicators and the planned targets below are meant to achieve this objective as stated in the Strategic Plan and Annual Performance Plan reported on.
2015/2016 2014/2015 2015/2016
OutputsPerformance
Indicator
Actual Achievement
(where applicable)
Planned Annual Target
Actual Achievement
Deviation from Planned
Target to Actual
Achievement
Comment on deviations
Briefing notes and reports
Number of briefing notes on mining towns and labour sending areas
- Produce 3 briefing notes on the status of mining towns and labour sending areas
Partially Achieved
3 briefing notes on the status of mining towns and labour sending areas were produced
2 briefing notes were produced and submitted to Minister and one was sent to the DG
1 Briefing sent to DG for discussion with Minister and therefore no evidence of submission to Minister was kept

PAGE 37
4.2.3 Sub-programme: Local Government Performance Assessment
STRATEGIC OBJECTIVES: TO PROVIDE SUPPORT TO IMPROVE PERFORMANCE OF LOCAL GOVERNMENT
The outputs, performance indicators and the planned targets below are meant to achieve this objective as stated in the Strategic Plan and Annual Performance Plan reported on.
2015/2016 2014/2015 2015/2016
OutputsPerformance
Indicator
Actual Achievement
(where applicable)
Planned Annual Target
Actual Achievement
Deviation from Planned
Target to Actual
Achievement
Comment on deviations
Local Government Management Improvement Model (LGMIM) and Assessment Tool
Approved LGMIM
Achieved
LGMIM was approved by the DG by end July 2014
LGMIM updated and approved by the DG by end September 2016
Achieved
LGMIM combined standards were approved. The target to be met by end of September 2016
- -
Assessment of the quality of management practices in municipalities
Number of LGMIM scorecards completed by the end of the financial year
Achieved
29 LGMIM scorecards were produced by the end of the financial year
25 Exceeded
30 LGMIM scorecards were produced by the end of the financial year
Target exceeded by 5 scorecards
More municipalities participated than anticipated
LGMIM report Number of LGMIM reports presented to Outcome 9 Implementation Forum
Achieved
1 LGMIM progress report produced and submitted to Outcome 9 Implementation Forum by end March 2015
Produce and submit 1 LGMIM report by 31 July 2016
Achieved
The LGMIM report for 2014/15 was produced and submitted to the Secretariat of the Outcome 9 Implementation Forum on 3 March 2016. The report could, however, not be presented at the Outcome 9 Implementation Forum but instead served at the Inter-Ministerial Task Team on Service Delivery on 29 March 2016
- -

PAGE 38
DEPARTMENT OF PLANNING, MONITORING AND EVALUATION Annual Report 2015/2016
4.2.4 Sub-programme: Social Economic Impact Assessment System (SEIAS)
STRATEGIC OBJECTIVES:
§ To support the Cabinet Office and other departments to implement the Social Economic Impact Assessment System (SEIAS)
The outputs, performance indicators and the planned targets below are meant to achieve this objective as stated in the Strategic Plan and Annual Performance Plan reported on.
2015/2016 2014/2015 2015/2016
OutputsPerformance
Indicator
Actual Achievement
(where applicable)
Planned Annual Target
Actual Achievement
Deviation from Planned
Target to Actual
Achievement
Comment on deviations
Annual report on extent to which major new laws and regulations underwent SEAIS, learning from the process, and where necessary, modified
SEIAS Annual Report approved by the DG
- Produce Annual Report showing support for 80% requested impact assessments
Partially Achieved
Annual Report produced showing 85% achievement against the targets (99/117*100=85%)
The report was not approved by the DG as per the target. The target was exceeded by 5%
The report was discussed with DG but there was an oversight for seeking his sign-off on the report
SEIAS is a new system which required the unit to be extensively involved. More efforts were placed in ensuring that all departments were responded to
PAGE 39
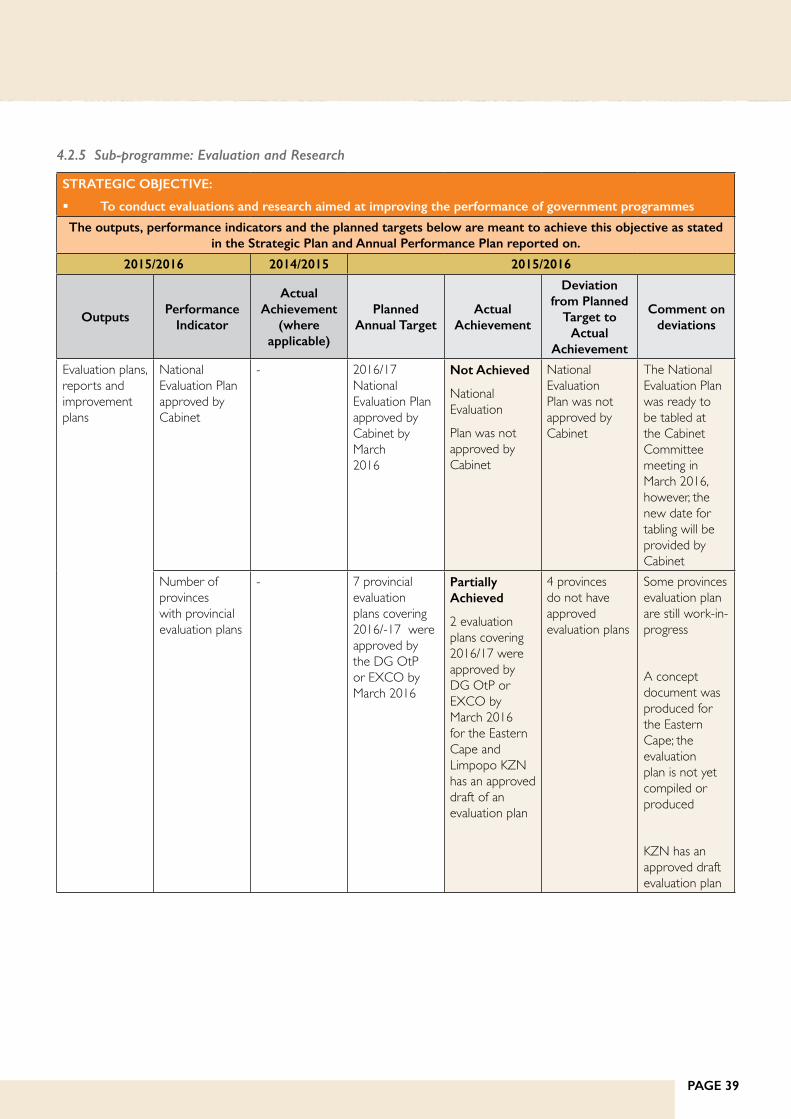
4.2.5 Sub-programme: Evaluation and Research
STRATEGIC OBJECTIVE:
§ To conduct evaluations and research aimed at improving the performance of government programmes
The outputs, performance indicators and the planned targets below are meant to achieve this objective as stated in the Strategic Plan and Annual Performance Plan reported on.
2015/2016 2014/2015 2015/2016
OutputsPerformance
Indicator
Actual Achievement
(where applicable)
Planned Annual Target
Actual Achievement
Deviation from Planned
Target to Actual
Achievement
Comment on deviations
Evaluation plans, reports and improvement plans
National Evaluation Plan approved by Cabinet
- 2016/17 National Evaluation Plan approved by Cabinet by March 2016
Not Achieved
National Evaluation
Plan was not approved by Cabinet
National Evaluation Plan was not approved by Cabinet
The National Evaluation Plan was ready to be tabled at the Cabinet Committee meeting in March 2016, however, the new date for tabling will be provided by Cabinet
Number of provinces with provincial evaluation plans
- 7 provincial evaluation plans covering 2016/-17 were approved by the DG OtP or EXCO by March 2016
Partially Achieved
2 evaluation plans covering 2016/17 were approved by DG OtP or EXCO by March 2016 for the Eastern Cape and Limpopo KZN has an approved draft of an evaluation plan
4 provinces do not have approved evaluation plans
Some provinces evaluation plan are still work-in-progress
A concept document was produced for the Eastern Cape; the evaluation plan is not yet compiled or produced
KZN has an approved draft evaluation plan
PAGE 40
DEPARTMENT OF PLANNING, MONITORING AND EVALUATION Annual Report 2015/2016
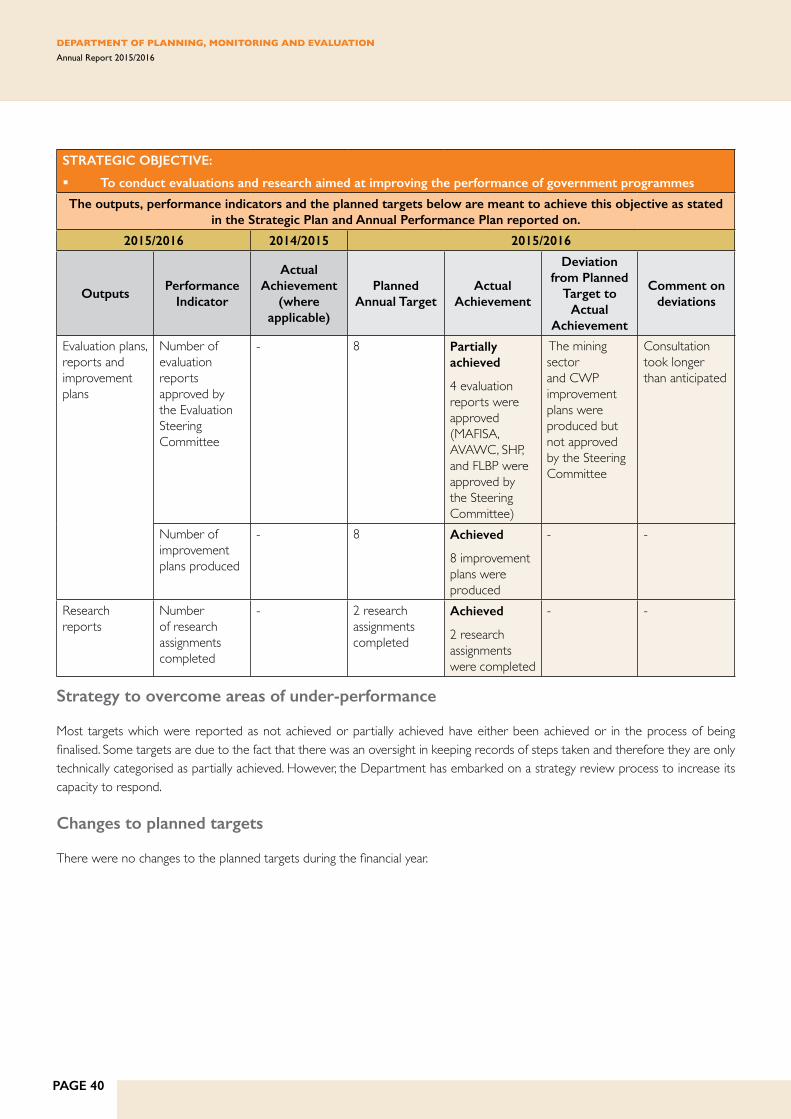
STRATEGIC OBJECTIVE:
§ To conduct evaluations and research aimed at improving the performance of government programmes
The outputs, performance indicators and the planned targets below are meant to achieve this objective as stated in the Strategic Plan and Annual Performance Plan reported on.
2015/2016 2014/2015 2015/2016
OutputsPerformance
Indicator
Actual Achievement
(where applicable)
Planned Annual Target
Actual Achievement
Deviation from Planned
Target to Actual
Achievement
Comment on deviations
Evaluation plans, reports and improvement plans
Number of evaluation reports approved by the Evaluation Steering Committee
- 8 Partially achieved
4 evaluation reports were approved (MAFISA, AVAWC, SHP, and FLBP were approved by the Steering Committee)
The mining sector and CWP improvement plans were produced but not approved by the Steering Committee
Consultation took longer than anticipated
Number of improvement plans produced
- 8 Achieved
8 improvement plans were produced
- -
Research reports
Number of research assignments completed
- 2 research assignments completed
Achieved
2 research assignments were completed
- -
Strategy to overcome areas of under-performance
Most targets which were reported as not achieved or partially achieved have either been achieved or in the process of being finalised. Some targets are due to the fact that there was an oversight in keeping records of steps taken and therefore they are only technically categorised as partially achieved. However, the Department has embarked on a strategy review process to increase its capacity to respond.
Changes to planned targets
There were no changes to the planned targets during the financial year.

PAGE 41
Linking performance with budgets
PROGRAMME 2
2015/16 2014/15
Final Appropriation
Actual Expenditure
(Over)/Under
Expenditure
Final Appropriation
Actual Expenditure
(Over)/Under
Expenditure
R‘000 R‘000 R‘000 R‘000 R‘000 R‘000
Programme Management for OME
2 390 2 390 - 3 182 3 182 -
Outcomes Support
64 228 63 701 527 63 788 58 630 5 158
Evaluation and Research
23 469 23 469 - 22 373 22 138 235
TOTAL 90 087 89 560 527 89 343 83 950 5 393
4.3 Programme 3: Institutional Performance Monitoring and Evaluation (IPM&E)
Purpose: To coordinate and support an integrated government-wide performance monitoring and evaluation system through policy development and capacity building. In addition, the purpose is to improve data access, data coverage, data quality and data analysis across government. The programme is arranged according to the following sub-programmes:
Sub-programmes:
§ Management Performance Monitoring and Support
§ Presidential Frontline Service Delivery Performance Monitoring Support
§ M&E policy and capacity building

PAGE 42
DEPARTMENT OF PLANNING, MONITORING AND EVALUATION Annual Report 2015/2016
Strategic objectives, performance indicators, planned targets and actual achievements
The tables below highlight the strategic objectives and performance against outputs, performance indicators and the planned targets to achieve the above strategic oriented goal.
4.3.1 Sub-programme: Management Performance Monitoring and Support
STRATEGIC OBJECTIVES:
§ To monitor the level of compliance by government departments with management practices
The outputs, performance indicators and the planned targets below are meant to achieve this objective as stated in the Strategic Plan and Annual Performance Plan reported on.
2015/2016 2014/2015 2015/2016
OutputsPerformance
Indicator
Actual Achievement
(where applicable)
Planned Annual Target
Actual Achievement
Deviation from Planned
Target to Actual
Achievement
Comment on deviations
Management Performance Assessment Tool (MPAT)
Updated MPAT standards
- MPAT updated and approved by the DG and launch by the end of August 2015
Achieved
MPAT 1.5 standards were reviewed and approved by the Acting DG on 12 June 2015 and launched on 3 August 2015
- -
Signed off MPAT assessments scores
Percentage of national and provincial departments whose HoDs have signed off their MPAT assessments on the MPAT system by the stipulated due date
- 90% of departments complete MPAT and have them signed off by their HoDs by 31 October
Exceeded
155 of 155 national and provincial departments (155/155*100=100%) completed MPAT assessment and signed off their HoDs by 31 October 2015
The target exceeded by 10%
The Offices of the Premier were capacitated to enable successful rollout provincially

PAGE 43
STRATEGIC OBJECTIVES:
§ To monitor the level of compliance by government departments with management practices
The outputs, performance indicators and the planned targets below are meant to achieve this objective as stated in the Strategic Plan and Annual Performance Plan reported on.
2015/2016 2014/2015 2015/2016
OutputsPerformance
Indicator
Actual Achievement
(where applicable)
Planned Annual Target
Actual Achievement
Deviation from Planned
Target to Actual
Achievement
Comment on deviations
Consolidated MPAT report
Consolidate MPAT report indicating percentage of national and provincial departments that achieve at least level 3 within 50% of the MPAT standards for each year of assessment (end September of each year) submitted to Cabinet
- MPAT report submitted to Cabinet by end June 2015
Partially Achieved
MPAT report was submitted on 24 August 2015 and was served in Cabinet on 1 September 2015
Submission of the MPAT report was done in July and not in June
There were no cluster meetings in June, cluster meetings were held in July, after the cluster meetings, parliament was on recess, hence. there were no Cabinet/Cabinet committees, until after the Cabinet Lekgotla in August

PAGE 44
DEPARTMENT OF PLANNING, MONITORING AND EVALUATION Annual Report 2015/2016
STRATEGIC OBJECTIVES:
§ To monitor the level of compliance by government departments with management practices
The outputs, performance indicators and the planned targets below are meant to achieve this objective as stated in the Strategic Plan and Annual Performance Plan reported on.
2015/2016 2014/2015 2015/2016
OutputsPerformance
Indicator
Actual Achievement
(where applicable)
Planned Annual Target
Actual Achievement
Deviation from Planned
Target to Actual
Achievement
Comment on deviations
MPAT good practice case studies
Number of good practice case studies
- 8 case studies on good practice departments by end June 2015
Partially Achieved
6 case studies on good practice departments were produced by June 2015
The target was missed by 2 case studies
Only 6 sessions out of the 8 were held. The two remaining sessions were going to be part of the capacity development for the HoD Performance Management and Development System (PMDS) workshops (for provincial and national) and due to the delay in the approval of the new PMDS Policy for HoDs, these 2 workshops did not materialise
Forum of South African Directors General (FOSAD) monitoring reports
Number of monitoring reports submitted to FOSAD Secretariat
- 3 monitoring reports were submitted to FOSAD Secretariat 3 times a year
Achieved
3 monitoring reports were submitted to FOSAD Secretariat in the financial year
- -

PAGE 45
4.3.2 Sub-programme: Presidential Frontline Service Delivery Performance Monitoring Support
STRATEGIC OBJECTIVES:
§ To monitor the quality of services provided by government to citizen at institution and facility levels
The outputs, performance indicators and the planned targets below are meant to achieve this objective as stated in the Strategic Plan and Annual Performance Plan reported on.
2015/2016 2014/2015 2015/2016
OutputsPerformance
Indicator
Actual Achievement
(where applicable)
Planned Annual Target
Actual Achievement
Deviation from Planned
Target to Actual
Achievement
Comment on deviations
Frontline Service Delivery Monitoring (FSDM)
Revised FSDM set of programmes, implementation tools and guidelines
- Revised FSDM programme: Operational Guide Framework placed on the DPME website by 31 March 2016
Achieved
Operational Guide Framework developed and published on the DPME website by 31 March 2016
- -
Number of new facilities monitored, resulting in a site monitoring report
- 90 new facilities monitored and passed quality assurance with site monitoring reports captured on the M-drive by 31 March 2016
Exceeded
97 new facilities were monitored and passed quality assurance and site monitoring reports for these facilities were captured on the M-drive by 31 March 2016
Target exceeded by 7
Provinces requested additional facilities to be monitored and this contributed to the achieved 97 instead of the planned 90
Number of facilities for which improvements monitoring was conducted
- 120 Achieved
120 facilities for which improvements monitoring was conducted
- -

PAGE 46
DEPARTMENT OF PLANNING, MONITORING AND EVALUATION Annual Report 2015/2016
STRATEGIC OBJECTIVES:
§ To monitor the quality of services provided by government to citizen at institution and facility levels
The outputs, performance indicators and the planned targets below are meant to achieve this objective as stated in the Strategic Plan and Annual Performance Plan reported on.
2015/2016 2014/2015 2015/2016
OutputsPerformance
Indicator
Actual Achievement
(where applicable)
Planned Annual Target
Actual Achievement
Deviation from Planned
Target to Actual
Achievement
Comment on deviations
Frontline Service Delivery Monitoring (FSDM)
Percentage of facilities that show improvement for which improvements monitoring have been done
- 70% of service delivery facilities for which improvements monitoring has been done, have an improvement in facility average score
Partially Achieved
59% of facilities show improvement as reflected in the preliminary Annual Report (71/120*100=59%)
Of the 120 facilities monitored for improvement, 59% (71) of the facilities have improved, 39%(47) have regressed and
2%( 2) have not changed
Targeted performance less by 11%
This outcome does not only depend on the FSDM programme but facilities management in implementing the improvement plans. DPME does not have direct control over this
Frontline Service Delivery Monitoring (FSDM)
FSDM findings reports
- FSDM national overview report submitted to Cabinet by end of June of 2015, covering the visits from the previous year
FSDM findings mid-year report for each year’s visits produced and distributed to 9 provinces and 8 departments by 30 November 2015
Partially Achieved
FSDM national overview report was submitted through the Cabinet cluster system on 21 May 2016 and served in Cabinet meeting on 1 September 2015
FSDM findings mid-year reports for each year’s visits were produced and distributed to 8 provinces and 8 departments by 30 November 2015
Eastern Cape omitted from the mailing list
Findings related to the Eastern Cape were discussed with the province but they were omitted from the mailing list
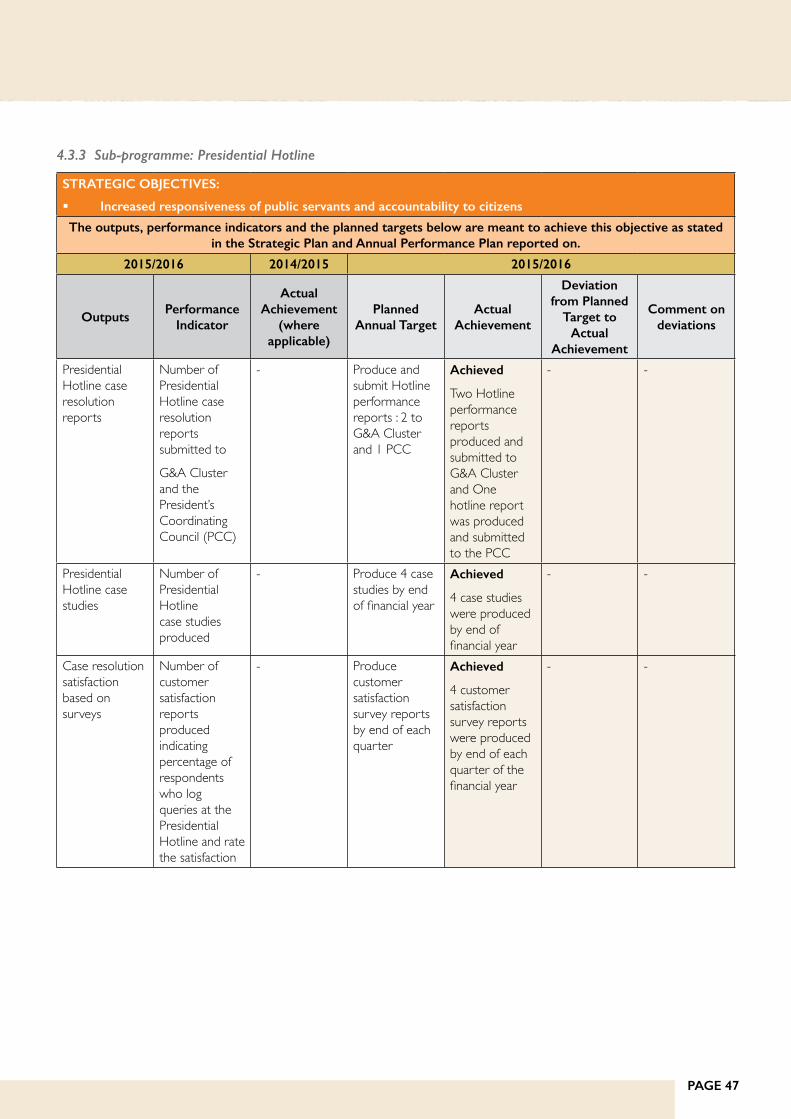
PAGE 47
4.3.3 Sub-programme: Presidential Hotline
STRATEGIC OBJECTIVES:
§ Increased responsiveness of public servants and accountability to citizens
The outputs, performance indicators and the planned targets below are meant to achieve this objective as stated in the Strategic Plan and Annual Performance Plan reported on.
2015/2016 2014/2015 2015/2016
OutputsPerformance
Indicator
Actual Achievement
(where applicable)
Planned Annual Target
Actual Achievement
Deviation from Planned
Target to Actual
Achievement
Comment on deviations
Presidential Hotline case resolution reports
Number of Presidential Hotline case resolution reports submitted to
G&A Cluster and the President’s Coordinating Council (PCC)
- Produce and submit Hotline performance reports : 2 to G&A Cluster and 1 PCC
Achieved
Two Hotline performance reports produced and submitted to G&A Cluster and One hotline report was produced and submitted to the PCC
- -
Presidential Hotline case studies
Number of Presidential Hotline case studies produced
- Produce 4 case studies by end of financial year
Achieved
4 case studies were produced by end of financial year
- -
Case resolution satisfaction based on surveys
Number of customer satisfaction reports produced indicating percentage of respondents who log queries at the Presidential Hotline and rate the satisfaction
- Produce customer satisfaction survey reports by end of each quarter
Achieved
4 customer satisfaction survey reports were produced by end of each quarter of the financial year
- -

PAGE 48
DEPARTMENT OF PLANNING, MONITORING AND EVALUATION Annual Report 2015/2016
4.3.4 Sub-programme: Citizen-Based Monitoring
STRATEGIC OBJECTIVES:
§ To promote active citizenry and leadership
The outputs, performance indicators and the planned targets below are meant to achieve this objective as stated in the Strategic Plan and Annual Performance Plan reported on.
2015/2016 2014/2015 2015/2016
OutputsPerformance
Indicator
Actual Achievement
(where applicable)
Planned Annual Target
Actual Achievement
Deviation from Planned
Target to Actual
Achievement
Comment on deviations
Increased utilisation and impact of routine citizen feedback mechanisms at facility-level
Number of facilities where citizen-based monitoring (CBM) is implemented
- CBM implemented in 10 new facilities per annum and reports produced for each of the sites
Exceeded Achieved
The CBM was implemented in 16 new facilities and reports produced for each of the sites
CBM was implemented in 6 additional facilities
More facilities enrolled than planned
Number of CBM knowledge sharing events
- 2 CBM learning events convened
Evaluation of CBM programme completed
Achieved
2 CBM learning events were convened in September 2015 and February 2016 on the draft implementation evaluation report
Evaluation of the CBM programme was completed
- -

PAGE 49
4.3.5 Sub-programme: M&E policy and capacity building
STRATEGIC OBJECTIVES:
§ To lead PM&E capacity development and knowledge management initiatives and to facilitate better use of PM&E knowledge across government
The outputs, performance indicators and the planned targets below are meant to achieve this objective as stated in the Strategic Plan and Annual Performance Plan reported on.
2015/2016 2014/2015 2015/2016
OutputsPerformance
Indicator
Actual Achievement
(where applicable)
Planned Annual Target
Actual Achievement
Deviation from Planned
Target to Actual
Achievement
Comment on deviations
Integrated PM&E capacity development strategy and implementation
Approved integrated PM&E capacity development strategy and implementation plan
- Revised planning and M&E capacity development strategy and implementation plan and submit to DDG:IPME for approval
Achieved
The integrated strategy and implementation of PM&E capacity development plan was developed and approved by the acting DDG by 30 April 2015
- -
Progress report on implementation
Percentage of targets against the targets in the integrated capacity development implementation plan achieved
- Produce quarterly reports showing achievement of at least 80% of targets in the capacity development implementation plan
Achieved
92 % of targets in the capacity development implementation plan were achieved (22/24*100=92%)
Target exceeded by 12%
More activities were undertaken than targeted
Strategy to overcome areas of under performance
Most targets in this programme were either achieved or exceeded. The one target not achieved is reliant on the co-operation of the facilities managers. The DPME will continue to engage them for improvement monitoring.
Changes to planned targets
There were no changes to the planned targets during the financial year.

PAGE 50
DEPARTMENT OF PLANNING, MONITORING AND EVALUATION Annual Report 2015/2016
Linking performance with budgets
PROGRAMME 3
2015/16 2014/15
Final Appropriation
Actual Expenditure
(Over)/Under
Expenditure
Final Appropriation
Actual Expenditure
(Over)/Under
Expenditure
(R'000) (R'000) (R'000) (R'000) (R'000) (R'000)
Programme Management for IPM&E
2 086 2 086 - 2 413 1 954 459
Management Performance Monitoring & Support
13 054 13 054 - 15 467 14 771 696
Presidential FSDM & Support
38 759 38 759 - 37 887 37 887 -
M&E Policy and Capacity Building
6 727 6 727 - 7 699 7 699 -
TOTAL 60 626 60 626 - 63 466 62 311 1 155
4.4 Programme 4: National Planning Commission (NPC)
Purpose: To develop the country’s long-term vision and national strategic plan and contribute towards better outcomes in government through better planning, better long-term plans, greater policy coherence and clear articulation of long-term goals and aspirations.
Sub-programmes:
§ NPC Secretariat

PAGE 51
Strategic objectives, performance indicators, planned targets and actual achievements
The tables below highlight the strategic objectives and performance against outputs, performance indicators and the planned targets to achieve the above strategic oriented goal.
4.4.1 Sub-programme: Research and Policy Services
STRATEGIC OBJECTIVES:
§ To facilitate planning, research and policy development to support implementation of the NDP and the long-term planning framework
The outputs, performance indicators and the planned targets below are meant to achieve this objective as stated in the Strategic Plan and Annual Performance Plan reported on.
2015/2016 2014/2015 2015/2016
OutputsPerformance
Indicator
Actual Achievement
(where applicable)
Planned Annual Target
Actual Achievement
Deviation from Planned
Target to Actual
Achievement
Comment on deviations
Research projects related to planning undertaken
Number of research projects commissioned or undertaken as requested by NPC
- 3 research projects commissioned by the end of financial year (Demographic, Social Protection and Education)
National Income Dynamic Studies (NIDS) wave 4 results produced by end of financial year
Exceeded
A total of 6 research projects commissioned and/or undertaken by the end of financial year (Demographic, Social Protection, Education, Integrated Water Plan, Urban Innovation and National Minimum Wage report)
NIDS wave 4 studies completed
3 research projects commissioned/completed by the end of the financial year
2 research reports, namely, Urban Innovation and National Minimum Wage were commissioned in the previous financial year and completed in the financial year reported on
The Integrated Water Plan was not plan for but became a priority

PAGE 52
DEPARTMENT OF PLANNING, MONITORING AND EVALUATION Annual Report 2015/2016
STRATEGIC OBJECTIVES:
§ To facilitate planning, research and policy development to support implementation of the NDP and the long-term planning framework
The outputs, performance indicators and the planned targets below are meant to achieve this objective as stated in the Strategic Plan and Annual Performance Plan reported on.
2015/2016 2014/2015 2015/2016
OutputsPerformance
Indicator
Actual Achievement
(where applicable)
Planned Annual Target
Actual Achievement
Deviation from Planned
Target to Actual
Achievement
Comment on deviations
Sector specific plans
Number of sector specific plans supported
- Support provided to the DRDLR on the development of a sector plan, namely: Draft Spatial Development Framework (NSDF) developed by the end of March 2016
Partially Achieved
A progress reports on NSDF was produced by March 2016
Draft report was not produced
Consultation with stakeholders took longer than expected
Annual Report on stakeholder engagement and the work of the NPC
Annual Report detailing the activities of the NPC and stakeholder engagement on the NDP
- Produce Annual Report on stakeholder engagements and the work of the NPC on the NDP and submit to the NPC by end of March 2016
Partially Achieved
Annual Report on stakeholder engagements produced by end of March 2016 and discussed with NPC
Evidence for submission to the NPC was not kept
There was an oversight of keeping the records on the discussion on the report. The report is a compilation of information on all stakeholder engagement reports which were submitted as part of the Secretariat report to the commission whenever it met

PAGE 53
4.4.2 Sub-programme: Government Performance Information
STRATEGIC OBJECTIVES:
§ To strengthen and institutionalise the medium-term planning frameworks
The outputs, performance indicators and the planned targets below are meant to achieve this objective as stated in the Strategic Plan and Annual Performance Plan reported on.
2015/2016 2014/2015 2015/2016
OutputsPerformance
Indicator
Actual Achievement
(where applicable)
Planned Annual Target
Actual Achievement
Deviation from Planned
Target to Actual
Achievement
Comment on
deviations
Revised planning framework
An evaluation report on the current planning framework leading to a revised planning framework
- Produce 1 evaluation report by the end of the financial year
Partially Achieved
Literature review has been completed and submitted to DPME by the service provider by the end of the financial year
An evaluation report on the current planning framework leading to a revised planning framework was not completed by the end of financial year
It was difficult to find a suitable service provider to conduct this evaluation and was therefore delayed
Assessment reports on the second draft annual performance Plan and/or strategic lan
Number assessment reports on the second draft APP provided to national departments
- Produce 39 assessment reports by 31 January 2016
Exceeded
43 assessment reports were produce by 31 January 2016
Target exceeded by 4
Additional 4 departments submitted their plans to DPME for assessments
Number assessment reports on the second draft APP provided to the Offices of the Premier
- Produce 9 assessment reports by 31 January 2016
Achieved
9 assessment reports were produced by 31 January 2016
- -
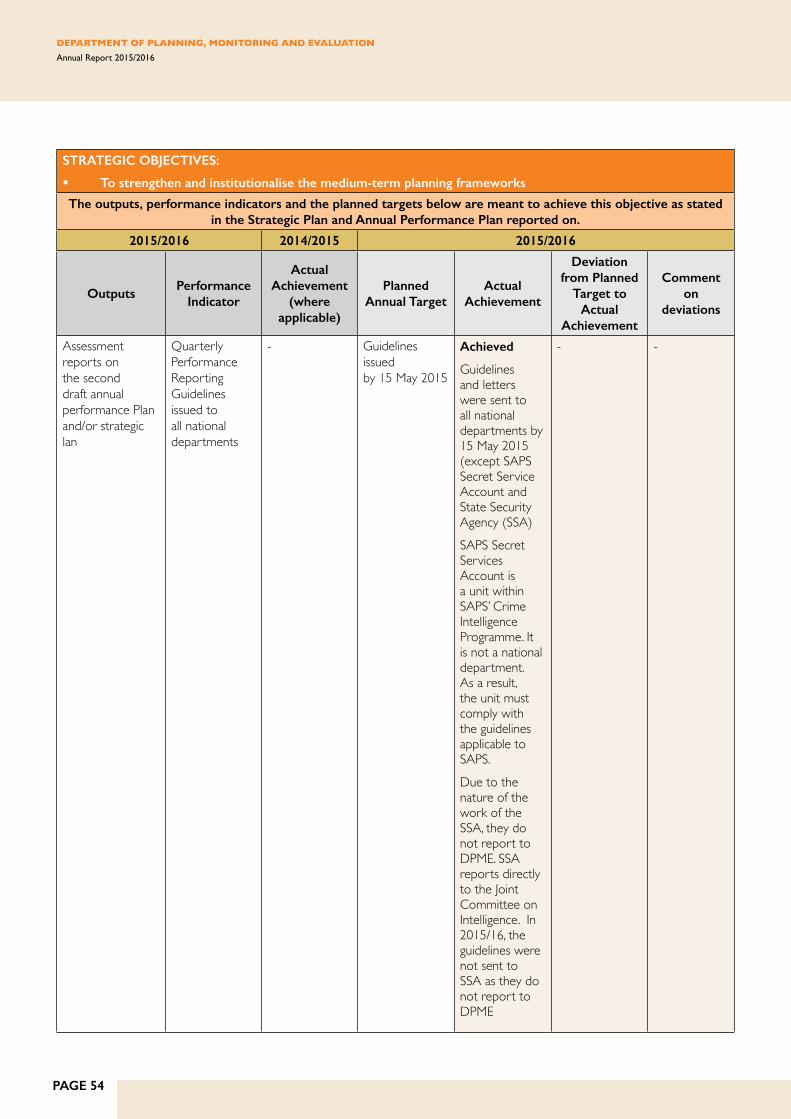
PAGE 54
DEPARTMENT OF PLANNING, MONITORING AND EVALUATION Annual Report 2015/2016
STRATEGIC OBJECTIVES:
§ To strengthen and institutionalise the medium-term planning frameworks
The outputs, performance indicators and the planned targets below are meant to achieve this objective as stated in the Strategic Plan and Annual Performance Plan reported on.
2015/2016 2014/2015 2015/2016
OutputsPerformance
Indicator
Actual Achievement
(where applicable)
Planned Annual Target
Actual Achievement
Deviation from Planned
Target to Actual
Achievement
Comment on
deviations
Assessment reports on the second draft annual performance Plan and/or strategic lan
Quarterly Performance Reporting Guidelines issued to all national departments
- Guidelines issued by 15 May 2015
Achieved
Guidelines and letters were sent to all national departments by 15 May 2015 (except SAPS Secret Service Account and State Security Agency (SSA)SAPS Secret Services Account is a unit within SAPS’ Crime Intelligence Programme. It is not a national department. As a result, the unit must comply with the guidelines applicable to SAPS. Due to the nature of the work of the SSA, they do not report to DPME. SSA reports directly to the Joint Committee on Intelligence. In 2015/16, the guidelines were not sent to SSA as they do not report to DPME
- -
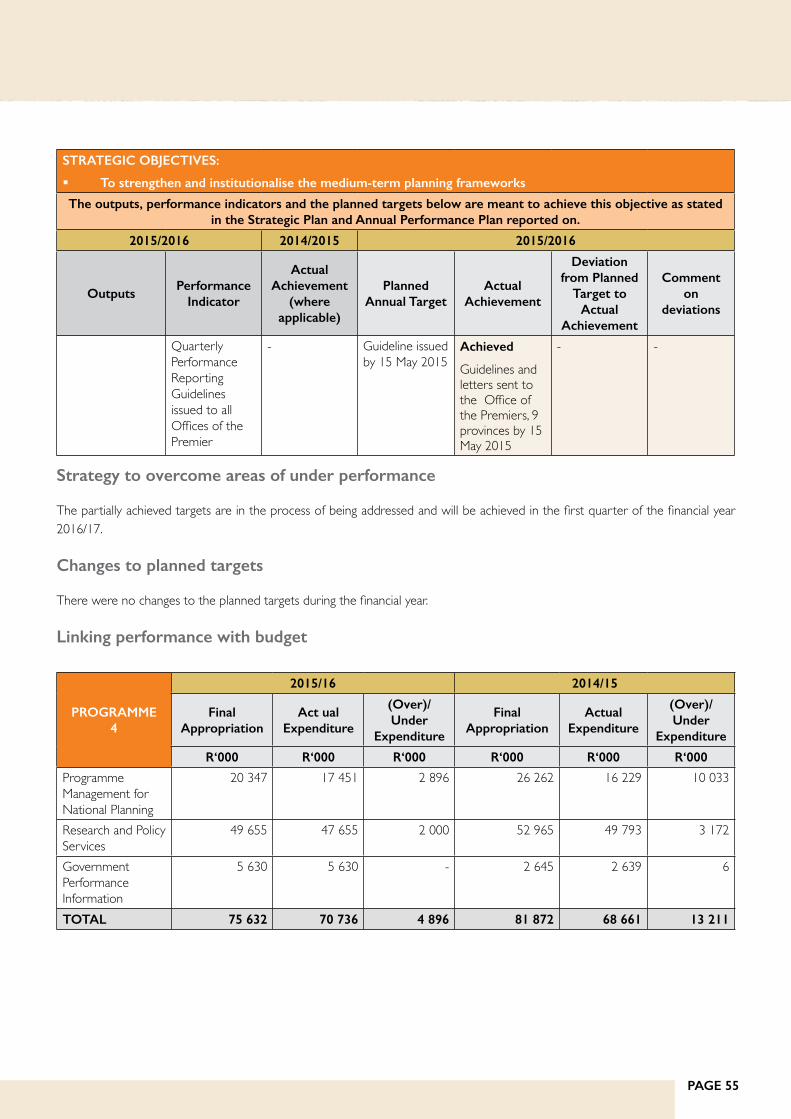
PAGE 55
STRATEGIC OBJECTIVES:
§ To strengthen and institutionalise the medium-term planning frameworks
The outputs, performance indicators and the planned targets below are meant to achieve this objective as stated in the Strategic Plan and Annual Performance Plan reported on.
2015/2016 2014/2015 2015/2016
OutputsPerformance
Indicator
Actual Achievement
(where applicable)
Planned Annual Target
Actual Achievement
Deviation from Planned
Target to Actual
Achievement
Comment on
deviations
Quarterly Performance Reporting Guidelines issued to all Offices of the Premier
- Guideline issued by 15 May 2015
Achieved
Guidelines and letters sent to the Office of the Premiers, 9 provinces by 15 May 2015
- -
Strategy to overcome areas of under performance
The partially achieved targets are in the process of being addressed and will be achieved in the first quarter of the financial year 2016/17.
Changes to planned targets
There were no changes to the planned targets during the financial year.
Linking performance with budget
PROGRAMME 4
2015/16 2014/15
Final Appropriation
Act ual Expenditure
(Over)/Under
Expenditure
Final Appropriation
Actual Expenditure
(Over)/Under
Expenditure
R‘000 R‘000 R‘000 R‘000 R‘000 R‘000
Programme Management for National Planning
20 347 17 451 2 896 26 262 16 229 10 033
Research and Policy Services
49 655 47 655 2 000 52 965 49 793 3 172
Government Performance Information
5 630 5 630 - 2 645 2 639 6
TOTAL 75 632 70 736 4 896 81 872 68 661 13 211
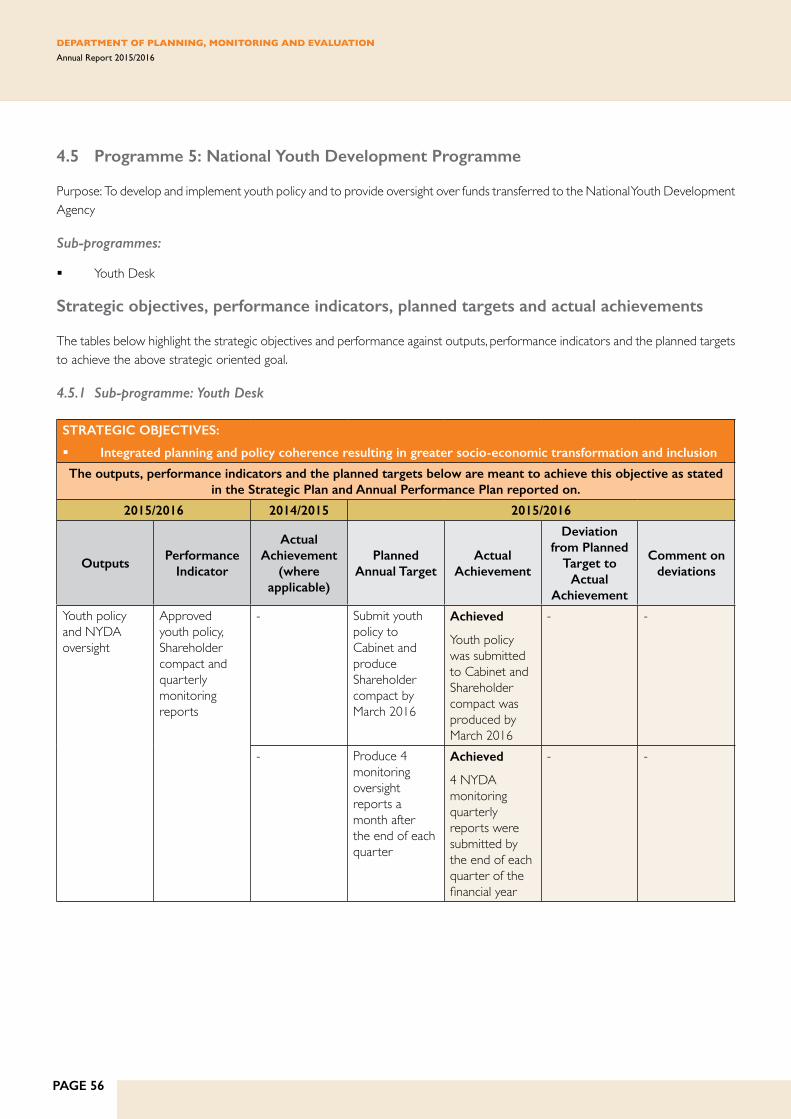
PAGE 56
DEPARTMENT OF PLANNING, MONITORING AND EVALUATION Annual Report 2015/2016
4.5 Programme 5: National Youth Development Programme
Purpose: To develop and implement youth policy and to provide oversight over funds transferred to the National Youth Development Agency
Sub-programmes:
§ Youth Desk
Strategic objectives, performance indicators, planned targets and actual achievements
The tables below highlight the strategic objectives and performance against outputs, performance indicators and the planned targets to achieve the above strategic oriented goal.
4.5.1 Sub-programme: Youth Desk
STRATEGIC OBJECTIVES:
§ Integrated planning and policy coherence resulting in greater socio-economic transformation and inclusion
The outputs, performance indicators and the planned targets below are meant to achieve this objective as stated in the Strategic Plan and Annual Performance Plan reported on.
2015/2016 2014/2015 2015/2016
OutputsPerformance
Indicator
Actual Achievement
(where applicable)
Planned Annual Target
Actual Achievement
Deviation from Planned
Target to Actual
Achievement
Comment on deviations
Youth policy and NYDA oversight
Approved youth policy, Shareholder compact and quarterly monitoring reports
- Submit youth policy to Cabinet and produce Shareholder compact by March 2016
Achieved
Youth policy was submitted to Cabinet and Shareholder compact was produced by March 2016
- -
- Produce 4 monitoring oversight reports a month after the end of each quarter
Achieved
4 NYDA monitoring quarterly reports were submitted by the end of each quarter of the financial year
- -
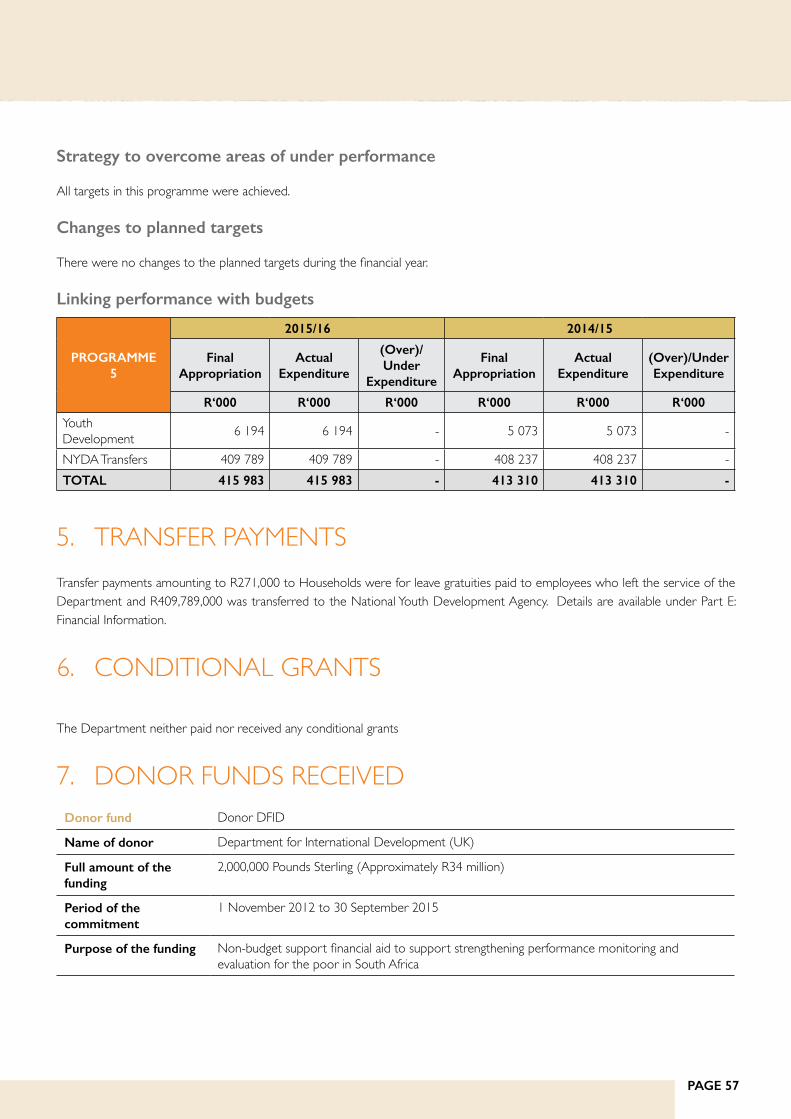
PAGE 57
Strategy to overcome areas of under performance
All targets in this programme were achieved.
Changes to planned targets
There were no changes to the planned targets during the financial year.
Linking performance with budgets
PROGRAMME 5
2015/16 2014/15
Final Appropriation
Actual Expenditure
(Over)/Under
Expenditure
Final Appropriation
Actual Expenditure
(Over)/Under Expenditure
R‘000 R‘000 R‘000 R‘000 R‘000 R‘000
Youth Development 6 194 6 194 - 5 073 5 073 -
NYDA Transfers 409 789 409 789 - 408 237 408 237 -TOTAL 415 983 415 983 - 413 310 413 310 -
5. TRANSFER PAYMENTSTransfer payments amounting to R271,000 to Households were for leave gratuities paid to employees who left the service of the Department and R409,789,000 was transferred to the National Youth Development Agency. Details are available under Part E: Financial Information.
6. CONDITIONAL GRANTS
The Department neither paid nor received any conditional grants
7. DONOR FUNDS RECEIVED Donor fund Donor DFID
Name of donor Department for International Development (UK)
Full amount of the funding
2,000,000 Pounds Sterling (Approximately R34 million)
Period of the commitment
1 November 2012 to 30 September 2015
Purpose of the funding Non-budget support financial aid to support strengthening performance monitoring and evaluation for the poor in South Africa

PAGE 58
DEPARTMENT OF PLANNING, MONITORING AND EVALUATION Annual Report 2015/2016
Expected outputs § Front Line Service Delivery (FLSD) monitoring and reporting systems developed and operational (including service delivery site visits)
§ Citizen-Based Service Delivery Monitoring (CBM) system developed and piloted (including citizens-hotline)
§ Outcomes evaluation system for government programmes developed and operational
§ DPME strategic M&E support facility is operational (across departments and provinces)
Actual outputs achieved
Targets under the 4 expected outputs were either achieved or in progress at 31 March 2016
Amount received in current period
R27,892,000
Amount spent by the Department
R25,454,000
Reasons for the funds unspent
Projects not concluded
Monitoring mechanism by the donor
Quarterly reporting
Donor fund Donor DFAT-D (former CIDA)
Name of donor Department of Foreign Affairs, Trade and Development. Canadian Government (DFAT-D)
Full amount of the funding
R18,000,000 (Approximately 2,000,000 Canadian Dollars)
Period of the commitment
5 Years (from 2013/14 to 17/18 financial years)
Purpose of the funding Supporting the implementation of building a capable state project
Expected outputs Support for Management Performance Assessment Tool, Local Government Management Improvement Model, Operations Management Learning and M&E Capacity building
Actual outputs achieved
Targets under the expected outputs were either achieved or in progress at 31 March 2016
Amount received in current period
R2,543,000
Amount spent by the Department
R2,543,000
Reasons for the funds unspent
N/A
Monitoring mechanism by the donor
Quarterly reporting
Donor fund PSPPD
Name of donor European Union
Full amount of the funding
10, 000,000.00 Euro's

PAGE 59
Period of the commitment
1 July 2016 to 31 December 2016
Purpose of the funding The PSPPD II project purpose is to contribute to the overall objective of the programme through improving evidence-based policy making and implementation on poverty and inequality at the national and provincial level.
PSPPD utilises the evidence-based policy-making approach i.e. assisting policy-makers and researchers in systematically harnessing the best available evidence to inform the policy-making and implementation processes, applying this to social and economic issues.
Expected outputs 13 Research Grants awarded
3 Low Value Grants completed.
Actual outputs achieved
13 Grant Contracts signed.
3 Low Value Grants Outputs i.e. per project (1X Executive Summary, 1X Policy Brief, 1 X Research Paper).
Amount received in current period
R16,597,000
Amount spent by the Department
R11,777,000
Reasons for the funds unspent
Equipment was not purchased.
Monitoring mechanism by the donor
Annual External Audits are conducted by Deloitte Brussels.Reviews might be conducted by the Donor.
Donor fund GIZName of donor German GovernmentFull amount of the funding
151,526 Euros
Period of the commitment
1 March 2015 to 31 December 2016
Purpose of the funding Governance Support ProgrammeExpected outputs Recruitment of an integrated national expert to provide technical support to DPME’s Programme
of Action unitActual outputs achieved Expert appointedAmount received in current period
R804,000
Amount spent by the Department
R864,000
Reasons for the funds unspent
N/A
Monitoring mechanism by the donor
Quarterly reporting
8. Capital Investment, Maintenance and Asset The Department does not control any fixed capital assets. Additional office accommodation is leased for the Department by the Department of Public Works on a cost-recovery basis. Details about the acquisition and disposal of assets are contained in Part E: Financial Information.

PAGE 60
DEPARTMENT OF PLANNING, MONITORING AND EVALUATION Annual Report 2015/2016
PART C

PAGE 61
1. INTRODUCTIONThe Department of Planning of Monitoring commits to upholding good corporate governance as espoused in the King III report and the Public Finance Management Act. We strive to promote good management practices in the areas of Risk Management, Fraud Prevention, Ethics, Procurement and Good Governance as well as to safeguard the department against any kind of misconduct or fraud.
2. FRAUD AND CORRUPTION The Department has an approved Fraud Prevention Policy, Fraud Prevention and Response Strategy as well as Whistle Blowing Policy. Fraud awareness was conducted by means of screens-popups and integrated into departmental induction programmes. A web-based reporting mechanism for any suspicious or fraudulent activities have been created to provide whistle blowers a platform to report. During the period under review, there were no cases of fraud and corruption reported. Although the Department is not immune from fraud and corruption, the current controls are adequate to detect and prevent fraud and corruption within the Department.
3. MINIMISING CONFLICT OF INTERESTThe Department has established control mechanisms to deal with conflicts of interest. Firstly, all members serving in decision-making committees are required to disclose their interests. This helps to create awareness for members to be honest in their dealing with matters that have the potential to create conflicts of interest. Secondly, appointed members sign a declaration to indicate any conflict of interest that may arise in any matter that they deal with. Thirdly, in awarding tenders to successful bidders, the Department undertakes verification processes to determine if any departmental officials have any association with the service providers, through the Companies and Intellectual Property Registration Office. Members of senior management are required to disclose their business interests and this is verified against the Companies and Intellectual Property Registration Office records. All employees are required to apply to perform remunerative work outside of their employment as per the requirements of the Public Service Act.
4. CODE OF CONDUCT The Department develops the awareness of all new employees of the Code of Conduct for the Public Service during induction programmes, which happens on a quarterly basis. All employees have signed the Departmental Code of Ethics and Conduct. A SCM code of conduct has also been signed by officials in the SCM unit as well as by all Bid Adjudication Committee members. Processes are in place to address any breaches through the Disciplinary Code for the Public Service, the Fraud and Corruption Strategy and Plan as well as the Whistle Blowing Policy.
PART C GOVERNANCE

PAGE 62
DEPARTMENT OF PLANNING, MONITORING AND EVALUATION Annual Report 2015/2016
5. HEALTH, SAFETY AND ENVIRONMENTAL ISSUESThere is currently no health, safety and environmental issues impacting negatively on the operations of the Department.
6. PORTFOLIO COMMITTEEDuring the period under review, the Department appeared before the Portfolio Committee six times as follows:
§ On 9 September 2015, the Department presented its first quarter performance report
§ On 14 October 2015, the Department appeared before the Portfolio Committee to present its Annual Report 2014/15
§ On 4 November 2015, the Department briefed the Portfolio Committee on the departmental frontline service delivery programme
§ On 17 November 2015 and 24 February 2016, the Department was invited t to brief the Portfolio Committee on MPAT programmes
§ On 9 March 2016, the Department briefed the Portfolio Committee on it 3rd quarter performance report
§ During its appearances, there were no major issues raised with the performance of the Department. The committee, however, raised concerns about the capacity of the Department to carry out its mandates. The Department was also urged to speed up the process of filling vacancies as they became available.
7. SCOPA RESOLUTIONSNone.
8. PRIOR MODIFICATIONS TO AUDIT REPORTSThere were no matters that gave rise to a qualification, disclaimer, adverse opinion and matters of non-compliance in the previous audit report.
9. INTERNAL CONTROL UNITAn Internal Control unit was established during the 2014/15 financial year. The unit was unable to fully develop its role in the Department due to staff shortages in the Finance and SCM units and officials from the Internal Control unit having to perform financial accounting and SCM support functions.
10. INTERNAL AUDIT UNITThe Department has an established and independent Internal Audit Function which reports functionally to the Audit Committee and administratively to the Accounting Officer. Internal Audit is tasked with the responsibility of assisting DPME to accomplish its objectives and to provide reasonable assurance on the adequacy, effectiveness, and efficiency of internal control, risk management, and governance. The Internal Audit function has direct access to the Audit Committee and regular meetings are held with the chairperson of the audit committee.

PAGE 63
A co-sourced audit partnership was adopted with KPMG to enhance the internal audit capacity and ensure adequate and effective audit coverage of all critical areas within DPME. The Co-Sourced partnership lapsed during 2015/16 and management was in the process of sourcing a potential service provider during the latter part of the financial year.
The Internal Audit unit successfully completed its approved Annual Internal Audit Plan to the satisfaction of the Audit Committee.
11. RISK MANAGEMENT FUNCTION The Department has established an effective, efficient and transparent system of risk management as required by the prescripts and legislation. Risk Management Policy and Strategy were approved and implemented throughout the year. Risk assessments were conducted for both strategic and operational risks for all the departmental programmes. Consolidated risk registers were presented to the both Risk Management Committee and Audit Committee for approved and implementation. Quarterly risk management committee meetings were convened to oversee the implementation of improvement plans and escalated to the Audit
However, the External Quality Assurance Review identified the need for the function to be separated from Internal Audit and the appointment of an independent external chairperson of the Risk Committee to strengthen the governance structures in the Department. Executive management resolved that the Risk Committee will be chaired by the Director General as risk management has not matured to the point where an external chairperson is appointed.Currently, the Department is in the process of reviewing its organisational structure to build capacity and the function of risk management will be located to the planning and governance function as recommended by the Executive Management Committee.
12. AUDIT COMMITTEE REPORTThe Audit Committee was established and constituted in terms of Section 77 of the Public Finance Management Act and Treasury Regulations. The Audit Committee has a total of five (5) Non-Executive members, as well as a representative of the Auditor-General South Africa as a standing invitee.
The Audit Committee has during the financial year provided oversight on the expanded mandate of DPME through constant engagements with management. It has encouraged the establishment of clearly documented obligations associated with the expended activities.
The Audit Committee remains concerned over the delayed appointment of a permanent Accounting Officer, since the departure of Dr. Sean Phillips during 2014/15. Further the recent changes in strategy and future mandate has created some uncertainty and may lead to a decline of morale amongst the staff.
Below, a table reflecting the present Audit Committee members.
Name QualificationsInternal / External
Appointment Date
Resignation Date / Contract
End
No. of meetings attended
Mr. Cedric Boltman (Chairperson) MBA External 1 October 2010 30 October 2016 8/8Mr. Anton Bischof MBA, CA(SA) External 1 October 2010 30 October 2016 7/8Ms. Ntombi Langa-Royds LLB External 1 October 2010 30 October 2016 7/8Mr. Z Nelson Miya MBL External 1 October 2015 30 October 2021 3/8Ms. Tantaswa Fubu CA(SA) External 1 October 2015 30 October 2021 1/8

PAGE 64
DEPARTMENT OF PLANNING, MONITORING AND EVALUATION Annual Report 2015/2016
13. AUDIT COMMITTEE RESPONSIBILITYThe Audit Committee has successfully discharged its responsibilities as per Public Finance Management Act and the Treasury Regulation. The Audit Committee adopted formal Terms of Reference through its Approved Audit Committee Charter to regulate and govern its affairs.
Evaluation of Internal Controls
The Audit Committee is satisfied that DPME maintains internal controls and systems designed to provide reasonable assurance on the adequacy, effectiveness, and efficiency of policies, procedures, the integrity and reliability of both financial and non- financial information and the safeguarding of assets.
Evaluation of Financial Statements
The committee considered and has satisfied itself that DPME has appropriate and adequate resources within the Chief Directorate Finance. The annual financial statements for the year ending 31st March 2016, has been evaluated and based on the outcomes, the Audit Committee is satisfied that Annual Financial Statements complies in all material respect with the applicable accounting standards.
Evaluation of Risk Management and ICT Governance
The Risk Management Function is currently incorporated into the Internal Audit Function due to capacity constraints. The Audit Committee has however encouraged the establishment of separate and independent structures which will enhance and create a conducive environment for both functions to complement each other without possible conflicts of interest hampering their effectiveness. During the latter part of the financial year, efforts were undertaken to address the committee’s concerns in relation to these structural matters.
The committee also reviewed the DPME’s Enterprise Risk Management activities and is satisfied that risk management processes are adequate, effective and efficient. Oversight responsibility was also exercised over the adequacy, effectiveness and efficiency of ICT Governance risk within DPME, as per King III code on Corporate Governance requirements.
Auditor General’s Report
The Audit committee is in agreement with the findings and matters raised ion the Auditor’s report.
Mr. Cedric Boltman Chairperson of the Audit Committee Date: 31st July 2016

PAGE 65

PAGE 66
DEPARTMENT OF PLANNING, MONITORING AND EVALUATION Annual Report 2015/2016
PART D

PAGE 67
1. INTRODUCTION 68
2. OVERVIEW OF HUMAN RESOURCES 68
2.1. The status of human resources in the department 68
2.2. Human resource priorities for the year under review 68
2.3. Workforce planning and key strategies to attract and recruit a skilled and capable workforce 68
2.4. Employee performance management 69
2.5. Employee wellness programmes 69
2.6 Training and Development 69
2.7. Achievements and challenges faced by the department 69
2.8. Future human resource plans /goals. 70
3. HUMAN RESOURCE OVERSIGHT STATISTICS 70
3.1. Personnel related expenditure 70
3.2. Employment and Vacancies 72
3.3. Filling of SMS posts 73
3.4. Job Evaluation 75
3.5. Employment Changes 75
3.6. Employment Equity 78
3.7. Signing of Performance Agreements by SMS members 81
3.8. Performance Rewards 82
3.9. Foreign Workers 83
3.10. Leave utilisation 83
3.11. HIV/AIDS & Health Promotion Programmes 86
3.12. Labour Relations 87
3.13. Skills development 89
3.14. Injury on duty 90
3.15. Utilisation of Service Providers 91
3.16. Severance Packages 93
PART D HUMAN RESOURCE MANAGEMENT

PAGE 68
DEPARTMENT OF PLANNING, MONITORING AND EVALUATION Annual Report 2015/2016
1. INTRODUCTIONThe information contained in this part of the Annual Report has been prescribed by the Minister for the Public Service and Administration for all departments in the public service.
2. OVERVIEW OF HUMAN RESOURCES2.1 The status of human resources (HR) in the Department
During the 2015/16 financial year, the Ministerial and Deputy Ministerial functions transferred from the Presidency to the DPME. The transfer of the functions included all staff members including vacant posts, assets and the allocated budgets. This resulted in an increase in the staff establishment of the Department and did have a negative impact on the Department’s vacancy rate at the end of the 2015/16 financial year, the Department had 345 funded posts of which 284 posts (83%) were filled (vacancy rate was 18% or 61 posts).
In the 12-month period from 1 April 2015 to 31 March 2016, the Department had an average turnover rate of 15%. The main reason for the exits was officials leaving due to promotions or career opportunities. The Department has an approved Retention and Attraction Policy in place and it is used appropriately.
The employment equity (EE) statistics at the end of the 2015/16 financial year were, with respect to people with disabilities 1.8%, with Africans at 83%, and Women at SMS level at 47.9%. The main challenge experienced was recruiting people with disabilities in the SMS cadre.
The Department entered into a service level agreement with a service provider ICAS to ensure specialised Employee Health and Wellness services are available to the staff in DPME. Regular health screenings were conducted and a health calendar was implemented to ensure acknowledged health related events are celebrated/awareness created, e.g. Breast Cancer awareness, HIV/TB awareness, etc.
The PMDS Policy was implemented in the Department, and assessments for the 2014/15 cycle were finalised and paid during the 2015/16 financial year.
2.2 Human resource priorities for the year under review
The following were priorities for the year under review:
§ Ensuring that all vacant funded posts in the Department were advertised and filled without delay
§ To provide employees with the relevant skills and competencies
§ Providing a supportive workplace which provides relevant assistance to employees who are in need of it
§ Achieving 50% representation of females in SMS, and increasing the percentage of people with disabilities employed in the Department, more especially in SMS.
2.3 Workforce planning and key strategies to attract and recruit a skilled and capable workforce
The HR plan for 2015-2018 was developed and approved in June 2015. All positions in the Department were advertised to encourage open competition. Both the newspapers and DPSA Vacancy Circulars are used to advertise vacant positions in line with the Department’s Recruitment and Selection Policy. The Department also has an approved Recruitment and Retention Policy in place which is implemented where applicable to attract or retain skilled and capable officials in the Department.

PAGE 69
Exit interviews are conducted in order to establish reasons why employees leave the services of the DPME and areas for improvement identified through the exit interviews that can assist in establishing the DPME as an employer of choice, and thereby reduce staff exits. The findings are also presented to Top Management.
The Department provides bursaries and training opportunities to staff members to further their qualifications and improve their skills/knowledge and an Internship Programme is established to provide young graduates with opportunities to gain knowledge and experience in the workplace, in order to be able to compete for jobs in the labour market.
2.4 Employee performance management
The Department has an approved PMDS Policy for all staff. All staff in the Department entered into performance agreements for the period 2015/16. Only 90% of eligible employees submitted the midterm reviews by 31 October 2015. The delay was due to the challenges experienced by former NPC employees (change of reporting lines, new roles which were undefined, etc.). The PMDS assessment for 2014/15 was concluded and the outcome of the assessments was communicated to staff in November 2015. The Department received six cases of appeals against the final results of the annual performance assessments which were addressed. Performance improvement plans for non-performers are being monitored.
2.5 Employee wellness programmes
The Employee Health and Wellness (EHW) programme is fully operational in the Department. Four Wellness Days were organised where the staff are provided with opportunities to undergo Health Risks Assessments (HRA’s) which include HIV Counselling and Testing (HCT). The EHW service provider, ICAS continued to provide telephone counselling, face to face counselling and e-care services for our employees. ICAS provides regular reports regarding the uptake of the wellness services provided. The unit continued to provide monthly desk-drops covering different topics as per the health calendar.
2.6 Training and Development
The Department recruited 26 interns in 2015, awarded 17 bursaries and created 314 opportunities for short courses. It should be noted that in this instance, employees are counted according to the number of training interventions they have attended.
2.7 Achievements and challenges faced by the Department
Achievements
§ The Ministerial and Deputy Ministerial functions were successfully transferred from the Presidency to the DPME and staff members were inducted and integrated into the DPME with minimum disruptions
§ PMDS assessments were concluded for the 2014/15 performance cycle
§ EHW services/programmes were implemented in the Department
§ Training of staff is being undertaken in line with the WSP of the Department. The target set in the WSP was exceeded. At the end of the financial year, 314 training opportunities were provided in line with WSP. This represents an achievement of 196% against the WSP target of 2015/16.
§ 26 Interns were offered internships during this period.
Challenges
§ The Department was not able to maintain a low average vacancy rate of below 10%. A 15% average vacancy rate was experienced over the 2015/16 period as a result of the transfer of the Ministerial and Deputy Ministerial functions, as well as an increase in the number of funded posts on the approved establishment due to the increase in the mandate of the DPME. At the end of the financial year, the vacancy rate stood at 16.7% thereby not achieving the goal of a vacancy rate of below 10% as indicated in the Department’s APP

PAGE 70
DEPARTMENT OF PLANNING, MONITORING AND EVALUATION Annual Report 2015/2016
§ Achieving disability representation in SMS despite efforts to attract disabled candidates
§ Retention of staff in corporate services due to job hopping for better remunerations especially at salary levels 9-12 after the restrictions on remunerating staff in Programme 1 in positions at salary levels 10 and 12 was introduced by the DPSA
§ Time taken to complete compulsory pre-employment screening that is conducted by the SSA
2.8 Future human resource plans/goals
§ Fill all vacant funded posts and ensure that a vacancy rate of 10% or less is achieved and maintained
§ Implement of appropriate EHW programmes to support employees
§ Continuous compliance to PMDS
§ Coordinating and implementing appropriate skills development initiatives
§ Achievement of EE targets
§ Increase of awareness of diversity/disability/gender issues
§ Maintain sound labour relations
3. HUMAN RESOURCE OVERSIGHT STATISTICS 3.1 Personnel related expenditure
The following tables summarises the final audited personnel related expenditure by programme and by salary bands for the period 1 April 2015 to 31 March 2016. In particular, they provide an indication of the following:
§ Amount spent on personnel
§ Amount spent on salaries, overtime, homeowners allowances and medical aid
Table 3.1.1 Personnel expenditure by programme (R’000)
PROGRAMMETotal
ExpenditurePersonnel
CostTraining
Expenditure
Professional and Special
Services Expenditure
Personnel Expenditure
as a % of total
expenditure
Average personnel cost per
employee
Administration 111,872 50,186 785 1,371 45% 436Outcomes Monitoring & Evaluation (OM&E) 89,560 56,918 56 14,514 64% 720
Institutional Performance Monitoring & Evaluation (IPM&E)
60,626 35,187 53 598 58% 607
Planning & Secretariat National Planning Commission (NPC)
70,735 21,216 0 34,685 30% 707
National Youth Development Agency (Transfer payment)
415,983 2,054 0 0 0% 1027
TOTAL 748,776 165,561 894 51,168 22% 583

PAGE 71
Table 3.1.2 Personnel costs by salary band (R’000)
SALARY BAND Personnel Cost% of total personnel
costNo. of employees
Average personnel cost per employee
Lower skilled (Levels 1-2) 2,074 1.3% 5 415 Skilled (Levels 3-5) 2,734 1.7% 15 182 Highly skilled production (Levels 6-8) 16,608 10.0% 68 244
Highly skilled supervision (Levels 9-12) 69,445 41.9% 122 569
Senior management (Levels 13-16) 74,700 45.1% 74 1 009
TOTAL 65,561 100.0% 284 583
Table 3.1.3 Salaries, Overtime, Home Owners Allowance and Medical Aid by programme (R’000)
PROGRAMME
Salaries OvertimeHome Owners
AllowanceMedical Aid
AmountAs % of
personnel costs
AmountAs % of
personnel costs
AmountAs % of
personnel costs
AmountAs % of
personnel costs
Administration 46,530 92.7% 677 1.35% 1 213 24% 1 766 3.5%Outcomes Monitoring & Evaluation (OM&E)
55,434 97.4% 0 0.00% 634 1.1% 850 1.5%
Institutional Performance Monitoring & Evaluation (IPM&E)
33,840 96.2% 24 0.07% 484 1.4% 839 2.4%
Planning & Secretariat National Planning Commission (NPC)
20,588 97.0% 0 0.00% 354 1.7% 274 1.3%
National Youth Development Agency (Transfer Payment)
1,942 94.5% 0 0.00% 74 3.6% 38 1.9%
TOTAL 158,334 95.6% 701 0.42% 2 759 1.7% 3 767 2.3%

PAGE 72
DEPARTMENT OF PLANNING, MONITORING AND EVALUATION Annual Report 2015/2016
Table 3.1.4 Salaries, Overtime, Home Owners Allowance and Medical Aid by salary band
SALARY BANDS
Salaries OvertimeHome Owners
AllowanceMedical Aid
Amount(‘000)
As % of personnel
costs
Amount(‘000)
As % of personnel
costs
Amount(‘000)
As % of personnel
costs
Amount(‘000)
As % of personnel
costs
Skilled (Levels 1-2) 1,809 87.2% 32 1.5% 94 4.5% 139 6.7%Skilled (Levels 3-5) 2,137 78.2% 200 7.3% 177 6.5% 220 8.0%Highly skilled production (Levels 6-8)
14,957 90.1% 253 1.5% 609 3.7% 789 4.8%
Highly skilled supervision (Levels 9-12)
66,719 96.1% 216 0.3% 716 1.0% 1,794 2.6%
Senior management (Levels 13-16)
72,712 97.3% 0 0.0% 1163 1.6% 825 1.1%
TOTAL 158,334 95.6% 701 0.4% 2,759 1.7% 3,767 2.3%
3.2 Employment and Vacancies
The tables in this section summarises the position with regard to employment and vacancies. The following tables summarises the number of posts on the establishment, the number of employees, the vacancy rate, and whether there are any staff that are additional to the establishment. This information is presented in terms of three key variables:
Programme
Salary band
Critical occupations
Table 3.2.1 Employment and vacancies by programme as at 31 March 2016
PROGRAMMENumber of posts
on approved establishment
Number of posts filled
Vacancy Rate%
Number of employees
additional to the establishment
Administration 145 117 19% 4Outcomes Monitoring & Evaluation (OM&E)
85 78 8% 3
Institutional Performance Monitoring & Evaluation (IPM&E)
75 59 21% 0
Planning & Secretariat National Planning Commission (NPC)
40 30 25% 1
TOTAL 345 284 18% 8
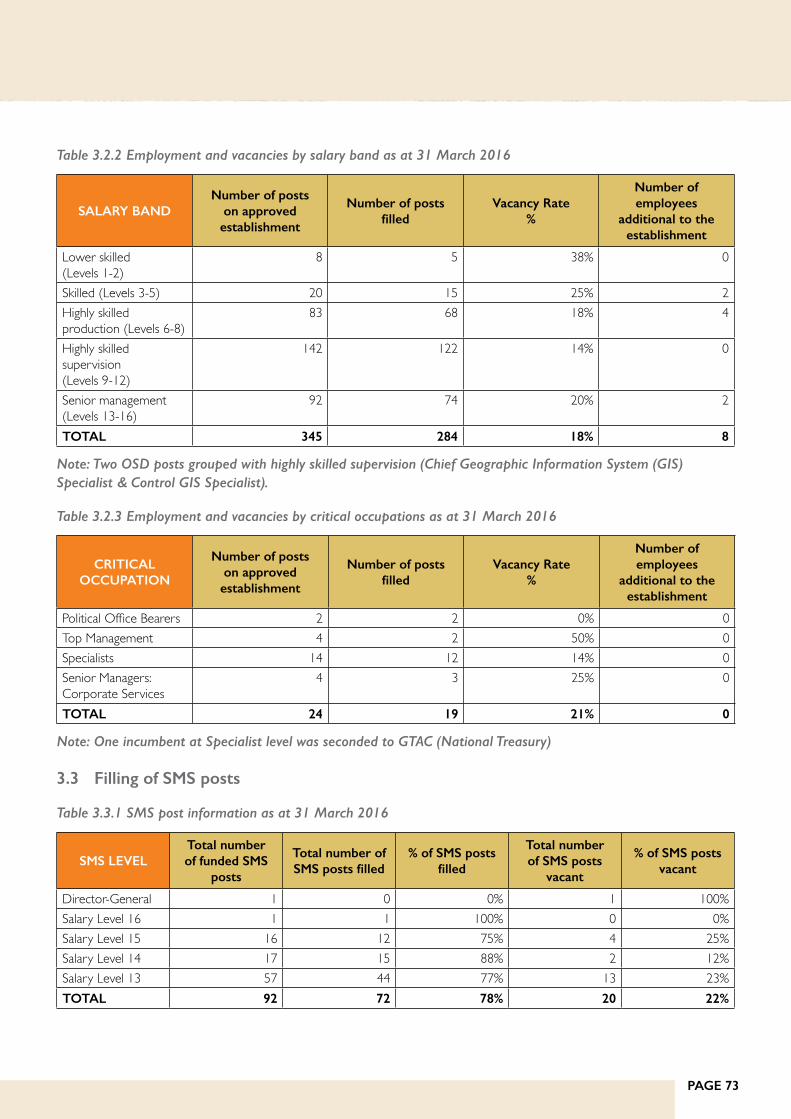
PAGE 73
Table 3.2.2 Employment and vacancies by salary band as at 31 March 2016
SALARY BANDNumber of posts
on approved establishment
Number of posts filled
Vacancy Rate%
Number of employees
additional to the establishment
Lower skilled (Levels 1-2)
8 5 38% 0
Skilled (Levels 3-5) 20 15 25% 2Highly skilled production (Levels 6-8)
83 68 18% 4
Highly skilled supervision (Levels 9-12)
142 122 14% 0
Senior management (Levels 13-16)
92 74 20% 2
TOTAL 345 284 18% 8
Note: Two OSD posts grouped with highly skilled supervision (Chief Geographic Information System (GIS) Specialist & Control GIS Specialist).
Table 3.2.3 Employment and vacancies by critical occupations as at 31 March 2016
CRITICAL OCCUPATION
Number of posts on approved establishment
Number of posts filled
Vacancy Rate%
Number of employees
additional to the establishment
Political Office Bearers 2 2 0% 0Top Management 4 2 50% 0Specialists 14 12 14% 0Senior Managers: Corporate Services
4 3 25% 0
TOTAL 24 19 21% 0
Note: One incumbent at Specialist level was seconded to GTAC (National Treasury)
3.3 Filling of SMS posts
Table 3.3.1 SMS post information as at 31 March 2016
SMS LEVELTotal number of funded SMS
posts
Total number of SMS posts filled
% of SMS posts filled
Total number of SMS posts
vacant
% of SMS posts vacant
Director-General 1 0 0% 1 100%Salary Level 16 1 1 100% 0 0%Salary Level 15 16 12 75% 4 25%Salary Level 14 17 15 88% 2 12%Salary Level 13 57 44 77% 13 23%TOTAL 92 72 78% 20 22%

PAGE 74
DEPARTMENT OF PLANNING, MONITORING AND EVALUATION Annual Report 2015/2016
Table 3.3.2 SMS post information as at 30 September 2015
SMS LEVELTotal number of funded SMS
posts
Total number of SMS posts filled
% of SMS posts filled
Total number of SMS posts vacant
% of SMS posts vacant
Director-General 1 0 0% 1 100%Salary Level 16 1 1 100% 0 0%Salary Level 15 14 14 100% 0 0%Salary Level 14 17 12 71% 5 29%Salary Level 13 57 45 79% 12 21%TOTAL 90 72 80% 18 20%
Table 3.3.3 Advertising and filling of SMS posts for the period 1 April 2015 to 31 March 2016
SMS LEVEL
Advertising Filling of Posts
Number of vacancies per level advertised
in 6 months of becoming vacant
Number of vacancies per level filled in 6 months of becoming vacant
Number of vacancies per level not filled in 6 months but filled in
12 months
Director-General 0 0 0Salary Level 16 1 1 0Salary Level 15 3 0 2Salary Level 14 6 1 3Salary Level 13 11 1 10TOTAL 21 3 15
Table 3.3.4 Reasons for not having complied with the filling of funded vacant SMS - Advertised within 6 months and filled within 12 months after becoming vacant for the period 1 April 2015 and 31 March 2016
Reasons for vacancies not advertised within 6 months
Awaiting approval of the new organisational structure
Reasons for vacancies not filled within 12 months
§ The filling of 1 x Level 1 post could not be finalised within 12 months as no suitable candidates could be identified through the normal recruitment process. Candidates were thereafter sourced through head-hunting, however, again no suitable candidate was identified. The post has since been re-advertised.
§ The filling of 2 x Level 14 post could not be finalised within 12 months as no suitable candidates could be identified through the normal recruitment process. The posts have since been re-advertised.
Table 3.3.5 Disciplinary steps taken for not complying with the prescribed timeframes for filling SMS posts within 12 months for the period 1 April 2015 and 31 March 2016
Disciplinary steps taken for vacancies not advertised within 6 months
Not applicable
Disciplinary steps taken for vacancies not filled within 12 months
Not applicable
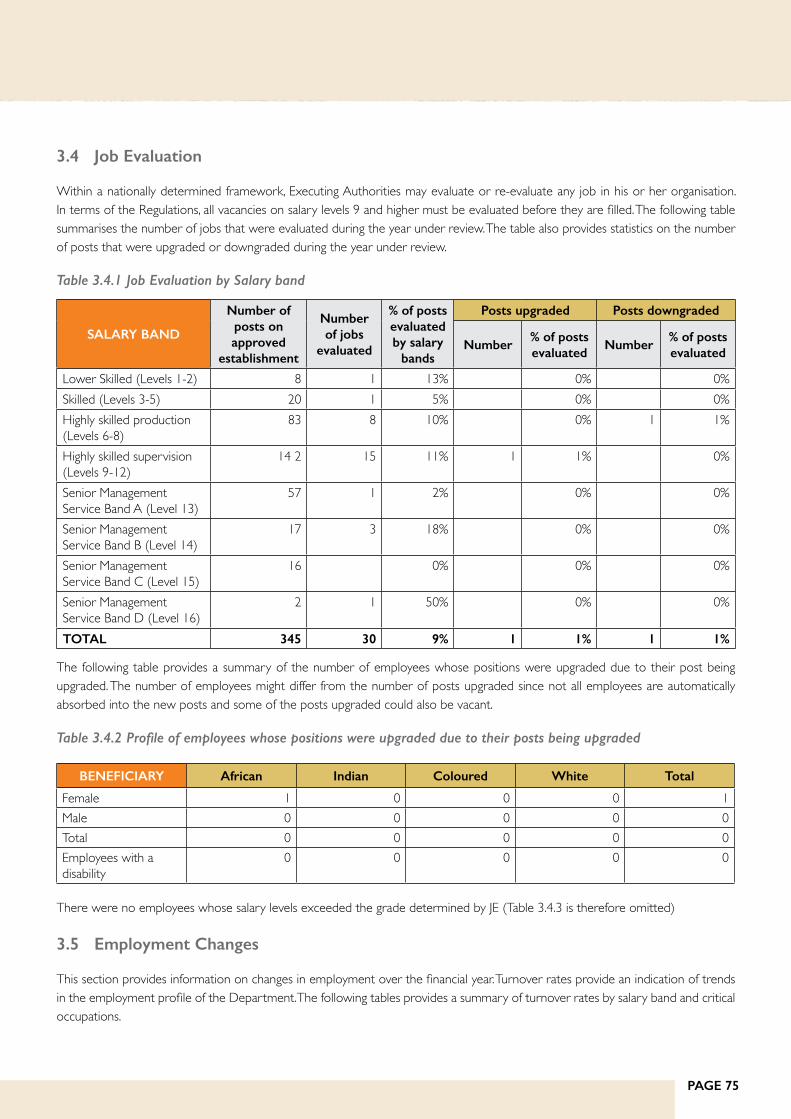
PAGE 75
3.4 Job Evaluation
Within a nationally determined framework, Executing Authorities may evaluate or re-evaluate any job in his or her organisation. In terms of the Regulations, all vacancies on salary levels 9 and higher must be evaluated before they are filled. The following table summarises the number of jobs that were evaluated during the year under review. The table also provides statistics on the number of posts that were upgraded or downgraded during the year under review.
Table 3.4.1 Job Evaluation by Salary band
SALARY BAND
Number of posts on approved
establishment
Number of jobs
evaluated
% of posts evaluated by salary
bands
Posts upgraded Posts downgraded
Number% of posts evaluated
Number% of posts evaluated
Lower Skilled (Levels 1-2) 8 1 13% 0% 0%Skilled (Levels 3-5) 20 1 5% 0% 0%Highly skilled production (Levels 6-8)
83 8 10% 0% 1 1%
Highly skilled supervision (Levels 9-12)
14 2 15 11% 1 1% 0%
Senior Management Service Band A (Level 13)
57 1 2% 0% 0%
Senior Management Service Band B (Level 14)
17 3 18% 0% 0%
Senior Management Service Band C (Level 15)
16 0% 0% 0%
Senior Management Service Band D (Level 16)
2 1 50% 0% 0%
TOTAL 345 30 9% 1 1% 1 1%
The following table provides a summary of the number of employees whose positions were upgraded due to their post being upgraded. The number of employees might differ from the number of posts upgraded since not all employees are automatically absorbed into the new posts and some of the posts upgraded could also be vacant.
Table 3.4.2 Profile of employees whose positions were upgraded due to their posts being upgraded
BENEFICIARY African Indian Coloured White Total
Female 1 0 0 0 1Male 0 0 0 0 0Total 0 0 0 0 0Employees with a disability
0 0 0 0 0
There were no employees whose salary levels exceeded the grade determined by JE (Table 3.4.3 is therefore omitted)
3.5 Employment Changes
This section provides information on changes in employment over the financial year. Turnover rates provide an indication of trends in the employment profile of the Department. The following tables provides a summary of turnover rates by salary band and critical occupations.

PAGE 76
DEPARTMENT OF PLANNING, MONITORING AND EVALUATION Annual Report 2015/2016
Table 3.5.1 Annual turnover rates by salary band
SALARY BANDNumber of
employees at 1 April 2015
Appointments/transfers into Department
Terminations/transfers out of the
Department
Turnover rate%
Lower skilled (Levels 1-2) 4 2 1 25%Skilled (Levels 3-5) 9 17 0 0%Highly skilled production (Levels 6-8)
53 21 14 26%
Highly skilled supervision (Levels 9-12)
113 17 11 10%
Senior Management Service Band A (Level 13)
40 11 8 20%
Senior Management Service Band B (Level 14)
10 3 0 0%
Senior Management Service Band C (Level 15)
14 1 4 29%
Senior Management Service Band D (Level 16)
1 2 0 0%
Contracts 2 2 0 0%TOTAL 246 76 38 15%
Note:
§ Turnover rate displays the percentage of service terminations for the period in relation to the total number of employees at beginning of period April 2015 i.e. (Terminations and Transfers out of the Department)/(Number of employees at beginning of period April 2015 x 100).
§ Appointments and terminations include changes to employment capacity.
Table 3.5.2 Annual turnover rates by critical occupation
CRITICAL OCCUPATION
Number of employees at 1 April
2015
Appointments/transfers into Department
Terminations/transfers out of the
Department
Turnover rate%
Top Management 2 3 1 50%Specialists 13 1 3 23%Senior Managers: Corporate Services
3 1 1 33%
TOTAL 18 5 5 28%
Note: Appointments and terminations include changes to employment capacity.

PAGE 77
The table below identifies the major reasons why staff left the Department.
Table 3.5.3 Reasons why staff left the Department
TERMINATION TYPE Number% of Total
Resignations
Death 1 3%Resignation 16 42%Expiry of contract 7 18%Dismissal – operational changes 0 0%Dismissal – misconduct 0 0%Dismissal – inefficiency 0 0%Discharged due to ill-health 0 0%Retirement 0 0%Transfer to other Public Service Departments 14 37%Other 0 0%TOTAL NUMBER OF EMPLOYEES WHO LEFT AS A % OF TOTAL EMPLOYMENT
38 100%
Table 3.5.4 Promotions by critical occupation
OCCUPATIONEmployees at 1 April 2015
Promotions to another salary
level
Salary level promotions
as a % of employees by
occupation
Progressions to another notch within a salary
level
Notch progression
as a % of employees by
occupation
Top Management 2 0 0% 0 0%Specialists 13 0 0% 0 0%Senior Managers: Corporate Services
3 0 0% 0 0%
TOTAL 18 0 0% 0 0%
Note: Promotions include both salary band and notch progressions. (Notch progressions to another notch within a salary level were made in line with the PMDS as well as Public Service Regulation 1.V.C.3). (Excludes transfers from other departments on promotion).

PAGE 78
DEPARTMENT OF PLANNING, MONITORING AND EVALUATION Annual Report 2015/2016
Table 3.5.5 Promotions by salary band
SALARY BANDEmployees at 1 April 2015
Promotions to another salary
level
Salary bands promotions
as a % of employees by
salary level
Progressions to another notch within a salary
level
Notch progression
as a % of employees by
occupation
Lower skilled (Levels 1-2) 4 0 0% 0 0%Skilled (Levels 3-5) 9 0 0% 0 0%Highly skilled production (Levels 6-8)
53 8 15% 0 0%
Highly skilled supervision (Levels 9-12)
113 6 5% 0 0%
Senior Management (Level 13-16)
67 4 6% 0 0%
TOTAL 246 18 7% 0 0%
Note: Promotions are internal and include both salary band and notch progressions. Progressions to another notch within a salary level were made in line with the PMDS as well as Public Service Regulation 1.V.C.3. (excludes upgrades).
3.6 Employment Equity
Table 3.6.1 Total number of employees (including employees with disabilities) in each of the followingoccupational categories as at 31 March 2016
OCCUPATIONAL CATEGORY
Male FemaleTotal
African Coloured Indian White African Coloured Indian White
Legislators, senior officials and managers 26 2 5 6 26 1 4 4 74
Professionals 19 3 1 2 36 2 4 2 69Technicians and associate professionals 19 0 1 0 31 1 0 1 53
Clerks 25 1 0 1 34 5 2 0 68Service and sales workers 9 0 0 0 6 0 0 0 15
Skilled agriculture and fishery workers 0 0 0 0 0 0 0 0 0
Craft and related trades workers 0 0 0 0 0 0 0 0 0
Plant and machine operators and assemblers
0 0 0 0 0 0 0 0 0
Elementary occupations 2 0 0 0 3 0 0 0 5Total 100 6 7 9 136 9 10 7 284EMPLOYEES WITH DISABILITIES
2 0 0 0 3 0 0 1 6

PAGE 79
Table 3.6.2 Total number of employees (including employees with disabilities) in each of the following occupational bands on 31 March 2016
OCCUPATIONAL BAND
Male FemaleTotal
African Coloured Indian White African Coloured Indian White
Top Management (Levels 15-16) 7 1 2 1 5 0 0 0 16
Senior Management (Levels 13-14) 19 1 3 5 19 1 4 4 56
Professionally qualified & experienced specialists and mid-management (Levels 9-12)
38 3 2 2 67 3 4 3 122
Skilled technical & academically qualified workers, junior management, supervisors, foremen and superintendents (Levels 6-8)
25 1 0 1 34 5 2 0 68
Semi-skilled and discretionary decision making (Levels 3-5)
9 0 0 0 6 0 0 0 15
Under skilled and defined decision making (Levels 1-2)
2 0 0 0 3 0 0 0 5
TOTAL 100 6 7 9 134 9 10 7 282
Table 3.6.3 Recruitment
OCCUPATIONAL BAND
Male FemaleTotal
African Coloured Indian White African Coloured Indian White
Top Management (Levels 15-16) 4 0 0 0 1 0 0 0 5
Senior Management (Levels 13-14) 4 0 1 0 7 0 1 0 13
Professionally qualified & experienced specialists and mid-management (Levels 9-12)
7 0 1 0 8 0 1 1 18
Skilled technical & academically qualified workers, junior management, supervisors, foremen and superintendents (Levels 6-8)
10 1 0 0 10 0 0 0 21
Semi-skilled and discretionary decision making (Levels 3-5)
12 0 0 0 5 0 0 0 17

PAGE 80
DEPARTMENT OF PLANNING, MONITORING AND EVALUATION Annual Report 2015/2016
OCCUPATIONAL BAND
Male FemaleTotal
African Coloured Indian White African Coloured Indian White
Under skilled and defined decision making (Levels 1-2)
1 0 0 0 1 0 0 0 2
TOTAL 38 1 2 0 32 0 2 1 76
Employees with disabilities 0 0 0 0 1 0 0 0 1
Note: Above table includes new appointments, internal promotions and transfers in.
Table 3.6.4 Promotions
OCCUPATIONAL BAND
Male FemaleTotal
African Coloured Indian White African Coloured Indian White
Top Management 1 0 0 0 0 0 0 1Senior Management 0 0 0 2 1 3Professionally qualified and experienced specialists and mid-management
0 0 0 0 7 1 0 0 8
Skilled technical and academically qualified workers, junior management, supervisors, foremen and superintendents
2 0 0 0 4 0 0 0 6
Semi-skilled and discretionary decision making
0 0 0 0 0 0 0 0 0
Unskilled and defined decision making 0 0 0 0 0 0 0 0 0
TOTAL 3 0 0 2 12 1 0 0 18
Employees with disabilities 0 0 0 0 0 0 0 0 0
Note: This table includes only promotions to another salary level.
Table 3.6.5 Terminations
OCCUPATIONAL BAND
Male FemaleTotal
African Coloured Indian White African Coloured Indian White
Top Management (Levels 15-16)
0 0 0 0 2 1 0 1 4
Senior Management (Levels 13-14)
1 0 1 0 4 0 2 0 8
Professionally qualified and experienced specialists and mid-management
5 0 0 0 5 0 0 1 11
Skilled technical and academically qualified, junior management, supervisors, foremen, superintendents
6 0 0 0 8 0 0 0 14

PAGE 81
OCCUPATIONAL BAND
Male FemaleTotal
African Coloured Indian White African Coloured Indian White
Semi-skilled and discretionary decision making
0 0 0 0 1 0 0 0 1
Unskilled and defined decision making
0 0 0 0 0 0 0 0 0
TOTAL 12 0 1 0 20 1 2 2 38
Employees with disabilities 0 0 0 0 0 0 0 0 0
Note: Terminations include resignations, expiry of contract, retirement, transfers out of the Department and changes in employment capacity.
Table 3.6.6 Disciplinary action
DISIPLINARY ACTION
Male FemaleTotal
African Coloured Indian White African Coloured Indian White
Written warning 5 0 0 0 0 0 0 0 5Final written warning 0 0 0 0 0 0 0 0 0TOTAL 5 0 0 0 0 0 0 0 5
Table 3.6.7 Skills development
OCCUPATIONAL CATEGORY
Male FemaleTotal
African Coloured Indian White African Coloured Indian White
Legislators, senior officials and managers
14 3 3 5 19 1 5 10 60
Professionals 15 9 0 6 31 0 2 0 63Technicians and associate professionals
21 0 0 0 35 0 0 0 56
Clerks /Administrators 37 0 0 3 39 10 2 0 91Service and sales workers 21 0 0 0 17 0 0 0 38Skilled agriculture and fishery workers
0 0 0 0 0 0 0 0 0
Craft and related trades workers
0 0 0 0 0 0 0 0 0
Plant and machine operators and assemblers
0 0 0 0 0 0 0 0 0
Elementary occupations 6 0 0 0 4 0 0 0 10TOTAL 114 12 3 14 145 11 9 10 318
Employees with disabilities 0 0 0 0 0 0 0 0 0
Note: The total of 318 reflects the instances employee/s attended training in the Department.
3.7 Signing of Performance Agreements by SMS members
All members of the SMS must conclude and sign performance agreements within specific timeframes. Information regarding the signing of performance agreements by SMS members, the reasons for not complying within the prescribed timeframes and disciplinary steps taken, is presented here.

PAGE 82
DEPARTMENT OF PLANNING, MONITORING AND EVALUATION Annual Report 2015/2016
Table 3.7.1 Signing of Performance Agreements by SMS members as at 31 May 2015
SMS LEVELTotal number of
funded SMS postsTotal number of SMS
members
Total number of signed performance
agreements
Signed performance agreements as % of
total number of SMS members
Director-General 1 0 0 0%Salary Level 16 1 0 0 0%Salary Level 15 16 12 12 100%Salary Level 14 17 11 11 100%Salary Level 13 57 40 40 100%TOTAL 92 63 63 100%
Table 3.7.2 Reasons for not having concluded Performance Agreements for all SMS members as on 31 March 2016
Reasons
Not applicable
Table 3.7.3 Disciplinary steps taken against SMS members for not having concluded Performance Agreements as on 31 March 2016
Disciplinary action
Not applicable
3.8 Performance Rewards
To encourage good performance, the Department has granted the following performance rewards during the year under review. The information is presented in terms of race, gender, and disability, salary bands and critical occupations.
Table 3.8.1 Performance Rewards by race, gender and disability
RACE AND GENDERBeneficiary Profile Cost
Number of beneficiaries
Number of employees
% of total within group
Cost (R’000)Average cost per employee
AfricanMale 37 69 54% 643 17Female 61 112 54% 1,037 17AsianMale 2 6 33% 64 32Female 6 12 50% 159 26ColouredMale 4 5 80% 87 22Female 3 9 33% 73 24WhiteMale 5 9 56% 156 31Female 5 7 71% 124 25TOTAL 123 229 54% 2,344 19

PAGE 83
Note: A total of 284 employees were employed in the Department on 31 March 2016. Performance bonuses for the period 1 April 2014 to 31 March 2015 were paid in the second quarter of the 2015/16 financial year.
Table 3.8.2 Performance Rewards by salary band for personnel below SMS (R000)
SALARY BAND
Beneficiary Profile Cost Total cost as % of total personnel
expenditureNumber of
beneficiariesNumber of employees
% of total within salary
bandsTotal Cost
Average cost per
beneficiary
Lower Skilled (Levels 1-2)
1 4 25% 5 5 0.2%
Skilled (Levels 3-5)
5 7 71% 35 7 1.3%
Highly skilled production (Levels 6-8)
28 45 62% 259 9 1.6%
Highly skilled supervision (Levels 9-12)
71 113 63% 1,417 20 2.0%
TOTAL 105 169 62% 1,716 16 2.3%
Table 3.8.3 Performance Rewards by critical occupation for the period 1 April 2015 to 31 March 2016
Total number of Performance Awards by critical occupation None
Table 3.8.4 Performance related rewards (cash bonus), by salary band for SMS
SALARY BAND
Beneficiary Profile Cost (R’000) Total cost as % of total personnel
expenditureNumber of
beneficiariesNumber of employees
% of total within salary
bandsTotal Cost
Average cost per
beneficiary
A (Level 13) 10 39 26% 570 57 1.2%B (Level 14) 4 9 44% 176 44 1.5%C (Level 15) 4 12 33% 313 78 2.1%D (Level 16) 0 0 0% 0 0 0.0%TOTAL 18 60 30% 1,059 59 1.4%
3.9 Foreign Workers
None
3.10 Leave utilisation
The Public Service Commission identified the need for careful monitoring of sick leave within the public service. The following tables provide an indication of the use of sick leave and disability leave for the period 1 January 2015 to 31 December 2015 (annual leave cycle). In both cases, the estimated cost of the leave is also provided.

PAGE 84
DEPARTMENT OF PLANNING, MONITORING AND EVALUATION Annual Report 2015/2016
Table 3.10.1 Sick leave
SALARY BAND Total days% Days with
medical certification
Number of employees using sick
leave
% of total employees using sick
leave
Average days per
employee
Estimated Cost (R’000)
Lower skilled (Levels 1-2)
27 41% 5 2% 5 11
Skilled (Levels 3-5) 61 26% 13 6% 5 39Highly skilled production (Levels 6-8)
378 25% 50 23% 8 338
Highly skilled supervision (Levels 9-12)
749 24% 100 47% 7 1,594
Senior management (Levels 13-16)
244 25% 46 21% 5 889
TOTAL 1 459 25% 214 100% 7 2,872
Note: Percentage of total employees using sick leave is calculated as (Number of employees using sick leave)/Total number of employees using sick leave x 100).
Table 3.10.2 Disability leave (temporary and permanent)
SALARY BAND Total days% Days with
medical certification
Number of employees
using disability
leave
% of total employees
using disability
leave
Average days per
employee
Estimated Cost (R’000)
Lower skilled (Levels 1-2) 0 0% 0 0% 0 0Skilled (Levels 3-5) 0 0% 0 0% 0 0Highly skilled production (Levels 6-8)
51 100% 3 38% 17 78
Highly skilled supervision (Levels 9-12)
45 100% 4 50% 11 79
Senior management (Levels 13-16)
36 0% 1 13% 36 132
TOTAL 132 100% 8 100% 17 290
Note: Percenatge of total employees using disability leave is calculated as (Number of employees using disability leave/Total number of employees using disability leave x 100).

PAGE 85
The table below summarises the utilisation of annual leave. The wage agreement concluded with trade unions in the Public Service Co-ordinating Bargaining Council (PSCBC) in 2000 requires management of annual leave to prevent high levels of accrued leave being paid at the time of termination of service.
Table 3.10.3 Annual Leave
SALARY BAND Total days takenNumber of employees
using annual leaveAverage per employee
Lower skilled (Levels 1-2) 117 6 20Skilled (Levels 3-5) 278 25 11Highly skilled production (Levels 6-8) 1 220 78 16Highly skilled supervision (Levels 9-12) 3 024 149 20Senior management (Levels 13-16) 1 677 91 18TOTAL 6 316 349 18
Table 3.10.4 Capped leave
SALARY BANDTotal days of
capped leave taken
Number of employees using
capped leave
Average number of days taken per
employee
Average capped leave per employee as on
31 December 2015
Lower skilled (Levels 1-2) 0 0 0 0Skilled (Levels 3-5) 0 0 0 87Highly skilled production (Levels 6-8)
0 0 0 42
Highly skilled supervision (Levels 9-12)
0 0 0 18
Senior management (Levels 13-16)
0 0 0 41
TOTAL 0 0 0 29
Note: No staff utilised capped leave.
The following table summarises payments made to employees as a result of leave that was not taken.
Table 3.10.5 Leave pay-outs
REASONTotal Amount
(R’000)Number of Employees
Average per employee (R’000)
Leave pay-out due to non-utilisation of leave for the 2015 cycle
43 3 14
Current leave pay-out on termination of service for 2016
3 1 3
Capped leave pay-out on termination of service for 2016
0 0 0
TOTAL 46 4 12

PAGE 86
DEPARTMENT OF PLANNING, MONITORING AND EVALUATION Annual Report 2015/2016
3.11 HIV/AIDS and Health Promotion Programmes
Table 3.11.1 Steps taken to reduce the risk of occupational exposure
Units/categories of employees identified to be at high risk of contracting HIV & related diseases (if any)
Key steps taken to reduce the risk
DPME officials travel frequently and are therefore at risk STI and Condom AwarenessCondom DistributionHIV/AIDS Voluntary Counselling and TestingWorld Aids Day Awareness and speech from the HIV/AIDS activist
Table 3.11.2 Details of Health Promotion and HIV/AIDS Programmes (tick the applicable boxes and provide the required information)
QUESTION Yes No Details, if yes
1. Has the Department designated a member of the SMS to implement the provisions contained in Part VI E of Chapter 1 of the Public Service Regulations, 2001? If so, provide her/his name and position.
�
Mr N Nomlala, Director: HRM
2. Does the Department have a dedicated unit or has it designated specific staff members to promote the health and well-being of your employees? If so, indicate the number of employees who are involved in this task and the annual budget that is available for this purpose.
�(3 Members) Mr T Silawu, Ms N Shandu and Mr E Mudau
Budget allocated is R500,000.00
3. Has the Department introduced an Employee Assistance or Health Promotion Programme for your employees? If so, indicate the key elements/services of this programme.
�ICAS is contracted as the service provider for the Employee Assisstance Programme (EAP)
4. Has the Department established (a) committee(s) as contemplated in Part VI E.5 (e) of Chapter 1 of the Public Service Regulations, 2001? If so, please provide the names of the members of the committee and the stakeholder(s) that they represent.
� Mr T Silawu, Deputy Director: LR EHW &SSMr W J Victor, Deputy Director: OD, Recruitment & HR AdministrationMr O E Skosana, Deputy Director: Risk ManagementMs T Matha, Assistant Director: OD, HR Planning, Strategy & SystemsVacant, Assistant Director: LR EHW &SSMr M Maasdorp, Deputy Director: Internal ControlMs M Subramoney, Deputy Director: Management Performance AssMs X Masala, Assistant Director: AdministrationMs P Kambe, Senior Administrative Officer (CBM)Mr M Everett, Deputy Director: Programme AdminMr M Maluleka, Assistant Director: Data SupportMs A L Crouch, Evaluation OfficerMs XP Dilata, Deputy DirectorMs PD Moloto, Assistant Admin Secretary2 x representatives from each of the recognised Labour Unions

PAGE 87
QUESTION Yes No Details, if yes
5. Has the Department reviewed its employment policies and practices to ensure that these do not unfairly discriminate against employees on the basis of their HIV status? If so, list the employment policies/practices so reviewed.
�
Recruitment & Selection Policy
6. Has the Department introduced measures to protect HIV-positive employees or those perceived to be HIV-positive from discrimination? If so, list the key elements of these measures.
� Quarterly awareness campaigns were conducted, condoms are distributed, and monthly desk-drops regarding health and wellness matters, 24-hours counselling call centre (outsourced), 24-hour online e-care system
7. Does the Department encourage its employees to undergo Voluntary Counselling and Testing? If so, list the results that you have you achieved.
� 46.6 % of DPME employees undergone VCT and tested negative for HIV
8. Has the Department developed measures/indicators to monitor and evaluate the impact of its health promotion programme? If so, list these measures/indicators.
� Quarterly reports are received from GEMS and EHWP Service Provider (ICAS), condom distribution and stats are maintained of the usage
3.12 Labour Relations
Table 2.12.1 Collective agreements
SUBJECT MATTER Date
Communication Tool Policy 10/03/2015Inconsistent Advertising Policy 10/03/2015Code of conduct for open plan offices 10/03/2015
The following table summarises the outcome of disciplinary hearings conducted within the Department for the year under review.
Table 3.12.2 Misconduct and disciplinary hearings finalised
OUTCOMES OF DISCIPLINARY HEARINGS Number % of total
Correctional counselling 0 0%Verbal warning 0 0%Written warning 5 100%Final written warning 0 0%Suspended without pay 0 0%Fine 0 0%Demotion 0 0%Dismissal 0 0%Not guilty 0 0%Case withdrawn 0 0%TOTAL 5 100%

PAGE 88
DEPARTMENT OF PLANNING, MONITORING AND EVALUATION Annual Report 2015/2016
Table 3.12.3 Types of misconduct addressed at disciplinary hearings
TYPE OF MISCONDUCT Number % of total
Financial misconduct 3 100%Poor work performance 0 0%Total number of misconduct cases 3 100%
Table 3.12.4 Grievances logged
Number % of total
Number of grievances resolved 5 100%Number of grievances not resolved 0 0%Total number of grievances lodged 5 100%
Table 3.12.5 Disputes logged
Number % of Total
Number of disputes upheld 0 0%Number of disputes dismissed 3 100%Total number of disputes lodged still in process 3 100%
Table 3.12.6 Strike actions
Total number of persons working days lost 0Total costs working days lost 0Amount (R’000) recovered as a result of no work no pay 0
Table 3.12.7 Precautionary suspensions
Number of people suspended 1Number of people whose suspension exceeded 30 days 0Average number of days suspended 30Cost (R’000) of suspension 48
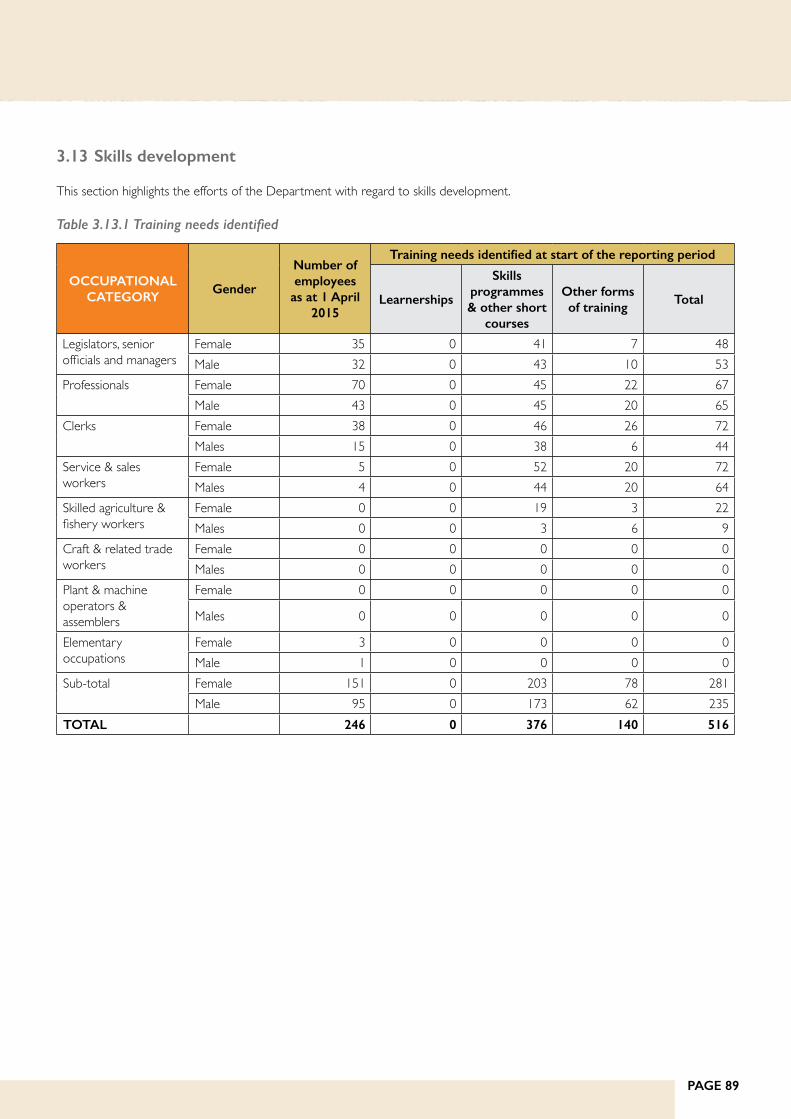
PAGE 89
3.13 Skills development
This section highlights the efforts of the Department with regard to skills development.
Table 3.13.1 Training needs identified
OCCUPATIONAL CATEGORY
Gender
Number of employees
as at 1 April 2015
Training needs identified at start of the reporting period
Learnerships
Skills programmes & other short
courses
Other forms of training
Total
Legislators, senior officials and managers
Female 35 0 41 7 48Male 32 0 43 10 53
Professionals Female 70 0 45 22 67Male 43 0 45 20 65
Clerks Female 38 0 46 26 72Males 15 0 38 6 44
Service & sales workers
Female 5 0 52 20 72Males 4 0 44 20 64
Skilled agriculture & fishery workers
Female 0 0 19 3 22Males 0 0 3 6 9
Craft & related trade workers
Female 0 0 0 0 0Males 0 0 0 0 0
Plant & machine operators & assemblers
Female 0 0 0 0 0
Males 0 0 0 0 0
Elementary occupations
Female 3 0 0 0 0Male 1 0 0 0 0
Sub-total Female 151 0 203 78 281Male 95 0 173 62 235
TOTAL 246 0 376 140 516
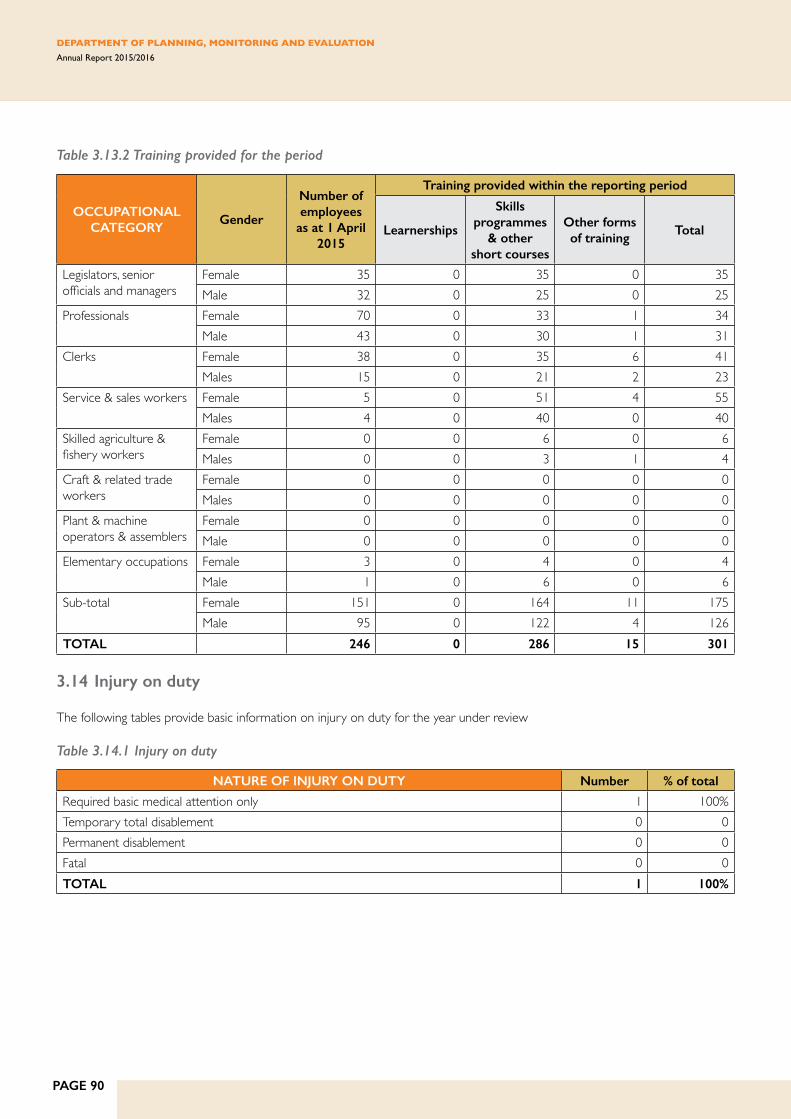
PAGE 90
DEPARTMENT OF PLANNING, MONITORING AND EVALUATION Annual Report 2015/2016
Table 3.13.2 Training provided for the period
OCCUPATIONAL CATEGORY
Gender
Number of employees
as at 1 April 2015
Training provided within the reporting period
Learnerships
Skills programmes
& other short courses
Other forms of training
Total
Legislators, senior officials and managers
Female 35 0 35 0 35Male 32 0 25 0 25
Professionals Female 70 0 33 1 34Male 43 0 30 1 31
Clerks Female 38 0 35 6 41Males 15 0 21 2 23
Service & sales workers Female 5 0 51 4 55Males 4 0 40 0 40
Skilled agriculture & fishery workers
Female 0 0 6 0 6Males 0 0 3 1 4
Craft & related trade workers
Female 0 0 0 0 0Males 0 0 0 0 0
Plant & machine operators & assemblers
Female 0 0 0 0 0Male 0 0 0 0 0
Elementary occupations Female 3 0 4 0 4Male 1 0 6 0 6
Sub-total Female 151 0 164 11 175Male 95 0 122 4 126
TOTAL 246 0 286 15 301
3.14 Injury on duty
The following tables provide basic information on injury on duty for the year under review
Table 3.14.1 Injury on duty
NATURE OF INJURY ON DUTY Number % of total
Required basic medical attention only 1 100%Temporary total disablement 0 0Permanent disablement 0 0Fatal 0 0TOTAL 1 100%

PAGE 91
3.15 Utilisation of Service Providers
Table 3.15.1 – Report on consultant appointments using appropriated funds
PROJECT TITLE Total number of consultants
that worked on projectDuration: Work days
Contract value in Rand
Support to the integrated national water plan water CGE simulation
5 43 114,000.00
Mediation support for ERU 4 217 495,330.00 Advisory Services for Operation Phakisa: Education 15 119 8,592,084.69 Advisory Services for Operation Phakisa: Mining 17 43 13,000,070.00 Web-enabled application for LGMIM 7 258 874,608.00 Hotline Website 1 27 75,240.00 Operation Phakisa Management and Monitoring system
1 85 547,200.00
Training courses for government officials and/or service providers
6 88 251,429.82
Formulation of an integrated water plan for South Africa
1 109 753,220.00
Support DPME in alignment of strategy, structure and budget to political mandate
7 144 1,265,795.12
GTAC support for Operation Phakisa: Education (PN879)
2 239 4,899,994.00
Support for DPME strategic plan workshops (PN900)
3 63 141,320.00
Operation Phakisa Oceans follow-up (PN913) 4 20 105,633.00 Support for Operation Phakisa: Mining (PN878) 3 261 5,744,609.00 Implementation evaluation of National Curriculum Statement (CAPS)
21 346 1,999,073.00
Implementation Evaluation of the Extension Recovery Plan
1 269 2,000,000.00
Draft of chapter on role of centre of government in planning processes etc.
1 31 487,008.00
Implementation evaluation frameworks for the Strategic and Annual Performance Plans
8 5 1,498,478.00
Enhancement of MPAT 5 167 663,279.00 Application Developer 1 46 232,000.00 Rapid Research on the use of ICT in education 3 10 180,120.00 Implementation evaluation of 2013-2017 national drug master plan
9 284 1,588,875.00
Investigating modalities for national minimum wage 4 424 486,000.00 NIDS Wave 4 - additional work 3 196 3,061,785.00 National Income Dynamics Study (NIDS) wave 5 20 781 117,654,836.00 Content editor for urban innovation publication 4 138 538,499.52 Terms of reference for rapporteur (Urban Innovation Project Conference)
3 43 185,090.40
Total Individual Consultants
Total Duration: Work Days
Total Contract Value In Rand
Total Number Of Projects
159 4 456 167,435,577.55 27
Note: This table only refers to contracts concluded in the 2015/16 financial year. Contract duration and value includes full duration of contract and may span more than one financial year. Working days refer to the full duration of the contract.

PAGE 92
DEPARTMENT OF PLANNING, MONITORING AND EVALUATION Annual Report 2015/2016
Table 3.15.2 – Analysis of consultant appointments using appropriated funds, in terms of Historically Disadvantaged Individuals (HDIs)
PROJECT TITLE BBBEE LevelNumber of consultants from HDI groups that
work on project
Support to the integrated national water plan water CGE simulation 4 3Mediation support for ERU 1 1Advisory Services for Operation Phakisa: Education 2 10Advisory Services for Operation Phakisa: Mining 2 13Web-enabled application for LGMIM 1 2Hotline Website 2 0Operation Phakisa Management and Monitoring system 2 0Training courses for government officials and/or service providers 2 5Formulation of an integrated water plan for South Africa 3 1Support DPME in alignment of strategy, structure and budget to political mandate
Gov Gov
GTAC support for Operation Phakisa: Education (PN879) Gov GovSupport for DPME strategic plan workshops (PN900) Gov GovOperation Phakisa Oceans follow-up (PN913) Gov GovSupport for Operation Phakisa: Mining (PN878) Gov GovImplementation evaluation of National Curriculum Statement (CAPS)
3 17
Implementation Evaluation of the Extension Recovery Plan 3 1Draft of chapter on role of centre of government in planning processes etc.
3 1
Implementation evaluation frameworks for the Strategic and Annual Performance Plans
1 6
Enhancement of MPAT 3 2Application Developer 3 1Rapid Research on the use of ICT in education 4 2Implementation evaluation of 2013-2017 national drug master plan 2 5Investigating modalities for national minimum wage 5 2NIDS Wave 4 - additional work 5 2National Income Dynamics Study (NIDS) wave 5 5 16Content editor for urban innovation publication 4 3Terms of reference for rapporteur (Urban Innovation Project Conference)
1 2
Note: On 7 December 2011, the revised PPPFA regulations came into effect and HDI status was replaced by Broad-Based Black Economic Empowerment (B-BBEE) status level contribution for contracts from R30,000.

PAGE 93
Table 3.15.3 – Report on consultant appointments using Donor funds
PROJECT TITLE
Total number of consultants
that worked on project
Duration: Work days
Contract value in Rand
Implementation Evaluation of Citizen-Based Monitoring Model 7 215 998,884.00 Development MPAT toolkit 5 117 1,471,512.00
Total individual consultants
Total duration: Work daysTotal contract value in Rand
Total number of projects
12 332 2,470,396.00 2
Note: This table only refers to contracts concluded in the 2015/2015 financial year. Contract duration and value includes full duration of contract and may span more than one financial year. Working days refer to the full duration of the contract.
Table 3.15.4 – Analysis of consultant appointments using Donor funds, in terms of HDIs
PROJECT TITLE BBBEE Level
Number of consultants from HDI groups that
work on the project
Implementation Evaluation of Citizen-Based Monitoring Model 1 4Development MPAT toolkit 1 2
Note: On 7 December 2011, the revised PPPFA regulations came into effect and HDI status was replaced by B-BEEE status level contribution for contracts from R30, 000.
3.16 Severance Packages
Granting of employee initiated severance packages for the period 1 April 2015 and 31 March 2016
None

PAGE 94
DEPARTMENT OF PLANNING, MONITORING AND EVALUATION Annual Report 2015/2016
PART E

PAGE 95
Index
1 Report of the Auditor-General 96
2 Appropriation Statement for the year ended 31 March 2016 99
3 Notes to the Appropriation Statement 113
4 Statement of Financial Performance (R’000) 114
5 Statement of Financial Position (R’000) 115
6 Statement of Changes in Net Assets 115
7 Cash Flow Statement (R’000) 116
8 Statement of Accounting Polices and Related matters 117
9 Notes to the Annual Financial Statements (R’000) 122
10 Annexures to the Financial Statements (R‘000) 136
FINANCIAL INFORMATION
Annual financial statements for the department of planning, monitoring and evaluation For the year ended 31 March 2016

PAGE 96
DEPARTMENT OF PLANNING, MONITORING AND EVALUATION Annual Report 2015/2016
1. Report of the Auditor-GeneralReport of the Auditor-General to Parliament on vote no. 8: Department of Planning, Monitoring and Evaluation
Report on the financial statements
Introduction
1. I have audited the financial statements of the Department of Planning, Monitoring and Evaluation (DPME) set out on pages 99 to 135, which comprise the appropriation statement, the statement of financial position as at 31 March 2016, the statement of financial performance, of changes in net assets and cash flow statement for the year then ended, as well as the notes, comprising a summary of significant accounting policies and other explanatory information.
Accounting Officer’s responsibility for the financial statements
2. The accounting officer is responsible for the preparation and fair presentation of these financial statements in accordance with the Modified Cash Standards as prescribed by National Treasury and the requirements of the Public Finance Management Act of South Africa, 1999 (Act No. 1 of 1999)(PFMA), and for such internal control as the accounting officer determines is necessary to enable the preparation of financial statements that are free from material misstatement, whether due to fraud or error.
Auditor-General’s responsibility
3. My responsibility is to express an opinion on these financial statements based on my audit. I conducted my audit in accordance with International Standards on Auditing. Those standards require that I comply with ethical requirements, and plan and perform the audit to obtain reasonable assurance about whether the financial statements are free from material misstatement.
4. An audit involves performing procedures to obtain audit evidence about the amounts and disclosures in the financial statements. The procedures selected depend on the auditor’s judgement, including the assessment of the risks of material misstatement of the financial statements, whether due to fraud or error. In making those risk assessments, the auditor considers internal control relevant to the entity’s preparation and fair presentation of the financial statements in order to design audit procedures that are appropriate in the circumstances, but not for the purpose of expressing an opinion on the effectiveness of the entity’s internal control. An audit also includes evaluating the appropriateness of accounting policies used and the reasonableness of accounting estimates made by management, as well as evaluating the overall presentation of the financial statements.
5. I believe that the audit evidence I have obtained is sufficient and appropriate to provide a basis for my audit opinion.
Opinion
6. In my opinion, the financial statements present fairly, in all material respects, the financial position of the Department of Planning, Monitoring and Evaluation as at 31 March 2016 and its financial performance and cash flows for the year then ended, in accordance with the Modified Cash Standards as prescribed by National Treasury and the requirements of the Public Finance Management Act of South Africa, 1999(Act No. 1 of 1999) (PFMA).
Report on other legal and regulatory requirements
7. In accordance with the Public Audit Act of South Africa, 2004 (Act No. 25 of 2004) and the general notice issued in terms thereof, I have a responsibility to report findings on the reported performance information against predetermined objectives of selected programmes presented in the annual performance report, compliance with legislation and internal control. The objective of my test was to identify reportable findings as described under each subheading but not to gather evidence to express assurance on these matters. Accordingly, I do not express an opinion or conclusion on these matters.
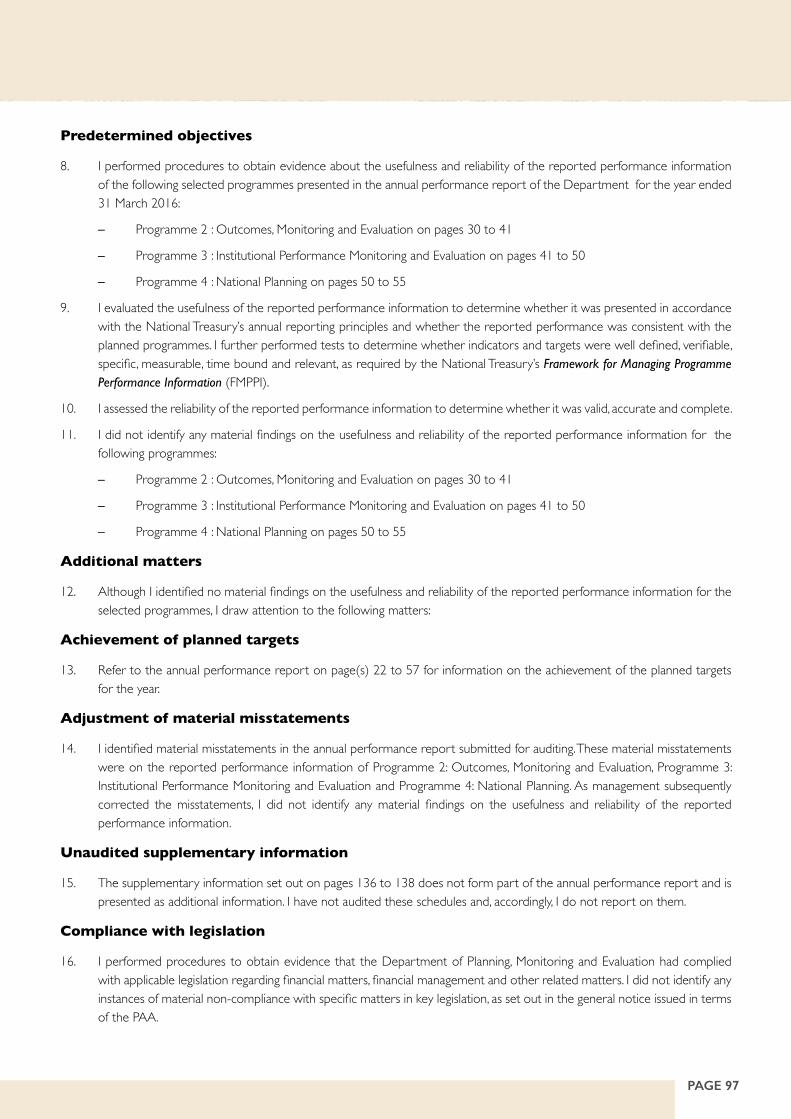
PAGE 97
Predetermined objectives
8. I performed procedures to obtain evidence about the usefulness and reliability of the reported performance information of the following selected programmes presented in the annual performance report of the Department for the year ended 31 March 2016:
– Programme 2 : Outcomes, Monitoring and Evaluation on pages 30 to 41
– Programme 3 : Institutional Performance Monitoring and Evaluation on pages 41 to 50
– Programme 4 : National Planning on pages 50 to 55
9. I evaluated the usefulness of the reported performance information to determine whether it was presented in accordance with the National Treasury’s annual reporting principles and whether the reported performance was consistent with the planned programmes. I further performed tests to determine whether indicators and targets were well defined, verifiable, specific, measurable, time bound and relevant, as required by the National Treasury’s Framework for Managing Programme Performance Information (FMPPI).
10. I assessed the reliability of the reported performance information to determine whether it was valid, accurate and complete.
11. I did not identify any material findings on the usefulness and reliability of the reported performance information for the following programmes:
– Programme 2 : Outcomes, Monitoring and Evaluation on pages 30 to 41
– Programme 3 : Institutional Performance Monitoring and Evaluation on pages 41 to 50
– Programme 4 : National Planning on pages 50 to 55
Additional matters
12. Although I identified no material findings on the usefulness and reliability of the reported performance information for the selected programmes, I draw attention to the following matters:
Achievement of planned targets
13. Refer to the annual performance report on page(s) 22 to 57 for information on the achievement of the planned targets for the year.
Adjustment of material misstatements
14. I identified material misstatements in the annual performance report submitted for auditing. These material misstatements were on the reported performance information of Programme 2: Outcomes, Monitoring and Evaluation, Programme 3: Institutional Performance Monitoring and Evaluation and Programme 4: National Planning. As management subsequently corrected the misstatements, I did not identify any material findings on the usefulness and reliability of the reported performance information.
Unaudited supplementary information
15. The supplementary information set out on pages 136 to 138 does not form part of the annual performance report and is presented as additional information. I have not audited these schedules and, accordingly, I do not report on them.
Compliance with legislation
16. I performed procedures to obtain evidence that the Department of Planning, Monitoring and Evaluation had complied with applicable legislation regarding financial matters, financial management and other related matters. I did not identify any instances of material non-compliance with specific matters in key legislation, as set out in the general notice issued in terms of the PAA.

PAGE 98
DEPARTMENT OF PLANNING, MONITORING AND EVALUATION Annual Report 2015/2016
Internal control
17. I considered internal control relevant to my audit of the financial statements, annual performance report and compliance with legislation. I did not identify any significant deficiencies in internal control.
Pretoria
29 July 2016

PAGE 99
2. Ap
prop
riatio
n St
atem
ent f
or th
e ye
ar e
nded
31
Mar
ch 2
016
DEP
ART
MEN
TAL
APP
RO
PRIA
TIO
N
PER
PR
OG
RA
MM
E
2015
/16
(‘00
0)20
14/1
5 (‘
000)
Adj
uste
d A
ppro
pria
tion
Shift
ing
of
Fund
sV
irem
ent
Fina
l A
ppro
pria
tion
Act
ual
Expe
ndit
ure
Var
ianc
eEx
p. a
s %
of
final
app
r.Fi
nal
App
ropr
iati
onA
ctua
l Ex
pend
itur
e1.
Adm
inistr
atio
n10
4 18
5 -
7 68
7 11
1 87
2 11
1 87
2 -
100.0
%85
851
80
915
2.
Out
com
es M
onito
ring
& Ev
aluat
ion
92 3
24
- (2
237
) 90
087
89
560
52
7 99
.4%89
343
83
950
3.
Insti
tutio
nal P
erfo
rman
ce M
onito
ring
& Ev
aluat
ion
60 4
31
-19
5 60
626
60
626
-
100.0
%63
466
62
311
4. N
atio
nal P
lannin
g82
197
-
(6 5
65)
75 6
32
70 7
36
4 89
6 93
.5%81
872
68
661
5.
Nat
iona
l You
th D
evelo
pmen
t41
5 06
3 -
920
415
983
415
983
-10
0.0%
413
310
413
310
SUB
TO
TAL
754
200
--
754
200
748
777
5 42
3 99
.3%
733
842
709
147
Stat
utor
y App
ropr
iatio
n-
--
--
-0.0
%
TO
TAL
754
200
--
754
200
748
777
5 42
3 99
.3%
733
842
709
147
Reco
ncilia
tion
with
Sta
tem
ent o
f Fina
ncial
Pe
rform
ance
ADD
Dep
artm
enta
l rec
eipts
417
88 A
id a
ssist
ance
34 0
2126
826
Actu
al am
ount
s per
stat
emen
t of fi
nanc
ial p
erfo
rman
ce (t
otal
reve
nue)
788
638
760
756
ADD
Aid
assis
tanc
e26
692
13 0
11
Actu
al am
ount
per
stat
emen
t of fi
nanc
ial p
erfo
rman
ce
(exp
endi
ture
)77
5 46
972
2 15
8
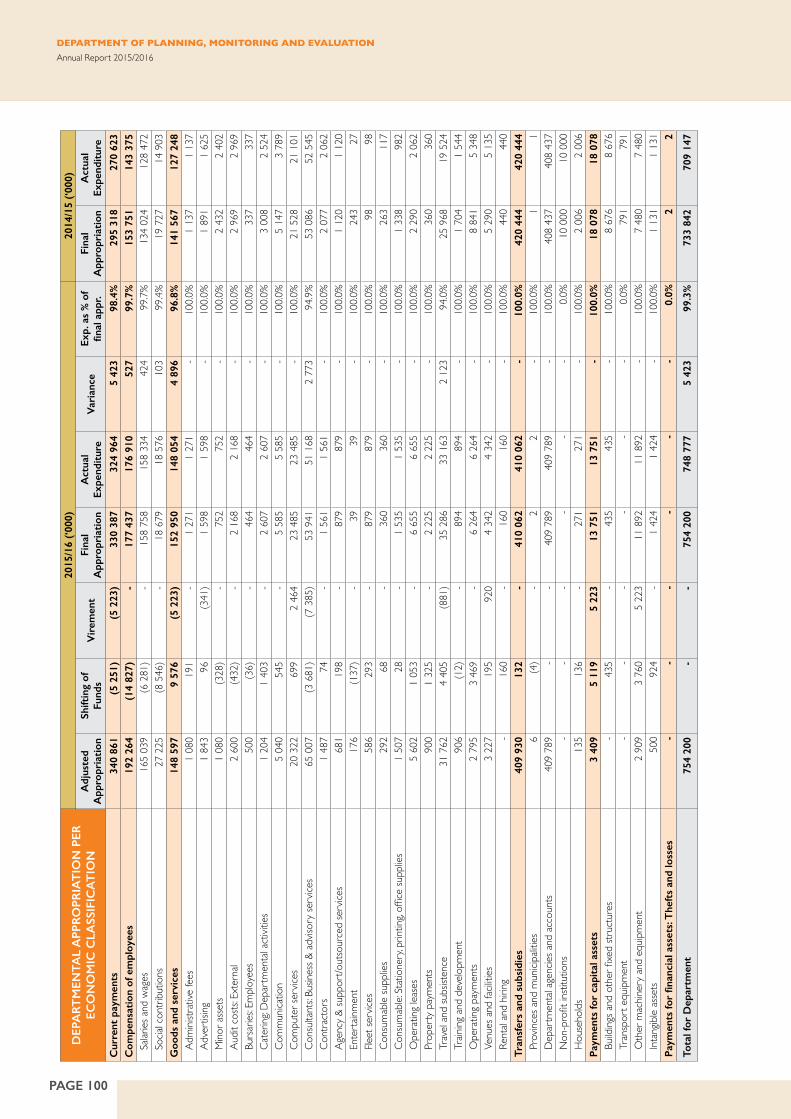
PAGE 100
DEPARTMENT OF PLANNING, MONITORING AND EVALUATION Annual Report 2015/2016
DEP
ART
MEN
TAL
APP
RO
PRIA
TIO
N P
ER
ECO
NO
MIC
CLA
SSIF
ICA
TIO
N
2015
/16
(‘00
0)20
14/1
5 (‘
000)
Adj
uste
d A
ppro
pria
tion
Shift
ing
of
Fund
sV
irem
ent
Fina
l A
ppro
pria
tion
Act
ual
Expe
ndit
ure
Var
ianc
eEx
p. a
s %
of
final
app
r.Fi
nal
App
ropr
iati
onA
ctua
l Ex
pend
itur
e
Cur
rent
pay
men
ts34
0 86
1 (
5 25
1)
(5
223)
33
0 38
7 32
4 96
4 5
423
98.4
%29
5 31
8 27
0 62
3 C
ompe
nsat
ion
of e
mpl
oyee
s19
2 26
4 (
14 8
27)
-17
7 43
7 17
6 91
0 52
7 99
.7%
153
751
143
375
Salar
ies a
nd w
ages
165
039
(6 2
81)
-15
8 75
8 15
8 33
4 42
4 99
.7%13
4 02
4 12
8 47
2 So
cial c
ontri
butio
ns27
225
(8
546
) -
18 6
79
18 5
76
103
99.4%
19 7
27
14 9
03
Goo
ds a
nd s
ervi
ces
148
597
9 57
6 (
5 22
3)
152
950
148
054
4 89
6 96
.8%
141
567
127
248
Adm
inistr
ative
fees
1 08
0 19
1 -
1 27
1 1
271
-10
0.0%
1 13
7 1
137
Adve
rtisi
ng1
843
96
(341
) 1
598
1 59
8 -
100.0
%1
891
1 62
5 M
inor a
sset
s1
080
(328
) -
752
752
-10
0.0%
2 43
2 2
402
Audi
t cos
ts: E
xter
nal
2 60
0 (4
32)
-2
168
2 16
8 -
100.0
%2
969
2 96
9 Bu
rsar
ies: E
mpl
oyee
s50
0 (3
6)
-46
4 46
4 -
100.0
%33
7 33
7 Ca
terin
g: D
epar
tmen
tal a
ctivi
ties
1 20
4 1
403
-2
607
2 60
7 -
100.0
%3
008
2 52
4 Co
mm
unica
tion
5 04
0 54
5 -
5 58
5 5
585
-10
0.0%
5 14
7 3
789
Com
pute
r ser
vices
20 3
22
699
2 46
4 23
485
23
485
-
100.0
%21
528
21
101
Co
nsult
ants:
Bus
iness
& a
dviso
ry se
rvice
s65
007
(3
681
) (7
385
) 53
941
51
168
2
773
94.9%
53 0
86
52 5
45
Cont
ract
ors
1 48
7 74
-
1 56
1 1
561
-10
0.0%
2 07
7 2
062
Agen
cy &
supp
ort/o
utso
urce
d se
rvice
s68
1 19
8 -
879
879
-10
0.0%
1 12
0 1
120
Ente
rtain
men
t17
6 (1
37)
-39
39
-
100.0
%24
3 27
Fle
et se
rvice
s58
6 29
3 -
879
879
-10
0.0%
98
98
Cons
umab
le su
pplie
s29
2 68
-
360
360
-10
0.0%
263
117
Cons
umab
le: S
tatio
nery
, prin
ting,
offic
e su
pplie
s1
507
28
-1
535
1 53
5 -
100.0
%1
338
982
Ope
ratin
g lea
ses
5 60
2 1
053
-6
655
6 65
5 -
100.0
%2
290
2 06
2 Pr
oper
ty p
aym
ents
900
1 32
5 -
2 22
5 2
225
-10
0.0%
360
360
Trav
el an
d su
bsist
ence
31 7
62
4 40
5 (8
81)
35 2
86
33 1
63
2 12
3 94
.0%25
968
19
524
Tr
aining
and
dev
elopm
ent
906
(12)
-
894
894
-10
0.0%
1 70
4 1
544
Ope
ratin
g pa
ymen
ts2
795
3 46
9 -
6 26
4 6
264
-10
0.0%
8 84
1 5
348
Venu
es a
nd fa
cilitie
s3
227
195
920
4 34
2 4
342
-10
0.0%
5 29
0 5
135
Rent
al an
d hir
ing-
160
-16
0 16
0 -
100.0
%44
0 44
0 Tr
ansf
ers
and
subs
idie
s 40
9 93
0 13
2 -
410
062
410
062
-10
0.0%
420
444
420
444
Prov
inces
and
mun
icipa
lities
6 (4
) -
2 2
-10
0.0%
1 1
Dep
artm
enta
l age
ncies
and
acc
ount
s40
9 78
9 -
-40
9 78
9 40
9 78
9 -
100.0
%40
8 43
7 40
8 43
7 N
on-p
rofit
insti
tutio
ns-
- -
--
-0.0
%10
000
10
000
H
ouse
hold
s13
5 13
6 -
271
271
-10
0.0%
2 00
6 2
006
Paym
ents
for
capi
tal a
sset
s3
409
5 11
9 5
223
13 7
51
13 7
51
-10
0.0%
18 0
78
18 0
78
Build
ings a
nd o
ther
fixe
d str
uctu
res
-43
5 -
435
435
-10
0.0%
8 67
6 8
676
Tran
spor
t equ
ipm
ent
--
--
--
0.0%
791
791
Oth
er m
achin
ery
and
equip
men
t2
909
3 76
0 5
223
11 8
92
11 8
92
-10
0.0%
7 48
0 7
480
Inta
ngibl
e as
sets
500
924
-1
424
1 42
4 -
100.0
%1
131
1 13
1 Pa
ymen
ts fo
r fin
anci
al a
sset
s: T
heft
s an
d lo
sses
--
--
--
0.0%
2 2
Tota
l for
Dep
artm
ent
754
200
--
754
200
748
777
5 42
3 99
.3%
733
842
709
147

PAGE 101
PRO
GR
AM
ME
1: A
DM
INIS
TR
AT
ION
A
PPR
OPR
IAT
ION
PER
SU
B-P
RO
GR
AM
ME
AN
D E
CO
NO
MIC
CLA
SSIF
ICA
TIO
N
2015
/16
(‘00
0)20
14/1
5 (‘
000)
Adj
uste
d A
ppro
pria
tion
Shift
ing
of
Fund
sV
irem
ent
Fina
l A
ppro
pria
tion
Act
ual
Expe
ndit
ure
Var
ianc
eEx
p. a
s %
of
final
app
r.Fi
nal
App
ropr
iati
onA
ctua
l Ex
pend
itur
eD
epar
tmen
tal M
anag
emen
t9
822
(1 6
05)
-8
217
8 21
7 -
100.0
%16
405
12
091
Co
rpor
ate
and
Finan
cial S
ervic
es36
386
2
080
-38
466
38
466
-
100.0
%40
822
40
631
In
form
atio
n Tec
hnol
ogy
Supp
ort
20 1
97
(1 8
78)
7 68
7 26
006
26
006
-
100.0
%25
648
25
289
In
tern
al Au
ditin
g3
379
(241
) -
3 13
8 3
138
-10
0.0%
2 97
6 2
904
Mini
steria
l Sup
port
34 4
01
1 64
4 -
36 0
45
36 0
45
-10
0.0%
--
Tota
l for
Sub
-pro
gram
mes
104
185
-7
687
111
872
111
872
-10
0.0%
85 8
51
80 9
15
Cur
rent
pay
men
ts10
1 61
5 (
536)
2
464
103
543
103
543
-10
0.0%
69 0
14
64 0
78
Com
pens
atio
n of
em
ploy
ees
58 9
65
(6
208)
-
52 7
57
52 7
57
-10
0.0%
37 8
40
36 0
45
Salar
ies a
nd w
ages
50 6
60
(4 1
30)
-46
530
46
530
-
100.0
%32
850
31
704
So
cial c
ontri
butio
ns8
305
(2 0
78)
-6
227
6 22
7 -
100.0
%4
990
4 34
1 G
oods
and
ser
vice
s42
650
5
672
2 46
4 50
786
50
786
-
100.
0%31
174
28
033
Ad
mini
strat
ive fe
es11
8 33
1 -
449
449
-10
0.0%
109
109
Adve
rtisi
ng84
3 21
9 -
1 06
2 1
062
-10
0.0%
1 63
9 1
383
Mino
r ass
ets
1 08
0 (3
29)
-75
1 75
1 -
100.0
%2
402
2 39
2 Au
dit c
osts:
Ext
erna
l2
600
(432
) -
2 16
8 2
168
-10
0.0%
2 96
9 2
969
Burs
aries
: Em
ploy
ees
500
(36)
-
464
464
-10
0.0%
337
337
Cate
ring:
Dep
artm
enta
l act
ivitie
s50
3 29
8 -
801
801
-10
0.0%
313
248
Com
mun
icatio
n1
630
931
-2
561
2 56
1 -
100.0
%1
703
871
Com
pute
r ser
vices
7 59
2 53
5 2
464
10 5
91
10 5
91
-10
0.0%
8 35
3 8
046
Cons
ultan
ts: B
usine
ss &
adv
isory
serv
ices
353
1 01
8 -
1 37
1 1
371
-10
0.0%
755
755
Cont
ract
ors
1 47
6 (3
80)
-1
096
1 09
6 -
100.0
%1
875
1 87
5 Ag
ency
& su
ppor
t/out
sour
ced
serv
ices
680
199
-87
9 87
9 -
100.0
%1
120
1 12
0 En
tert
ainm
ent
81
(46)
-
35
35
-10
0.0%
7 2
Fleet
serv
ices
586
203
-78
9 78
9 -
100.0
%46
46
Co
nsum
able
supp
lies
201
87
-28
8 28
8 -
100.0
%99
74
Co
nsum
able:
Sta
tione
ry, p
rintin
g, of
fice
supp
lies
852
336
-1
188
1 18
8 -
100.0
%81
0 73
3 O
pera
ting
lease
s5
602
1 02
4 -
6 62
6 6
626
-10
0.0%
2 03
2 2
032
Prop
erty
pay
men
ts90
0 1
325
-2
225
2 22
5 -
100.0
%36
0 36
0 Tr
avel
and
subs
isten
ce15
107
17
9 -
15 2
86
15 2
86
-10
0.0%
1 99
9 1
644
Train
ing a
nd d
evelo
pmen
t90
6 (1
21)
-78
5 78
5 -
100.0
%1
020
980
Ope
ratin
g pa
ymen
ts78
5 63
-
848
848
-10
0.0%
3 05
2 1
883
Venu
es a
nd fa
cilitie
s25
5 24
0 -
495
495
-10
0.0%
110
110
Rent
al an
d hir
ing-
28
-28
28
-
100.0
%64
64
Tr
ansf
ers
and
subs
idie
s 59
70
-
129
129
-10
0.0%
227
227
Prov
inces
and
mun
icipa
lities
6 (4
) -
2 2
-10
0.0%
1 1
Dep
artm
enta
l age
ncies
and
acc
ount
s-
--
--
-0.0
%20
0 20
0 H
ouse
hold
s: So
cial B
enefi
ts53
74
-
127
127
-10
0.0%
26
26
Paym
ents
for
capi
tal a
sset
s2
511
466
5 22
3 8
200
8 20
0 -
100.
0%16
610
16
610
Bu
ilding
s and
oth
er fi
xed
struc
ture
s-
435
-43
5 43
5 -
100.0
%8
676
8 67
6 Tr
ansp
ort e
quip
men
t-
--
--
-0.0
%79
1 79
1 O
ther
mac
hiner
y an
d eq
uipm
ent
2 51
1 31
5
223
7 76
5 7
765
-10
0.0%
6 82
7 6
827
Inta
ngibl
e as
sets
--
--
--
0.0%
316
316
Tota
l for
Pro
gram
me
104
185
-7
687
111
872
111
872
-10
0.0%
85 8
51
80 9
15

PAGE 102
DEPARTMENT OF PLANNING, MONITORING AND EVALUATION Annual Report 2015/2016
SUB
-PR
OG
RA
MM
E 1.
1: D
EPA
RTM
ENTA
L M
AN
AG
EMEN
T
2015
/16
(‘00
0)20
14/1
5 (‘
000)
Adj
uste
d A
ppro
pria
tion
Shift
ing
of
Fund
sV
irem
ent
Fina
l A
ppro
pria
tion
Act
ual
Expe
ndit
ure
Var
ianc
eEx
p. a
s %
of
final
app
r.Fi
nal
App
ropr
iati
onA
ctua
l Ex
pend
itur
eC
urre
nt p
aym
ents
9 76
2 (
1 81
7)
-7
945
7 94
5 -
100.
0%16
301
11
987
Co
mpe
nsat
ion
of e
mpl
oyee
s7
815
(3 4
86)
-4
329
4 32
9 -
100.0
%8
469
7 29
6 G
oods
and
serv
ices
1 94
7 1
669
-3
616
3 61
6 -
100.0
%7
832
4 69
1 Tr
ansf
ers
and
subs
idie
s -
--
--
-0.
0%6
6 H
ouse
hold
s: So
cial B
enefi
ts-
--
--
-0.0
%6
6 Pa
ymen
ts fo
r ca
pita
l ass
ets
60
212
-27
2 27
2 -
100.
0%98
98
O
ther
mac
hiner
y an
d eq
uipm
ent
60
212
-27
2 27
2 -
100.0
%98
98
To
tal
9 82
2 (
1 60
5)
-8
217
8 21
7 -
100.
0%16
405
12
091
SUB
-PR
OG
RA
MM
E 1.
2: C
OR
POR
AT
E A
ND
FI
NA
NC
IAL
SERV
ICES
2015
/16
(‘00
0)20
14/1
5 (‘
000)
Adj
uste
d A
ppro
pria
tion
Shift
ing
of
Fund
sV
irem
ent
Fina
l A
ppro
pria
tion
Act
ual
Expe
ndit
ure
Var
ianc
eEx
p. a
s %
of
final
app
r.Fi
nal
App
ropr
iati
onA
ctua
l Ex
pend
itur
e
Cur
rent
pay
men
ts35
788
1
653
-37
441
37
441
-
100.
0%30
633
30
442
Co
mpe
nsat
ion
of e
mpl
oyee
s22
213
(4
14)
-21
799
21
799
-
100.0
%18
347
18
156
G
oods
and
serv
ices
13 5
75
2 06
7 -
15 6
42
15 6
42
-10
0.0%
12 2
86
12 2
86
Tran
sfer
s an
d su
bsid
ies
38
32
-70
70
-
100.
0%22
1 22
1 Pr
ovinc
es a
nd m
unici
paliti
es2
--
2 2
-10
0.0%
1 1
Dep
artm
enta
l age
ncies
and
acc
ount
s-
--
--
-0.0
%20
0 20
0 H
ouse
hold
s: So
cial B
enefi
ts36
32
-
68
68
-10
0.0%
20
20
Paym
ents
for
capi
tal a
sset
s56
0 39
5 -
955
955
-10
0.0%
9 96
8 9
968
Build
ings a
nd o
ther
fixe
d str
uctu
res
-43
5 -
435
435
-10
0.0%
6 62
4 6
624
Tran
spor
t equ
ipm
ent
--
--
--
0.0%
791
791
Oth
er m
achin
ery
and
equip
men
t56
0 (4
0)
-52
0 52
0 -
100.0
%2
553
2 55
3 To
tal
36 3
86
2 08
0 -
38 4
66
38 4
66
-10
0.0%
40 8
22
40 6
31
SUB
-PR
OG
RA
MM
E 1.
3: IN
FOR
MA
TIO
N
TEC
HN
OLO
GY
SU
PPO
RT
2015
/16
(‘00
0)20
14/1
5 (‘
000)
Adj
uste
d A
ppro
pria
tion
Shift
ing
of
Fund
sV
irem
ent
Fina
l A
ppro
pria
tion
Act
ual
Expe
ndit
ure
Var
ianc
eEx
p. a
s %
of
final
app
r.Fi
nal
App
ropr
iati
onA
ctua
l Ex
pend
itur
e
Cur
rent
pay
men
ts18
797
(
1 91
0)
2 46
4 19
351
19
351
-
100.
0%19
107
18
748
Co
mpe
nsat
ion
of e
mpl
oyee
s9
807
(2 6
04)
-7
203
7 20
3 -
100.0
%9
002
8 64
3 G
oods
and
serv
ices
8 99
0 69
4 2
464
12 1
48
12 1
48
-10
0.0%
10 1
05
10 1
05
Tran
sfer
s an
d su
bsid
ies
-32
-
32
32
-10
0.0%
--
Hou
seho
lds:
Socia
l Ben
efits
-32
-
32
32
-10
0.0%
--
Paym
ents
for
capi
tal a
sset
s1
400
-5
223
6 62
3 6
623
-10
0.0%
6 54
1 6
541
Build
ings a
nd o
ther
fixe
d str
uctu
res
--
--
--
0.0%
2 05
2 2
052
Oth
er m
achin
ery
and
equip
men
t1
400
-5
223
6 62
3 6
623
-10
0.0%
4 17
3 4
173
Inta
ngibl
e as
sets
--
--
--
0.0%
316
316
Tota
l20
197
(
1 87
8)
7 68
7 26
006
26
006
-
100.
0%25
648
25
289

PAGE 103
SUB
-PR
OG
RA
MM
E 1.
4: IN
TER
NA
L A
UD
ITIN
G
2015
/16
(‘00
0)
2014
/15
(‘00
0)
Adj
uste
d A
ppro
pria
tion
Shift
ing
of
Fund
sV
irem
ent
Fina
l A
ppro
pria
tion
Act
ual
Expe
ndit
ure
Var
ianc
eEx
p. a
s %
of
final
app
r.Fi
nal
App
ropr
iati
onA
ctua
l Ex
pend
itur
e
Cur
rent
pay
men
ts3
362
(27
0)
-3
092
3 09
2 -
100.
0%2
973
2 90
1 Co
mpe
nsat
ion
of e
mpl
oyee
s2
419
(636
) -
1 78
3 1
783
-10
0.0%
2 02
2 1
950
Goo
ds a
nd se
rvice
s94
3 36
6 -
1 30
9 1
309
-10
0.0%
951
951
Tran
sfer
s an
d su
bsid
ies
17
--
17
17
-10
0.0%
--
Hou
seho
lds:
Socia
l Ben
efits
17
--
17
17
-10
0.0%
--
Paym
ents
for
capi
tal a
sset
s-
29
-29
29
-
100.
0%3
3 O
ther
mac
hiner
y an
d eq
uipm
ent
-29
-
29
29
-10
0.0%
3 3
Tota
l3
379
(24
1)
-3
138
3 13
8 -
100.
0%2
976
2 90
4
SUB
-PR
OG
RA
MM
E 1.
5: M
INIS
TRY
2015
/16
(‘00
0)20
14/1
5 (‘
000)
Adj
uste
d A
ppro
pria
tion
Shift
ing
of
Fund
sV
irem
ent
Fina
l A
ppro
pria
tion
Act
ual
Expe
ndit
ure
Var
ianc
eEx
p. a
s %
of
final
app
r.Fi
nal
App
ropr
iati
onA
ctua
l Ex
pend
itur
e
Cur
rent
pay
men
ts33
906
1
808
-35
714
35
714
-
100.
0%-
-Co
mpe
nsat
ion
of e
mpl
oyee
s16
711
93
2 -
17 6
43
17 6
43
-10
0.0%
--
Goo
ds a
nd se
rvice
s17
195
87
6 -
18 0
71
18 0
71
-10
0.0%
--
Tran
sfer
s an
d su
bsid
ies
4 6
-10
10
-
100.
0%-
-Pr
ovinc
es a
nd m
unici
paliti
es4
(4)
--
--
0.0%
--
Hou
seho
lds:
Socia
l Ben
efits
-10
-
10
10
-10
0.0%
--
Paym
ents
for
capi
tal a
sset
s49
1 (
170)
-
321
321
-10
0.0%
--
Oth
er m
achin
ery
and
equip
men
t49
1 (1
70)
-32
1 32
1 -
100.0
%-
-To
tal
34 4
01
1 64
4 -
36 0
45
36 0
45
-10
0.0%
--
*Not
e: T
he o
ffice
s of
the
Min
iste
r an
d D
eput
y M
inis
ter
wer
e tr
ansf
erre
d fr
om t
he P
resi
denc
y to
DPM
E on
1 O
ctob
er 2
015.
His
toric
al a
ppro
pria
tion
and
expe
nditu
re a
re d
iscl
osd
in t
he fi
nanc
ial s
tate
men
ts o
f the
Pres
iden
cy.

PAGE 104
DEPARTMENT OF PLANNING, MONITORING AND EVALUATION Annual Report 2015/2016
PRO
GR
AM
ME
2: O
UT
CO
MES
M&
E A
PPR
OPR
IAT
ION
PER
SU
B-P
RO
GR
AM
ME
AN
D E
CO
NO
MIC
CLA
SSIF
ICA
TIO
N
2015
/16
(‘00
0)20
14/1
5 (‘
000)
Adj
uste
d A
ppro
pria
tion
Shift
ing
of
Fund
sV
irem
ent
Fina
l A
ppro
pria
tion
Act
ual
Expe
ndit
ure
Var
ianc
eEx
p. a
s %
of
final
app
r.Fi
nal
App
ropr
iati
onA
ctua
l Ex
pend
itur
e
Prog
ram
me
Man
agem
ent f
or O
ME
2 62
8 (2
38)
-2
390
2 39
0 -
100.0
%3
182
3 18
2 O
utco
mes
Sup
port
64 4
30
(202
) -
64 2
28
63 7
01
527
99.2%
63 7
88
58 6
30
Evalu
atio
n an
d Re
sear
ch25
266
44
0 (2
237
) 23
469
23
469
-
100.0
%22
373
22
138
To
tal f
or S
ub-p
rogr
amm
es92
324
-
(2
237)
90
087
89
560
52
7 99
.4%
89 3
43
83 9
50
Cur
rent
pay
men
ts91
925
(
729)
(
2 23
7)
88 9
59
88 4
32
527
99.4
%89
040
83
647
C
ompe
nsat
ion
of e
mpl
oyee
s64
673
(
2 80
8)
-61
865
61
338
52
7 99
.1%
55 4
57
50 0
64
Salar
ies a
nd w
ages
55 3
53
506
-55
859
55
435
42
4 99
.2%48
357
45
351
So
cial c
ontri
butio
ns9
320
(3 3
14)
-6
006
5 90
3 10
3 98
.3%7
100
4 71
3 G
oods
and
ser
vice
s27
252
2
079
(2
237)
27
094
27
094
-
100.
0%33
583
33
583
Ad
mini
strat
ive fe
es32
1 (7
) -
314
314
-10
0.0%
723
723
Adve
rtisi
ng-
191
-19
1 19
1 -
100.0
%36
36
M
inor a
sset
s-
1 -
1 1
-10
0.0%
8 8
Cate
ring:
Dep
artm
enta
l act
ivitie
s18
3 79
0 -
973
973
-10
0.0%
1 30
3 1
303
Com
mun
icatio
n74
6 21
6 -
962
962
-10
0.0%
709
709
Com
pute
r ser
vices
130
(37)
-
93
93
-10
0.0%
357
357
Cons
ultan
ts: B
usine
ss &
adv
isory
serv
ices
17 6
60
(909
) (2
237
) 14
514
14
514
-
100.0
%16
287
16
287
Co
ntra
ctor
s-
113
-11
3 11
3 -
100.0
%10
10
Ag
ency
& su
ppor
t/out
sour
ced
serv
ices
1 (1
) -
--
-0.0
%-
-En
tert
ainm
ent
43
(39)
-
4 4
-10
0.0%
3 3
Fleet
serv
ices
-14
-
14
14
-10
0.0%
4 4
Cons
umab
le su
pplie
s8
37
-45
45
-
100.0
%24
24
Co
nsum
able:
Sta
tione
ry, p
rintin
g, of
fice
supp
lies
339
(130
) -
209
209
-10
0.0%
144
144
Ope
ratin
g lea
ses
-17
-
17
17
-10
0.0%
--
Trav
el an
d su
bsist
ence
5 73
5 1
974
-7
709
7 70
9 -
100.0
%8
521
8 52
1 Tr
aining
and
dev
elopm
ent
-56
-
56
56
-10
0.0%
556
556
Ope
ratin
g pa
ymen
ts56
0 42
3 -
983
983
-10
0.0%
968
968
Venu
es a
nd fa
cilitie
s1
526
(662
) -
864
864
-10
0.0%
3 65
8 3
658
Rent
al an
d hir
ing-
32
-32
32
-
100.0
%27
2 27
2 Tr
ansf
ers
and
subs
idie
s 24
-
-24
24
-
100.
0%10
8 10
8 H
ouse
hold
s: So
cial B
enefi
ts24
-
-24
24
-
100.0
%10
8 10
8 Pa
ymen
ts fo
r ca
pita
l ass
ets
375
729
-1
104
1 10
4 -
100.
0%19
5 19
5 O
ther
mac
hiner
y an
d eq
uipm
ent
175
(25)
-
150
150
-10
0.0%
170
170
Inta
ngibl
e as
sets
200
754
-95
4 95
4 -
100.0
%25
25
To
tal f
or P
rogr
amm
e92
324
-
(2
237)
90
087
89
560
52
7 99
.4%
89 3
43
83 9
50

PAGE 105
SUB
-PR
OG
RA
MM
E 2.
1: P
RO
GR
AM
ME
MA
NA
GEM
ENT
FO
R O
ME
2015
/16
(‘00
0)20
14/1
5 (‘
000)
Adj
uste
d A
ppro
pria
tion
Shift
ing
of
Fund
sV
irem
ent
Fina
l A
ppro
pria
tion
Act
ual
Expe
ndit
ure
Var
ianc
eEx
p. a
s %
of
final
app
r.Fi
nal
App
ropr
iati
onA
ctua
l Ex
pend
itur
e
Cur
rent
pay
men
ts2
628
(23
8)
-2
390
2 39
0 -
100.
0%3
182
3 18
2
Com
pens
atio
n of
em
ploy
ees
2 14
5 (1
59)
-1
986
1 98
6 -
100.0
%2
099
2 09
9
Goo
ds a
nd se
rvice
s48
3 (7
9)
-40
4 40
4 -
100.0
%1
083
1 08
3
Tota
l2
628
(23
8)
-2
390
2 39
0 -
100.
0%3
182
3 18
2
SUB
-PR
OG
RA
MM
E 2.
2: O
UT
CO
MES
SU
PPO
RT
2015
/16
(‘00
0)20
14/1
5 (‘
000)
Adj
uste
d A
ppro
pria
tion
Shift
ing
of
Fund
sV
irem
ent
Fina
l A
ppro
pria
tion
Act
ual
Expe
ndit
ure
Var
ianc
eEx
p. a
s %
of
final
app
r.Fi
nal
App
ropr
iati
onA
ctua
l Ex
pend
itur
e
Cur
rent
pay
men
ts64
109
(
980)
-
63 1
29
62 6
02
527
99.2
%63
552
58
394
Co
mpe
nsat
ion
of e
mpl
oyee
s53
095
(2
416
) -
50 6
79
50 1
52
527
99.0%
44 8
97
39 7
39
Goo
ds a
nd se
rvice
s11
014
1
436
-12
450
12
450
-
100.0
%18
655
18
655
Tr
ansf
ers
and
subs
idie
s 5
--
5 5
-10
0.0%
108
108
Hou
seho
lds:
Socia
l Ben
efits
5 -
-5
5 -
100.0
%10
8 10
8 Pa
ymen
ts fo
r ca
pita
l ass
ets
316
778
-1
094
1 09
4 -
100.
0%12
8 12
8 O
ther
mac
hiner
y an
d eq
uipm
ent
116
24
-14
0 14
0 -
100.0
%10
3 10
3 In
tang
ible
asse
ts20
0 75
4 -
954
954
-10
0.0%
25
25
Tota
l64
430
(
202)
-
64 2
28
63 7
01
527
99.2
%63
788
58
630
SUB
-PR
OG
RA
MM
E 2.
3: E
VALU
AT
ION
AN
D
RES
EAR
CH
2015
/16
(‘00
0)20
14/1
5 (‘
000)
Adj
uste
d A
ppro
pria
tion
Shift
ing
of
Fund
sV
irem
ent
Fina
l A
ppro
pria
tion
Act
ual
Expe
ndit
ure
Var
ianc
eEx
p. a
s %
of
final
app
r.Fi
nal
App
ropr
iati
onA
ctua
l Ex
pend
itur
e
Cur
rent
pay
men
ts25
188
48
9 (
2 23
7)
23 4
40
23 4
40
-10
0.0%
22 3
06
22 0
71
Com
pens
atio
n of
em
ploy
ees
9 43
3 (2
33)
-9
200
9 20
0 -
100.0
%8
461
8 22
6 G
oods
and
serv
ices
15 7
55
722
(2 2
37)
14 2
40
14 2
40
-10
0.0%
13 8
45
13 8
45
Tran
sfer
s an
d su
bsid
ies
19
--
19
19
-10
0.0%
--
Hou
seho
lds:
Socia
l Ben
efits
19
--
19
19
-10
0.0%
--
Paym
ents
for
capi
tal a
sset
s59
(
49)
-10
10
-
100.
0%67
67
O
ther
mac
hiner
y an
d eq
uipm
ent
59
(49)
-
10
10
-10
0.0%
67
67
Tota
l25
266
44
0 (
2 23
7)
23 4
69
23 4
69
-10
0.0%
22 3
73
22 1
38
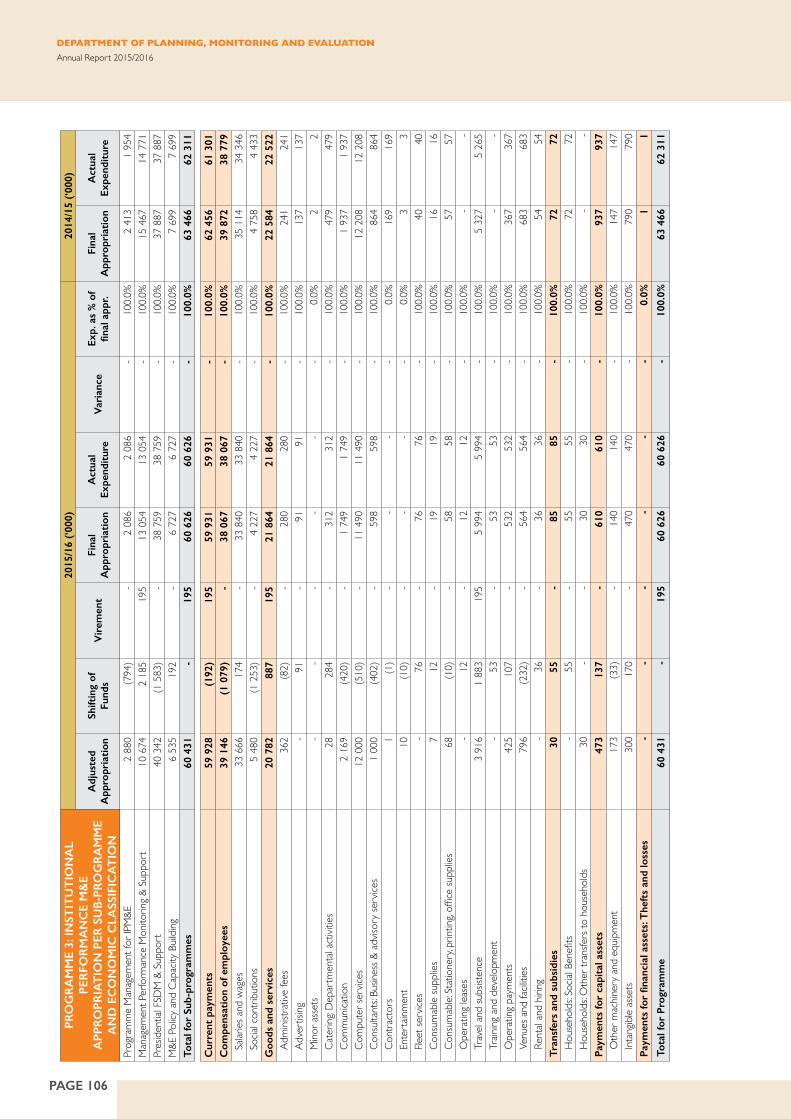
PAGE 106
DEPARTMENT OF PLANNING, MONITORING AND EVALUATION Annual Report 2015/2016
PRO
GR
AM
ME
3: IN
STIT
UT
ION
AL
PER
FOR
MA
NC
E M
&E
APP
RO
PRIA
TIO
N P
ER S
UB
-PR
OG
RA
MM
E A
ND
EC
ON
OM
IC C
LASS
IFIC
AT
ION
2015
/16
(‘00
0)20
14/1
5 (‘
000)
Adj
uste
d A
ppro
pria
tion
Shift
ing
of
Fund
sV
irem
ent
Fina
l A
ppro
pria
tion
Act
ual
Expe
ndit
ure
Var
ianc
eEx
p. a
s %
of
final
app
r.Fi
nal
App
ropr
iati
onA
ctua
l Ex
pend
itur
e
Prog
ram
me
Man
agem
ent f
or IP
M&E
2 88
0 (7
94)
-2
086
2 08
6 -
100.0
%2
413
1 95
4 M
anag
emen
t Per
form
ance
Mon
itorin
g &
Supp
ort
10 6
74
2 18
5 19
5 13
054
13
054
-
100.0
%15
467
14
771
Pr
esid
entia
l FSD
M &
Sup
port
40 3
42
(1 5
83)
-38
759
38
759
-
100.0
%37
887
37
887
M&E
Pol
icy a
nd C
apac
ity B
uildi
ng6
535
192
-6
727
6 72
7 -
100.0
%7
699
7 69
9 To
tal f
or S
ub-p
rogr
amm
es60
431
-
195
60 6
26
60 6
26
-10
0.0%
63 4
66
62 3
11
Cur
rent
pay
men
ts59
928
(
192)
19
5 59
931
59
931
-
100.
0%62
456
61
301
C
ompe
nsat
ion
of e
mpl
oyee
s39
146
(
1 07
9)
-38
067
38
067
-
100.
0%39
872
38
779
Sa
laries
and
wag
es33
666
17
4 -
33 8
40
33 8
40
-10
0.0%
35 1
14
34 3
46
Socia
l con
tribu
tions
5 48
0 (1
253
) -
4 22
7 4
227
-10
0.0%
4 75
8 4
433
Goo
ds a
nd s
ervi
ces
20 7
82
887
195
21 8
64
21 8
64
-10
0.0%
22 5
84
22 5
22
Adm
inistr
ative
fees
362
(82)
-
280
280
-10
0.0%
241
241
Adve
rtisi
ng-
91
-91
91
-
100.0
%13
7 13
7 M
inor a
sset
s-
--
--
-0.0
%2
2 Ca
terin
g: D
epar
tmen
tal a
ctivi
ties
28
284
-31
2 31
2 -
100.0
%47
9 47
9 Co
mm
unica
tion
2 16
9 (4
20)
-1
749
1 74
9 -
100.0
%1
937
1 93
7 Co
mpu
ter s
ervic
es12
000
(5
10)
-11
490
11
490
-
100.0
%12
208
12
208
Co
nsult
ants:
Bus
iness
& a
dviso
ry se
rvice
s1
000
(402
) -
598
598
-10
0.0%
864
864
Cont
ract
ors
1 (1
) -
--
-0.0
%16
9 16
9 En
tert
ainm
ent
10
(10)
-
--
-0.0
%3
3 Fle
et se
rvice
s-
76
-76
76
-
100.0
%40
40
Co
nsum
able
supp
lies
7 12
-
19
19
-10
0.0%
16
16
Cons
umab
le: S
tatio
nery
, prin
ting,
offic
e su
pplie
s68
(1
0)
-58
58
-
100.0
%57
57
O
pera
ting
lease
s-
12
-12
12
-
100.0
%-
-Tr
avel
and
subs
isten
ce3
916
1 88
3 19
5 5
994
5 99
4 -
100.0
%5
327
5 26
5 Tr
aining
and
dev
elopm
ent
-53
-
53
53
-10
0.0%
--
Ope
ratin
g pa
ymen
ts42
5 10
7 -
532
532
-10
0.0%
367
367
Venu
es a
nd fa
cilitie
s79
6 (2
32)
-56
4 56
4 -
100.0
%68
3 68
3 Re
ntal
and
hiring
-36
-
36
36
-10
0.0%
54
54
Tran
sfer
s an
d su
bsid
ies
30
55
-85
85
-
100.
0%72
72
H
ouse
hold
s: So
cial B
enefi
ts-
55
-55
55
-
100.0
%72
72
H
ouse
hold
s: O
ther
tran
sfers
to h
ouse
hold
s30
-
-30
30-
100.0
%-
-Pa
ymen
ts fo
r ca
pita
l ass
ets
473
137
-61
0 61
0 -
100.
0%93
7 93
7 O
ther
mac
hiner
y an
d eq
uipm
ent
173
(33)
-
140
140
-10
0.0%
147
147
Inta
ngibl
e as
sets
300
170
-47
0 47
0 -
100.0
%79
0 79
0 Pa
ymen
ts fo
r fin
anci
al a
sset
s: T
heft
s an
d lo
sses
--
--
--
0.0%
1 1
Tota
l for
Pro
gram
me
60 4
31
-19
5 60
626
60
626
-
100.
0%63
466
62
311

PAGE 107
SUB
-PR
OG
RA
MM
E 3.
1: P
RO
GR
AM
ME
MA
NA
GEM
ENT
FO
R IP
M&
E
2015
/16
(‘00
0)20
14/1
5 (‘
000)
Adj
uste
d A
ppro
pria
tion
Shift
ing
of
Fund
sV
irem
ent
Fina
l A
ppro
pria
tion
Act
ual
Expe
ndit
ure
Var
ianc
eEx
p. a
s %
of
final
app
r.Fi
nal
App
ropr
iati
onA
ctua
l Ex
pend
itur
e
Cur
rent
pay
men
ts2
880
(82
3)
-2
057
2 05
7 -
100.
0%2
338
1 87
9 Co
mpe
nsat
ion
of e
mpl
oyee
s2
440
(1 1
12)
-1
328
1 32
8 -
100.0
%1
893
1 49
6 G
oods
and
serv
ices
440
289
-72
9 72
9 -
100.0
%44
5 38
3 Tr
ansf
ers
and
subs
idie
s -
--
--
-0.
0%72
72
H
ouse
hold
s: So
cial B
enefi
ts-
--
--
-0.0
%72
72
Pa
ymen
ts fo
r ca
pita
l ass
ets
-29
-
29
29
-10
0.0%
3 3
Oth
er m
achin
ery
and
equip
men
t-
29
-29
29
-
100.0
%3
3 To
tal
2 88
0 (
794)
-
2 08
6 2
086
-10
0.0%
2 41
3 1
954
SUB
-PR
OG
RA
MM
E 3.
2: M
AN
AG
EMEN
T
PER
FOR
MA
NC
E M
ON
ITO
RIN
G &
SU
PPO
RT
2015
/16
(‘00
0)20
14/1
5 (‘
000)
Adj
uste
d A
ppro
pria
tion
Shift
ing
of
Fund
sV
irem
ent
Fina
l A
ppro
pria
tion
Act
ual
Expe
ndit
ure
Var
ianc
eEx
p. a
s %
of
final
app
r.Fi
nal
App
ropr
iati
onA
ctua
l Ex
pend
itur
e
Cur
rent
pay
men
ts10
316
1
999
195
12 5
10
12 5
10
-10
0.0%
14 6
48
13 9
52
Com
pens
atio
n of
em
ploy
ees
8 63
1 75
1 -
9 38
2 9
382
-10
0.0%
12 0
07
11 3
11
Goo
ds a
nd se
rvice
s1
685
1 24
8 19
5 3
128
3 12
8 -
100.0
%2
641
2 64
1 Tr
ansf
ers
and
subs
idie
s -
48
-48
48
-
100.
0%-
-H
ouse
hold
s: So
cial B
enefi
ts-
48
-48
48
-
100.0
%-
-Pa
ymen
ts fo
r ca
pita
l ass
ets
358
138
-49
6 49
6 -
100.
0%81
9 81
9 O
ther
mac
hiner
y an
d eq
uipm
ent
58
(32)
-
26
26
-10
0.0%
29
29
Inta
ngibl
e as
sets
300
170
-47
0 47
0 -
100.0
%79
0 79
0 To
tal
10 6
74
2 18
5 19
5 13
054
13
054
-
100.
0%15
467
14
771
SUB
-PR
OG
RA
MM
E 3.
3: P
RES
IDEN
TIA
L FR
ON
TLI
NE
SERV
ICE
DEL
IVER
Y
PER
FOR
MA
NC
E M
ON
ITO
RIN
G &
SU
PPO
RT
2015
/16
(‘00
0)20
14/1
5 (‘
000)
Adj
uste
d A
ppro
pria
tion
Shift
ing
of
Fund
sV
irem
ent
Fina
l A
ppro
pria
tion
Act
ual
Expe
ndit
ure
Var
ianc
eEx
p. a
s %
of
final
app
r.Fi
nal
App
ropr
iati
onA
ctua
l Ex
pend
itur
e
Cur
rent
pay
men
ts40
197
(
1 53
1)
-38
666
38
666
-
100.
0%37
774
37
774
Co
mpe
nsat
ion
of e
mpl
oyee
s22
317
(7
78)
-21
539
21
539
-
100.0
%20
819
20
819
G
oods
and
serv
ices
17 8
80
(753
) -
17 1
27
17 1
27
-10
0.0%
16 9
55
16 9
55
Tran
sfer
s an
d su
bsid
ies
30
7 -
37
37
-10
0.0%
--
Non
-pro
fit in
stitu
tions
30
(30)
-
--
-0.0
%-
-H
ouse
hold
s: So
cial B
enefi
ts-
37
-37
37
-
100.0
%-
-Pa
ymen
ts fo
r ca
pita
l ass
ets
115
(59
) -
56
56
-10
0.0%
112
112
Oth
er m
achin
ery
and
equip
men
t11
5 (5
9)
-56
56
-
100.0
%11
2 11
2 Pa
ymen
ts fo
r fin
anci
al a
sset
s: T
heft
s an
d lo
sses
--
--
--
0.0%
1 1
Tota
l40
342
(
1 58
3)
-38
759
38
759
-
100.
0%37
887
37
887
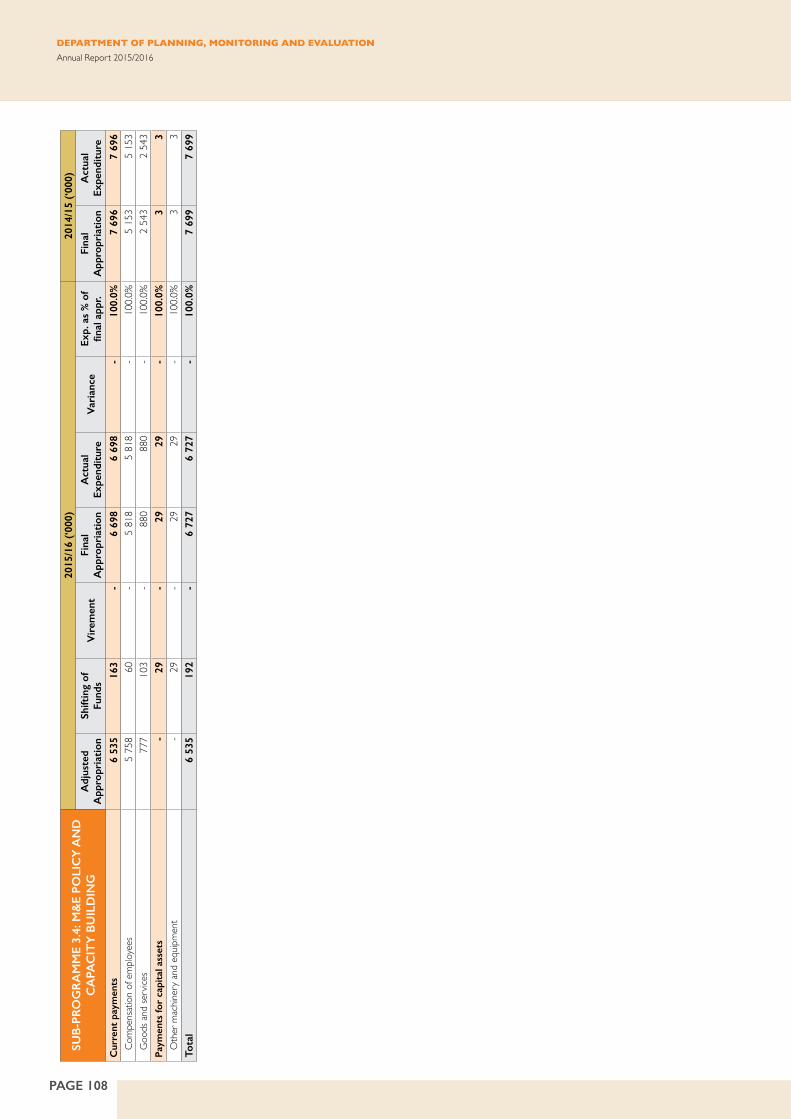
PAGE 108
DEPARTMENT OF PLANNING, MONITORING AND EVALUATION Annual Report 2015/2016
SUB
-PR
OG
RA
MM
E 3.
4: M
&E
POLI
CY
AN
D
CA
PAC
ITY
BU
ILD
ING
2015
/16
(‘00
0)20
14/1
5 (‘
000)
Adj
uste
d A
ppro
pria
tion
Shift
ing
of
Fund
sV
irem
ent
Fina
l A
ppro
pria
tion
Act
ual
Expe
ndit
ure
Var
ianc
eEx
p. a
s %
of
final
app
r.Fi
nal
App
ropr
iati
onA
ctua
l Ex
pend
itur
e
Cur
rent
pay
men
ts6
535
163
-6
698
6 69
8 -
100.
0%7
696
7 69
6 Co
mpe
nsat
ion
of e
mpl
oyee
s5
758
60
-5
818
5 81
8 -
100.0
%5
153
5 15
3 G
oods
and
serv
ices
777
103
-88
0 88
0 -
100.0
%2
543
2 54
3 Pa
ymen
ts fo
r ca
pita
l ass
ets
-29
-
29
29
-10
0.0%
3 3
Oth
er m
achin
ery
and
equip
men
t-
29
-29
29
-
100.0
%3
3 To
tal
6 53
5 19
2 -
6 72
7 6
727
-10
0.0%
7 69
9 7
699

PAGE 109
PRO
GR
AM
ME
4: N
AT
ION
AL
PLA
NN
ING
A
PPR
OPR
IAT
ION
PER
SU
B-P
RO
GR
AM
ME
AN
D E
CO
NO
MIC
CLA
SSIF
ICA
TIO
N
2015
/16
(‘00
0)20
14/1
5 (‘
000)
Adj
uste
d A
ppro
pria
tion
Shift
ing
of
Fund
sV
irem
ent
Fina
l A
ppro
pria
tion
Act
ual
Expe
ndit
ure
Var
ianc
eEx
p. a
s %
of
final
app
r.Fi
nal
App
ropr
iati
onA
ctua
l Ex
pend
itur
e
Prog
ram
me
Man
agem
ent f
or N
atio
nal P
lannin
g26
490
(6
93)
(5 4
50)
20 3
47
17 4
51
2 89
6 85
.8%26
262
16
229
Re
sear
ch a
nd P
olicy
Ser
vices
48 4
21
2 34
9 (1
115
) 49
655
47
655
2
000
96.0%
52 9
65
49 7
93
Gov
ernm
ent P
erfo
rman
ce In
form
atio
n7
286
(1 6
56)
-5
630
5 63
0 -
100.0
%2
645
2 63
9 To
tal f
or S
ub-p
rogr
amm
es82
197
-
(6
565)
75
632
70
736
4
896
93.5
%81
872
68
661
Cur
rent
pay
men
ts82
169
(
3 80
6)
(6
565)
71
798
66
902
4
896
93.2
%69
765
56
554
C
ompe
nsat
ion
of e
mpl
oyee
s27
311
(
4 64
4)
-22
667
22
667
-
100.
0%19
231
17
136
Sa
laries
and
wag
es23
424
(2
836
) -
20 5
88
20 5
88
-10
0.0%
16 4
63
15 8
31
Socia
l con
tribu
tions
3 88
7 (1
808
) -
2 07
9 2
079
-10
0.0%
2 76
8 1
305
Goo
ds a
nd s
ervi
ces
54 8
58
838
(6
565)
49
131
44
235
4
896
90.0
%50
534
39
418
Ad
mini
strat
ive fe
es27
0 (5
0)
-22
0 22
0 -
100.0
%59
59
Ad
vert
ising
1 00
0 (4
05)
(341
) 25
4 25
4 -
100.0
%66
56
M
inor a
sset
s-
--
--
-0.0
%20
-
Cate
ring:
Dep
artm
enta
l act
ivitie
s49
0 (1
58)
-33
2 33
2 -
100.0
%60
5 18
6 Co
mm
unica
tion
445
(163
) -
282
282
-10
0.0%
766
240
Com
pute
r ser
vices
600
711
-1
311
1 31
1 -
100.0
%61
0 49
0 Co
nsult
ants:
Bus
iness
& a
dviso
ry se
rvice
s43
218
(6
12)
(5 1
48)
37 4
58
34 6
85
2 77
3 92
.6%35
180
34
639
Co
ntra
ctor
s10
16
5 -
175
175
-10
0.0%
23
8 En
tert
ainm
ent
42
(42)
-
--
-0.0
%23
0 19
Fle
et se
rvice
s-
--
--
-0.0
%8
8 Co
nsum
able
supp
lies
76
(68)
-
8 8
-10
0.0%
124
3 Co
nsum
able:
Sta
tione
ry, p
rintin
g, of
fice
supp
lies
228
(148
) -
80
80
-10
0.0%
327
48
Ope
ratin
g lea
ses
--
--
--
0.0%
258
30
Trav
el an
d su
bsist
ence
6 80
4 1
00
(1 0
76)
5 82
8 3
705
2 12
3 63
.6%9
325
3 29
8 Tr
aining
and
dev
elopm
ent
--
--
--
0.0%
128
8 O
pera
ting
paym
ents
1 02
5 67
5 -
1 70
0 1
700
-10
0.0%
2 41
9 95
Ve
nues
and
facil
ities
650
769
-1
419
1 41
9 -
100.0
%37
0 21
5 Re
ntal
and
hiring
-64
-
64
64
-10
0.0%
16
16
Tran
sfer
s an
d su
bsid
ies
28
7 -
35
35
-10
0.0%
11 8
00
11 8
00
Non
-pro
fit in
stitu
tions
--
--
--
0.0%
10 0
00
10 0
00
Hou
seho
lds:
Socia
l Ben
efits
28
7 -
35
35
-10
0.0%
1 80
0 1
800
Paym
ents
for
capi
tal a
sset
s-
3 79
9 -
3 79
9 3
799
-10
0.0%
307
307
Oth
er m
achin
ery
and
equip
men
t-
3 79
9 -
3 79
9 3
799
-10
0.0%
307
307
Tota
l for
Pro
gram
me
82 1
97
- (
6 56
5)
75 6
32
70 7
36
4 89
6 93
.5%
81 8
72
68 6
61

PAGE 110
DEPARTMENT OF PLANNING, MONITORING AND EVALUATION Annual Report 2015/2016
SUB
-PR
OG
RA
MM
E 4.
1: P
RO
GR
AM
ME
MA
NA
GEM
ENT
FO
R N
AT
ION
AL
PLA
NN
ING
2015
/16
(‘00
0)20
14/1
5 (‘
000)
Adj
uste
d A
ppro
pria
tion
Shift
ing
of
Fund
sV
irem
ent
Fina
l A
ppro
pria
tion
Act
ual
Expe
ndit
ure
Var
ianc
eEx
p. a
s %
of
final
app
r.Fi
nal
App
ropr
iati
onA
ctua
l Ex
pend
itur
e
Cur
rent
pay
men
ts26
490
(
814)
(
5 45
0)
20 2
26
17 3
30
2 89
6 85
.7%
24 2
63
14 2
30
Com
pens
atio
n of
em
ploy
ees
7 57
9 (5
61)
-7
018
7 01
8 -
100.0
%7
116
6 71
2 G
oods
and
serv
ices
18 9
11
(253
) (5
450
) 13
208
10
312
2
896
78.1%
17 1
47
7 51
8 Tr
ansf
ers
and
subs
idie
s -
7 -
7 7
-10
0.0%
1 80
0 1
800
Hou
seho
lds:
Socia
l Ben
efits
-7
-7
7 -
100.0
%1
800
1 80
0 Pa
ymen
ts fo
r ca
pita
l ass
ets
-11
4 -
114
114
-10
0.0%
199
199
Oth
er m
achin
ery
and
equip
men
t-
114
-11
4 11
4 -
100.0
%19
9 19
9 To
tal
26 4
90
(69
3)
(5
450)
20
347
17
451
2
896
85.8
%26
262
16
229
SUB
-PR
OG
RA
MM
E 4.
2: R
ESEA
RC
H A
ND
PO
LIC
Y S
ERV
ICES
2015
/16
(‘00
0)20
14/1
5 (‘
000)
Adj
uste
d A
ppro
pria
tion
Shift
ing
of
Fund
sV
irem
ent
Fina
l A
ppro
pria
tion
Act
ual
Expe
ndit
ure
Var
ianc
eEx
p. a
s %
of
final
app
r.Fi
nal
App
ropr
iati
onA
ctua
l Ex
pend
itur
e
Cur
rent
pay
men
ts48
393
(
1 33
6)
(1
115)
45
942
43
942
2
000
95.6
%42
857
39
685
Co
mpe
nsat
ion
of e
mpl
oyee
s13
635
(2
723
) -
10 9
12
10 9
12
-10
0.0%
10 2
60
8 57
5 G
oods
and
serv
ices
34 7
58
1 38
7 (1
115
) 35
030
33
030
2
000
94.3%
32 5
97
31 1
10
Tran
sfer
s an
d su
bsid
ies
28
--
28
28
-10
0.0%
10 0
00
10 0
00
Non
-pro
fit in
stitu
tions
--
--
--
0.0%
10 0
00
10 0
00
Hou
seho
lds:
Socia
l Ben
efits
28
--
28
28
-10
0.0%
--
Paym
ents
for
capi
tal a
sset
s-
3 68
5 -
3 68
5 3
685
-10
0.0%
108
108
Oth
er m
achin
ery
and
equip
men
t-
3 68
5 -
3 68
5 3
685
-10
0.0%
108
108
Tota
l48
421
2
349
(1
115)
49
655
47
655
2
000
96.0
%52
965
49
793
SUB
-PR
OG
RA
MM
E 4.
3: G
OV
ERN
MEN
T
PER
FOR
MA
NC
E IN
FOR
MA
TIO
N
2015
/16
(‘00
0)20
14/1
5 (‘
000)
Adj
uste
d A
ppro
pria
tion
Shift
ing
of
Fund
sV
irem
ent
Fina
l A
ppro
pria
tion
Act
ual
Expe
ndit
ure
Var
ianc
eEx
p. a
s %
of
final
app
r.Fi
nal
App
ropr
iati
onA
ctua
l Ex
pend
itur
e
Cur
rent
pay
men
ts7
286
(1
656)
-
5 63
0 5
630
-10
0.0%
2 64
5 2
639
Com
pens
atio
n of
em
ploy
ees
6 09
7 (1
360
) -
4 73
7 4
737
-10
0.0%
1 85
5 1
849
Goo
ds a
nd se
rvice
s1
189
(296
) -
893
893
-10
0.0%
790
790
Tota
l7
286
(1
656)
-
5 63
0 5
630
-10
0.0%
2 64
5 2
639
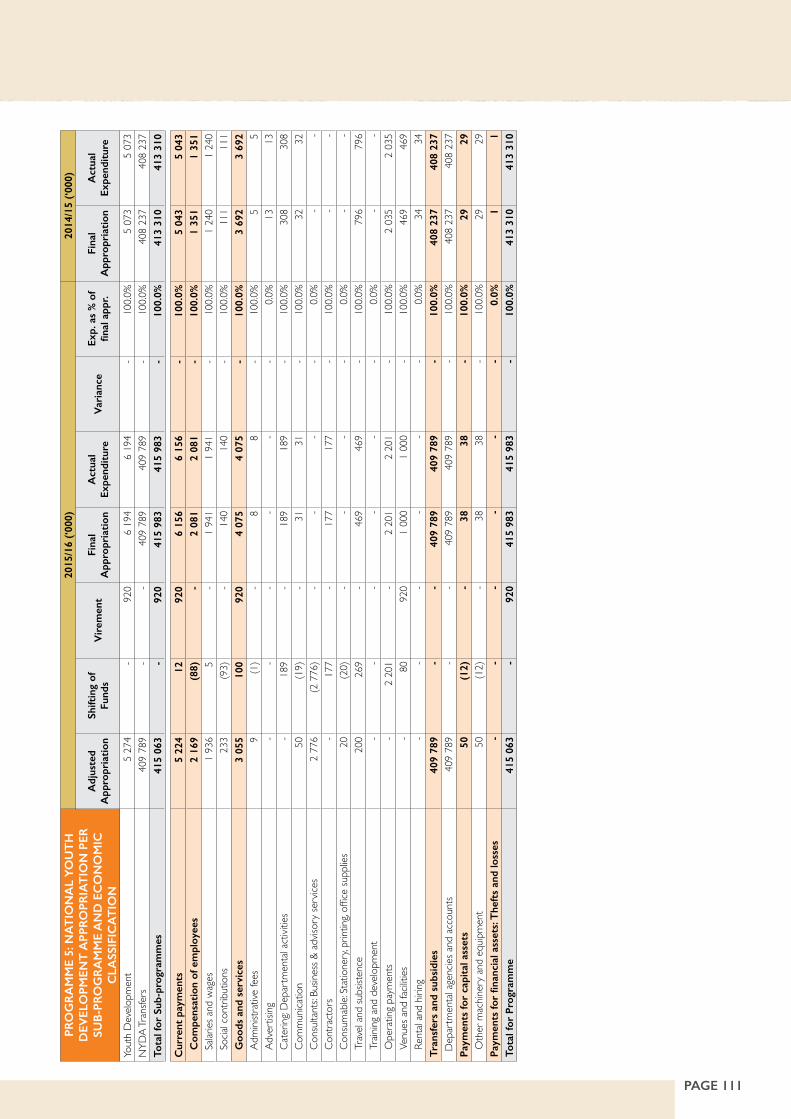
PAGE 111
PRO
GR
AM
ME
5: N
AT
ION
AL
YO
UT
H
DEV
ELO
PMEN
T A
PPR
OPR
IAT
ION
PER
SU
B-P
RO
GR
AM
ME
AN
D E
CO
NO
MIC
C
LASS
IFIC
AT
ION
2015
/16
(‘00
0)20
14/1
5 (‘
000)
Adj
uste
d A
ppro
pria
tion
Shift
ing
of
Fund
sV
irem
ent
Fina
l A
ppro
pria
tion
Act
ual
Expe
ndit
ure
Var
ianc
eEx
p. a
s %
of
final
app
r.Fi
nal
App
ropr
iati
onA
ctua
l Ex
pend
itur
e
Yout
h D
evelo
pmen
t5
274
-92
0 6
194
6 19
4 -
100.0
%5
073
5 07
3 N
YDA
Tran
sfers
409
789
--
409
789
409
789
-10
0.0%
408
237
408
237
Tota
l for
Sub
-pro
gram
mes
415
063
-92
0 41
5 98
3 41
5 98
3 -
100.
0%41
3 31
0 41
3 31
0
Cur
rent
pay
men
ts5
224
12
920
6 15
6 6
156
-10
0.0%
5 04
3 5
043
Com
pens
atio
n of
em
ploy
ees
2 16
9 (
88)
-2
081
2 08
1 -
100.
0%1
351
1 35
1 Sa
laries
and
wag
es1
936
5 -
1 94
1 1
941
-10
0.0%
1 24
0 1
240
Socia
l con
tribu
tions
233
(93)
-
140
140
-10
0.0%
111
111
Goo
ds a
nd s
ervi
ces
3 05
5 10
0 92
0 4
075
4 07
5 -
100.
0%3
692
3 69
2 Ad
mini
strat
ive fe
es9
(1)
-8
8 -
100.0
%5
5 Ad
vert
ising
--
--
--
0.0%
13
13
Cate
ring:
Dep
artm
enta
l act
ivitie
s-
189
-18
9 18
9 -
100.0
%30
8 30
8 Co
mm
unica
tion
50
(19)
-
31
31
-10
0.0%
32
32
Cons
ultan
ts: B
usine
ss &
adv
isory
serv
ices
2 77
6 (2
776
) -
--
-0.0
%-
-Co
ntra
ctor
s-
177
-17
7 17
7 -
100.0
%-
-Co
nsum
able:
Sta
tione
ry, p
rintin
g, of
fice
supp
lies
20
(20)
-
--
-0.0
%-
-Tr
avel
and
subs
isten
ce20
0 26
9 -
469
469
-10
0.0%
796
796
Train
ing a
nd d
evelo
pmen
t-
--
--
-0.0
%-
-O
pera
ting
paym
ents
-2
201
-2
201
2 20
1 -
100.0
%2
035
2 03
5 Ve
nues
and
facil
ities
-80
92
0 1
000
1 00
0 -
100.0
%46
9 46
9 Re
ntal
and
hiring
--
--
--
0.0%
34
34
Tran
sfer
s an
d su
bsid
ies
409
789
--
409
789
409
789
-10
0.0%
408
237
408
237
Dep
artm
enta
l age
ncies
and
acc
ount
s40
9 78
9 -
-40
9 78
9 40
9 78
9 -
100.0
%40
8 23
7 40
8 23
7 Pa
ymen
ts fo
r ca
pita
l ass
ets
50
(12
) -
38
38
-10
0.0%
29
29
Oth
er m
achin
ery
and
equip
men
t50
(1
2)
-38
38
-
100.0
%29
29
Pa
ymen
ts fo
r fin
anci
al a
sset
s: T
heft
s an
d lo
sses
--
--
--
0.0%
1 1
Tota
l for
Pro
gram
me
415
063
-92
0 41
5 98
3 41
5 98
3 -
100.
0%41
3 31
0 41
3 31
0

PAGE 112
DEPARTMENT OF PLANNING, MONITORING AND EVALUATION Annual Report 2015/2016
SUB
-PR
OG
RA
MM
E 5.
1: Y
OU
TH
D
EVEL
OPM
ENT
2015
/16
(‘00
0)20
14/1
5 (‘
000)
Adj
uste
d A
ppro
pria
tion
Shift
ing
of
Fund
sV
irem
ent
Fina
l A
ppro
pria
tion
Act
ual
Expe
ndit
ure
Var
ianc
eEx
p. a
s %
of
final
app
r.Fi
nal
App
ropr
iati
onA
ctua
l Ex
pend
itur
e
Cur
rent
pay
men
ts5
224
12
920
6 15
6 6
156
-10
0.0%
5 04
3 5
043
Com
pens
atio
n of
em
ploy
ees
2 16
9 (8
8)
-2
081
2 08
1 -
100.0
%1
351
1 35
1 G
oods
and
serv
ices
3 05
5 10
0 92
0 4
075
4 07
5 -
100.0
%3
692
3 69
2 Pa
ymen
ts fo
r ca
pita
l ass
ets
50
(12
) -
38
38
-10
0.0%
29
29
Oth
er m
achin
ery
and
equip
men
t50
(1
2)
-38
38
-
100.0
%29
29
Pa
ymen
ts fo
r fin
anci
al a
sset
s: T
heft
s an
d lo
sses
--
--
--
0.0%
1 1
Tota
l5
274
-92
0 6
194
6 19
4 -
100.
0%5
073
5 07
3
SUB
-PR
OG
RA
MM
E 5.
2: N
YD
A T
RA
NSF
ERS
2015
/16
(‘00
0)20
14/1
5 (‘
000)
Adj
uste
d A
ppro
pria
tion
Shift
ing
of
Fund
sV
irem
ent
Fina
l A
ppro
pria
tion
Act
ual
Expe
ndit
ure
Var
ianc
eEx
p. a
s %
of
final
app
r.Fi
nal
App
ropr
iati
onA
ctua
l Ex
pend
itur
e
Tran
sfer
s an
d su
bsid
ies
409
789
--
409
789
409
789
-10
0.0%
408
237
408
237
Dep
artm
enta
l age
ncies
and
acc
ount
s40
9 78
9 -
-40
9 78
9 40
9 78
9 -
100.0
%40
8 23
7 40
8 23
7 To
tal
409
789
--
409
789
409
789
-10
0.0%
408
237
408
237

PAGE 113
3. Notes to the Appropriation StatementThe offices of the Minister and Deputy Minister were transferred from the Presidency to DPME on 1 October 2015. Historical appropriation and expenditure figures are disclosed in the financial statements of the Presidency.
1. Detail of transfers and subsidies as per Appropriation Act (after virement):
Details of these transactions can be viewed in the note on Transfers and Subsidies and Annexure 1 to the Annual Financial Statements.
2. Detail of specifically and exclusively appropriated amounts voted (after virement):
None
3. Detail on payments for financial assets
Detail of these transactions (if any) per programme can be viewed in the note on Payments for financial assets to the Annual Financial Statements.
4. Explanations of material variances from Amounts Voted (after virement):
4.1 PER PROGRAMME (R’000)Final
AppropriationActual
ExpenditureVariance
Variance as % of Final Appr.
Administration 111 872 111 872 - 0.0%Outcomes Monitoring and Evaluation 90 087 89 560 527 0.6%Institutional Performance Monitoring & Evaluation 60 626 60 626 - 0.0%National Planning 75 632 70 736 4 896 6.5%National Youth Development 415 983 415 983 - 0.0%Total 754 200 748 777 5 423 0.7%
4.2 PER ECONOMIC CLASSIFICATION (R’000)
Final Appropriation
Actual Expenditure
VarianceVariance as % of
Final Appr.Current Expenditure 330 387 324 964 5 423 1.6% Compensation of employees 177 437 176 910 527 0.3% Goods and services 152 950 148 054 4 896 3.2%Transfers and subsidies 410 062 410 062 - 0.0% Municipalities 2 2 - 0.0% Departmental agencies and accounts 409 789 409 789 - 0.0% Households: Social Benefits 271 271 - 0.0%Payments for capital assets 13 751 13 751 - 0.0% Buildings 435 435 - 0.0% Machinery and equipment 11 892 11 892 - 0.0% Intangible assets 1 424 1 424 - 0.0%Payments for financial assets - - - 0.0%Total 754 200 748 777 5 423 0.7%
Under-expenditure on compensation of employees was due to normal turnover in staff. Under-expenditure under Programme 4 (National Planning) was due to the term of the previous National Planning Commission ending in May 2015 and the appointment of the new Commission in September 2015.
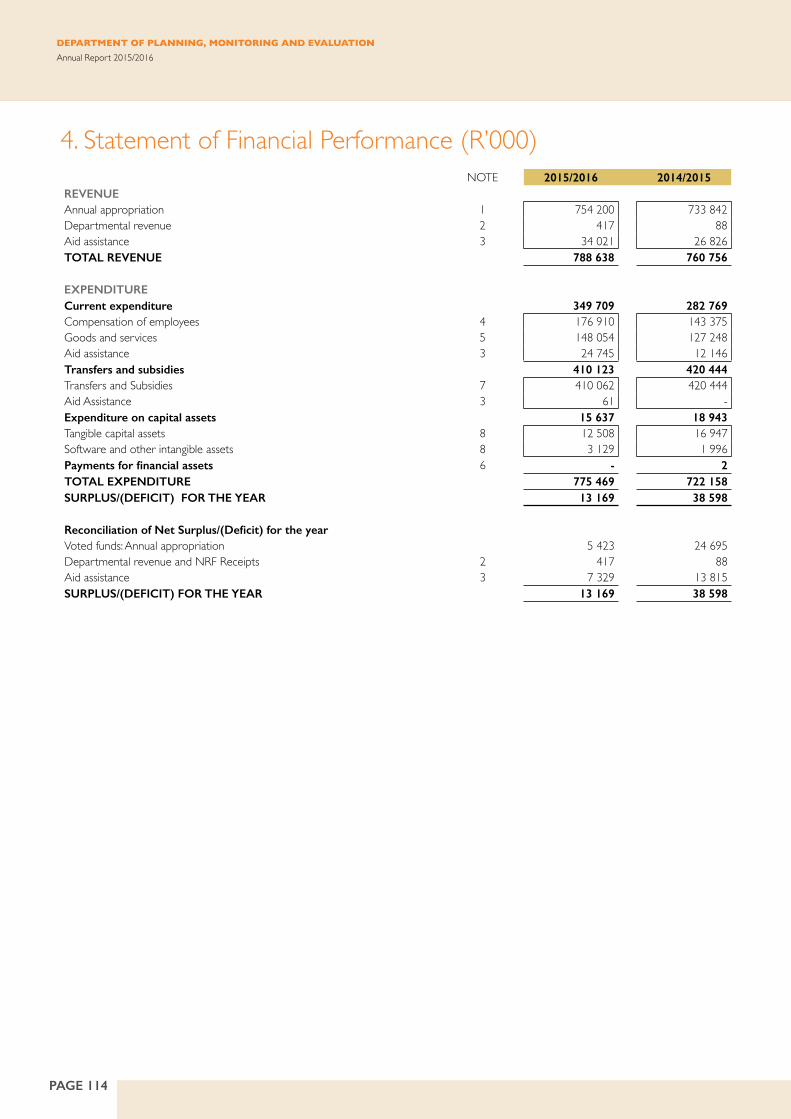
PAGE 114
DEPARTMENT OF PLANNING, MONITORING AND EVALUATION Annual Report 2015/2016
4. Statement of Financial Performance (R’000)NOTE 2015/2016 2014/2015
REVENUEAnnual appropriation 1 754 200 733 842Departmental revenue 2 417 88Aid assistance 3 34 021 26 826TOTAL REVENUE 788 638 760 756
EXPENDITURECurrent expenditure 349 709 282 769Compensation of employees 4 176 910 143 375Goods and services 5 148 054 127 248Aid assistance 3 24 745 12 146Transfers and subsidies 410 123 420 444Transfers and Subsidies 7 410 062 420 444Aid Assistance 3 61 -Expenditure on capital assets 15 637 18 943Tangible capital assets 8 12 508 16 947Software and other intangible assets 8 3 129 1 996Payments for financial assets 6 - 2TOTAL EXPENDITURE 775 469 722 158SURPLUS/(DEFICIT) FOR THE YEAR 13 169 38 598
Reconciliation of Net Surplus/(Deficit) for the yearVoted funds: Annual appropriation 5 423 24 695Departmental revenue and NRF Receipts 2 417 88Aid assistance 3 7 329 13 815SURPLUS/(DEFICIT) FOR THE YEAR 13 169 38 598

PAGE 115
5. Statement of Financial Position (R’000)NOTE 2015/2016 2014/2015
ASSETSCurrent assets 12 777 38 702Cash and cash equivalents 9 7 624 35 235Prepayments and advances 10 223 99Receivables 11 4 870 3 237Aid assistance receivable 3 60 131Non-current assets 88 5Receivables 88 5 TOTAL ASSETS 12 865 38 707
LIABILITIESCurrent liabilities 12 757 38 688Voted funds to be surrendered to the Revenue Fund 12 5 423 24 695Departmental revenue/NRF Receipts to be surrendered to Revenue Fund 13 28 10Payables 14 48 37Aid assistance repayable 3 2 438 -Aid assistance unutilised 3 4 820 13 946 TOTAL LIABILITIES 12 757 38 688
NET ASSETS 108 19
Represented by: Recoverable revenue 108 19
6. Statement of changes in Net Assets (R’000)NOTE 2015/2016 2014/2015
Recoverable revenue Opening balance 19 10Transfers: Debts raised 89 9Closing Balance 108 19

PAGE 116
DEPARTMENT OF PLANNING, MONITORING AND EVALUATION Annual Report 2015/2016
7. Cash Flow Statement (R’000)NOTE 2015/2016 2014/2015
CASH FLOWS FROM OPERATING ACTIVITIESReceipts 788 622 760 756Annual appropriated funds received 1 754 200 733 842Departmental revenue received 2 359 80Interest received 42 8Aid assistance received 3 34 021 26 826
Net (increase)/decrease in working capital (1 829) (2 418)Surrendered to Revenue Fund (25 094) (1 103)Surrendered to RDP Fund/Donor (13 946) (6 876)Current payments (349 709) (282 769)Payments for financial assets - (2)Transfers and subsidies paid 7 (410 123) (420 444)Net cash flow available from operating activities 15 (12 079) 47 144
CASH FLOWS FROM INVESTING ACTIVITIESPayments for capital assets 8 (15 637) (18 943)Proceeds from sale of capital assets 2 16 -Net cash flows from investing activities (15 621) (18 943)
CASH FLOWS FROM FINANCING ACTIVITIESIncrease/(decrease) in net assets 89 9Net cash flows from financing activities 89 9
Net increase/(decrease) in cash and cash equivalents (27 611) 28 210Cash and cash equivalents at beginning of period 35 235 7 025Cash and cash equivalents at end of period 16 7 624 35 235

PAGE 117
8. Statement of Accounting Polices and Related mattersSummary of significant accounting policies
The financial statements have been prepared in accordance with the following policies, which have been applied consistently in all material aspects, unless otherwise indicated. Management has concluded that the financial statements present fairly the Department’s primary and secondary information. The historical cost convention has been used, except where otherwise indicated. Management has used assessments and estimates in preparing the Annual Financial Statements. These are based on the best information available at the time of preparation. Where appropriate and meaningful, additional information has been disclosed to enhance the usefulness of the financial statements and to comply with the statutory requirements of the Public Finance Management Act (PFMA), Act 1 of 1999 (as amended by Act 29 of 1999), and the Treasury Regulations issued in terms of the PFMA and the annual Division of Revenue Act.
1. Basis of preparation: The financial statements have been prepared in accordance with the Modified Cash Standard.
2. Going concern: The financial statements have been prepared on a going concern basis.
3. Presentation currency: Amounts have been presented in the currency of the South African Rand (R) which is also the functional currency of the Department.
4. Rounding: Unless otherwise stated, financial figures have been rounded to the nearest one thousand Rand (R’000).
5. Foreign currency translation: Cash flows arising from foreign currency transactions are translated into South African Rands using the exchange rates prevailing at the date of payment/receipt.
6. Comparative information
Prior period comparative information: Prior period comparative information has been presented in the current year’s financial statements. Where necessary, figures included in the prior period financial statements have been reclassified to ensure that the format in which the information is presented is consistent with the format of the current year’s financial statements.Current year comparison with budget: A comparison between the approved, final budget and actual amounts for each programme and economic classification is included in the appropriation statement.
7. Revenue
7.1 Appropriated funds: Appropriated funds comprises of departmental allocations as well as direct charges against the revenue fund (i.e. statutory appropriation). Appropriated funds are recognised in the statement of financial performance on the date the appropriation becomes effective. Adjustments made in terms of the adjustments budget process are recognised in the statement of financial performance on the date the adjustments become effective. The net amount of any appropriated funds due to/from the relevant revenue fund at the reporting date is recognised as a payable/receivable in the statement of financial position.
7.2 Departmental revenue: Departmental revenue is recognised in the statement of financial performance when received and is subsequently paid into the relevant revenue fund, unless stated otherwise. Any amount owing to the relevant revenue fund at the reporting date is recognised as a payable in the statement of financial position.
7.3 Accrued departmental revenue: Accruals in respect of departmental revenue (excluding tax revenue) are recorded in the notes to the financial statements when:
§ it is probable that the economic benefits or service potential associated with the transaction will flow to the Department; and
§ the amount of revenue can be measured reliably.
The accrued revenue is measured at the fair value of the consideration receivable. Accrued tax revenue (and related interest and/penalties) is measured at amounts receivable from collecting agents.

PAGE 118
DEPARTMENT OF PLANNING, MONITORING AND EVALUATION Annual Report 2015/2016
8. Expenditure
8.1 Compensation of employees
8.1.1 Salaries and wages: Salaries and wages are recognised in the statement of financial performance on the date of payment.
8.1.2 Social contributions: Social contributions made by the Department in respect of current employees are recognised in the statement of financial performance on the date of payment. Social contributions made by the Department in respect of ex-employees are classified as transfers to households in the statement of financial performance on the date of payment.
8.2 Other expenditure: Other expenditure (such as goods and services, transfers and subsidies and payments for capital assets) is recognised in the statement of financial performance on the date of payment. The expense is classified as a capital expense if the total consideration paid is more than the capitalisation threshold.
8.3 Accrued expenditure payable: Accrued expenditure payable is recorded in the notes to the financial statements when the goods are received or, in the case of services, when they are rendered to the Department or in the case of transfers and subsidies when they are due and payable. Accrued expenditure payable is measured at cost.
8.4 Leases
8.4.1 Operating leases: Operating lease payments made during the reporting period are recognised as current expenditure in the statement of financial performance on the date of payment. The operating lease commitments are recorded in the notes to the financial statements.
8.4.2 Finance leases: Finance lease payments made during the reporting period are recognised as capital expenditure in the statement of financial performance on the date of payment. The finance lease commitments are recorded in the notes to the financial statements and are not apportioned between the capital and interest portions. Finance lease assets acquired at the end of the lease term are recorded and measured at the lower of: cost, being the fair value of the asset; or the sum of the minimum lease payments made, including any payments made to acquire ownership at the end of the lease term, excluding interest.
8.5 Payments for financial assets: Debts are written off when identified as irrecoverable. Debts written-off are limited to the amount of savings and/or under spending of appropriated funds. The write off occurs at year-end or when funds are available. No provision is made for irrecoverable amounts but an estimate is included in the disclosure notes to the financial statements.
9. Aid Assistance
9.1 Aid assistance received: Aid assistance received in cash is recognised in the statement of financial performance when received. In-kind aid assistance is recorded in the notes to the financial statements on the date of receipt and is measured at fair value. Aid assistance not spent for the intended purpose and any unutilised funds from aid assistance that are required to be refunded to the donor are recognised as a payable in the statement of financial position.
9.2 Aid assistance paid: Aid assistance paid is recognised in the statement of financial performance on the date of payment. Aid assistance payments made prior to the receipt of funds are recognised as a receivable in the statement of financial position.
10. Cash and cash equivalents: Cash and cash equivalents are stated at cost in the statement of financial position. Bank overdrafts are shown separately on the face of the statement of financial position as a current liability. For the purposes of the cash flow statement, cash and cash equivalents comprise cash on hand, deposits held, other short-term highly liquid investments and bank overdrafts.
11. Prepayments and advances: Prepayments and advances are recognised in the statement of financial position when the Department receives or disburses the cash. Prepayments and advances are initially and subsequently measured at cost and are only expensed when invoices/interdepartmental claims are received.

PAGE 119
12. Loans and receivables: Loans and receivables are recognised in the statement of financial position at cost plus accrued interest, where interest is charged, less amounts already settled or written-off. Write-offs are made according to the Department’s Write-off Policy.
13. Investments: Investments are recognised in the statement of financial position at cost.
14. Financial Assets
14.1 Financial assets (not covered elsewhere): A financial asset is recognised initially at its cost plus transaction costs that are directly attributable to the acquisition or issue of the financial. At the reporting date, a department shall measure its financial assets at cost, less amounts already settled or written-off, except for recognised loans and receivables, which are measured at cost plus accrued interest, where interest is charged, less amounts already settled or written-off.
14.2 Impairment of financial assets: Where there is an indication of impairment of a financial asset, an estimation of the reduction in the recorded carrying value, to reflect the best estimate of the amount of the future economic benefits expected to be received from that asset, is recorded in the notes to the financial statements.
15. Payables: Loans and payables are recognised in the statement of financial position at cost.
16. Capital Assets
16.1 Immovable capital assets: Immovable capital assets are initially recorded in the notes to the financial statements at cost. Immovable capital assets acquired through a non-exchange transaction is measured at fair value as at the date of acquisition. Where the cost of immovable capital assets cannot be determined reliably, the immovable capital assets are measured at R1, unless the fair value of the asset has been reliably estimated, in which case the fair value is used. All assets acquired prior to 1 April 2002 (or a later date as approved by the OAG) may be recorded at R1. Immovable capital assets are subsequently carried at cost and are not subject to depreciation or impairment. Subsequent expenditure th at is of a capital nature is added to the cost of the asset at the end of the capital project, unless the immovable asset is recorded by another department, in which case the completed project costs are transferred to that department.
16.2 Movable capital assets: Movable capital assets are initially recorded in the notes to the financial statements at cost. Movable capital assets acquired through a non-exchange transaction is measured at fair value as at the date of acquisition. Where the cost of movable capital assets cannot be determined reliably, the movable capital assets are measured at fair value and where fair value cannot be determined; the movable assets are measured at R1. All assets acquired prior to 1 April 2002 (or a later date as approved by the OAG) may be recorded at R1. Movable capital assets are subsequently carried at cost and are not subject to depreciation or impairment. Biological assets are subsequently carried at fair value. Subsequent expenditure that is of a capital nature is added to the cost of the asset at the end of the capital project, unless the movable asset is recorded by another department/entity, in which case the completed project costs are transferred to that department.
16.3 Intangible assets: Intangible assets are initially recorded in the notes to the financial statements at cost. Intangible assets acquired through a non-exchange transaction are measured at fair value as at the date of acquisition. Internally generated intangible assets are recorded in the notes to the financial statements when the Department commences the development phase of the project. Where the cost of intangible assets cannot be determined reliably, the intangible capital assets are measured at fair value and where fair value cannot be determined; the intangible assets are measured at R1. All assets acquired prior to 1 April 2002 (or a later date as approved by the OAG) may be recorded at R1. Intangible assets are subsequently carried at cost and are not subject to depreciation or impairment. Subsequent expenditure that is of a capital nature is added to the cost of the asset at the end of the capital project, unless the intangible asset is recorded by another department/entity, in which case the completed project costs are transferred to that department.
17. Provisions and Contingents
17.1 Provisions: Provisions are recorded in the notes to the financial statements when there is a present legal or constructive obligation to forfeit economic benefits as a result of events in the past and it is probable that an outflow of resources embodying economic benefits or service potential will be required to settle the obligation and a reliable estimate of the obligation can be made. The provision is measured as the best estimate of the funds required to settle the present obligation at the reporting date.
PAGE 120
DEPARTMENT OF PLANNING, MONITORING AND EVALUATION Annual Report 2015/2016
17.2 Contingent liabilities: Contingent liabilities are recorded in the notes to the financial statements when there is a possible obligation that arises from past events, and whose existence will be confirmed only by the occurrence or non-occurrence of one or more uncertain future events not within the control of the Department, or when there is a present obligation that is not recognised because it is not probable that an outflow of resources will be required to settle the obligation, or the amount of the obligation cannot be measured reliably.
17.3 Contingent assets: Contingent assets are recorded in the notes to the financial statements when a possible asset arises from past events, and whose existence will be confirmed by the occurrence or non-occurrence of one or more uncertain future events not within the control of the Department.
17.4 Commitments: Commitments are recorded at cost in the notes to the financial statements when there is a contractual arrangement or an approval by management in a manner that raises a valid expectation that the Department will discharge its responsibilities, thereby incurring future expenditure that will result in the outflow of cash.
18. Unauthorised expenditure: Unauthorised expenditure is recognised in the statement of financial position until such time as the expenditure is either:
§ approved by Parliament or the Provincial Legislature with funding and the related funds are received; or § approved by Parliament or the Provincial Legislature without funding and is written-off against the appropriation
in the statement of financial performance; or § transferred to receivables for recovery.
Unauthorised expenditure is measured at the amount of the confirmed unauthorised expenditure.
19. Fruitless and wasteful expenditure: recorded, is equal to the total value of the fruitless and or wasteful expenditure incurred. Fruitless and wasteful expenditure is removed from the notes to the financial statements when it is resolved or transferred to receivables for recovery. Fruitless and wasteful expenditure receivables are measured at the amount that is expected to be recoverable and are de-recognised when settled or subsequently written-off as irrecoverable.
20. Irregular expenditure: Irregular expenditure is recorded in the notes to the financial statements when confirmed. The amount recorded is equal to the value of the irregular expenditure incurred unless it is impracticable to determine, in which case reasons therefore are provided in the note. Irregular expenditure is removed from the note when it is either condoned by the relevant authority, transferred to receivables for recovery or not condoned and is not recoverable. Irregular expenditure receivables are measured at the amount that is expected to be recoverable and are de-recognised when settled or subsequently written-off as irrecoverable.
21. Changes in accounting estimates: Changes in accounting policies that are effected by management have been applied retrospectively in accordance with MCS requirements, except to the extent that it is impracticable to determine the period-specific effects or the cumulative effect of the change in policy. In such instances, the Department shall restate the opening balances of assets, liabilities and net assets for the earliest period for which retrospective restatement is practicable. Changes in accounting estimates are applied prospectively in accordance with MCS requirements. Correction of errors is applied retrospectively in the period in which the error has occurred in accordance with MCS requirements, except to the extent that it is impracticable to determine the period-specific effects or the cumulative effect of the error. In such cases, the Department shall restate the opening balances of assets, liabilities and net assets for the earliest period for which retrospective restatement is practicable.
22. Events after the reporting date: Events after the reporting date that are classified as adjusting events have been accounted for in the financial statements. The events after the reporting date that are classified as non-adjusting events after the reporting date have been disclosed in the notes to the financial statements.
23. Agent-Principal arrangements
When the Department is the principal, it will recognise any payment made to the agent in the statement of financial performance. When the Department is the agent, it will recognise any fees received as departmental revenue in the statement of financial performance.

PAGE 121
24. Departures from the MCS requirements: Management has concluded that the financial statements present fairly the Department’s primary and secondary information and has not departed from the Standard.
25. Capitalisation reserve: The capitalisation reserve comprises of financial assets and/or liabilities originating in a prior reporting period but which are recognised in the statement of financial position for the first time in the current reporting period. Amounts are recognised in the capitalisation reserves when identified in the current period and are transferred to the National/Provincial Revenue Fund when the underlying asset is disposed and the related funds are received.
26. Recoverable revenue: Amounts are recognised as recoverable revenue when a payment made in a previous financial year becomes recoverable from a debtor in the current financial year. Amounts are either transferred to the National/Provincial Revenue Fund when recovered or are transferred to the statement of financial performance when written-off.
27. Related party transactions: A related party transaction is a transfer of resources, services or obligations between the reporting entity and a related party. Related party transactions within the Minister’s portfolio are recorded in the notes to the financial statements when the transaction is not at arm’s length.
28. Inventories (Effective from 1 April 2017): At the date of acquisition, inventories are recorded at cost price in the notes to the financial statements. Where inventories are acquired as part of a non-exchange transaction, the cost of inventory is its fair value at the date of acquisition. Inventories are subsequently measured at the lower of cost and net realisable value or the lower of cost and current replacement value.
29. Public private partnerships
Public Private Partnerships are accounted for based on the nature and or the substance of the partnership. The transaction is accounted for in accordance with the relevant accounting policies. A summary of the significant terms of the PPP agreement, the parties to the agreement, and the date of commencement thereof together with the description and nature of the concession fees received, the unitary fees paid, rights and obligations of the Department are recorded in the notes to the financial statements.
30. Key management personnel
Key management personnel are those persons having the authority and responsibility for planning, directing and controlling the activities of the Department. The number of individuals and their full compensation is recorded in the notes to the financial statements.

PAGE 122
DEPARTMENT OF PLANNING, MONITORING AND EVALUATION Annual Report 2015/2016
9. Notes to the Annual Financial Statements (R’000)The offices of the Minister and Deputy Minister were transferred from the Presidency to DPME on 1 October 2015. Historical appropriation and expenditure
figures are disclosed in the financial statements of the Presidency.
1. Annual Appropriation
Included are funds appropriated in terms of the Appropriation Act and the Adjustments Appropriation Act:
2015/16 2014/15
ProgrammeFinal
AppropriationActual Funds
Received
Funds not requested, not
received
Final Appropriation
AppropriationReceived
Administration 104 185 104 185 - 81 848 81 848Outcomes Monitoring and Evaluation 92 324 92 324 - 89 343 89 343Institutional Performance M&E 60 431 60 431 - 66 111 66 111National Planning 82 197 82 197 - 88 303 88 303National Youth Development 415 063 415 063 - 408 237 408 237Total 754 200 754 200 - 733 842 733 842
2. Departmental revenue
Note 2 2015/2016 2014/2015Sales of goods and services other than capital assets 2.1 88 54Interest, dividends and rent on land 2.2 42 8Sales of capital assets 2.3 16 -Transactions in financial assets and liabilities 2.4 271 26Departmental revenue collected 417 88
2.1.Sales of goods and services other than capital assets
Sales of goods and services produced by the Department Note 2 2015/2016 2014/2015Sales by market establishment 26 12Other sales 62 42Total 88 54
2.2 Interest, dividends and rent on land
Note 2 2015/2016 2014/2015Interest 42 8
2.3 Sales of capital assets
Note 2 2015/2016 2014/2015Machinery and Equipment 16 -
2.4.Transactions in financial assets and liabilities
Note 2 2015/2016 2014/2015Receivables 38 18Other Receipts including Recoverable Revenue 233 8Total 271 26

PAGE 123
3. Aid Assistance
Note 2 2015/2016 2014/2015Opening Balance 13 815 6 876Transferred from statement of financial performance 7 329 13 815Paid during the year (13 946) (6 876)Total 7 198 13 815
Analysis of balance by source Aid assistance from RDP 7 198 13 815
Closing balance 7 198 13 815Analysis of balance
Aid assistance receivable (60) (131) Aid assistance unutilised 4 820 13 946 Aid assistance unutilised 2 438 -
Closing balance 7 198 13 815
4. Compensation of employees
2015/2016 2014/2015Salaries and Wages 158 334 128 472Basic salary 118 926 97 117Performance award 2 503 1 802Service based 101 85Compensative/circumstantial 2 615 1 233Periodic payments 2 201 2 173Other non-pensionable allowances 31 988 26 062Social contributions (Employer) 18 576 14 903Pension 14 790 12 071Medical 3 767 2 817Bargining Council 19 15Total compensation of Employees 176 910 143 375Average numbers of employees 265 222
5. Goods and services
Notes 2015/2016 2014/2015Administrative fees 1 271 1 137Advertising 1 598 1 625Minor Assets 5.1 752 2 402Audit cost–external 5.2 2 168 2 969Bursaries (employees) 464 337Catering 2 607 2 524Communication 5 585 3 789Computer services 5.3 23 485 21 101Consultants: Business and advisory services 51 168 52 545Contractors 1 561 2 062Agency and support/outsourced services 879 1 120Entertainment 39 27Fleet services 879 98Consumables 5.4 1 894 1 099Operating leases 6 655 2 062Property payments 5.5 2 225 360Travel and subsistence 5.6 33 163 19 524Training and staff development 894 1 544Venues and facilities 4 342 5 135Rental and hiring 160 440Other operating expenditure 5.7 6 265 5 348Total 148 054 127 248

PAGE 124
DEPARTMENT OF PLANNING, MONITORING AND EVALUATION Annual Report 2015/2016
5.1 Minor Assets
Note 2015/2016 2014/2015Tangible assets 752 2 402Machinery and equipment 28 752 2 402Transport assets - -Intangible assets - -Total 752 2 402
5.2 Audit cost – External
Note 5 2015/2016 2014/2015Regularity audits 2 168 2 969Performance audits - -Total 2 168 2 969
5.3 Computer services
Note 5 2015/2016 2014/2015SITA computer services 16 073 14 475External computer service providers 7 412 6 626Total 23 485 21 101
5.4 Consumables
Note 5 2015/2016 2014/2015Consumable supplies 359 117Uniform and clothing 53 -Household supplies 201 81Building material and supplies 8 1Communication accessories 6 -IT consumables 71 29Other consumables 20 6Stationery, printing and office supplies 1 535 982Total 1 894 1 099
5.5 Property Payments
Note 5 2015/2016 2014/2015Municipal services 340 95Property maintenance and repairs 5 -Other 1 880 265
Total 2 225 360
5.6 Travel and subsistence
Note 5 2015/2016 2014/2015Local 24 550 17 099Foreign 8 613 2 425Total 33 163 19 524
5.7 Other operating expenditure
Note 5 2015/2016 2014/2015
Professional bodies, membership and subscription fees* 2 153 1 859Resettlement costs 387 336Other 3 725 3 153Total 6 265 5 348
*Note: Includes payment to Commonwealth Youth Programme.

PAGE 125
6. Payments for financial assets
Note 2015/2016 2014/2015Debts written-off i.t.o. Departmental Policy - 2Total - 2
7. Transfers and subsidies
2015/2016 2014/2015Provinces and municipalities Annex 1A 2 1Departmental agencies and accounts Annex 1B 409 789 408 437Non-profit institutions Annex 1D - 10 000Households Annex 1C 271 2 006Total 410 062 420 444
8. Expenditure on capital assets
Note 2015/2016 2014/2015
Tangible assets 12 508 16 947
Buildings and other fixed structures 30 435 8 676Machinery and equipment 27 12 073 8 271Software and other intangible assets
Computer software 29 3 129 1 996Total 15 637 18 943
8.1. Analysis of funds utilised to acquire capital assets – 2015/16
Voted funds Aid assistance TotalTangible assets 12 327 181 12 508
Buildings and other fixed structures 435 - 435Machinery and equipment 11 892 181 12 073Intangible assets
Software 1 424 1 705 3 129Total 13 751 1 886 15 637
8.2 Analysis of funds utilised to acquire capital assets –2014/15
Voted funds Aid assistance Total
Tangible assets 16 947 - 16 947
Buildings and other fixed structures 8 676 - 8 676Machinery and equipment 8 271 - 8 271Intangible assets
Software 1 131 865 1 996Total 18 078 865 18 943
8.3 Finance lease expenditure included in Expenditure for capital assets
Note 2015/2016 2014/2015Tangible assetsMachinery and equipment 27 1 036 868Total 1 036 868
9. Cash and cash equivalents
Note 2015/2016 2014/2015Consolidated Paymaster General Account 7 604 35 215Cash on hand 20 20
Total 7 624 35 235

PAGE 126
DEPARTMENT OF PLANNING, MONITORING AND EVALUATION Annual Report 2015/2016
10. Prepayments and Advances
Note 2015/2016 2014/2015Advances for travel and subsistence 23 9Advances paid: National Departments Annex 5 200 90
Total 223 99
11. Receivables
2015/2016 2014/2015
Note CurrentNon-
currentTotal Current Non-current Total
Claims recoverable 11.1
Annex 3
4 543 - 4 543 2 539 - 2 539
Recoverable expenditure 11.2 202 88 290 272 5 277Staff debt 11.3 - - - 1 - 1Fruitless and wasteful expenditure 11.5 - - - 3 - 3Other debtors 11.4 125 - 125 422 - 422
Total 4 870 88 4 958 3 237 5 3 242
11.1 Claims recoverable
Note 2015/2016 2014/2015National departments 4 532 2 538Provincial departments - 1Local governments 11 -
Total 4 543 2 539
11.2 Recoverable expenditure (disallowance accounts)
Note 2015/2016 2014/2015Private expenses 83 172Contractual debt (Bursaries, salary overpayments) 207 105
Total 290 277
11.3 Staff debt
Note 11 2015/2016 2014/2015
Tax debt - 1
11.4 Other debtors
Note 11 2015/2016 2014/2015
SARS – VAT 125 422
11.5 Fruitless and wasteful expenditure
Note 11 2015/2016 2014/2015
Opening balance 3 10Less amounts recovered (3) (10)Less amounts written-off - -Transfers from note 23: Fruitless and Wasteful Expenditure - 3Total - 3
12. Voted funds to be surrendered to the Revenue Fund
Note 12 2015/2016 2014/2015
Opening balance 24 695 1 018Transfer from statement of financial performance 5 423 24 695Paid during the year (24 695) (1 018)Closing balance 5 423 24 695

PAGE 127
13. Departmental revenue and NRF Receipts to be surrendered to the Revenue Fund
Note 2015/2016 2014/2015Opening balance 10 7Transfer from statement of financial performance 417 88Paid during the year (399) (85)
Closing balance 28 10
14. Payables – current
Note 2015/2016 2014/2015Clearing accounts – Salary related accounts 48 37
Total 48 37
15. Net cash flow available from operating activities
Note 2015/2016 2014/2015
Net surplus/(deficit) as per Statement of Financial Performance 13 169 38 598Add back non cash/cash movements not deemed operating activities (25 248) 8 546(Increase)/decrease in receivables – current 11 (1 716) (2 439)(Increase)/decrease in prepayments and advances 10 (124) (2)(Increase)/decrease in other current assets - -Increase/(decrease) in payables – current 14 11 23Proceeds from sale of capital assets (16) -Proceeds from sale of investments - -(Increase)/decrease in other financial assets - -Expenditure on capital assets 8 15 637 18 943Surrenders to Revenue Fund 12, 13 (25 094) (1 103)Surrenders to RDP Fund/Donor (13 946) (6 876)Voted funds not requested/not received - -Own revenue included in appropriation - -Other non-cash items - -Net cash flow generated by operating activities (12 079) 47 144
16. Reconciliation of cash and cash equivalents for cash flow purposes
Note 2015/2016 2014/2015
Consolidated Paymaster General account 7 604 35 215Cash on hand 20 20Total 7 624 35 235
17. Contingent liabilities and contingent assets
17.1 Contingent liabilities
Liable to Nature Note 2015/2016 2014/2015Other departments (interdepartmental unconfirmed balances) Annex 4 62 233Total 62 233
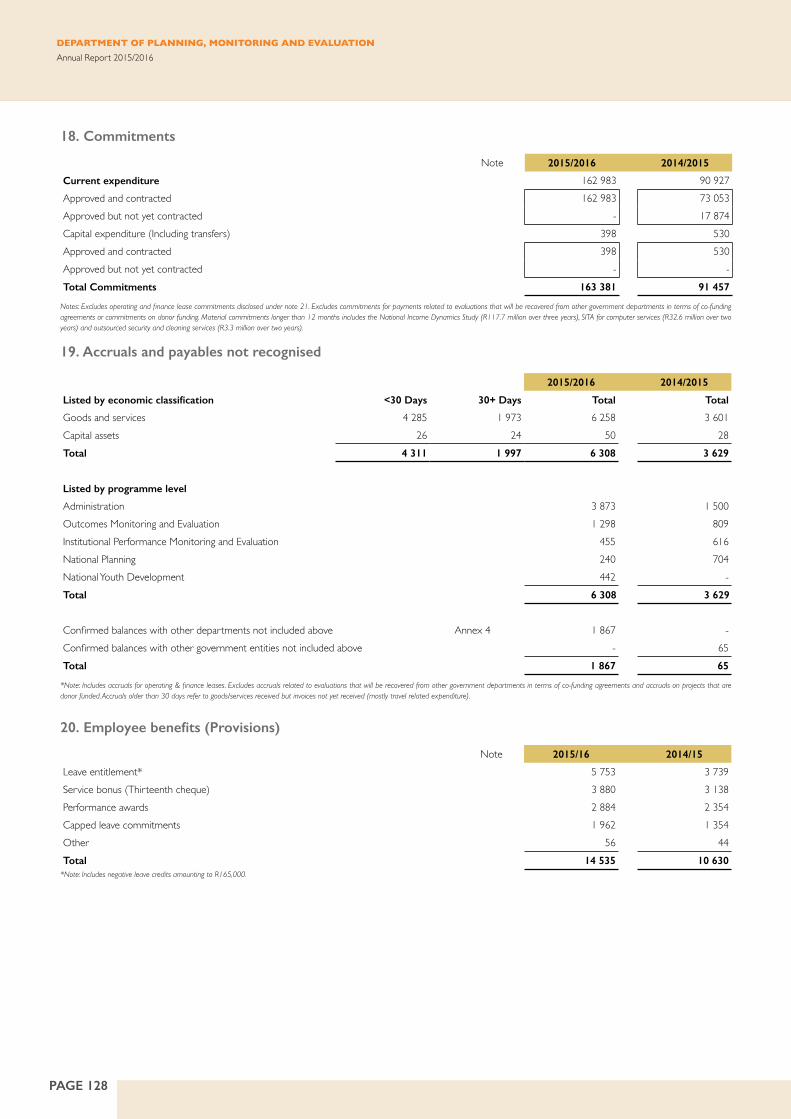
PAGE 128
DEPARTMENT OF PLANNING, MONITORING AND EVALUATION Annual Report 2015/2016
18. Commitments
Note 2015/2016 2014/2015
Current expenditure 162 983 90 927Approved and contracted 162 983 73 053Approved but not yet contracted - 17 874Capital expenditure (Including transfers) 398 530Approved and contracted 398 530Approved but not yet contracted - -Total Commitments 163 381 91 457
Notes: Excludes operating and finance lease commitments disclosed under note 21. Excludes commitments for payments related to evaluations that will be recovered from other government departments in terms of co-funding agreements or commitments on donor funding. Material commitments longer than 12 months includes the National Income Dynamics Study (R117.7 million over three years), SITA for computer services (R32.6 million over two years) and outsourced security and cleaning services (R3.3 million over two years).
19. Accruals and payables not recognised
2015/2016 2014/2015
Listed by economic classification <30 Days 30+ Days Total Total
Goods and services 4 285 1 973 6 258 3 601Capital assets 26 24 50 28Total 4 311 1 997 6 308 3 629
Listed by programme level
Administration 3 873 1 500Outcomes Monitoring and Evaluation 1 298 809Institutional Performance Monitoring and Evaluation 455 616National Planning 240 704National Youth Development 442 -Total 6 308 3 629
Confirmed balances with other departments not included above Annex 4 1 867 -Confirmed balances with other government entities not included above - 65Total 1 867 65
*Note: Includes accruals for operating & finance leases. Excludes accruals related to evaluations that will be recovered from other government departments in terms of co-funding agreements and accruals on projects that are donor funded. Accruals older than 30 days refer to goods/services received but invoices not yet received (mostly travel related expenditure).
20. Employee benefits (Provisions)
Note 2015/16 2014/15
Leave entitlement* 5 753 3 739Service bonus (Thirteenth cheque) 3 880 3 138Performance awards 2 884 2 354Capped leave commitments 1 962 1 354Other 56 44Total 14 535 10 630
*Note: Includes negative leave credits amounting to R165,000.
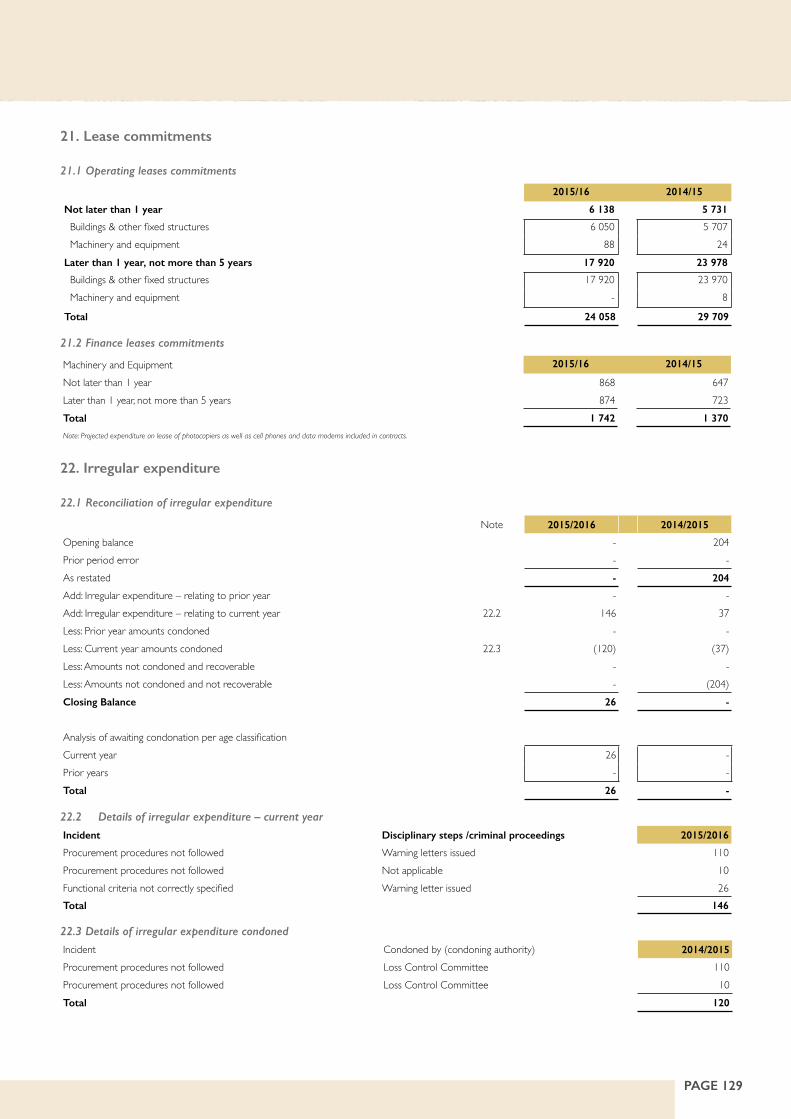
PAGE 129
21. Lease commitments
21.1 Operating leases commitments
2015/16 2014/15
Not later than 1 year 6 138 5 731
Buildings & other fixed structures 6 050 5 707 Machinery and equipment 88 24 Later than 1 year, not more than 5 years 17 920 23 978
Buildings & other fixed structures 17 920 23 970 Machinery and equipment - 8
Total 24 058 29 709
21.2 Finance leases commitments
Machinery and Equipment 2015/16 2014/15
Not later than 1 year 868 647 Later than 1 year, not more than 5 years 874 723 Total 1 742 1 370
Note: Projected expenditure on lease of photocopiers as well as cell phones and data modems included in contracts.
22. Irregular expenditure
22.1 Reconciliation of irregular expenditure
Note 2015/2016 2014/2015
Opening balance - 204Prior period error - -As restated - 204
Add: Irregular expenditure – relating to prior year - -Add: Irregular expenditure – relating to current year 22.2 146 37Less: Prior year amounts condoned - -Less: Current year amounts condoned 22.3 (120) (37)Less: Amounts not condoned and recoverable - -Less: Amounts not condoned and not recoverable - (204)Closing Balance 26 -
Analysis of awaiting condonation per age classificationCurrent year 26 -Prior years - -Total 26 -
22.2 Details of irregular expenditure – current year
Incident Disciplinary steps /criminal proceedings 2015/2016
Procurement procedures not followed Warning letters issued 110Procurement procedures not followed Not applicable 10Functional criteria not correctly specified Warning letter issued 26Total 146
22.3 Details of irregular expenditure condoned
Incident Condoned by (condoning authority) 2014/2015
Procurement procedures not followed Loss Control Committee 110Procurement procedures not followed Loss Control Committee 10Total 120

PAGE 130
DEPARTMENT OF PLANNING, MONITORING AND EVALUATION Annual Report 2015/2016
23. Fruitless and wasteful expenditure
23.1 Reconciliation of fruitless and wasteful expenditure
Note 2015/2016 2014/2015
Opening balance 2 21Prior period error - -As restated 2 21Fruitless and wasteful expenditure – relating to prior years 17 -Fruitless and wasteful expenditure – relating to current year 23.3 330 3Less: Amounts resolved (9) (19)Less: Amounts transferred to receivables for recovery - (3)Fruitless and wasteful expenditure awaiting resolution 23.2 340 2
23.2 Analysis of awaiting resolution per economic classification
Note 2015/2016 2014/2015
Current 340 2
23.3 Analysis of current year’s fruitless and wasteful expenditure
Incident Disciplinary steps/criminal proceedings 2015/2016
Cancellation fees – conference venue Under investigation 258No Show/Cancellation – Travel Officials held liable in cases of negligence 69Damages to rented vehicles Officials held liable in cases of negligence 3Total 330
24. Related party transactions
All departments and public entities in the national sphere of government are related parties. The value of transactions are disclosed when these transactions are not undertaken at arm’s length. National Youth Development Agency (NYDA) are reported under transfer payments. The Department of Public Works (DPW) provides the Presidency, who in turn provides DPME with office accommodation at the Union Buildings at no cost to DPME.
25. Key management personnel
No. of Individuals 2015/2016 2014/2015
Political office bearers (Minister and Deputy Minister)1 2 4 098 -Officials:Level 15 to 16 2,3 21 23 271 23 372Level 14 2,3 16 14 796 11 329Family members of key management personnel - -
Total 42 165 34 701
Note: 1: The Offices of the Minister and Deputy Minister were transferred to DPME from The Presidency on 1 October 2015.Note 2: Remuneration only includes amounts expensed during the financial year. Figures include key management personnel and specialists at salary levels 14, 15 and above (including contract and seconded personnel) as well as other staff members at lower levels.Note 3: Includes 2 officials that are related and therefore not included under “Family members of key management personnel”.
26. Public Private Partnership
Note 2015/2016 2014/2015
Contract fee paid: Indexed componentGoods and services (excluding lease payments) - 286Operating leases - 163Total - 449
Note: The Department participated in the PPP Vehicle Fleet Contract (RTG718) between the Department of Transport and Phakisaworld Fleet Solutions for the lease of long-term vehicles. DPME participation ended in the 2014/15 financial year.

PAGE 131
27. Movable Tangible Capital Assets
27.1 Movable Tangible Capital Assets: Movement for 2015/16
Movement in movable tangible capital assets per asset register for the year ended 31 March 2016
Machinery and equipment Opening balanceValue
adjustmentsAdditions Disposals Closing Balance
Transport assets 833 - 2 728 (1 091) 2 470 Computer equipment 24 658 - 10 581 (593) 34 646 Furniture and office equipment 5 046 - 638 (149) 5 535 Other machinery and equipment 4 138 - 629 (66) 4 701 Total 34 675 - 14 576 (1 899) 47 352
27.2 Movable Tangible Capital Assets: Additions
Additions to movable tangible capital assets per asset register for the year ended 31 March 2016
Machinery and equipment Cash Non-cash (Finance lease payments)
Rcd. current, not paid (Paid current, rcd.
prior)
Total
Transport assets - 2 728 - - 2 728 Computer equipment 10 101 480 - - 10 581 Furniture and office equipment 477 161 - - 638 Other machinery and equipment 1 495 170 (1 036) - 629
Total 12 073 3 539 (1 036) - 14 576
27.3 Movable Tangible Capital Assets: Disposals
Disposals of movable tangible capital assets per asset register for the year ended 31 March 2016
Machinery and equipment Sold for cash Non-cash
disposal*
Total disposals Cash Received
Actual
Transport assets - 1 091 1 091 -Computer equipment 360 233 593 16 Furniture and office equipment - 149 149 -Other machinery and equipment - 66 66 -
Total 360 1 539 1 899 16
* Includes assets written-off due to theft/losses 124
27.4 Movable Tangible Capital Assets: Movement for 2014/15
Movement in movable tangible capital assets per asset register for the year ended 31 March 2015
Machinery and equipment Opening
balance
Prior period
error
Additions Disposals Closing Balance
Transport assets 42 - 791 - 833 Computer equipment 21 382 - 3 383 (107) 24 658 Furniture and office equipment 2 714 - 2 446 (114) 5 046 Other machinery and equipment 2 093 - 2 045 - 4 138
Total 26 231 - 8 665 (221) 34 675

PAGE 132
DEPARTMENT OF PLANNING, MONITORING AND EVALUATION Annual Report 2015/2016
28. Minor Assets
28.1 Minor Assets: Movement for 2015/16
Movement in minor assets per asset register for the year ended 31 March 2016
Intangible assets Machinery and equipment
TOTAL
Opening Balance 333 6 390 6 723 Value adjustments - 26 26Additions - 1 146 1 146 Disposals - (66) (66)
Total 333 7 496 7 829
Number of R1 minor assets - - -Number of minor assets at cost 325 4 475 4 800
Total 325 4 475 4 800
28.2 Minor Assets: Movement for 2014/15
Movement in minor assets per asset register for the year ended 31 March 2015
Intangible assets Machinery and equipment
TOTAL
Opening Balance 333 3 698 4 031 Value adjustments - - -Additions - 2 876 2 876 Disposals - (184) (184)
Total 333 6 390 6 723
Number of R1 minor assets - - -Number of minor assets at cost 325 3 634 3 959
Total 325 3 634 3 959
29. Intangible Capital Asset
29.1 Intangible Capital Assets: Movement for 2015/16
Movement in intangible capital assets per asset register for the year ended 31 March 2016
Opening balance Value adjustments Additions Disposals Closing Balance
Software 8 051 - 3 129 - 11 180
Total 8 051 - 3 129 - 11 180
29.2 Intangible Capital Assets: Additions for 2015/16
Additions to intangible capital assets per asset register for the year ended 31 March 2016
Cash Non-cash (Finance lease payments)
Rcd. current, not paid (Paid current,
rcd. prior)
Total
Software 3 129 - - - 3 129
Total 3 129 - - - 3 129
29.3 Intangible Capital Assets: Movement for 2014/15
Movement in intangible capital assets per asset register for the year ended 31 March 2015
Opening balance Prior period error Additions Disposals Closing Balance
Software 6 055 - 1 996 - 8 051
Total 6 055 - 1 996 - 8 051

PAGE 133
30. Immovable Tangible Capital Asset
30.1 Immovable Tangible Capital Assets: Movement for 2015/16
Movement in immovable tangible capital assets per asset register for the year ended 31 March 2016
Opening balance Value adjustments Additions Disposals Closing Balance
Non-residential buildings 8 676 - 435 - 9 111
Total 8 676 - 435 - 9 111
30.2 Immovable Tangible Capital Assets: Additions
Additions to immovable tangible capital assets per asset register for the year ended 31 March 2016
Cash* Non-cash (Finance lease payments)
Rcd. current, not paid (Paid current,
rcd. prior)
Total
Non-residential buildings 435 - - - 435
Total 435 - - - 435
*Note: Payments made for improvements to office accommodation leased by DPW for DPME.
30.3 Immovable Tangible Capital Assets: Movement for 2014/15
Movement in immovable tangible capital assets per asset register for the year ended 31 March 2015
Opening balance Value adjustments Additions* Disposals Closing Balance
Non-residential buildings - - 8 676 - 8 676
Total - - 8 676 - 8 676
*Note: Payments made for tenant installation (ICT installation, partitioning, energy saving measures etc.) at office accommodation leased by DPW for DPME.
31. Transfer of functions
The National Planning Programme transferred from The Presidency to DPME on 1 October 2014 (see notes 31.3 and 31.4), retrospectively to 1 April 2014.
The Offices of the Minister and Deputy Minister for Planning, Monitoring and Evaluation transferred from The Presidency to DPME on 1 October 2015 (see notes 31.1 and 31.2), retrospectively to 1 April 2015.

PAGE 134
DEPARTMENT OF PLANNING, MONITORING AND EVALUATION Annual Report 2015/2016
31.1 Statement of Financial Position: 2014/15 comparatives
Transfer of the Offices of the Minister and Deputy Minister
Note Bal per dept.
2014/15 AFS
before transfer*
Functions per
dept. (transferred)/
received
2014/15
Balance after
transfer
2014/15 2014/15 2014/15ASSETSCurrent Assets 38 702 - 38 702Cash and cash equivalents 35 235 - 35 235Other financial assets - - -Prepayments and advances 99 - 99Receivables 3 237 - 3 237Aid assistance receivable 131 - 131
Non-Current Assets 5 - 5Receivables 5 - 5Other financial assets - - -
- - -TOTAL ASSETS 38 707 - 38 707
LIABILITIESCurrent Liabilities 38 688 - 38 688Voted funds to be surrendered to the Revenue Fund 24 695 - 24 695Departmental revenue and NRF Receipts to be surrendered to the Revenue Fund
10 - 10
Payables 37 - 37Aid assistance unutilised 13 946 - 13 946
Non-Current Liabilities: Payables - - -
TOTAL LIABILITIES 38 688 - 38 688
NET ASSETS 19 - 19*As disclosed in the 2014/15 Annual Financial Statements.
31.2 Transfer of functions: Notes: 2014/15 comparatives
Transfer of the Offices of the Minister and Deputy MinisterNote Bal per dept.
2014/15 AFS before transfer*
Functions per dept. (transferred)/
received
2014/15 Balance after
transfer
2014/15 2014/15 2014/15Contingent liabilities 233 - 233Commitments 91 457 151 91 608Accruals 3 629 2 344 5 973Employee benefits 10 630 2 334 12 964Lease commitments – Operating lease 29 709 1 29 710Lease commitments – Finance lease 1 370 474 1 844Irregular expenditure - - -Fruitless and wasteful expenditure 2 - 2Movable tangible capital assets 34 675 3 536 38 211Immovable tangible capital assets 8 676 - 8 676Intangible capital assets 8 051 - 8 051
*As disclosed in the 2014/15 Annual Financial Statements.

PAGE 135
31.3 Statement of Financial Position: 2013/14 comparatives
Transfer of the National Planning Programme
Note Bal per dept. 2013/14
AFS before transfer*
Functions per dept.
(transferred)/received
2013/14 Balance after
transfer
2013/14 2013/14 2013/14ASSETSCurrent Assets 9 449 16 9 465Cash and cash equivalents 7 025 - 7 025Other financial assets - -Prepayments and advances 97 - 97Receivables 803 16 819Aid assistance receivable 1 524 - 1 524
Non-Current Assets - - -Receivables - - -Other financial assets - - -
-TOTAL ASSETS 9 449 16 9 465
LIABILITIESCurrent Liabilities 9 439 - 9 439Voted funds to be surrendered to the Revenue Fund 1 018 - 1 018Departmental revenue and NRF Receipts to be surrendered to the Revenue Fund 7 - 7Payables 14 - 14Aid assistance unutilised 8 400 - 8 400
Non-Current Liabilities: Payables - - -
TOTAL LIABILITIES 9 439 - 9 439
NET ASSETS 10 16 26*As disclosed in the 2013/14 Annual Financial Statements.
Transfer of the National Planning Programme
Transfer of the National Planning Programme
Note Bal per dept.
2013/14 AFS
before transfer*
Functions
per dept.
(transferred)/
received
2013/14 Balance
after transfer
2013/14 2013/14 2013/14
Contingent liabilities - - -
Commitments 51 772 49 195 100 967
Accruals 2 263 3 309 5 572
Employee benefits 6 162 1 926 8 088
Lease commitments – Operating lease 183 3 186
Lease commitments – Finance lease 773 266 1 039
Irregular expenditure 204 - 204
Fruitless and wasteful expenditure 13 - 12
Movable tangible capital assets 26 224 1 235 27 459
Immovable tangible capital assets - - -
Intangible capital assets 6 055 - 6 055
*As disclosed in the 2013/14 Annual Financial Statements.
*As disclosed in the 2013/14 Annual Financial Statements.
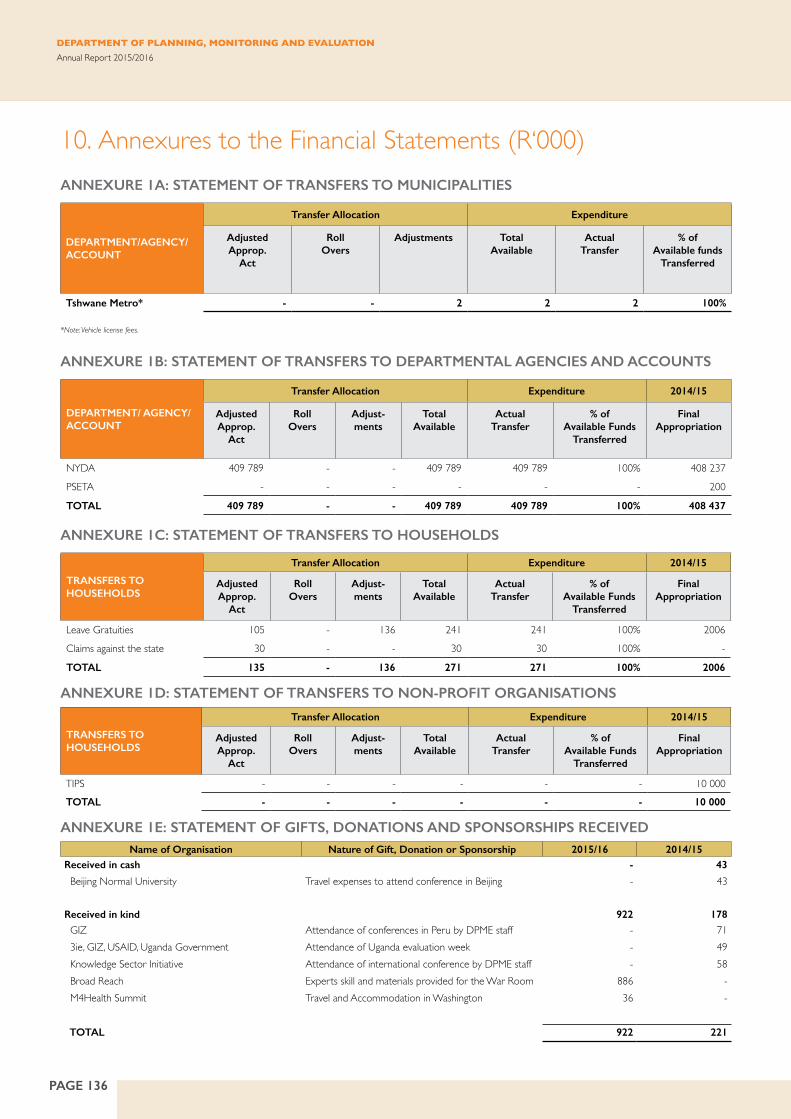
PAGE 136
DEPARTMENT OF PLANNING, MONITORING AND EVALUATION Annual Report 2015/2016
10. Annexures to the Financial Statements (R‘000)ANNEXURE 1A: STATEMENT OF TRANSFERS TO MUNICIPALITIES
DEPARTMENT/AGENCY/ACCOUNT
Transfer Allocation Expenditure
AdjustedApprop.
Act
Roll Overs
Adjustments Total Available
Actual Transfer
% of Available funds
Transferred
Tshwane Metro* - - 2 2 2 100%
*Note: Vehicle license fees.
ANNEXURE 1B: STATEMENT OF TRANSFERS TO DEPARTMENTAL AGENCIES AND ACCOUNTS
DEPARTMENT/ AGENCY/ ACCOUNT
Transfer Allocation Expenditure 2014/15
AdjustedApprop.
Act
Roll Overs
Adjust-ments
Total Available
Actual Transfer
% of Available Funds
Transferred
Final Appropriation
NYDA 409 789 - - 409 789 409 789 100% 408 237
PSETA - - - - - - 200
TOTAL 409 789 - - 409 789 409 789 100% 408 437
ANNEXURE 1C: STATEMENT OF TRANSFERS TO HOUSEHOLDS
TRANSFERS TO HOUSEHOLDS
Transfer Allocation Expenditure 2014/15
AdjustedApprop.
Act
Roll Overs
Adjust-ments
Total Available
Actual Transfer
% of Available Funds
Transferred
Final Appropriation
Leave Gratuities 105 - 136 241 241 100% 2006
Claims against the state 30 - - 30 30 100% -
TOTAL 135 - 136 271 271 100% 2006
ANNEXURE 1D: STATEMENT OF TRANSFERS TO NON-PROFIT ORGANISATIONS
TRANSFERS TO HOUSEHOLDS
Transfer Allocation Expenditure 2014/15
AdjustedApprop.
Act
Roll Overs
Adjust-ments
Total Available
Actual Transfer
% of Available Funds
Transferred
Final Appropriation
TIPS - - - - - - 10 000
TOTAL - - - - - - 10 000
ANNEXURE 1E: STATEMENT OF GIFTS, DONATIONS AND SPONSORSHIPS RECEIVEDName of Organisation Nature of Gift, Donation or Sponsorship 2015/16 2014/15
Received in cash - 43
Beijing Normal University Travel expenses to attend conference in Beijing - 43
Received in kind 922 178 GIZ Attendance of conferences in Peru by DPME staff - 71 3ie, GIZ, USAID, Uganda Government Attendance of Uganda evaluation week - 49 Knowledge Sector Initiative Attendance of international conference by DPME staff - 58 Broad Reach Experts skill and materials provided for the War Room 886 - M4Health Summit Travel and Accommodation in Washington 36 -
TOTAL 922 221

PAGE 137
ANNEXURE 2: STATEMENT OF AID ASSISTANCE RECEIVED
Name of Donor PurposeOpening
BalanceRevenue Expenditure
Closing
Balance
Received in cash
UK Government
(DFID)
Non-budget support financial aid to support strengthening performance monitoring and evaluation for the poor in SA
13 946 13 946 25 454 2 438
Canadian Government (CIDA/DFATD) Supporting the implementation of building a capable state project
(131) 2 674 2 543 -
GIZ Governance Support Programme - 804 864 (60)
EU Programme to Support Pro Poor Development Phase II
- 16 597 11 777 4 820
TOTAL 13 815 34 021 40 638 7 198
Note: Revenue and expenditure in terms of donor agreements.
ANNEXURE 3: CLAIMS RECOVERABLE
GOVERNMENT ENTITY: OUTSTANDING BALANCES
Confirmed Unconfirmed Total
31/03/2016 31/03/2015 31/03/2016 31/03/2015 31/03/2016 31/03/2015
Government DepartmentsDepartment of Cooperative Governance 92 - - 1 624 92 1 624Department of Environmental Affairs - 266 - 266 - 532The Presidency - 81 16 - 16 81Dep. of Health - North West Province - - - 1 - 1Department of Social Development 432 301 704 - 1 136 301GCIS 1 - - - 1 -Economic Development - - 207 - 207 -Basic Education 3 000 - - - 3 000 -Water and Sanitation - - 3 - 3 -Public Works 6 - - - 6 -Office of the Chief Justice 71 - - - 71 -
SUB-TOTAL 3 602 648 930 1 891 4 532 2 539
Other Government Entities
CIDA - 131 - - - 131SARS - - 125 422 125 422GIZ - - 60 - 60 -MISA - - 11 - 11 -
SUB-TOTAL - 131 196 422 196 553
TOTAL 3 602 779 1 126 2 313 4 728 3 092

PAGE 138
DEPARTMENT OF PLANNING, MONITORING AND EVALUATION Annual Report 2015/2016
ANNEXURE 4: INTER-GOVERNMENT PAYABLES
GOVERNMENT ENTITY: OUTSTANDING BALANCES
Confirmed Unconfirmed Total
31/03/2016 31/03/2015 31/03/2016 31/03/2015 31/03/2016 31/03/2015
Departments (Current)
The Presidency 583 65 58 42 641 107
Government Printing Works - - 4 138 4 138
DIRCO 1 249 - - 53 1 249 53
Parliament 4 - - - 4 -
IPID 22 - - - 22 -
Home Affairs 9 - - - 9 -
Other Government Entities (Current) - - - - - -
TOTAL 1 867 65 62 233 1 929 298
ANNEXURE 5: INTER-ENTITY ADVANCES PAID
GOVERNMENT ENTITY: OUTSTANDING BALANCES
Confirmed Unconfirmed Total
31/03/2016 31/03/2015 31/03/2016 31/03/2015 31/03/2016 31/03/2015
National Departments
GCIS - 90 - - - 90DIRCO - - 200 - 200 -
TOTAL - 90 200 - 200 90

UNION BUILDING EASTWINGGOVERNMENT AVENUE
PRIVATE BAG X944PRETORIA
0001
ENQUIRIES: (012) 312 0327SWITHBOARD (011) 312 0000
www.thepresidency-dpme.gov.zaRP325/2015
ISBN 978-0-621-4430-0
UNION BUILDING
EASTWING
GOVERNMENT AV
ENUE
PRIVATE BAG X94
4PRETORI
A 0001
ENQUIRIES: (012)
312 0327
SWITHBOARD (01
1) 312 0000
www.thepresiden
cy-dpme.gov.za
RP325/2015
ISBN 978-0-621-4
430-0
RP193/2016 ISBN: 978-0-621-44673-9
UNION BUILDING EASTWINGGOVERNMENT AVENUE
PRIVATE BAG X944PRETORIA
0001
ENQUIRIES: (012) 312 0011SWITHBOARD (011) 312 1200
www.dpme.gov.za
ANNUAL REPORT 2015 | 2016


