
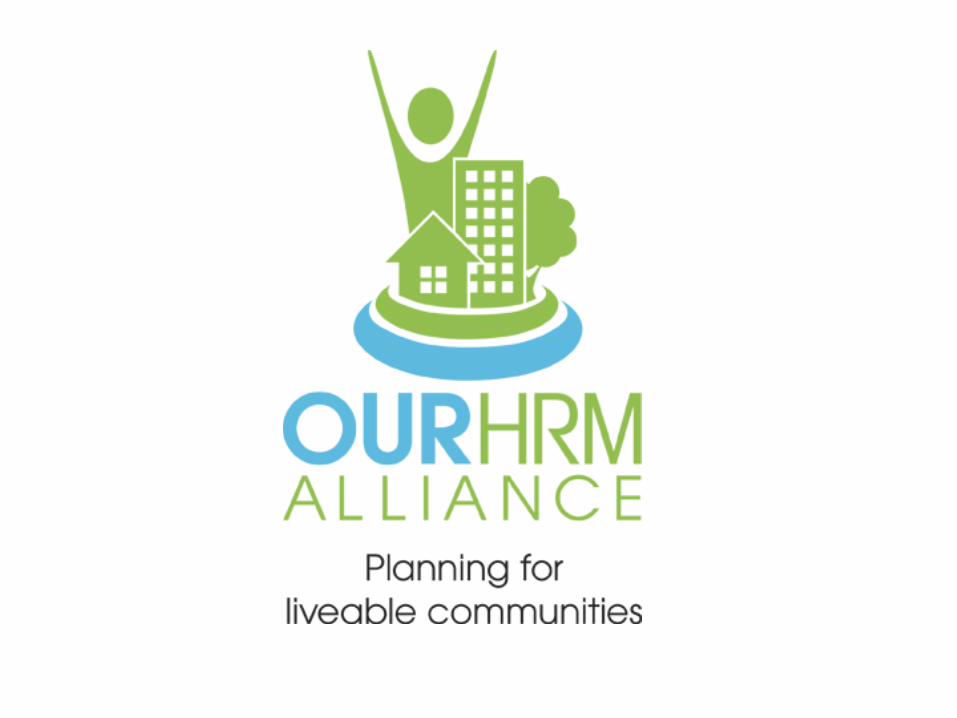
Winnipeg
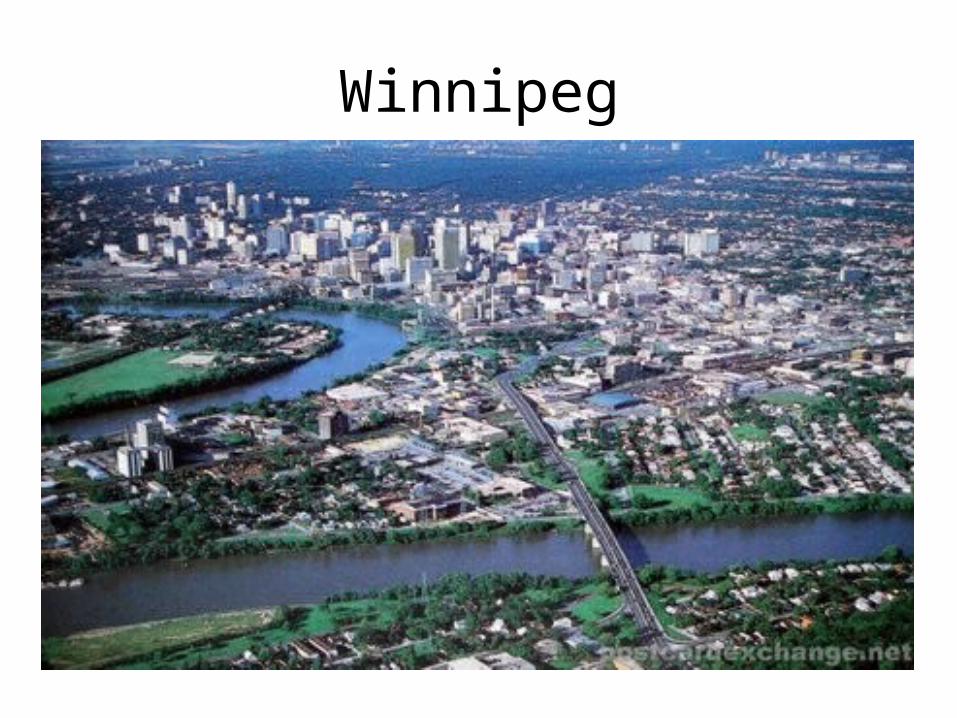
Calgary
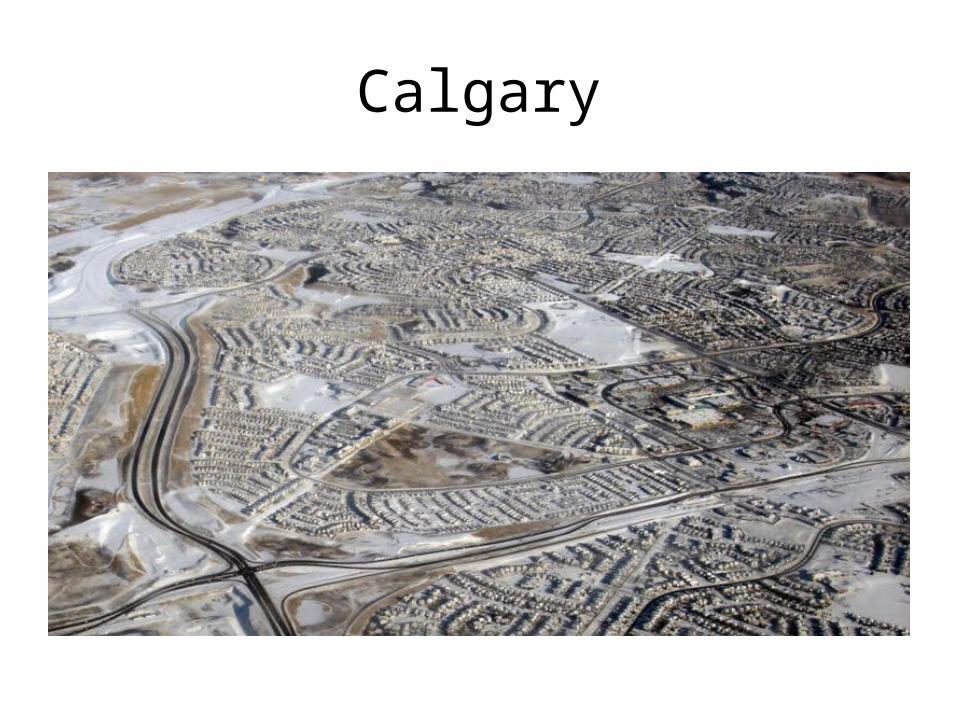
Edmonton
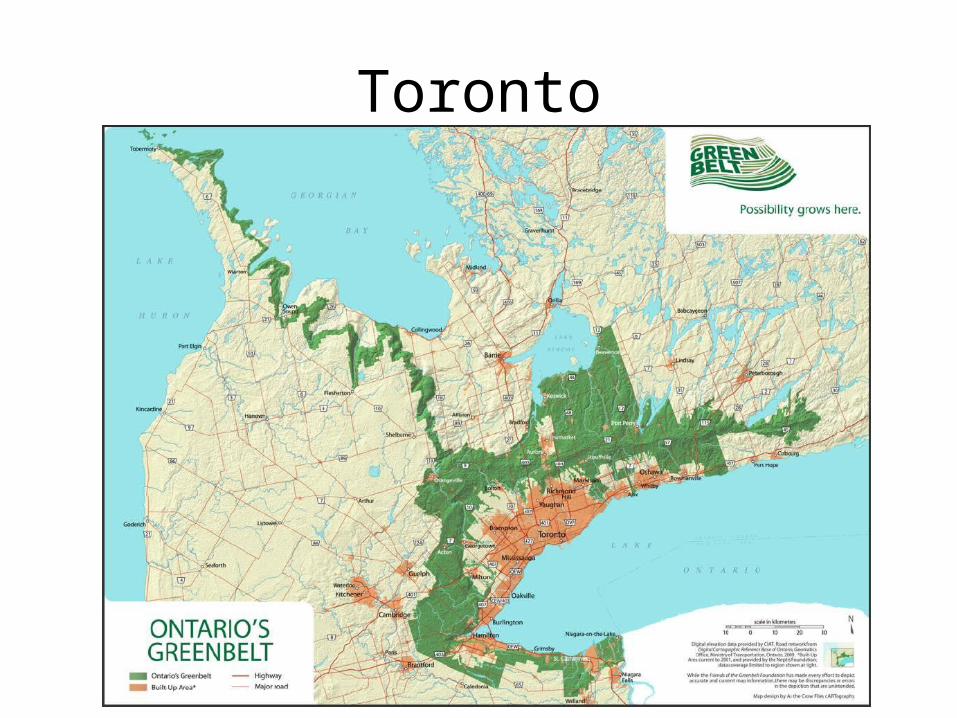
Toronto
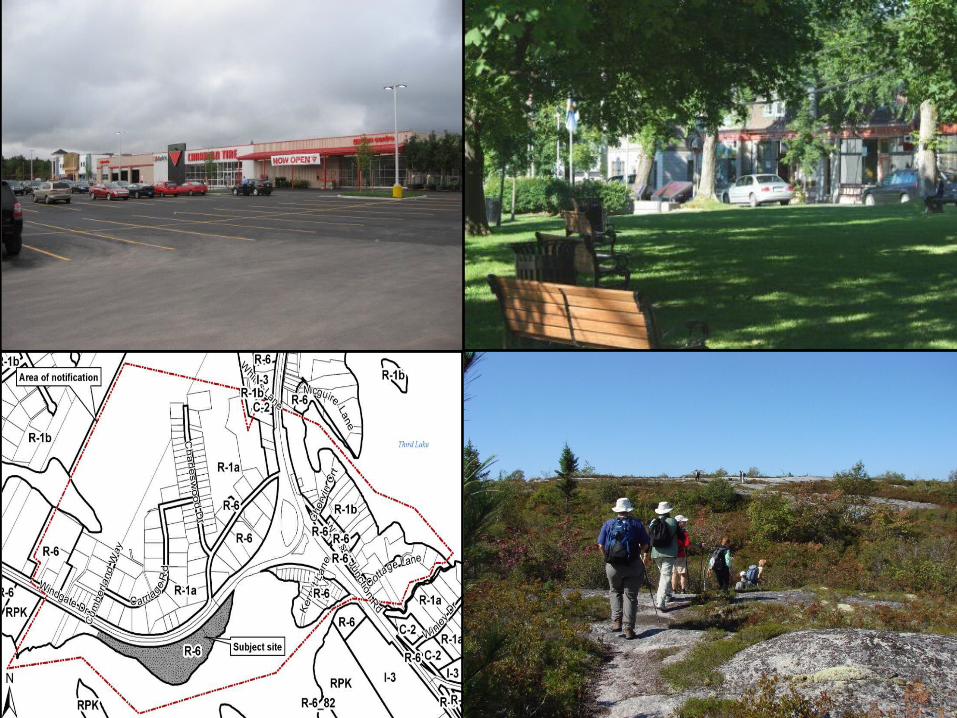
What about HRM?
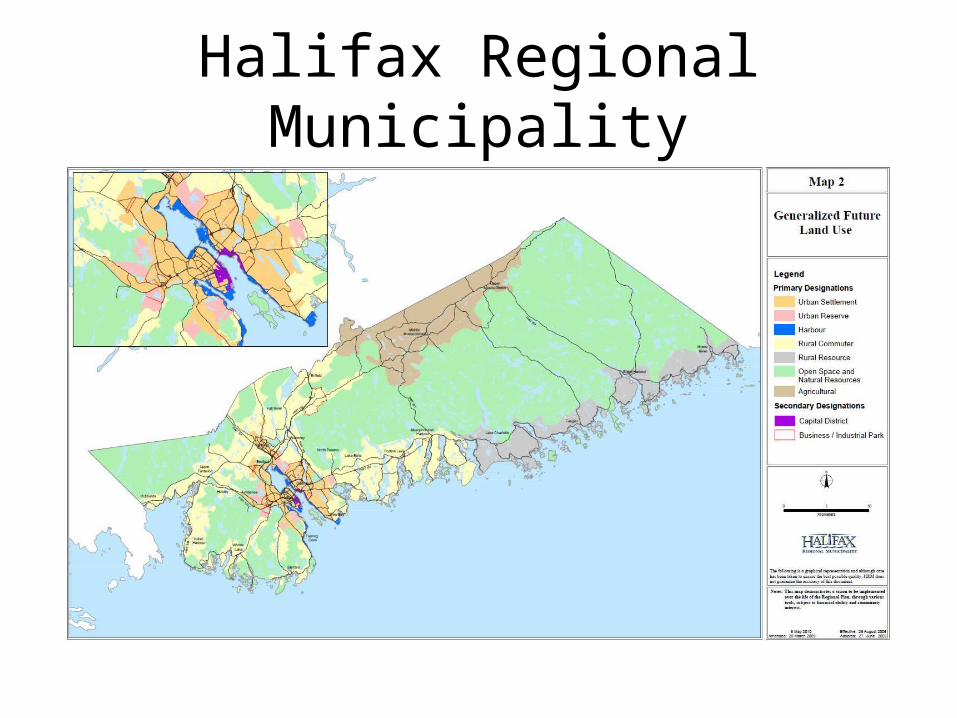
Halifax Regional Municipality
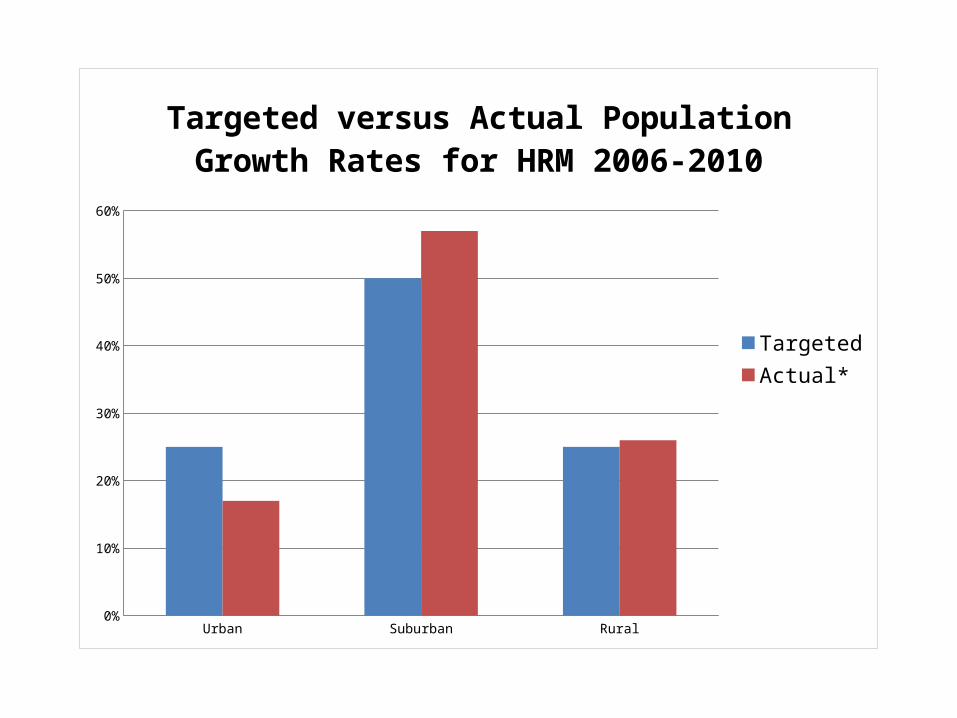
Urban Suburban Rural0%
10%
20%
30%
40%
50%
60%
Targeted versus Actual Population Growth Rates for HRM 2006-2010
TargetedActual*
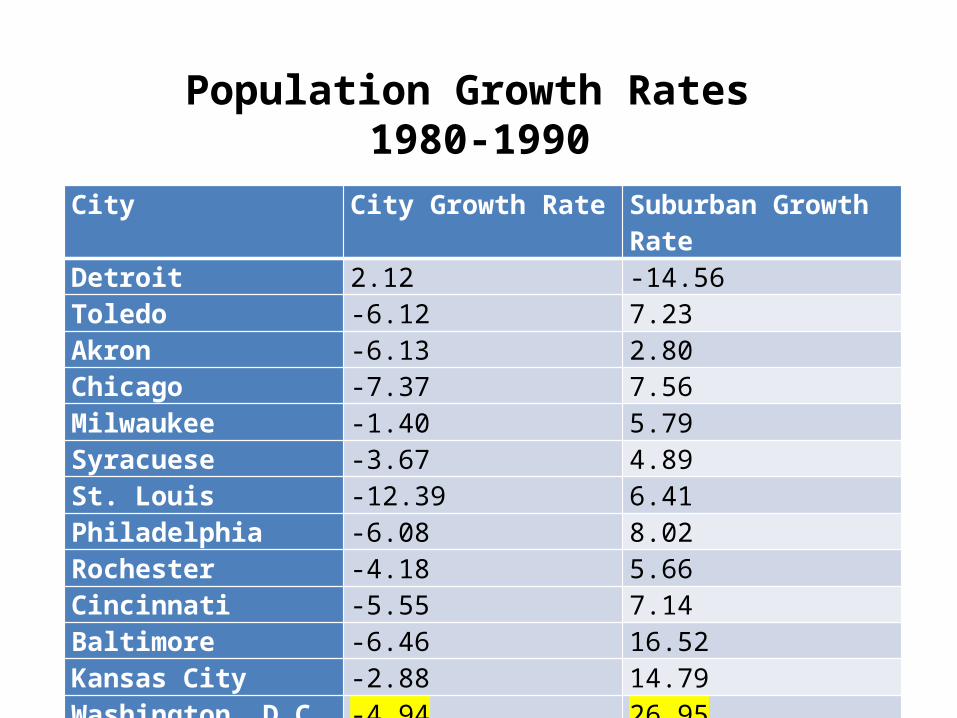
Population Growth Rates 1980-1990
City City Growth Rate Suburban Growth RateDetroit 2.12 -14.56Toledo -6.12 7.23Akron -6.13 2.80Chicago -7.37 7.56Milwaukee -1.40 5.79Syracuese -3.67 4.89St. Louis -12.39 6.41Philadelphia -6.08 8.02Rochester -4.18 5.66Cincinnati -5.55 7.14Baltimore -6.46 16.52Kansas City -2.88 14.79Washington, D.C. -4.94 26.95Halifax* -5.26 28.57
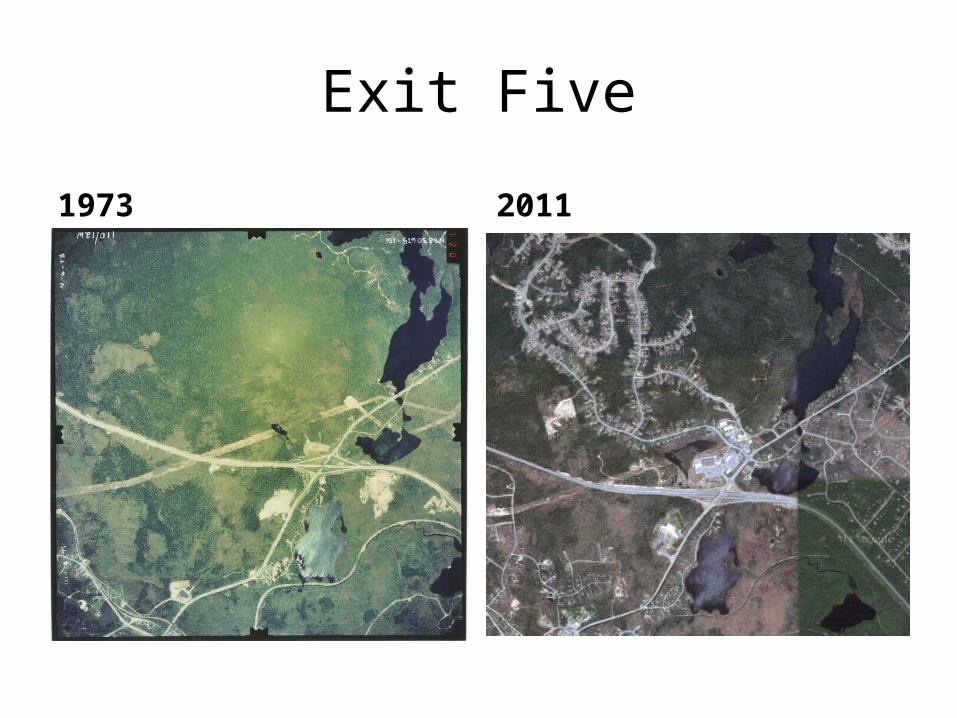
Exit Five
1973 2011
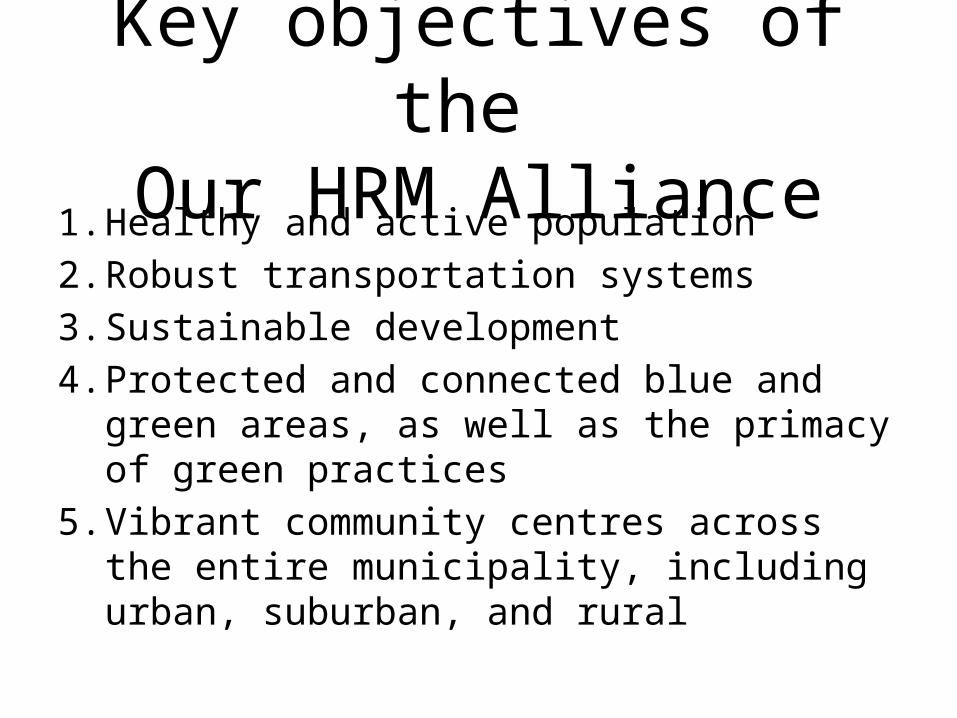
Key objectives of the Our HRM Alliance
1. Healthy and active population2. Robust transportation systems3. Sustainable development4. Protected and connected blue and green
areas, as well as the primacy of green practices5. Vibrant community centres across the entire
municipality, including urban, suburban, and rural
www.ourhrmalliance.ca


