
Workers’Compensation:
Benefits, Coverage, and Costs,
2004
July 2006
Washington, DC

The National Academy of Social Insurance is a nonprofit, nonpartisanorganization made up of the nation’s leading experts on social insurance.Its mission is to conduct research and enhance public understanding ofsocial insurance, develop new leaders, and provide a nonpartisan forumfor exchange of ideas on important issues in the field of social insurance.Social insurance, both in the United States and abroad, encompassesbroad-based systems for insuring workers and their families against eco-nomic insecurity caused by loss of income from work and the cost ofhealth care. The Academy’s research covers social insurance systems suchas Social Security, Medicare, workers’ compensation and unemploymentinsurance, and related social assistance and private employee benefits.
The Academy convenes steering committees and study panels that arecharged with conducting research, issuing findings and, in some cases,reaching recommendations based on their analyses. Members of thesegroups are selected for their recognized expertise and with due considera-tion for the balance of disciplines and perspectives appropriate to theproject. The findings and any recommendations are those of the StudyPanel and do not represent an official position of the National Academyof Social Insurance or its funders.
This research report presents new data and does not make recommenda-tions. It was prepared with the guidance of the Workers’ CompensationSteering Committee and the Study Panel on National Data on Workers’Compensation. In accordance with procedures of the Academy, it hasbeen reviewed by a committee of the Board for completeness, accuracy,clarity, and objectivity.
This project received financial support from the Social SecurityAdministration, the Centers for Medicare & Medicaid Services, and the Office of Workers’ Compensation Programs of the U.S. Departmentof Labor. It also received in-kind support in data from the NationalCouncil of Compensation Insurance, and the National Association ofInsurance Commissioners.
© 2006 National Academy of Social Insurance
ISBN: 1-884902-46-4
Board of Directors
Lawrence H. ThompsonChair
Marilyn Moon President
Margaret C. Simms Vice President
Janet L. Shikles Secretary
Richard A. HobbieTreasurer
John F. Burton, Jr.Kathleen A. Buto Jack. C. Ebeler
Jennie Chin HansonJerry L. MashawMark Novitch
Patricia M. OwensJoseph F. Quinn
Anna M. RappaportWilliam E. Spriggs
Andrew Stern
Founding Chair
Robert M. Ball
Executive Vice PresidentPamela J. Larson
VP for Income SecurityVirginia P. Reno
VP for Health PolicyPaul Van de Water
1776 Massachusetts Ave., NWSuite 615
Washington, DC 20036-1904Telephone (202) 452-8097Facsimile (202) 452-8111
E-mail [email protected]: www.nasi.org

Workers’Compensation:
Benefits, Coverage, and Costs,
2004
by
Ishita Sengupta, Virginia Reno, and John F. Burton, Jr.
with advice of the
Study Panel on National Data on
Workers’ Compensation
and the
Steering Committee on Workers’ Compensation
July 2006
Washington, DC


Workers’ Compensation: Benefits, Coverage, and Costs, 2004 • i
Because workers’ compensation statutes are enactedand administered at the state level, it is difficult toget a complete picture of national developments.Until 1995, the U.S. Social Security Administration(SSA) produced the only comprehensive nationaldata on workers’ compensation benefits and costs.For more than four decades, the research office ofSSA filled part of the void in workers’ compensationdata by piecing together information from varioussources to estimate the number of workers coveredand, for each state and nationally, the aggregate ben-efits paid. SSA discontinued the series in 1995 afterpublishing data for 1992–93.
The SSA data on workers’ compensation were avaluable reference for employers, insurance organiza-tions, unions, and researchers, who relied on them asthe most comprehensive and objective informationavailable. Users of the data turned to the NationalAcademy of Social Insurance as a reliable and inde-pendent source to continue and improve upon thedata series. The need to continue the series remainsparticularly urgent as workers’ compensation pro-grams are changing rapidly.
In February 1997, the Academy received start-upfunding from The Robert Wood JohnsonFoundation to launch a research initiative in work-ers’ compensation with its first task to develop meth-ods to continue the national data series. Funding tocontinue the project came from the Social SecurityAdministration, the Centers for Medicare &Medicaid Services, the Department of Labor, theLiberty Mutual Insurance Company, the Workers’Compensation Research Institute, and the LaborManagement Group. In addition, the NationalCouncil on Compensation Insurance provides accessto important data for the project. Without supportfrom these sources, continuing this vital data serieswould not be possible.
To set its agenda and oversee its activities in workers’compensation, the Academy convened the Workers’Compensation Steering Committee, listed on pageiii. The Study Panel on National Data on Workers’Compensation, listed on page iv, provides technicalexpertise for the data report.
This is the ninth report the Academy has issued onworkers’ compensation national data. In December
1997, it published a report that extended the dataseries through 1995. Jack Schmulowitz, a retiredSSA analyst, prepared the report and provided theAcademy with full documentation of the methodsused to produce the estimates. Subsequent reportspublished by the Academy through 2005 extendedthe data series through 2003. Those reports used thesame basic methodology followed in prior reportsbut incorporated several innovations. In particular,the Academy reports:
■ Provide state-level information separating med-ical and cash benefits;
■ Place workers’ compensation in context withother disability insurance programs;
■ Compare the recent trends in the benefitspending for workers’ compensation to thosefor Social Security disability insurance;
■ Discuss the relative advantages and drawbacksof using calendar year benefits paid vis-à-visaccident year incurred losses to measure benefittrends;
■ Estimate benefits paid under deductible provi-sions for individual states;
■ Present state-level estimates of the number ofcovered workers and total covered wages;
■ Report estimates of benefits relative to totalwages in each state;
■ Provide information on special federal pro-grams that are similar to workers’ compensa-tion, but are not included in national totals inthe Academy’s series;
■ Compare trends in workers’ compensationclaims frequency for privately insured employ-ers with trends in incidence of work-relatedinjuries reported by private employers to theBureau of Labor Statistics;
■ Update estimates for the past five years ofworkers’ compensation benefits, costs, and cov-erage in each report; and
■ Provide more complete documentation ofmethods for collecting data and estimating cov-erage, deductibles, and self-insured benefits andcosts.
This data report benefited from the expertise ofmembers of the Study Panel on National Data on
Preface
ii NATIONAL ACADEMY OF SOCIAL INSURANCE
Workers’ Compensation, who gave generously oftheir time and knowledge in advising on data sourcesand presentation, interpreting results, and carefullyreviewing the draft report. We would like to especial-ly acknowledge Barry Llewellyn, Senior DivisionalExecutive and Actuary with the National Council onCompensation Insurance, Eric Nordman, Director ofResearch, National Association of InsuranceCommissioners, Greg Krohm, Executive Director,International Association of Industrial AccidentBoards and Commissions, and Allan Hunt, Assistant
Executive Director, W.E. Upjohn Institute, who pro-vided the Academy with data and their considerableexpertise on many data issues. This report also bene-fited from helpful comments during Board review by Christine Baker, Paul Cullinan and Paul Van deWater.
John F. Burton, Jr.Chair, Study Panel on National Data on Workers’Compensation

Workers’ Compensation: Benefits, Coverage, and Costs, 2004 • iii
Robert Steggert, ChairVice President of CasualtyClaims, Marriott International,Inc.
H. Allan Hunt, Vice ChairAssistant Executive DirectorW.E. Upjohn Institute
James N. Ellenberger, Vice ChairFormer Deputy CommissionerVirginia EmploymentCommission
Christine BakerExecutive OfficerCalifornia Commission on Health and Safety andWorkers' Compensation
Marjorie BaldwinProfessor, W.P. Carey School of Business, School ofHealth Management and Policy,Arizona State University
Peter S. BarthProfessor of Economics,Emeritus, University ofConnecticut
Keith BatemanVice President, Workers'Compensation, PropertyCasualty Insurers Association of America
Leslie BodenProfessor, School of PublicHealth, Boston University
John F. Burton, Jr.Professor Emeritus Labor Studies & EmploymentRelations, School ofManagement & Labor RelationsRutgers University
Ann ClaytonConsultant on Workers’Compensation
Shelby HallmarkDirector, Office of Workers’Compensation ProgramsU.S. Department of Labor
Jay S. Himmelstein, M.D.Director, Robert Wood JohnsonFoundation, Workers'Compensation Health InitiativeCenter for Health Policy andResearch, University ofMassachusetts Medical School
William JohnsonProfessor of Economics, W.P.Carey School of Business Schoolof Health Management andPolicy, Arizona State University
Frederick W. KilbourneIndependent ActuaryThe Kilbourne Company
Kate KimpanAssociateDade Moeller & Associates
Gregory KrohmExecutive DirectorInternational Association ofIndustrial Accident Boards andCommissions
Barry LlewellynSenior Divisional Executive,Regulatory ServicesNational Council onCompensation Insurance, Inc.
Paul Mattera Senior Vice President and ChiefPublic Affairs OfficerLiberty Mutual Group
Eric NordmanDirector of ResearchNational Association ofInsurance Commissioners
Eric J. OxfeldPresident, UWC -StrategicServices on Unemploymentand Worker's Compensation
Tom RankinPast PresidentCalifornia Labor Federation,AFL-CIO
Robert RevilleDirector, Institute for CivilJustice, RAND
Emily A. SpielerDean and Edwin W. HadleyProfessor of Law, NortheasternUniversity School of Law
Allyn C. TatumVice President of ClaimsTyson Foods
Richard A. VictorExecutive DirectorWorkers' CompensationResearch Institute
Edward M. WelchDirector, Workers’Compensation CenterSchool of Labor and IndustrialRelations, Michigan StateUniversity
Steering Committee for Workers’ Compensation

iv NATIONAL ACADEMY OF SOCIAL INSURANCE
John F. Burton, Jr., ChairProfessor Emeritus Labor Studies & EmploymentRelations, School ofManagement & Labor RelationsRutgers University
Marjorie BaldwinProfessor, W.P. Carey School ofBusiness, School of HealthManagement and PolicyArizona State University
Peter S. BarthProfessor of Economics,Emeritus, University ofConnecticut
Keith BatemanVice President, Workers'CompensationProperty Casualty InsurersAssociation of America
Leslie BodenProfessor, School of PublicHealth, Boston University
Aaron CatlinEconomist, National HealthStatistics Group, Office of theActuary, Centers for Medicareand Medicaid Services
James N. EllenbergerFormer Deputy CommissionerVirginia EmploymentCommission
Shelby HallmarkDirector, Office of Workers’Compensation ProgramsU.S. Department of Labor
Jay S. Himmelstein, M.D.Director, Robert Wood JohnsonFoundation, Workers'Compensation Health InitiativeCenter for Health Policy andResearch, University ofMassachusetts Medical School
H. Allan HuntAssistant Executive DirectorW.E. Upjohn Institute
Kate KimpanAssociateDade Moeller & Associates
Gregory KrohmExecutive DirectorInternational Association ofIndustrial Accident Boards andCommissions
Katharine LevitSenior Research Leader,Thomson-Medstat
Barry LlewellynSenior Divisional Executive,Regulatory ServicesNational Council onCompensation Insurance, Inc.
Paul MatteraSenior Vice President and ChiefPublic Affairs OfficerLiberty Mutual Group
Eric NordmanDirector of ResearchNational Association ofInsurance Commissioners
Eric J. OxfeldPresident, UWC -StrategicServices on Unemploymentand Worker's Compensation
Robert RevilleDirector, Institute for CivilJustice, RAND
John RuserAssociate Director for RegionalEconomics, Bureau of EconomicAnalysis
Emily A. SpielerDean and Edwin W. HadleyProfessor of Law, NortheasternUniversity School of Law
Robert SteggertVice President of CasualtyClaims, Marriott International,Inc.
Richard A. VictorExecutive Director, Workers'Compensation Research Institute
Alex WasarhelyiProject Officer, Social SecurityAdministration
Benjamin WashingtonStatistician, National HealthStatistics Group, Office of theActuary, Centers for Medicareand Medicaid Services
Edward M. WelchDirector, Workers’Compensation CenterSchool of Labor and IndustrialRelations, Michigan StateUniversity
William J. WiatrowskiAssociate CommissionerOffice of Compensation &Working ConditionsU.S. Department of Labor,Bureau of Labor Statistics
Study Panel on National Data on Workers’ Compensation
Workers’ Compensation: Benefits, Coverage, and Costs, 2004 • v
Table of ContentsPreface . . . . . . . . . . . . . . . . . . . . . . . . . . . . . . . . . . . . . . . . . . . . . . . . . . . . . . . . . . . . . . . . . . . . . . . . . . . . i
Highlights . . . . . . . . . . . . . . . . . . . . . . . . . . . . . . . . . . . . . . . . . . . . . . . . . . . . . . . . . . . . . . . . . . . . . . . . . 1
Need for this Report . . . . . . . . . . . . . . . . . . . . . . . . . . . . . . . . . . . . . . . . . . . . . . . . . . . . . . . . . . . . 1
Target Audience . . . . . . . . . . . . . . . . . . . . . . . . . . . . . . . . . . . . . . . . . . . . . . . . . . . . . . . . . . . . . . . . 1
Workers’ Compensation and Other Disability Benefits . . . . . . . . . . . . . . . . . . . . . . . . . . . . . . . . . 1
Trends in Workers’ Compensation Benefits and Costs . . . . . . . . . . . . . . . . . . . . . . . . . . . . . . . . . 3
Reasons for Trends in Workers’ Compensation Benefits. . . . . . . . . . . . . . . . . . . . . . . . . . . . . . . . 4
Overview of Workers’ Compensation . . . . . . . . . . . . . . . . . . . . . . . . . . . . . . . . . . . . . . . . . . . . . . . . . . . 6
Types of Workers’ Compensation Benefits . . . . . . . . . . . . . . . . . . . . . . . . . . . . . . . . . . . . . . . . . . . . . . . 7
Covered Employment . . . . . . . . . . . . . . . . . . . . . . . . . . . . . . . . . . . . . . . . . . . . . . . . . . . . . . . . . . . . . . . . 8
Coverage Rules . . . . . . . . . . . . . . . . . . . . . . . . . . . . . . . . . . . . . . . . . . . . . . . . . . . . . . . . . . . . . . . . 8
Method for Estimating Coverage . . . . . . . . . . . . . . . . . . . . . . . . . . . . . . . . . . . . . . . . . . . . . . . . . . 9
Changes in State Coverage . . . . . . . . . . . . . . . . . . . . . . . . . . . . . . . . . . . . . . . . . . . . . . . . . . . . . . 12
Benefit Payments . . . . . . . . . . . . . . . . . . . . . . . . . . . . . . . . . . . . . . . . . . . . . . . . . . . . . . . . . . . . . . . . . . 12
Method for Estimating Benefits . . . . . . . . . . . . . . . . . . . . . . . . . . . . . . . . . . . . . . . . . . . . . . . . . . 13
Sources of Insurance Coverage . . . . . . . . . . . . . . . . . . . . . . . . . . . . . . . . . . . . . . . . . . . . . . . . . . 13
Trends in Deductibles and Self-Insurance . . . . . . . . . . . . . . . . . . . . . . . . . . . . . . . . . . . . . . . . . . 14
Changes in State Benefits . . . . . . . . . . . . . . . . . . . . . . . . . . . . . . . . . . . . . . . . . . . . . . . . . . . . . . . 16
Medical Payments in States . . . . . . . . . . . . . . . . . . . . . . . . . . . . . . . . . . . . . . . . . . . . . . . . . . . . . 16
State Benefits Relative to Wages . . . . . . . . . . . . . . . . . . . . . . . . . . . . . . . . . . . . . . . . . . . . . . . . . 17
Employer Costs . . . . . . . . . . . . . . . . . . . . . . . . . . . . . . . . . . . . . . . . . . . . . . . . . . . . . . . . . . . . . . . . . . . . 26
Trend in Benefit and Cost Ratios . . . . . . . . . . . . . . . . . . . . . . . . . . . . . . . . . . . . . . . . . . . . . . . . . . . . . . 29
Work Injuries, Occupational Illness and Fatalities . . . . . . . . . . . . . . . . . . . . . . . . . . . . . . . . . . . . . . . . . 29
Fatalities at Work . . . . . . . . . . . . . . . . . . . . . . . . . . . . . . . . . . . . . . . . . . . . . . . . . . . . . . . . . . . . . . 29
Nonfatal Injuries and Illnesses . . . . . . . . . . . . . . . . . . . . . . . . . . . . . . . . . . . . . . . . . . . . . . . . . . . 29
Workers’ Compensation Claims . . . . . . . . . . . . . . . . . . . . . . . . . . . . . . . . . . . . . . . . . . . . . . . . . . 31
Comparing Workers’ Compensation with Other Disability Benefit Programs . . . . . . . . . . . . . . . . . . . 32
Other Disability Benefits . . . . . . . . . . . . . . . . . . . . . . . . . . . . . . . . . . . . . . . . . . . . . . . . . . . . . . . . 32
Social Security Disability Insurance and Medicare . . . . . . . . . . . . . . . . . . . . . . . . . . . . . . . . . . . 33
Incurred Losses Compared with Benefits Paid . . . . . . . . . . . . . . . . . . . . . . . . . . . . . . . . . . . . . . . . . . . 36
Glossary. . . . . . . . . . . . . . . . . . . . . . . . . . . . . . . . . . . . . . . . . . . . . . . . . . . . . . . . . . . . . . . . . . . . . . . . . . 39
Appendix A: Coverage Estimates . . . . . . . . . . . . . . . . . . . . . . . . . . . . . . . . . . . . . . . . . . . . . . . . . . . . . . 41
Appendix B: Questionnaire for State Agencies . . . . . . . . . . . . . . . . . . . . . . . . . . . . . . . . . . . . . . . . . . . 47
Appendix C: Data Availability . . . . . . . . . . . . . . . . . . . . . . . . . . . . . . . . . . . . . . . . . . . . . . . . . . . . . . . . . 49
Private Carrier Benefits . . . . . . . . . . . . . . . . . . . . . . . . . . . . . . . . . . . . . . . . . . . . . . . . . . . . . . . . . 49
State Fund Benefits . . . . . . . . . . . . . . . . . . . . . . . . . . . . . . . . . . . . . . . . . . . . . . . . . . . . . . . . . . . . 49
Self-Insured Benefits . . . . . . . . . . . . . . . . . . . . . . . . . . . . . . . . . . . . . . . . . . . . . . . . . . . . . . . . . . . 49
Medical Benefits. . . . . . . . . . . . . . . . . . . . . . . . . . . . . . . . . . . . . . . . . . . . . . . . . . . . . . . . . . . . . . . 49
Employer Costs . . . . . . . . . . . . . . . . . . . . . . . . . . . . . . . . . . . . . . . . . . . . . . . . . . . . . . . . . . . . . . . 49
Appendix D: Revised Data for 2000–2003 . . . . . . . . . . . . . . . . . . . . . . . . . . . . . . . . . . . . . . . . . . . . . . . 53
Appendix E: Self-Insurer Benefit Estimates . . . . . . . . . . . . . . . . . . . . . . . . . . . . . . . . . . . . . . . . . . . . . . 63
Appendix F: Medical Benefit Estimates . . . . . . . . . . . . . . . . . . . . . . . . . . . . . . . . . . . . . . . . . . . . . . . . . 65
Appendix G: Deductible Benefit Estimates . . . . . . . . . . . . . . . . . . . . . . . . . . . . . . . . . . . . . . . . . . . . . . 67
Appendix H: Federal Programs . . . . . . . . . . . . . . . . . . . . . . . . . . . . . . . . . . . . . . . . . . . . . . . . . . . . . . . 69

vi NATIONAL ACADEMY OF SOCIAL INSURANCE
Tables
Table 1 Comparison of Workers’ Compensation Benefits, Coverage, and Costs,2003-2004: Summary . . . . . . . . . . . . . . . . . . . . . . . . . . . . . . . . . . . . . . . . . . . . . . . . . . . . . . .2
Table 2 Number of Workers Covered under Workers’ Compensation Programs and Total Covered Wages, 1989–2004 . . . . . . . . . . . . . . . . . . . . . . . . . . . . . . . . . . . . . . . . . .9
Table 3 Number of Workers Covered by Workers’ Compensation and Total Covered Wages, By State, 2000- 2004 . . . . . . . . . . . . . . . . . . . . . . . . . . . . . . . . . . . . . . . . .10
Table 4 Workers' Compensation Benefits, by Type of Insurer, 1987–2004 (in millions) . . . . . . . . .12
Table 5 Total Amount and Percentage Distribution of Workers’ Compensation Benefit Payments by Type of Insurer, 1990–2004 . . . . . . . . . . . . . . . . . . . . . . . . . . . . . . . .14
Table 6 Estimated Employer-Paid Benefits under Deductible Provisions for Workers’ Compensation, (in millions), 1992–2004 . . . . . . . . . . . . . . . . . . . . . . . . . . . . . . .15
Table 7 Workers’ Compensation Benefits by State, 2000–2004 (in thousands) . . . . . . . . . . . . . . .18
Table 8 Workers' Compensation Benefits by Type of Insurer and Medical Benefits, by State, 2004 (in thousands) . . . . . . . . . . . . . . . . . . . . . . . . . . . . . . . . . . . . . . . . . . . . . . . .20
Table 9 Medical, Cash, and Total Benefits, by State, 2003-2004 (in thousands) . . . . . . . . . . . . . . .22
Table 10 State Workers’ Compensation Benefits Per $100 of Covered Wages, by State, 2000-2004 . . . . . . . . . . . . . . . . . . . . . . . . . . . . . . . . . . . . . . . . . . . . . . . . . . . . . . . .24
Table 11 Employer Costs for Workers’ Compensation by Type of Insurer, 1987–2004 (in millions) . . . . . . . . . . . . . . . . . . . . . . . . . . . . . . . . . . . . . . . . . . . . . . . . . . . . .27
Table 12 Workers’ Compensation Benefit and Cost Ratios, 1989–2004 . . . . . . . . . . . . . . . . . . . . .28
Table 13 Number of Fatal Occupational Injuries, 1992–2004 . . . . . . . . . . . . . . . . . . . . . . . . . . . . . . .30
Table 14 Private Industry Occupational Injury and Illness: Total Non-fatal Cases and Incidence Rates, 1987–2004 . . . . . . . . . . . . . . . . . . . . . . . . . . . . . . . . . . . . . . . . . . . . .31
Table 15 Number of Workers’ Compensation Claims per 100,000 Insured Workers: Private Carriers in Thirty-six Jurisdictions, 1992-2001 . . . . . . . . . . . . . . . . . . . . . . . . . . . .32
Table 16 Social Security Disability Insurance (DI) Beneficiaries with Workers’ Compensation (WC) or Public Disability Benefit (PDB) Involvement, December 2005 . . . . . . . . . . . . . . .34
Table 17 Comparison of Accident-Year Incurred Losses with Calendar-Year Benefits Paid by Private Carriers and State Funds in Thirty-six States, 2000–2004 . . . . . . . . . . . . .36
Table A1 Documenting Workers’ Compensation Coverage Estimates, 2004 Annual Averages . . . . . . . . . . . . . . . . . . . . . . . . . . . . . . . . . . . . . . . . . . . . . . . . . . . . .42
Table A2 Covered Payroll 1989-1999 (in millions) . . . . . . . . . . . . . . . . . . . . . . . . . . . . . . . . . . . . . . .44
Table C1 Workers’ Compensation Data Provided by States for 2004 . . . . . . . . . . . . . . . . . . . . . . . .51
Table D1 Workers’ Compensation Benefits by Type of Insurer and Medical Benefits, by State, 2003 (in thousands) . . . . . . . . . . . . . . . . . . . . . . . . . . . . . . . . . . . . . . . . . . . . . . . .54
Table D2 Workers’ Compensation Benefits by Type of Insurer and Medical Benefits, by State, 2002 (in thousands) . . . . . . . . . . . . . . . . . . . . . . . . . . . . . . . . . . . . . . . . . . . . . . . .56
Table D3 Workers’ Compensation Benefits by Type of Insurer and Medical Benefits, by State, 2001 (in thousands) . . . . . . . . . . . . . . . . . . . . . . . . . . . . . . . . . . . . . . . . . . . . . . . .58
Table D4 Workers’ Compensation Benefits by Type of Insurer and Medical Benefits, by State, 2000 (in thousands) . . . . . . . . . . . . . . . . . . . . . . . . . . . . . . . . . . . . . . . . . . . . . . . .60
Table E1 Self-Insurer Estimation Results, 1997–2004 . . . . . . . . . . . . . . . . . . . . . . . . . . . . . . . . . . . . .63
Table H1 Federal Employees’ Compensation Act, Benefits and Costs, 1997–2004 (in thousands) . . . . . . . . . . . . . . . . . . . . . . . . . . . . . . . . . . . . . . . . . . . . . . . . . . . . . . . . . . . .70
Table H2 Longshore and Harbor Workers’ Compensation Act, Benefits and Costs, 1997–2004 (in thousands) . . . . . . . . . . . . . . . . . . . . . . . . . . . . . . . . . . . . . . . . . . . . . . . . . . .70
Table H3 Black Lung Benefits Act, Benefits and Costs, 1997–2004 (in thousands) . . . . . . . . . . . . . .72
Table H4 Energy Employees Occupational Illness Compensation Program Act, Part B, Benefits and Costs, 2001-2004 (in thousands . . . . . . . . . . . . . . . . . . . . . . . . . . . . .72
Table H5 Radiation Exposure Compensation Act, Benefits Paid as of March 7, 2006 (benefits in thousands) . . . . . . . . . . . . . . . . . . . . . . . . . . . . . . . . . . . . . . . . . . . . . . . . . . . . .74
Table H6 Federal Veterans’ Compensation Program, Compensation Paid in September, 2005 (benefits in thousands) . . . . . . . . . . . . . . . . . . . . . . . . . . . . . . . . . . . . . .74
Figures
Figure 1 Workers’ Compensation Benefits and Costs Per $100 of Covered Wages, 1989–2004 . . . . . . . . . . . . . . . . . . . . . . . . . . . . . . . . . . . . . . . . . . . . . . . . . . . . . . . . . . . . . . . .3
Figure 2 Workers’ Compensation Medical and Cash Benefits per $100 of Covered Wages, 1989-2004 . . . . . . . . . . . . . . . . . . . . . . . . . . . . . . . . . . . . . . . . . . . . . . . .4
Figure 3 Types of Disabilities in Workers’ Compensation Cases with Cash Benefits, 2001 . . . . . . . .7
Figure 4 Nature of Injury or Illness: Percent of Nonfatal Occupational Injuries and Illnesses Involving Days Away from Work, US Private Industry, 2004 . . . . . . . . . . . . . . . .30
Figure 5 Social Security Disability Insurance and Workers’ Compensation Benefits as a Percent of Wages, 1970-2004 . . . . . . . . . . . . . . . . . . . . . . . . . . . . . . . . . . . . .35
Workers’ Compensation: Benefits, Coverage, and Costs, 2004 • vii

viii NATIONAL ACADEMY OF SOCIAL INSURANCE

HighlightsThe purpose of this report is to provide a benchmarkof the benefits and costs of workers’ compensation tofacilitate policy-making and comparisons with othersocial insurance and employee benefit programs.Workers’ compensation pays for medical care, reha-bilitation and cash benefits for workers who areinjured on the job or who contract work-related ill-nesses. It also pays benefits to families of workerswho die of work-related causes. Each state has itsown workers’ compensation program.
Need for this Report
The lack of uniform reporting of states’ experienceswith workers’ compensation makes it necessary topiece together data from various sources to developestimates of benefits paid, costs to employers, andthe number of workers covered by workers’ compen-sation. Unlike other U.S. social insurance programs,state workers’ compensation programs have no feder-al involvement in financing or administration. And,unlike private pensions or employer-sponsoredhealth benefits that receive favorable tax treatment,no federal laws set standards for “tax-qualified” plansor impose any reporting requirements. Consequent-ly, states vary greatly in the data they have availableto assess the performance of workers’ compensationprograms.
For more than forty years, the research office of theU.S. Social Security Administration producednational and state estimates of workers’ compensa-tion benefits, but that activity ended in 1995. Inresponse to requests from stakeholders and scholarsin the workers’ compensation field, the NationalAcademy of Social Insurance took on the challengeof continuing that data series. This is the Academy’sninth annual report on workers’ compensation bene-fits, coverage, and costs. This report presents newdata on developments in workers’ compensation in2004 and updates estimates of benefits, costs, andcoverage for the years 2000–2003. The revised esti-mates in this report replace estimates in theAcademy’s prior report, Workers’ Compensation:Benefits, Coverage, and Costs, 2003.
Target Audience
The audience for the Academy’s reports on workers’compensation includes journalists, business andlabor leaders, insurers, employee benefit specialists,
federal and state policymakers, and researchers inuniversities, government, and private consultingfirms. The data are published in the StatisticalAbstract of the United States by the U.S. CensusBureau; are used in the annual report of the NationalSafety Council, Injury Facts; are reported in EmployeeBenefit News, which tracks developments for humanresource professionals; and are reported inFundamentals of Employee Benefits by the EmployeeBenefit Research Institute. The U.S. Social SecurityAdministration publishes the data in its AnnualStatistical Supplement to the Social Security Bulletinand uses the findings in its estimates of nationalsocial welfare expenditures in the United States. Thefederal Centers for Medicare & Medicaid Servicesuse the data in their estimates and projections ofhealth care spending in the United States. TheNational Institute for Occupational Safety andHealth uses the data to track the cost of workplaceinjuries in the United States. In addition, theInternational Association of Industrial AccidentBoards and Commissions (the organization of stateand provincial agencies that oversee workers’ com-pensation in the United States and Canada) uses theinformation to track and compare the performanceof workers’ compensation programs in the UnitedStates with similar systems in Canada.
The report is produced under the oversight of theAcademy’s Steering Committee on Workers’Compensation and its expert Study Panel onNational Data on Workers’ Compensation, both ofwhich are listed in the front of this report. TheAcademy and its expert advisors are continually seek-ing ways to improve the report and to adapt estima-tion methods to new developments in the insuranceindustry and in workers’ compensation programs.
Workers’ Compensation andOther Disability Benefits
Workers’ compensation is an important part ofAmerican social insurance. As a source of support fordisabled workers, it is surpassed in size only by SocialSecurity disability insurance. Workers’ compensationprograms in the fifty states, the District ofColumbia, and federal programs paid $56.0 billionin benefits in 2004. Of the total, $26.1 billion werefor medical care and $29.9 billion were for cash ben-efits (Table 1).
Workers’ Compensation: Benefits, Coverage, and Costs, 2004 • 1
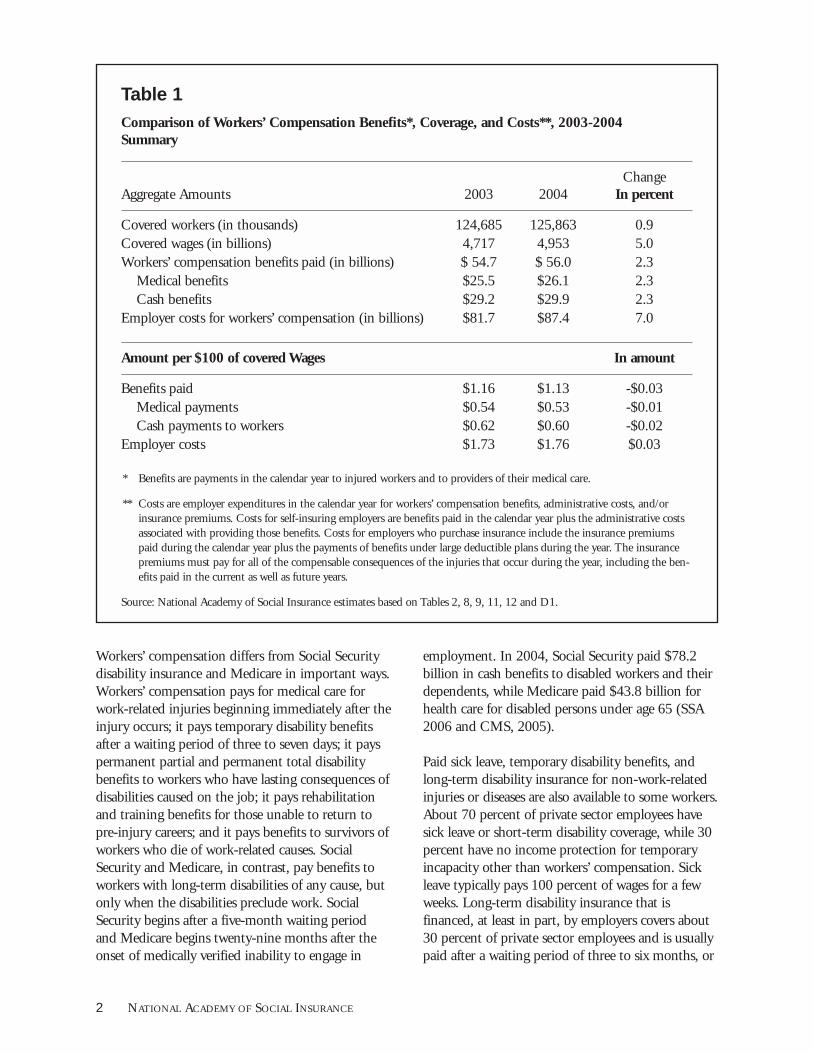
Workers’ compensation differs from Social Securitydisability insurance and Medicare in important ways.Workers’ compensation pays for medical care forwork-related injuries beginning immediately after theinjury occurs; it pays temporary disability benefitsafter a waiting period of three to seven days; it payspermanent partial and permanent total disabilitybenefits to workers who have lasting consequences ofdisabilities caused on the job; it pays rehabilitationand training benefits for those unable to return topre-injury careers; and it pays benefits to survivors ofworkers who die of work-related causes. SocialSecurity and Medicare, in contrast, pay benefits toworkers with long-term disabilities of any cause, butonly when the disabilities preclude work. SocialSecurity begins after a five-month waiting periodand Medicare begins twenty-nine months after theonset of medically verified inability to engage in
employment. In 2004, Social Security paid $78.2billion in cash benefits to disabled workers and theirdependents, while Medicare paid $43.8 billion forhealth care for disabled persons under age 65 (SSA2006 and CMS, 2005).
Paid sick leave, temporary disability benefits, andlong-term disability insurance for non-work-relatedinjuries or diseases are also available to some workers.About 70 percent of private sector employees havesick leave or short-term disability coverage, while 30percent have no income protection for temporaryincapacity other than workers’ compensation. Sickleave typically pays 100 percent of wages for a fewweeks. Long-term disability insurance that isfinanced, at least in part, by employers covers about30 percent of private sector employees and is usuallypaid after a waiting period of three to six months, or
2 NATIONAL ACADEMY OF SOCIAL INSURANCE
Table 1
Comparison of Workers’ Compensation Benefits*, Coverage, and Costs**, 2003-2004Summary
ChangeAggregate Amounts 2003 2004 In percent
Covered workers (in thousands) 124,685 125,863 0.9Covered wages (in billions) 4,717 4,953 5.0Workers’ compensation benefits paid (in billions) $ 54.7 $ 56.0 2.3
Medical benefits $25.5 $26.1 2.3Cash benefits $29.2 $29.9 2.3
Employer costs for workers’ compensation (in billions) $81.7 $87.4 7.0
Amount per $100 of covered Wages In amount
Benefits paid $1.16 $1.13 -$0.03Medical payments $0.54 $0.53 -$0.01Cash payments to workers $0.62 $0.60 -$0.02
Employer costs $1.73 $1.76 $0.03
* Benefits are payments in the calendar year to injured workers and to providers of their medical care.
** Costs are employer expenditures in the calendar year for workers’ compensation benefits, administrative costs, and/orinsurance premiums. Costs for self-insuring employers are benefits paid in the calendar year plus the administrative costsassociated with providing those benefits. Costs for employers who purchase insurance include the insurance premiumspaid during the calendar year plus the payments of benefits under large deductible plans during the year. The insurancepremiums must pay for all of the compensable consequences of the injuries that occur during the year, including the ben-efits paid in the current as well as future years.
Source: National Academy of Social Insurance estimates based on Tables 2, 8, 9, 11, 12 and D1.

after short-term disability benefits end. Long-termdisability insurance is generally designed to replace60 percent of earnings and is reduced if the workerreceives workers’ compensation or Social Securitydisability benefits.
Trends in Workers’ CompensationBenefits and Costs
In 2004, employers’ costs for workers’ compensationgrew faster than combined payments for cash bene-fits and medical treatment for injured workers. Totalcash benefits and medical payments were $56.0 bil-lion in 2004, an increase of 2.3 percent over the2003 amount of $54.7 billion (Table 1). At the sametime, employer costs rose to $87.4 billion from 81.7billion in 2003, an increase of 7.0 percent. For self-insured employers, costs are benefits plus administra-tive costs. For employers who buy insurance, costs
are payments for premiums and for benefits paidunder insurance policies with large deductibles.Premiums paid in a given year do not necessarilycorrespond to benefits paid in the year because pre-miums reflect future liabilities for injuries that occurin the year.
When measured relative to aggregate wages of cov-ered workers, the cost to employers rose by threecents per $100 of wages, to $1.76 in 2004 from$1.73 in 2003 (Table 1). In contrast, total workers’compensation payments to workers fell by threecents for every $100 of wages to $1.13 in 2004 from$1.16 in 2003 (Figure 1). The fall occurred in pay-ments for medical care, which fell from $0.54 to$0.53 per $100 of wages, and in cash benefits paidto injured workers, which fell from $0.62 to $0.60per $100 of wages in 2004 (Figure 2).
Workers’ Compensation: Benefits, Coverage, and Costs, 2004 • 3
Benefits
Employer Costs2.042.18 2.16 2.162.12
2.05
1.82
1.66
1.491.38 1.33
1.461.57
1.65 1.61
1.38
1.68
1.51
1.261.18
1.11 1.10
$0.0
$0.50
$1.00
$1.50
$2.00
$2.50
Benefits
2004200320022001200019991998199719961995199419931992199119901989
1.301.40
1.601.73 1.76
1.06 1.101.16 1.16 1.13
Figure 1
Workers’ Compensation Benefits* and Costs** Per $100 of Covered Wages, 1989–2004
Source: National Academy of Social Insurance estimates.* Benefits are payments in the calendar year to injured workers and to providers of their medical care.** Costs are employer expenditures in the calendar year for workers' compensation benefits, administrative costs, and/or insurancepremiums. Costs for self-insuring employers are benefits paid in the calendar year plus the administrative costs associated with pro-viding those benefits. Costs for employers who purchase insurance include the insurance premiums paid during the calendar yearplus the payments of benefits under large deductible plans during the year. The insurance premiums must pay for all of the com-pensable consequences of the injuries that occur during the year, including the benefits paid in the current as well as future years.

During the extended time period shown in Figure 1,workers’ compensation costs relative to wages fellsteadily from 1993 to 2000, when workers’ compen-sation costs relative to wages were at their lowestpoint in the last 15 years. Since 2000 this measure ofcosts has been rising. Over the four-year period from2000-2004, employer costs per $100 of payroll roseby 46 cents, from $1.30 in 2000 to $1.76 in 2004.This measure of costs remains well below the peakfigure reached in 1990, when employer’s costs were$2.18 per $100 of payroll.
Benefits relative to wages were also at their lowestpoint in the last 15 years in 2000 and then increasedyearly until 2003, only to decline somewhat in 2004(Figure 1). Benefits per $100 of payroll were $1.13in 2004, well below the peak of $1.68 per $100 ofpayroll reached in 1992. Over the entire periodbetween 2000 and 2004, total payments on workers’behalf rose by 6 cents per $100 of payroll. Of that 6-cent increase, all went for an increase in medical pay-ments (Figure 2).
Reasons for Trends in Workers’Compensation Benefits
Fluctuations in payments for workers’ compensationover the last two decades are influenced by policy
developments and the role of workers’ compensationin the broader health care and disability income sys-tems. Opinions often differ about the main causes ofchanges in spending.
In the second half of the 1980s, workers’ compensa-tion benefits and costs grew at double-digit rates andpayments for medical treatment were a growingshare of total payments. Some believe that risingworkers’ compensation medical benefits and costsreflected cost-shifting away from employment-basedhealth insurance to workers’ compensation as theregular health insurance system introduced managedcare and other forms of cost controls in the 1980s(Burton, 1997).
The decline in workers’ compensation benefits in themid-1990s may have been caused by many factors.In response to rising workers’ compensation costs inthe late 1980s and early 1990s, employers and insur-ers expanded the use of disability management tech-niques with the aim of improving return-to-workrates for injured workers and lowering workers’ com-pensation costs. At the same time, workers’ compen-sation systems followed the general health care sys-tem in introducing managed care and other costcontrols to reduce the growth in medical spending.
4 NATIONAL ACADEMY OF SOCIAL INSURANCE
$0.00
$0.20
$0.40
$0.60
$0.80
$1.00
$1.20
Cash
Medical
20022001200019991998199719961995199419931992199119901989
0.53
0.890.94
0.990.95
1.00
0.70
0.93
0.85
0.76
0.65 0.64 0.60 0.60 0.620.57 0.620.66 0.69 0.66
0.580.53
0.50 0.48 0.47 0.46 0.470.50 0.54
0.62
2003 2004
0.60
0.53
Figure 2
Workers’ Compensation Medical and Cash Benefits per $100 of Covered Wages, 1989-2004
Source: National Academy of Social Insurance estimates.

Business representatives believe that the adoption ofmore objective methods of rating permanent disabili-ty and controls against “doctor shopping” reducedclaimants’ incentive to seek additional medical carein order to strengthen their permanent disabilityclaims. On the other hand, worker representativesargue that a stricter adjudicative climate deterredlegitimate claims, while restrictions on workers’choice of their treating doctor made it more difficultto get legitimate claims documented and approved.
A decline in workplace accidents would also con-tribute to a decline in aggregate payments in the1990s. According to surveys by the Bureau of LaborStatistics (BLS), private employers have reportedfewer workplace injuries that result in days awayfrom work. The number of reported injuries or ill-nesses per 100 full-time workers declined from 3.0in 1992 to 1.7 in 2001. It further fell to 1.4 in 2004(U.S. DOL, 2005c). There is evidence that part ofthe decline in injury rates between 1991 and 1997,as measured in the BLS surveys, is the result oftighter eligibility standards and claims-filing restric-tions for workers’ compensation (Boden and Ruser,2003). Fewer cases reported to the workers’ compen-sation system could result in fewer injuries reportedin the BLS survey. The National Council onCompensation Insurance (NCCI) reports a declinein the frequency of workers’ compensation claimsduring the 1990s (NCCI, 2002b). These findingssuggest that workplaces are becoming safer.
In response to rapid growth in costs in the late1980s, some jurisdictions made legislative changesthat would reduce workers’ compensation payments,such as: (a) limiting compensability when a pre-exist-ing condition is involved; (b) stricter evidentiaryrequirements; (c) limiting compensability for partic-ular conditions, such as mental stress or cumulativetrauma disorders; (d) stricter rules for permanent dis-ability benefits; and (e) discouraging fraudulentclaims (Burton and Spieler, 2001). For older work-ers, in particular, it may be difficult to discern theextent to which a condition is directly related toevents on the job or to the cumulative impact ofaging and other life experiences. In this gray area,changes in rules or practices with regard to compens-ability could have a significant impact, especiallybecause a growing share of the workforce is over age50.
Interaction with other disability benefit programscould also affect overall system benefits and costs. Inthe 1980s, when workers’ compensation grew rapidlyas a share of covered wages, Social Security disabilitybenefits declined as a share of covered wages, follow-ing retrenchments in that program in the early1980s. On the other hand, in the 1990s, workers’compensation declined while Social Security disabili-ty benefits rose as a share of covered wages. Whilemost workers’ compensation recipients would not beeligible for Social Security because their disabilitiesare only temporary or partial, injured workers withsignificant long-term work incapacities might qualifyfor Social Security. A recent study finds that morethan one third (36 percent) of persons ages 51-61whose health limited the kind or amount of workthey can do became disabled because of an accident,injury, or illness at work. Of the subset of those dis-abled individuals who were receiving Social Securitydisability insurance, a similar portion (37 percent)said they were disabled because of an accident, injuryor illness at work. The study finds that workers whoattribute their disabling conditions to their jobs arefar more likely to be receiving Social Security disabil-ity insurance (29.0 percent) than to ever havereceived workers’ compensation (4.7 percent)(Reville and Schoeni, 2005). The interactionbetween workers’ compensation and Social Securitydisability insurance remains an important topic forfurther study.
While employer costs are affected by benefit pay-ments to workers, shifts in employer costs as a shareof payroll also reflect broader developments in theinsurance industry and financial markets. Thedecline in employer costs in the 1990s occurred asinsurance companies, spurred by favorable invest-ment returns, cut the premiums they chargedemployers in order to expand their market shares. Inthe mid- and late-1990s, high investment returnscontributed to profits in the workers’ compensationinsurance industry. After 2000, low interest rates andpoor stock market returns reversed that trend. Theworkers’ compensation insurance industry wasunprofitable in 2001 and 2002. Employer costs roseas insurance carriers raised premiums in order tocover anticipated future benefit costs. The workers’compensation insurance industry achieved profitabil-ity for the first time since 2000 in 2003 and prof-itability continued in 2004 (Yates and Burton,2005).
Workers’ Compensation: Benefits, Coverage, and Costs, 2004 • 5

Overview of Workers’CompensationWorkers' compensation provides benefits to workerswho are injured on the job or who contract a work-related illness. Benefits include medical treatment forwork-related conditions and cash payments that par-tially replace lost wages. Temporary total disabilitybenefits are paid while the worker recuperates awayfrom work. If the condition has lasting consequencesafter the worker heals, permanent disability benefitsmay be paid. In case of a fatality, the worker’s depen-dents receive survivor benefits.
Germany enacted the first modern workers’ compen-sation laws, known as Sickness and Accident Laws,in 1884, following their introduction by ChancellorOtto von Bismarck (Clayton, 2004). The next suchlaws were adopted in England in 1897. Workers'compensation was the first form of social insurancein the United States. The first workers’ compensa-tion law in the United States was enacted in 1908 tocover certain federal civilian workers. The first statelaws were passed in 1911. The subsequent adoptionof state workers’ compensation programs has beencalled a significant event in the nation’s economic,legal, and political history.
These laws were adopted throughout the nation,despite the great efforts required to reach agreementsbetween business and labor on the specifics of thebenefits to be provided and on which industries andemployers would have to provide these benefits.Today, each of the fifty states and the District ofColumbia has its own program. A separate programcovers federal civilian employees. Other federal pro-grams provide benefits to coal miners with blacklung disease, longshore and harbor workers, employ-ees of overseas contractors with the U.S. govern-ment, certain energy employees exposed to haz-ardous material, workers engaged in the manufactur-ing of atomic bombs, and veterans injured on activeduty in the armed forces.
Before workers' compensation laws were enacted, aninjured worker's only legal remedy for a work-relatedinjury was to bring a tort suit against the employerand prove that the employer's negligence caused theinjury. At the time, employers could use three com-mon-law defenses to avoid compensating the worker:assumption of risk (showing that the injury resulted
from an ordinary hazard of employment); the fellowworker rule (showing that the injury was due to afellow-worker's negligence); and contributory negli-gence (showing that, regardless of any fault of theemployer, the worker's own negligence contributedto the accident).
Under the tort system, workers often did not recoverdamages and always experienced delays or high costswhen they did. While employers generally prevailedin court, they nonetheless were at risk for substantialand unpredictable losses if the workers’ suits weresuccessful. Litigation created friction betweenemployers and workers. Ultimately, both employersand employees favored legislation to insure that aworker who sustained an occupational injury or dis-ease arising out of and in the course of employmentwould receive predictable compensation withoutdelay, irrespective of who was at fault. As a quid proquo, the employer's liability was limited. Under theexclusive remedy concept, the worker accepts work-ers' compensation as payment in full and gives upthe right to sue.
Workers' compensation programs are designed andadministered by the states. They vary across states interms of who is allowed to provide insurance, whichinjuries or illnesses are compensable, and the level ofbenefits. Generally, state laws require employers toobtain insurance or prove they have the financialability to carry their own risk (self-insure).Workers' compensation is financed almost exclusive-ly by employers, although economists argue thatworkers pay for a substantial portion of the costs ofthe program in the form of lower wages (Leigh et al.,2000). The premiums paid by employers are basedin part on their industry classifications and the occu-pational classifications of their workers. Manyemployers are also experience-rated, which results inhigher (or lower) premiums for employers whosepast experience demonstrates that their workers arepaid more (or less) benefits than those of workers forsimilar employers in the same insurance classifica-tion. The employers’ costs of workers’ compensationcan be affected by other factors, such as deviations,schedule rating, and dividends (Thomason,Schmidle, and Burton, 2001). NCCI data indicatethat the size of these competitive pricing adjustmentsvaries over the course of the insurance underwritingcycle.
6 NATIONAL ACADEMY OF SOCIAL INSURANCE
Types of Workers’Compensation BenefitsWorkers’ compensation pays for medical care imme-diately and pays cash benefits for lost work time aftera three to seven day waiting period. Most workers’compensation cases do not involve lost work timegreater than the waiting period for cash benefits. Inthese cases, only medical benefits are paid. “Medicalonly” cases are quite common, but they represent asmall share of benefit payments. Medical-only casesaccounted for 78 percent of workers’ compensationcases, but only 6 percent of all benefits paid, accord-ing to information about insured employers in thir-ty-eight states for policy years spanning 1998–2001(NCCI, 2003a). The remaining 22 percent of casesthat involved cash benefits accounted for 94 percentof benefits (for cash and medical care combined).
Cash benefits differ according to the duration andseverity of the worker’s disability. Temporary total dis-ability benefits are paid when the worker is tem-porarily precluded from performing the pre-injuryjob or another job at the employer that the workercould have performed prior to the injury. Most statespay weekly benefits for temporary total disability
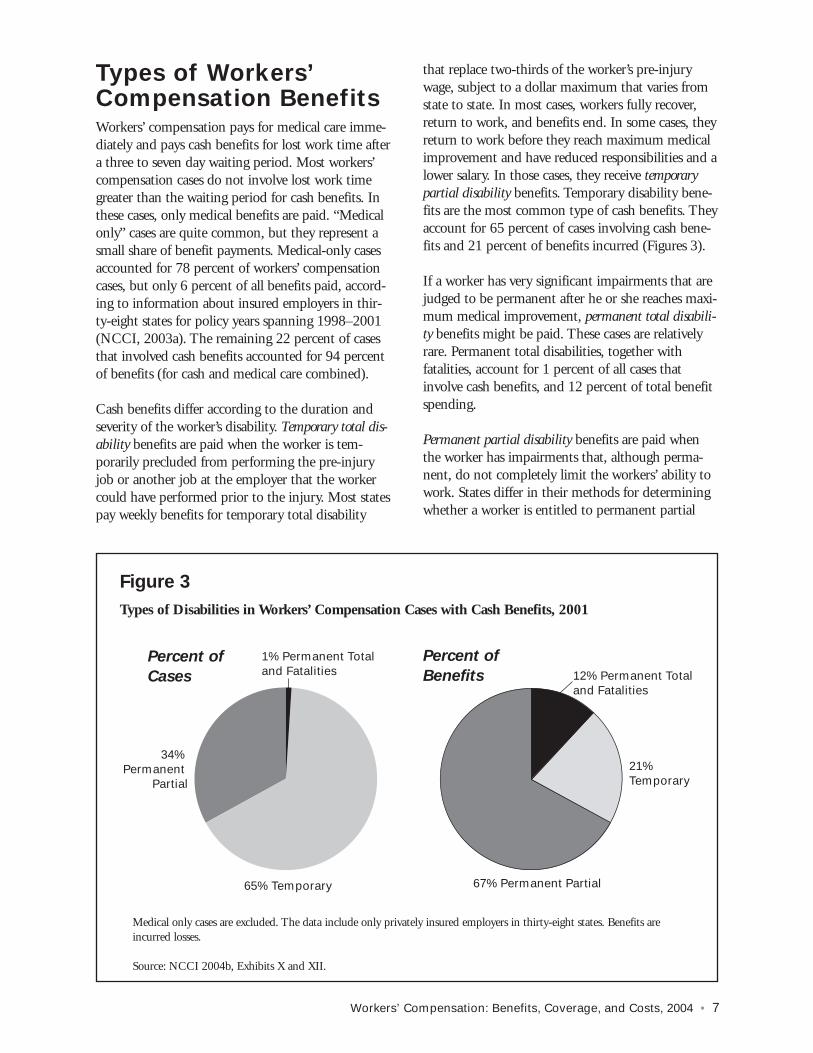
that replace two-thirds of the worker’s pre-injurywage, subject to a dollar maximum that varies fromstate to state. In most cases, workers fully recover,return to work, and benefits end. In some cases, theyreturn to work before they reach maximum medicalimprovement and have reduced responsibilities and alower salary. In those cases, they receive temporarypartial disability benefits. Temporary disability bene-fits are the most common type of cash benefits. Theyaccount for 65 percent of cases involving cash bene-fits and 21 percent of benefits incurred (Figures 3).
If a worker has very significant impairments that arejudged to be permanent after he or she reaches maxi-mum medical improvement, permanent total disabili-ty benefits might be paid. These cases are relativelyrare. Permanent total disabilities, together with fatalities, account for 1 percent of all cases thatinvolve cash benefits, and 12 percent of total benefitspending.
Permanent partial disability benefits are paid whenthe worker has impairments that, although perma-nent, do not completely limit the workers’ ability towork. States differ in their methods for determiningwhether a worker is entitled to permanent partial
Workers’ Compensation: Benefits, Coverage, and Costs, 2004 • 7
Figure 3
Types of Disabilities in Workers’ Compensation Cases with Cash Benefits, 2001
Medical only cases are excluded. The data include only privately insured employers in thirty-eight states. Benefits areincurred losses.
Source: NCCI 2004b, Exhibits X and XII.
1% Permanent Total and Fatalities
65% Temporary
34% Permanent
Partial
12% Permanent Total and Fatalities
21% Temporary
67% Permanent Partial
Percent of
Cases
Percent of
Benefits
benefits, the degree of partial disability and theamount of benefits to be paid (Barth and Niss,1999; Burton, 2005). Cash benefits for permanentpartial disability are frequently limited to a specifiedduration or an aggregate dollar limit. Permanent par-tial disabilities account for 34 percent of cases thatinvolve any cash payments and for 67 percent ofspending.
A recent in-depth study examined the likelihood thatworkers’ compensation claimants would receive per-manent partial disability benefits. It focused on indi-viduals in six states who had experienced more thanseven days of lost work time. Those who subsequent-ly received permanent partial benefits ranged fromabout 3 in 10 in one state, to more than half of caseswith at least one week of lost work time in two otherstates (Barth et al., 2002).
Methods for compensating permanent impairmentsfall into several broad categories (Barth, 2004). About43 jurisdictions use a schedule—a list of body partsthat are covered. Typically, a schedule appears in theunderlying statute and lists benefits to be paid forspecific losses, for example, the loss of a finger. Theselosses invariably include the upper and lower extremi-ties and may also include an eye. Most state schedulesalso include the loss of hearing in one or both ears.Injuries to the spine that are permanently disablingare typically not scheduled, nor are injuries to inter-nal organs, head injuries, and occupational diseases.
For unscheduled conditions, the approaches usedcan be categorized into four methods:
■ An impairment-based approach, used in 19states, is most common. In approximately 14of those states, the worker with an unscheduledpermanent partial disability receives a benefitbased entirely on the degree of impairment.Any future earnings losses of the worker are notconsidered.
■ A loss-of-earning-capacity approach is used in 13states. This approach links the benefit to theworker’s ability to earn or to compete in thelabor market and involves a forecast of the eco-nomic impact that the impairment will have onthe worker’s future earnings.
■ In a wage-loss approach, used in 10 states, bene-fits are paid for the actual or ongoing losses
that a worker incurs. In some states, the perma-nent partial disability benefit begins after maxi-mum medical improvement has been achieved.In some cases permanent disability benefits cansimply be the extension of temporary disabilitybenefits until the disabled worker returns toemployment.
■ In a bifurcated approach used in nine jurisdic-tions, the benefit for a permanent disabilitydepends on the worker’s employment status atthe time that the worker’s condition is assessed,after the condition has stabilized. If the workerhas returned to employment with earnings ator near the pre-injury level, the benefit is basedon the degree of impairment. If the worker hasnot returned to employment, or has returnedbut at lower wages than before the injury, thebenefit is based on the degree of lost earningcapacity.
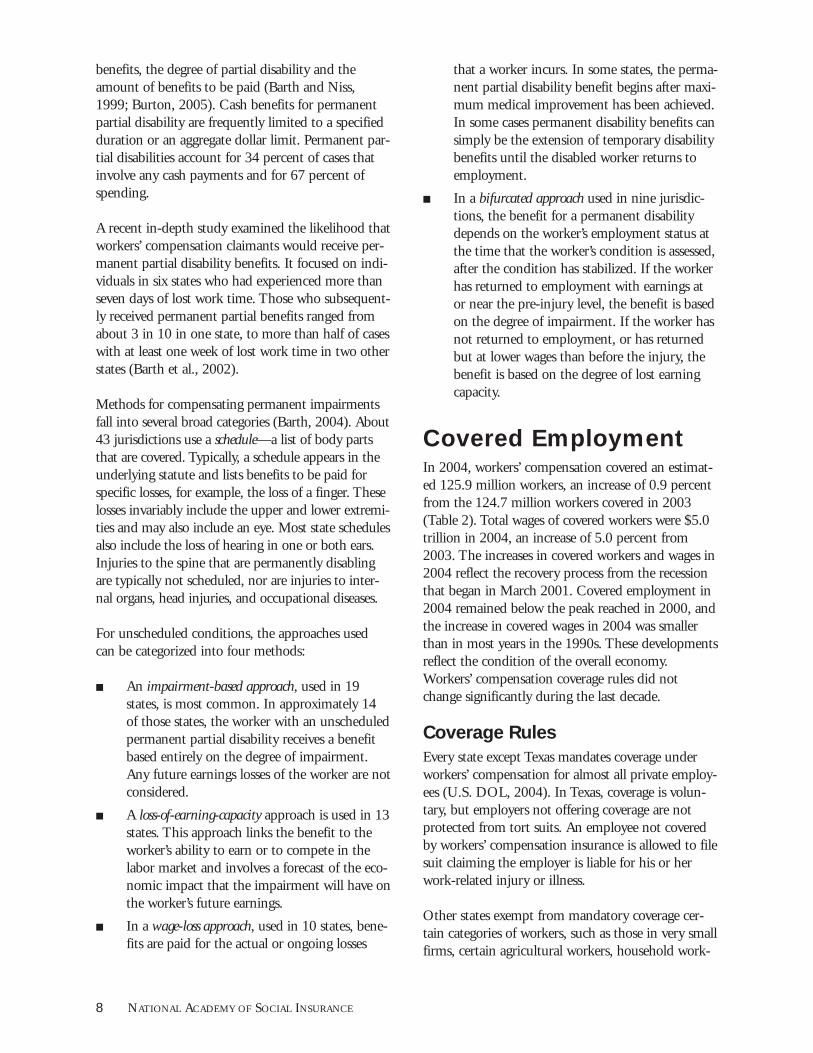
Covered EmploymentIn 2004, workers’ compensation covered an estimat-ed 125.9 million workers, an increase of 0.9 percentfrom the 124.7 million workers covered in 2003(Table 2). Total wages of covered workers were $5.0trillion in 2004, an increase of 5.0 percent from2003. The increases in covered workers and wages in2004 reflect the recovery process from the recessionthat began in March 2001. Covered employment in2004 remained below the peak reached in 2000, andthe increase in covered wages in 2004 was smallerthan in most years in the 1990s. These developmentsreflect the condition of the overall economy.Workers’ compensation coverage rules did notchange significantly during the last decade.
Coverage Rules
Every state except Texas mandates coverage underworkers’ compensation for almost all private employ-ees (U.S. DOL, 2004). In Texas, coverage is volun-tary, but employers not offering coverage are notprotected from tort suits. An employee not coveredby workers’ compensation insurance is allowed to filesuit claiming the employer is liable for his or herwork-related injury or illness.
Other states exempt from mandatory coverage cer-tain categories of workers, such as those in very smallfirms, certain agricultural workers, household work-
8 NATIONAL ACADEMY OF SOCIAL INSURANCE

ers, employees of charitable or religious organiza-tions, or employees of some units of state and localgovernment. Employers with fewer than three work-ers are exempt from mandatory workers’ compensa-tion coverage in Arkansas, Colorado, Georgia,Michigan, New Mexico, North Carolina, Virginia,and Wisconsin. Employers with fewer than fourworkers are exempt in Florida and South Carolina.Those with fewer than five employees are exempt inAlabama, Mississippi, Missouri, and Tennessee.
The rules for agricultural workers vary among states.In sixteen states (in addition to Texas), farm employ-ers are exempt from mandatory workers’ compensa-tion coverage altogether. In other states, coverage iscompulsory for some or all farm employers.
Method for Estimating Coverage
Because no national system exists for counting work-ers covered by workers’ compensation, the numberof covered workers and their covered wages must be
estimated. The Academy’s methods for estimatingcoverage are described in Appendix A. In brief, westart with the number of workers and total wages ineach state that are covered by unemployment insur-ance (UI). About 96 or 97 percent of all U.S. wageand salary workers are covered by UI (NASI, 2002).We subtract from UI coverage the estimates of theworkers and wages that are not required to be cov-ered by workers’ compensation because of exemp-tions for small firms and farm employers andbecause coverage for employers in Texas is voluntary.
Using these methods we estimate that in 2004, 97.4percent of all UI–covered workers and wages werecovered by workers’ compensation. They account forabout 96 percent of all wage and salary workers inthe United States, self-employed persons are not cov-ered by Unemployment Insurance or by workers’compensation.
Workers’ Compensation: Benefits, Coverage, and Costs, 2004 • 9
Table 2
Number of Workers Covered under Workers' Compensation Programs and Total Covered Wages,1989–2004
Total Workers Total Wages Year (in thousands) Percent Change (in billions) Percent Change
1989 103,900 $ 2,3471990 105,500 1.5 2,442 4.01991 103,700 -1.7 2,553 4.51992 104,588 0.9 2,711 6.21993 106,503 1.8 2,810 3.71994 109,582 2.9 2,955 5.21995 112,377 2.6 3,132 6.01996 114,773 2.1 3,328 6.21997 118,145 2.9 3,591 7.91998 121,485 2.8 3,885 8.21999 124,349 2.4 4,151 6.82000 127,141 2.2 4,495 8.32001 126,972 -0.1 4,604 2.42002 125,603 -1.1 4,615 0.22003 124,685 -0.7 4,717 2.22004 125,863 0.9 4,953 5.0
Source: National Academy of Social Insurance estimates. See Appendix A.
10 NATIONAL ACADEMY OF SOCIAL INSURANCE
Tab
le 3
Num
ber
of W
orke
rs C
over
ed b
y W
orke
rs’ C
ompe
nsat
ion
and
Tota
l Cov
ered
Wag
es, B
y St
ate,
200
0- 2
004
Cov
ered
Wor
kers
(in
tho
usan
ds)
Cov
ered
Wag
es (
in m
illio
ns)
2003
-200
4 20
03-2
004
2000
2001
2002
2003
2004
% C
hang
e20
0020
0120
0220
0320
04%
Cha
nge
Ala
bam
a1,
747
1,72
61,
704
1,69
81,
720
1.3
$49,
852
$51,
057
$52,
037
$53,
617
$56,
310
5.0
Ala
ska
259
266
270
275
279
1.6
8,85
69,
391
9,78
610
,098
10,5
824.
8
Ari
zona
2,17
22,
195
2,19
12,
222
2,30
43.
770
,313
72,7
4773
,890
77,1
1883
,541
8.3
Ark
ansa
s1,
074
1,07
11,
064
1,06
11,
073
1.2
27,9
5228
,874
29,5
1530
,246
32,0
145.
8
Cal
iforn
ia14
,591
14,7
2814
,588
14,5
5314
,706
1.0
599,
367
606,
472
601,
288
616,
879
653,
145
5.9
Col
orad
o2,
132
2,14
82,
101
2,06
42,
074
0.5
78,6
9280
,930
79,0
9379
,589
82,6
433.
8
Con
nect
icut
1,65
11,
644
1,62
71,
605
1,61
10.
475
,132
77,2
5476
,191
77,5
1982
,095
5.9
Del
awar
e40
040
039
639
640
62.
614
,612
15,3
3115
,654
16,1
6617
,209
6.4
Dist
rict o
f Col
umbi
a45
445
245
845
946
71.
822
,539
23,7
8824
,634
25,5
6027
,418
7.3
Flor
ida
6,66
46,
754
6,76
56,
840
7,03
92.
920
1,92
321
1,24
421
7,17
822
7,17
224
5,13
37.
9
Geo
rgia
3,69
13,
682
3,62
43,
597
3,66
31.
912
5,32
912
8,31
312
8,12
113
0,12
913
7,08
85.
3
Haw
aii
523
527
528
538
554
2.9
15,5
4515
,994
16,6
9417
,564
18,8
937.
6
Idah
o55
055
855
856
257
82.
815
,054
15,3
0115
,515
15,8
9016
,988
6.9
Illin
ois
5,84
05,
793
5,67
95,
606
5,61
10.
122
1,43
722
5,54
922
4,32
422
6,18
023
5,91
54.
3
Indi
ana
2,88
22,
822
2,78
52,
774
2,80
21.
088
,942
89,1
7890
,220
91,9
9896
,522
4.9
Iow
a1,
423
1,41
01,
393
1,38
51,
404
1.4
39,4
9040
,418
41,0
3842
,247
44,7
706.
0
Kan
sas
1,27
91,
286
1,27
01,
251
1,26
31.
037
,198
38,4
1138
,730
38,9
5340
,854
4.9
Ken
tuck
y1,
720
1,69
61,
676
1,67
31,
688
0.9
49,1
7850
,503
51,3
6052
,803
55,4
235.
0
Loui
sian
a1,
832
1,83
51,
812
1,82
01,
831
0.6
50,5
4252
,870
53,9
5655
,315
57,6
484.
2
Mai
ne57
757
957
757
758
31.
015
,715
16,4
4516
,887
17,4
5018
,282
4.8
Mar
ylan
d2,
277
2,29
52,
299
2,30
62,
332
1.1
80,6
7685
,056
87,5
1490
,465
95,7
695.
9
Mas
sach
uset
ts3,
218
3,22
23,
150
3,08
93,
087
-0.1
142,
548
144,
680
141,
163
142,
621
150,
515
5.5
Mic
higa
n4,
428
4,32
54,
242
4,17
54,
152
-0.6
163,
500
161,
252
161,
193
163,
935
166,
930
1.8
Min
neso
ta2,
572
2,57
62,
552
2,54
22,
567
1.0
90,8
1893
,929
95,2
0697
,750
103,
238
5.6

Workers’ Compensation: Benefits, Coverage, and Costs, 2004 • 11
Mis
sissi
ppi
1,05
61,
033
1,02
71,
020
1,02
60.
626
,207
26,3
6426
,900
27,6
2928
,730
4.0
Mis
sour
i2,
501
2,48
22,
457
2,44
72,
466
0.8
77,8
7279
,804
80,6
3681
,917
85,0
743.
9
Mon
tana
366
371
374
380
390
2.7
8,63
79,
102
9,48
29,
935
10,5
426.
1
Neb
rask
a99
51,
021
850
850
866
1.8
23,5
9624
,190
24,7
9225
,571
26,9
905.
6
Nev
ada
865
866
1,02
71,
062
1,12
76.
132
,084
33,7
8434
,677
37,2
5541
,514
11.4
New
Ham
pshi
re59
860
259
559
660
51.
520
,695
21,2
6721
,418
22,1
3523
,566
6.5
New
Jer
sey
3,80
93,
809
3,79
23,
787
3,81
20.
616
6,15
016
8,39
117
0,80
217
4,95
118
2,51
24.
3
New
Mex
ico
660
673
680
688
703
2.1
17,7
2518
,801
19,4
4120
,187
21,4
206.
1
New
Yor
k8,
325
8,28
78,
135
8,08
98,
142
0.7
374,
687
387,
229
375,
634
381,
651
405,
898
6.4
Nor
th C
arol
ina
3,71
03,
660
3,60
73,
577
3,63
31.
611
4,72
911
6,57
311
7,18
011
9,09
112
5,39
95.
3
Nor
th D
akot
a29
830
030
030
230
92.
27,
249
7,59
37,
843
8,22
18,
811
7.2
Ohi
o5,
426
5,35
25,
252
5,20
25,
214
0.2
175,
162
176,
803
178,
285
181,
304
188,
314
3.9
Okl
ahom
a1,
404
1,41
71,
393
1,36
61,
382
1.2
37,0
6138
,877
38,9
9139
,576
41,4
424.
7
Ore
gon
1,57
71,
567
1,54
31,
533
1,56
52.
151
,322
51,5
9851
,496
52,2
9955
,191
5.5
Penn
sylv
ania
5,44
45,
444
5,39
65,
364
5,39
00.
518
4,03
018
9,06
519
1,74
319
6,85
820
6,10
44.
7
Rho
de I
sland
437
439
439
443
447
0.9
14,0
9614
,563
15,0
5815
,906
16,5
764.
2
Sout
h C
arol
ina
1,72
91,
698
1,67
71,
679
1,69
71.
148
,345
49,3
0649
,868
51,1
5453
,504
4.6
Sout
h D
akot
a35
335
435
235
335
81.
58,
592
8,88
19,
101
9,41
39,
930
5.5
Tenn
esse
e2,
516
2,47
92,
455
2,45
32,
494
1.7
76,0
6577
,275
78,9
4881
,411
86,0
745.
7
Texa
s7,
573
7,70
57,
386
7,10
26,
949
-2.2
263,
100
276,
163
265,
805
260,
476
265,
326
1.9
Uta
h1,
011
1,01
71,
006
1,00
61,
037
3.1
29,1
0930
,124
30,2
3330
,732
32,7
426.
5
Ver
mon
t29
029
229
028
829
21.
48,
325
8,75
88,
896
9,14
89,
610
5.1
Vir
gini
a3,
202
3,21
63,
186
3,19
13,
268
2.4
110,
232
115,
570
115,
504
119,
804
128,
706
7.4
Was
hing
ton
2,63
72,
622
2,57
52,
583
2,62
51.
697
,245
97,5
1297
,585
99,8
2110
2,16
22.
3
Wes
t Vir
gini
a66
466
466
165
666
51.
417
,491
18,1
8718
,483
18,7
3819
,689
5.1
Wis
cons
in2,
646
2,63
02,
604
2,60
22,
626
1.0
80,9
1382
,627
84,1
9186
,579
90,8
124.
9
Wyo
min
g22
222
823
023
224
03.
65,
859
6,29
56,
564
6,83
37,
373
7.9
Tota
l non
-fed
eral
124,
269
124,
219
122,
602
121,
920
123,
123
1.0
4,36
1,78
74,
469,
716
4,47
0,74
04,
565,
857
$4,7
96,1
605.
0
Fede
ral e
mpl
oyee
s2,
871
2,75
32,
758
2,76
42,
740
-0.9
132,
731
134,
712
144,
329
150,
819
$158
,294
5.0
TO
TA
L12
7,14
112
6,97
212
5,36
012
4,68
512
5,86
30.
94,
494,
518
4,60
4,42
84,
615,
069
4,71
6,67
6$4
,953
,089
5.0
Sour
ce: N
atio
nal A
cade
my
of S
ocia
l Ins
uran
ce e
stim
ates
. See
App
endi
x A
.

Changes in State Coverage
Because workers’ compensation coverage rules didnot change between 2003 and 2004, differences ingrowth rates among states generally reflect changes inthe states’ overall employment and wages. In Texas,where workers’ compensation is voluntary foremployers, coverage declined from 84 percent ofworkers in 2001 to 76 percent in 2004 according tosurveys in Texas. Estimates for 2003-2004 in Table 3phase in this decline in Texas coverage (Appendix A).In other states, only Massachusetts and Michiganexperienced a decline in the number of coveredworkers due to decline in overall employment, otherjurisdictions experienced an increase in covered jobs
in 2004. With regard to wages covered under work-ers’ compensation, all jurisdictions registered increas-es in 2004 over 2003 (Table 3).
Benefit PaymentsWorkers’ compensation payments for medical treat-ment and cash benefits combined were $56.0 billionin 2004, an increase of 2.3 percent from $54.7 bil-lion in 2003 (Table 4). These are benefits paid to allworkers in a given year, regardless of the year theirinjuries occurred or their illnesses began. This mea-sure is known as calendar year paid benefits. That is,in 2004 $56.0 billion in benefits were paid for allworkers’ compensation cases, whether workers were
12 NATIONAL ACADEMY OF SOCIAL INSURANCE
Table 4
Workers’ Compensation Benefits, by Type of Insurer, 1987–2004 (in millions)
Percent Change Private State Self- PercentYeara Total in Total Carriers Funds Insured Federalb Medical Medical
1987 27,317 11.0 $15,453 $4,084 $5,082 $2,698 $9,912 36.31988 30,703 12.4 17,512 4,687 5,744 2,760 11,507 37.51989 34,316 11.8 19,918 5,205 6,433 2,760 13,424 39.11990 38,237 11.4 22,222 5,873 7,249 2,893 15,187 39.71991 42,170 10.3 24,515 6,713 7,944 2,998 16,832 39.91992 45,668 8.3 25,280 7,506 9,724 3,158 18,664 40.91993 45,330 -.7 24,129 7,400 10,623 3,178 18,503 40.81994 44,586 -1.6 22,306 7,587 11,527 3,166 17,194 38.61995 43,373 -2.7 21,145 7,893 11,232 3,103 16,733 38.61996 41,837 -3.5 20,392 7,603 10,775 3,066 16,567 39.61997 42,314 1.1 21,645 7,266 10,623 2,780 17,306 40.91998 43,278 2.3 22,966 7,241 10,203 2,868 18,121 41.91999 45,581 5.3 25,726 6,883 10,109 2,862 19,059 41.82000 47,695 4.6 26,866 7,422 10,449 2,957 20,927 43.92001 50,533 6.0 27,970 7,991 11,503 3,069 22,844 45.22002 53,309 5.5 28,783 9,327 12,046 3,154 24,480 45.92003 54,715 2.6 28,547 10,457 12,525 3,185 25,510 46.62004 55,968 2.3 28,346 11,044 13,321 3,256 26,099 46.6
(a) Estimated benefits paid under deductible provisions are included beginning in 1992.
(b) In all years, federal benefits includes those paid under the Federal Employees’ Compensation Act for civilian employeesand the portion of the Black Lung benefit program that is financed by employers and are paid through the federal BlackLung Disability Trust fund. In years before 1997, federal benefits also include the other part of the Black Lung programthat is financed solely by federal funds. In 1997–2003, federal benefits also include a portion of employer-financed bene-fits under the Longshore and Harbor Workers Compensation Act that are not reflected in state data—namely, benefitspaid by self-insured employers and by special funds under the LHWCA. See Appendix H for more information aboutfederal programs.
Source: National Academy of Social Insurance estimates. See Appendices B and H.

injured in 2004 or in a previous year, from 2003 to2004 share of total payments that were for medicalcare remained constant at 46.6 percent.
Method for Estimating Benefits
Our estimates of workers’ compensation benefitspaid are based on three main sources: responses tothe Academy’s questionnaire from state agencies,data from National Association of InsuranceCommissioners (NAIC), and data purchased fromA.M. Best, a private company that specializes in collecting insurance data and rating insurance companies.
The A.M. Best data used for this report show benefitspaid in each state for 2000 through 2004. Theyinclude information for all private carriers in everystate and for nineteen of the twenty-six state funds,but do not include any information about self-insuredemployers or about benefits paid under deductiblearrangements. Under deductible policies written byprivate carriers or state funds, the insurer pays all ofthe workers’ compensation benefits, but employers areresponsible for reimbursing the insurer for those bene-fits up to a specified deductible amount. Deductiblesmay be written into an insurance policy on a per-injury basis, or an aggregate basis, or a combinationof a per-injury basis with an aggregate cap. States varyin the maximum deductibles they allow. In return foraccepting a policy with a deductible, the employerpays a lower premium.
Appendix C summarizes the kinds of data each statereported. States had the most difficulty reportingamounts of benefits paid under deductible arrange-ments. The Academy’s methods for estimating thesebenefits are described in Appendix G. If states wereunable to report benefits paid by self-insuredemployers, these amounts had to be estimated; themethods for estimating self-insured benefits aredescribed in Appendix E. A detailed, state-by-stateexplanation of how the estimates in this report areproduced is in Sources and Methods: A Companion toWorkers’ Compensation: Benefits, Coverage, and Costs,2004 on the Academy’s website at www.nasi.org.
Sources of Insurance Coverage
Private insurance carriers remain the largest source ofworkers’ compensation benefits. In 2004, theyaccounted for 50.6 percent of benefits paid, a declinefrom 52.2 percent of total benefits in 2003 (Table
5). Private carriers are allowed to sell workers’ com-pensation insurance in all but five states that haveexclusive state funds—Ohio, North Dakota,Washington, West Virginia, and Wyoming.
When benefits paid under deductible arrangementsare excluded, privately insured benefits account for36.9 percent of total benefits paid. This is the lowestshare for privately insured benefits in this time series.For the first time privately insured benefits paid are asmaller share of total benefits than are benefits paiddirectly by employers (38.4 percent) through self-insurance (23.8 percent) and employer paiddeductibles (14.6 percent) combined (Table 5).Employers are allowed to self-insure for workers’compensation in all states except North Dakota andWyoming, which require all employers to obtaininsurance from the state fund. In other states,employers can self-insure their risk for workers’ com-pensation benefits if they prove they have the finan-cial capacity to do so. Many large employers chooseto self-insure. Some states permit groups of employ-ers in the same industry to self-insure through groupself-insurance. Benefits provided under group self-insurance are included with the self-insured benefitsin this report.
The share of benefits provided by state funds rose to19.7 percent in 2004, from 19.1 percent in 2003. Atotal of twenty-six states have state funds that pro-vide workers’ compensation insurance. They includethe five exclusive state fund states and twenty-oneothers. In general, state funds are established by anact of the state legislature, have at least part of theirboard appointed by the governor, are usually exemptfrom federal taxes, and typically serve as the insurerof last resort—that is, they do not deny insurancecoverage to employers who have difficulty purchas-ing it privately. Not all state funds meet all these cri-teria, however. In some cases, it is not altogetherclear whether an entity is a state fund or a privateinsurer, or whether it is a state fund or a state entitythat is self-insuring workers’ compensation benefitsfor its own employees. Consequently, the Academy’sexpert panel decided to classify as state funds alltwenty-six entities that are members of the AASCIF(American Association of State CompensationInsurance Funds) (AASCIF, 2006). This includes theSouth Carolina fund, which is the required insurerfor state employees and is available to cities andcounties to insure their employees, but does notinsure private employers.
Workers’ Compensation: Benefits, Coverage, and Costs, 2004 • 13
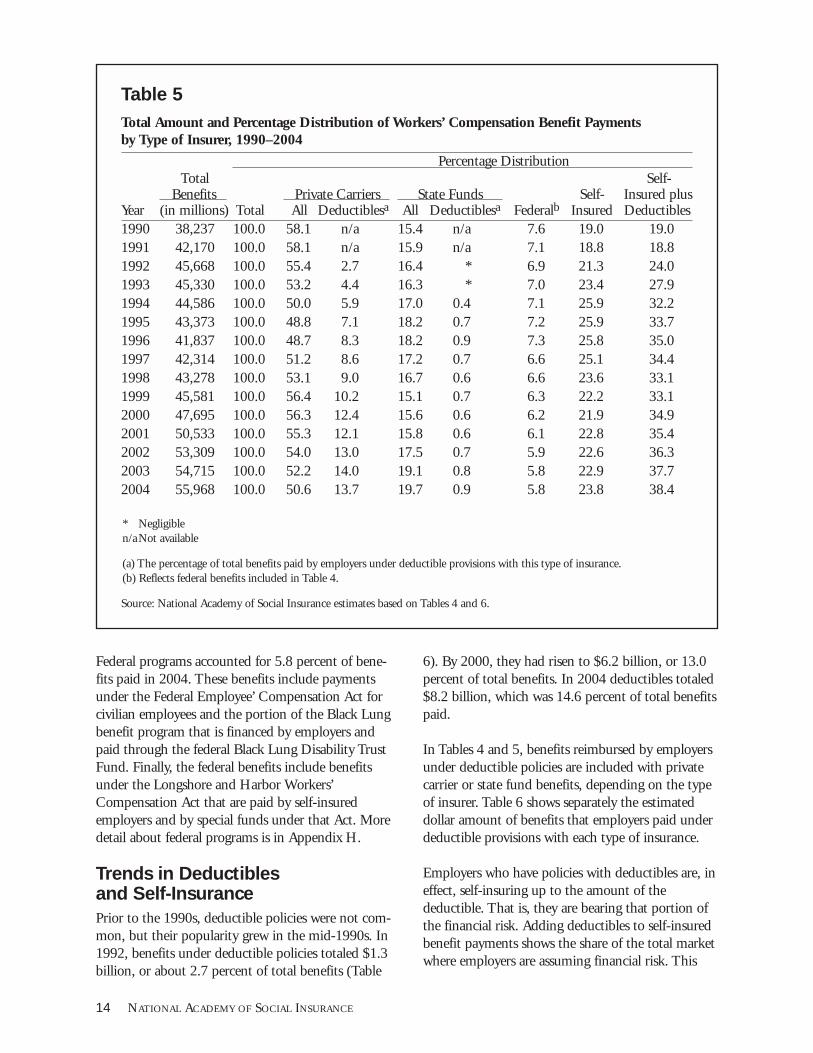
Federal programs accounted for 5.8 percent of bene-fits paid in 2004. These benefits include paymentsunder the Federal Employee’ Compensation Act forcivilian employees and the portion of the Black Lungbenefit program that is financed by employers andpaid through the federal Black Lung Disability TrustFund. Finally, the federal benefits include benefitsunder the Longshore and Harbor Workers’Compensation Act that are paid by self-insuredemployers and by special funds under that Act. Moredetail about federal programs is in Appendix H.
Trends in Deductibles and Self-Insurance
Prior to the 1990s, deductible policies were not com-mon, but their popularity grew in the mid-1990s. In1992, benefits under deductible policies totaled $1.3billion, or about 2.7 percent of total benefits (Table
6). By 2000, they had risen to $6.2 billion, or 13.0percent of total benefits. In 2004 deductibles totaled$8.2 billion, which was 14.6 percent of total benefitspaid.
In Tables 4 and 5, benefits reimbursed by employersunder deductible policies are included with privatecarrier or state fund benefits, depending on the typeof insurer. Table 6 shows separately the estimateddollar amount of benefits that employers paid underdeductible provisions with each type of insurance.
Employers who have policies with deductibles are, ineffect, self-insuring up to the amount of thedeductible. That is, they are bearing that portion ofthe financial risk. Adding deductibles to self-insuredbenefit payments shows the share of the total marketwhere employers are assuming financial risk. This
14 NATIONAL ACADEMY OF SOCIAL INSURANCE
Table 5
Total Amount and Percentage Distribution of Workers’ Compensation Benefit Paymentsby Type of Insurer, 1990–2004
Percentage DistributionTotal Self-
Benefits Private Carriers State Funds Self- Insured plusYear (in millions) Total All Deductiblesa All Deductiblesa Federalb Insured Deductibles1990 38,237 100.0 58.1 n/a 15.4 n/a 7.6 19.0 19.01991 42,170 100.0 58.1 n/a 15.9 n/a 7.1 18.8 18.81992 45,668 100.0 55.4 2.7 16.4 * 6.9 21.3 24.01993 45,330 100.0 53.2 4.4 16.3 * 7.0 23.4 27.91994 44,586 100.0 50.0 5.9 17.0 0.4 7.1 25.9 32.21995 43,373 100.0 48.8 7.1 18.2 0.7 7.2 25.9 33.71996 41,837 100.0 48.7 8.3 18.2 0.9 7.3 25.8 35.01997 42,314 100.0 51.2 8.6 17.2 0.7 6.6 25.1 34.41998 43,278 100.0 53.1 9.0 16.7 0.6 6.6 23.6 33.11999 45,581 100.0 56.4 10.2 15.1 0.7 6.3 22.2 33.12000 47,695 100.0 56.3 12.4 15.6 0.6 6.2 21.9 34.92001 50,533 100.0 55.3 12.1 15.8 0.6 6.1 22.8 35.42002 53,309 100.0 54.0 13.0 17.5 0.7 5.9 22.6 36.32003 54,715 100.0 52.2 14.0 19.1 0.8 5.8 22.9 37.72004 55,968 100.0 50.6 13.7 19.7 0.9 5.8 23.8 38.4
* Negligiblen/aNot available
(a) The percentage of total benefits paid by employers under deductible provisions with this type of insurance. (b) Reflects federal benefits included in Table 4.
Source: National Academy of Social Insurance estimates based on Tables 4 and 6.

share of total benefit payments rose from 19.0 per-cent in 1990 to 35.0 percent in 1996, and thenremained between 33 and 36 percent of total bene-fits through 2001. In 2004, this share increased to38.4 from the 2003 share of 37.7 percent of benefitpayments (Table 5).
The growth in self-insurance and in deductible poli-cies in the early 1990s, as well as the down-turn inself-insurance later in the 1990s, probably reflectsdynamics of the insurance market that altered therelative cost to employers of purchasing privateinsurance vis-à-vis self insuring.
In the late 1980s and early 1990s, when workers’compensation benefits and costs rose rapidly, manystates had administrative pricing systems that set thepremium levels that insurance companies couldcharge, and often states limited the rate of increase inpremiums. As a result, premiums did not rise as fastas costs. Growing numbers of employers were not
able to buy insurance in the voluntary marketbecause insurers did not want to sell insurance atpremiums that were less than their expected costs.
Because states require that employers have insurance,they provide ways for high-cost employers to buy it.In some states, the state fund insures all applicants.Some states use a residual market for high-riskemployers and then require that insurers underwritea share of the residual market as a condition fordoing business in the state. During the late 1980sand early 1990s, some states set premiums in theresidual market that did not recognize the highercost associated with residual market employers. Tocover the gap between premiums charged to employ-ers in the residual market and their actual losses,residual market pools assessed fees on insurancecompanies based on the insurer’s share of aggregatepremiums written in the voluntary market in thestate. (Similar fees generally were not assessed onself-insured employers in the state. Also lowering
Workers’ Compensation: Benefits, Coverage, and Costs, 2004 • 15
Table 6
Estimated Employer-Paid Benefits under Deductible Provisions for Workers’ Compensation, (in millions), 1992–2004
Deductibles as a % ofYear Total Private Carriers State Funds Total Benefits
1992 $1,250 $1,250 * 2.71993 2,027 2,008 $ 19 4.51994 2,834 2,645 189 6.41995 3,384 3,060 324 7.81996 3,859 3,492 367 9.21997 3,928 3,650 278 9.31998 4,114 3,873 241 9.51999 4,961 4,661 300 10.92000 6,201 5,931 270 13.02001 6,411 6,130 281 12.72002 7,326 6,935 391 13.72003 8,088 7,639 450 14.82004 8,157 7,659 497 14.6
* Negligible
Note: Data on deductible benefits were available from five states. Five states do not allow policies with deductibles. For thirteen states data were computed by subtracting various components from total benefit figures provided. For the othertwenty-seven states and the District of Columbia, deductible benefits were computed using a ratio of the manual equivalentpremiums.

premiums through the use of high deductibles couldreduce assessments.) As costs rose during the late1980s, more employers ended up in the residualmarket, residual market losses grew, and rising feesassessed on insurers drove up the price of premiumscharged to employers who were not in the residualmarket.
The combination of rising costs and the structure ofadministered prices in the private insurance marketencouraged employers to set up self-insured plans,which did not share in assessments to cover the costof the residual market. Similarly, insurers andemployers turned to hybrid plans that combine largedeductibles with private insurance as a way to lowertheir aggregate premiums, and consequently, theirshare of assessments for the operating losses in theresidual market.
Declining workers’ compensation benefits and costsin the mid-1990s combined with a vibrant economyand high financial market returns enabled insurancecompanies to earn more from invested premiums.The combination of improved underwriting resultsand higher returns on reserves led to high profits byhistorical standards within the workers’ compensa-tion insurance industry (Yates and Burton, 2005).These relatively high profits led to fierce underwrit-ing competition. Insurance companies began offer-ing multi-year guaranteed cost programs that lockedin low premium rates for employers, thus greatlyreducing the employers’ cost and risk. Tax advantagesinherent in the purchase of insurance also made itattractive—that is, employers can take an immediatetax deduction for premiums they pay for insurance,while when they self-insure, tax deductions accrueonly later as they pay claims. These factors led to ashift away from self-insurance in favor of the pur-chase of insurance later in the 1990s.
Since 1999, the share of benefits paid directly byemployers (through self-insurance and largedeductibles combined) has been rising. In 2004, theshare of benefits paid by employers reached 38.4 per-cent, the highest recorded in this data series. For thefirst time, the share of benefits paid by employers(through self-insurance or deductibles) exceeded theshare paid by private carriers excluding deductibles,which was 36.9 percent in 2004 (Table 5).
Changes in State Benefits
On a national level, total benefits (cash plus medical)were 2.3 percent higher in 2004 than in 2003.Focusing only on national growth conceals a greatdeal of variation among states. Table 7 shows annualchanges in state benefit payments between 2000 and2004.
In nine states: Benefits declined between 2003 and2004. Alabama, Delaware, Florida, Hawaii,Massachusetts, Nebraska, New Hampshire, Texas,and West Virginia. The rest of the states showed anincrease in benefits.
Benefits vary within a state from year to year formany reasons, including:
■ Changes in workers' compensation statutes,new court rulings, or new administrative procedures;
■ Changes in the mix of occupations or indus-tries, because jobs differ in their rates of injuryand illness;
■ Fluctuations in employment, because morepeople working means more people at risk of ajob-related illness or injury;
■ Changes in wage rates to which benefit levelsare linked;
■ Variations in health care practice patternsacross states, which influence the costs of medical care;
■ Fluctuations in the number and severity ofinjuries and illnesses for other reasons (forexample, in a small state, one industrial acci-dent involving many workers in a particularyear can show up as a noticeable increase instatewide benefit payments); and
■ Changes in reporting procedures (for example,as state agencies update their record keepingsystems, the type of data they are able to reportoften changes, and new legislation can alsoaffect the data a state is able to provide).
Medical Payments in States
The share of benefits for medical care varies amongstates. In 2004 the share of benefit spending formedical care ranged from lows of less than 40 per-cent—in the District of Columbia, Connecticut,
16 NATIONAL ACADEMY OF SOCIAL INSURANCE
Hawaii, Massachusetts, Michigan, New York, RhodeIsland and Washington—to highs of over 60 percentin Alabama, Arizona, Arkansas, Indiana, SouthDakota, Texas, and Utah (Table 8). Many factors ina state can influence the relative share of benefits formedical care as opposed to cash wage-replacement orsurvivor benefits. Among them are:
■ Different levels of earnings replacement provid-ed by cash benefits, which mean that, all elsebeing equal, states with more generous cashbenefits have a lower share of benefits used formedical care;
■ Differences in medical costs, medical practices,and the role of workers’ compensation pro-grams in regulating allowable medical costs;
■ Differences in waiting periods for cash benefitsand in statutes determining permanent disabili-ty awards; and
■ The industry-mix in each state, which influ-ences the types of illnesses and injuries thatoccur, and thus the level of medical costs.
Some states were not able to report the portion oftheir total benefits that were for medical care. Inthose cases, medical benefits were estimated based oninformation from the National Council onCompensation Insurance and from other states.These states are footnoted in Table 8. Methods forestimating medical benefits are described inAppendix F.
In twenty-two jurisdictions medical benefits rosefaster than cash benefits. In three states, medical andcash benefits increased at the same rates. In fivestates, medical benefits rose but cash benefits fell. Incontrast, in nine states cash benefits to workers grewfaster than medical payments. In six states, cash ben-efits rose but medical benefits actually decreased.Finally, in five states, cash and medical benefitsdecreased, which included Delaware where they fellat the same rates. In Ohio, medical and cash benefitsdid not change from 2003 (Table 9).
State Benefits Relative to Wages
One way to standardize state benefit payments totake account of states’ differing population sizes is todivide each state’s benefits by the number of workerscovered by the state’s workers’ compensation pro-
gram. A second way is to divide total benefits bytotal wages of covered workers. The latter takesaccount of both the number of workers and prevail-ing wage levels in the state. The measure of benefitsas a percent of covered wages helps show whetherlarge growth in benefits payments may be due togrowth in the state’s population of covered workersand covered payroll. Benefits per $100 of coveredpayroll in 2000 through 2004 are shown in Table10. In 2004, employment began to recover from the2001 recession. As new jobs were created, coveredpayroll rose by 5.0 percent between 2003 and 2004(Table 3). In eight jurisdictions covered payroll rosemore than seven percentage points—Arizona,District of Columbia, Florida, Hawaii, Nevada,North Dakota, Virginia and Wyoming. Consequent-ly, when benefits are standardized relative to coveredpayroll, the state patterns of change are somewhatdifferent from those revealed by looking only at dol-lar changes in benefits.
While benefit payments that are standardized relativeto wages in a state provide a useful perspective forlooking at changes within particular states over time,the data do not provide meaningful comparisons ofthe adequacy of benefits across states. Measures ofbenefit adequacy would compare benefits injuredworkers received with their actual wage loss. A statewith relatively high payments as indicated in Table10 may in fact be replacing a relatively low portionof injured workers’ actual earnings losses.
Alternatively, a state with relatively low benefits asindicated in Table 10 may be replacing a relativelyhigh portion of actual earnings losses. By the sametoken, these figures do not show the comparativecost to employers of locating their business in onestate versus another. Some reasons for cautioningagainst using these data to compare the adequacy ofbenefits for workers or the costs to employers acrossstates are set out below.
Caveats on comparing benefit adequacy acrossstates. As discussed in the Academy’s study panelreport titled Adequacy of Earnings Replacement inWorkers’ Compensation Programs (Hunt, 2004), anappropriate study of adequacy compares the benefitsdisabled workers actually receive with the wages theylose because of their injuries or occupational diseases.Such data are not available on a consistent basisacross states. Aggregate benefits relative to aggregate
Workers’ Compensation: Benefits, Coverage, and Costs, 2004 • 17

18 NATIONAL ACADEMY OF SOCIAL INSURANCE
Tab
le 7
Wor
kers
' Com
pens
atio
n B
enef
its
by S
tate
, 200
0–20
04(i
n th
ousa
nds)
Stat
e20
0020
0120
0220
0320
0420
00-2
001
2001
-200
220
02-2
003
2003
-200
420
00-2
004
Ala
bam
a2$5
29,1
89$5
62,7
73$5
65,2
64$5
80,1
84$5
75,6
976.
30.
42.
6-0
.88.
8A
lask
a213
9,37
816
3,11
118
0,04
618
4,37
919
4,19
517
.010
.42.
45.
339
.3A
rizo
na1,
5,6
497,
955
436,
037
505,
278
531,
240
584,
750
-12.
415
.95.
110
.117
.4A
rkan
sas1
213,
969
217,
719
221,
474
225,
061
225,
689
1.8
1.7
1.6
0.3
5.5
Cal
iforn
ia2,
69,
449,
145
10,0
82,5
8011
,582
,431
12,4
03,7
2912
,459
,638
6.7
14.9
7.1
0.5
31.9
Col
orad
o1,5
,681
0,30
156
6,35
476
0,95
875
7,04
183
4,59
4-3
0.1
34.4
-0.5
10.2
3.0
Con
nect
icut
1,5
638,
435
641,
341
675,
895
674,
747
684,
930
0.5
5.4
-0.2
1.5
7.3
Del
awar
e1,5
,713
7,73
713
8,37
115
2,93
316
0,26
415
8,19
00.
510
.54.
8-1
.314
.8D
istric
t of C
olum
bia1
,5,7
85,9
0991
,148
93,9
6089
,108
98,4
436.
13.
1-5
.210
.514
.6Fl
orid
a1,5
2,57
6,87
53,
033,
955
2,67
8,08
22,
811,
302
2,75
9,71
217
.7-1
1.7
5.0
-1.8
7.1
Geo
rgia
1,5,
796
4,99
51,
029,
374
974,
661
1,06
1,96
91,
127,
654
6.7
-5.3
9.0
6.2
16.9
Haw
aii2
,623
1,35
924
8,10
026
7,82
727
4,92
227
1,29
07.
28.
02.
6-1
.317
.3Id
aho1
,5,6
,711
3,59
817
9,64
018
5,68
819
6,39
421
0,32
658
.13.
45.
87.
185
.1Ill
inoi
s1,4
,51,
948,
330
2,07
9,76
82,
123,
878
2,10
3,65
82,
213,
372
6.7
2.1
-1.0
5.2
13.6
Indi
ana1
,4,5
528,
901
524,
111
547,
305
559,
421
608,
717
-0.9
4.4
2.2
8.8
15.1
Iow
a1,4
,534
2,93
039
0,23
540
0,22
642
4,19
844
5,83
213
.82.
66.
05.
130
.0K
ansa
s1,5
322,
707
340,
483
341,
606
293,
473
365,
546
5.5
0.3
-14.
124
.613
.3K
entu
cky1
,4,5
,657
5,29
267
1,87
570
8,42
472
4,29
176
3,05
016
.85.
42.
25.
432
.6Lo
uisia
na1,
5,6
546,
544
587,
855
562,
812
585,
480
589,
209
7.6
-4.3
4.0
0.6
7.8
Mai
ne1
244,
714
245,
145
261,
734
239,
777
269,
917
0.2
6.8
-8.4
12.6
10.3
Mar
ylan
d1,5
,664
1,04
468
1,63
366
4,28
270
1,29
776
7,57
66.
3-2
.55.
69.
519
.7M
assa
chus
etts
1,5
800,
837
881,
417
902,
840
1,05
7,17
51,
045,
747
10.1
2.4
17.1
-1.1
30.6
Mic
higa
n21,
474,
058
1,47
7,98
61,
512,
457
1,47
6,85
01,
517,
386
0.3
2.3
-2.4
2.7
2.9
Min
neso
ta3
797,
787
904,
451
921,
518
885,
006
933,
975
13.4
1.9
-4.0
5.5
17.1
Miss
issip
pi1,
529
2,67
728
4,72
929
0,37
829
1,01
430
5,51
6-2
.72.
00.
25.
04.
4M
issou
ri2
779,
786
958,
708
1,11
5,83
21,
080,
870
1,11
9,87
122
.916
.4-3
.13.
643
.6M
onta
na2
154,
797
179,
613
177,
877
200,
857
211,
059
16.0
-1.0
12.9
5.1
36.3
Neb
rask
a1,4
,522
9,64
424
7,61
628
2,84
429
0,41
928
3,14
87.
814
.22.
7-2
.523
.3N
evad
a232
3,56
730
9,32
132
4,59
732
6,55
635
7,93
7-4
.44.
90.
69.
610
.6N
ew H
amps
hire
1,4,
517
8,52
221
5,15
821
1,73
421
9,62
921
3,96
420
.5-1
.63.
7-2
.619
.9N
ew J
erse
y1,7
1,18
2,64
41,
255,
974
1,32
8,65
01,
379,
235
1,39
8,35
86.
25.
83.
81.
418
.2
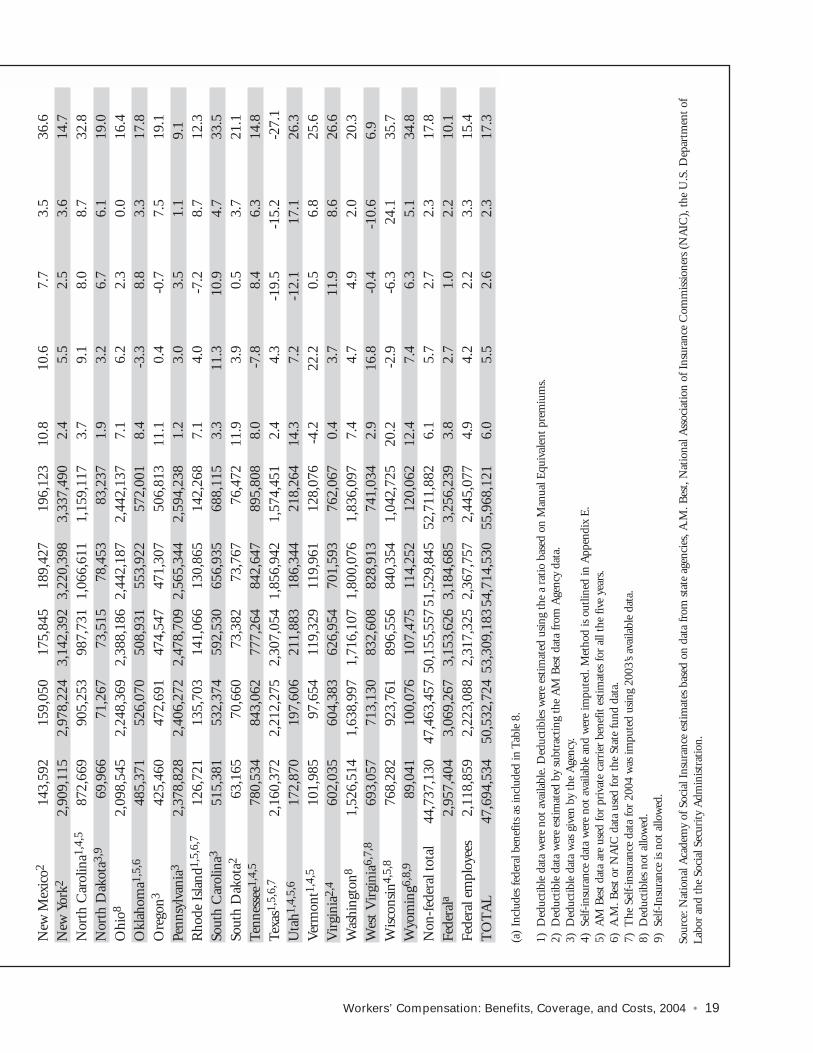
Workers’ Compensation: Benefits, Coverage, and Costs, 2004 • 19
New
Mex
ico2
143,
592
159,
050
175,
845
189,
427
196,
123
10.8
10.6
7.7
3.5
36.6
New
Yor
k22,
909,
115
2,97
8,22
43,
142,
392
3,22
0,39
83,
337,
490
2.4
5.5
2.5
3.6
14.7
Nor
th C
arol
ina1
,4,5
872,
669
905,
253
987,
731
1,06
6,61
11,
159,
117
3.7
9.1
8.0
8.7
32.8
Nor
th D
akot
a3,9
69,9
6671
,267
73,5
1578
,453
83,2
371.
93.
26.
76.
119
.0O
hio8
2,09
8,54
52,
248,
369
2,38
8,18
62,
442,
187
2,44
2,13
77.
16.
22.
30.
016
.4O
klah
oma1
,5,6
485,
371
526,
070
508,
931
553,
922
572,
001
8.4
-3.3
8.8
3.3
17.8
Ore
gon3
425,
460
472,
691
474,
547
471,
307
506,
813
11.1
0.4
-0.7
7.5
19.1
Penn
sylv
ania
32,
378,
828
2,40
6,27
22,
478,
709
2,56
5,34
42,
594,
238
1.2
3.0
3.5
1.1
9.1
Rho
de I
sland
1,5,
6,7
126,
721
135,
703
141,
066
130,
865
142,
268
7.1
4.0
-7.2
8.7
12.3
Sout
h C
arol
ina3
515,
381
532,
374
592,
530
656,
935
688,
115
3.3
11.3
10.9
4.7
33.5
Sout
h D
akot
a263
,165
70,6
6073
,382
73,7
6776
,472
11.9
3.9
0.5
3.7
21.1
Tenn
esse
e1,4
,578
0,53
484
3,06
277
7,26
484
2,64
789
5,80
88.
0-7
.88.
46.
314
.8Te
xas1
,5,6
,72,
160,
372
2,21
2,27
52,
307,
054
1,85
6,94
21,
574,
451
2.4
4.3
-19.
5-1
5.2
-27.
1U
tah1
,4,5
,617
2,87
019
7,60
621
1,88
318
6,34
421
8,26
414
.37.
2-1
2.1
17.1
26.3
Ver
mon
t1,4
,510
1,98
597
,654
119,
329
119,
961
128,
076
-4.2
22.2
0.5
6.8
25.6
Vir
gini
a2,4
602,
035
604,
383
626,
954
701,
593
762,
067
0.4
3.7
11.9
8.6
26.6
Was
hing
ton8
1,52
6,51
41,
638,
997
1,71
6,10
71,
800,
076
1,83
6,09
77.
44.
74.
92.
020
.3W
est V
irgi
nia6
,7,8
693,
057
713,
130
832,
608
828,
913
741,
034
2.9
16.8
-0.4
-10.
66.
9W
iscon
sin4,
5,8
768,
282
923,
761
896,
556
840,
354
1,04
2,72
520
.2-2
.9-6
.324
.135
.7W
yom
ing6
,8,9
89,0
4110
0,07
610
7,47
511
4,25
212
0,06
212
.47.
46.
35.
134
.8N
on-f
eder
al t
otal
44,7
37,1
3047
,463
,457
50,1
55,5
5751
,529
,845
52,7
11,8
826.
15.
72.
72.
317
.8Fe
dera
la2,
957,
404
3,06
9,26
73,
153,
626
3,18
4,68
53,
256,
239
3.8
2.7
1.0
2.2
10.1
Fede
ral e
mpl
oyee
s2,
118,
859
2,22
3,08
82,
317,
325
2,36
7,75
72,
445,
077
4.9
4.2
2.2
3.3
15.4
TO
TA
L47
,694
,534
50,5
32,7
2453
,309
,183
54,7
14,5
3055
,968
,121
6.0
5.5
2.6
2.3
17.3
(a)
Incl
udes
fede
ral b
enef
its a
s in
clud
ed in
Tab
le 8
.
1)D
educ
tible
dat
a w
ere
not
avai
labl
e. D
educ
tible
s w
ere
estim
ated
usin
g th
e a
ratio
bas
ed o
n M
anua
l Equ
ival
ent
prem
ium
s.2)
Ded
uctib
le d
ata
wer
e es
timat
ed b
y su
btra
ctin
g th
e A
M B
est
data
from
Age
ncy
data
.3)
Ded
uctib
le d
ata
was
giv
en b
y th
e A
genc
y.4)
Self-
insu
ranc
e da
ta w
ere
not
avai
labl
e an
d w
ere
impu
ted.
Met
hod
is ou
tline
d in
App
endi
x E
.5)
AM
Bes
t da
ta a
re u
sed
for
priv
ate
carr
ier
bene
fit e
stim
ates
for
all t
he fi
ve y
ears
.6)
A.M
. Bes
t or
NA
IC d
ata
used
for
the
Stat
e fu
nd d
ata.
7)T
he S
elf-
insu
ranc
e da
ta fo
r 20
04 w
as im
pute
d us
ing
2003
’s av
aila
ble
data
.8)
Ded
uctib
les
not
allo
wed
.9)
Self-
Insu
ranc
e is
not
allo
wed
.
Sour
ce: N
atio
nal A
cade
my
of S
ocia
l Ins
uran
ce e
stim
ates
bas
ed o
n da
ta fr
om s
tate
age
ncie
s, A
.M. B
est,
Nat
iona
l Ass
ocia
tion
of I
nsur
ance
Com
miss
ione
rs (
NA
IC),
the
U.S
. Dep
artm
ent
ofLa
bor
and
the
Soci
al S
ecur
ity A
dmin
istra
tion.

20 NATIONAL ACADEMY OF SOCIAL INSURANCE
Tab
le 8
Wor
kers
’ Com
pens
atio
n B
enef
its
by T
ype
of I
nsur
er a
nd M
edic
al B
enef
its,
by
Stat
e, 2
004
(in
thou
sand
s)
Stat
eTo
tal
Priv
ate
Car
rier
sSt
ate
Fund
s Se
lf-In
sure
dbM
edic
alPe
rcen
t M
edic
al
Ala
bam
a$
575,
697
$ 27
7,58
5$
298,
112
$ 35
7,73
962
.1c
Ala
ska
194,
195
142,
286
51,9
1010
8,34
855
.8c
Ari
zona
584,
750
185,
882
295,
598
103,
270
375,
591
64.2
c
Ark
ansa
s22
5,68
916
0,64
265
,047
136,
946
60.7
c
Cal
iforn
ia12
,459
,638
5,56
2,02
03,
202,
628
3,69
4,99
06,
072,
398
48.7
Col
orad
o83
4,59
427
1,25
341
6,61
814
6,72
340
6,93
048
.8c
Con
nect
icut
684,
930
433,
077
251,
853
271,
039
39.6
c
Del
awar
e15
8,19
011
3,94
844
,242
75,7
1147
.9d
Dis
tric
t of
Col
umbi
a98
,443
75,4
1523
,029
38,0
8938
.7c
Flor
ida
2,75
9,71
22,
219,
913
539,
799
1,63
7,27
059
.3c
Geo
rgia
1,12
7,65
476
8,47
835
9,17
653
8,76
447
.8c
Haw
aii
271,
290
150,
840
34,0
1586
,436
103,
900
38.3
c
Idah
o21
0,32
674
,896
122,
429
13,0
0112
4,27
759
.1c
Illin
ois
2,21
3,37
21,
646,
713
566,
659
1,07
3,61
448
.5c
Indi
ana
608,
717
489,
351
119,
366
413,
979
68.0
c
Iow
a44
5,83
233
7,82
410
8,00
823
0,11
751
.6c
Kan
sas
365,
546
241,
025
124,
522
200,
913
55.0
c
Ken
tuck
y76
3,05
042
2,50
672
,097
268,
447
411,
837
54.0
c
Loui
sian
a58
9,20
929
7,49
316
3,73
312
7,98
429
7,06
550
.4c
Mai
ne26
9,91
794
,800
84,2
6990
,847
113,
359
42.0
c
Mar
ylan
d76
7,57
644
8,75
619
6,09
712
2,72
331
7,62
141
.4c
Mas
sach
uset
ts1,
045,
747
900,
741
145,
006
358,
708
34.3
Mic
higa
n1,
517,
386
827,
277
690,
109
569,
855
37.6
Min
neso
ta93
3,97
557
6,23
212
0,48
823
7,25
545
5,24
848
.7M
issis
sippi
305,
516
172,
433
133,
083
170,
668
55.9
c
Miss
ouri
1,11
9,87
168
4,95
011
4,56
032
0,36
156
4,84
150
.4c
Mon
tana
211,
059
67,7
5710
3,55
939
,743
113,
201
53.6
c
Neb
rask
a28
3,14
821
8,11
365
,035
166,
863
58.9
c

Workers’ Compensation: Benefits, Coverage, and Costs, 2004 • 21
Nev
ada
357,
937
239,
619
118,
317
175,
796
49.1
c
New
Ham
pshi
re21
3,96
416
7,86
846
,096
119,
685
55.9
c
New
Jer
sey
1,39
8,35
81,
278,
746
119,
612
669,
265
47.9
dN
ew M
exic
o19
6,12
387
,748
32,1
7076
,205
115,
830
59.1
c
New
Yor
k3,
337,
490
1,73
2,84
177
5,14
682
9,50
31,
127,
178
33.8
Nor
th C
arol
ina
1,15
9,11
784
4,19
931
4,91
951
2,14
644
.2c
Nor
th D
akot
aa83
,237
260
82,9
7746
,870
56.3
Ohi
oa2,
442,
137
37,5
091,
935,
728
468,
900
1,14
1,08
246
.7O
klah
oma
572,
001
241,
921
212,
864
117,
216
263,
451
46.1
c
Ore
gon
506,
813
234,
700
228,
642
43,4
7227
0,25
353
.3c
Penn
sylv
ania
2,59
4,23
81,
803,
792
226,
158
564,
288
1,06
8,66
141
.2R
hode
Isla
nd14
2,26
840
,504
85,0
9616
,669
49,9
9035
.1c
Sout
h C
arol
ina
688,
115
461,
543
49,6
2917
6,94
431
8,81
146
.3c
Sout
h D
akot
a76
,472
72,7
493,
723
48,1
2262
.9c
Tenn
esse
e89
5,80
864
9,33
324
6,47
546
2,46
651
.6c
Texa
s1,
574,
451
991,
865
297,
235
285,
350
958,
631
60.9
c
Uta
h21
8,26
456
,281
122,
905
39,0
7714
9,24
068
.4c
Ver
mon
t12
8,07
610
6,19
221
,884
58,6
1145
.8c
Vir
gini
a76
2,06
755
4,39
720
7,67
041
9,95
555
.1c
Was
hing
tona
1,83
6,09
730
,766
1,32
3,41
048
1,92
163
6,21
134
.7W
est V
irgi
niaa
741,
034
7,31
762
9,61
710
4,10
035
4,66
547
.9d
Wis
cons
in1,
042,
725
840,
423
202,
302
499,
057
47.9
d
Wyo
min
ga12
0,06
23,
534
116,
528
57,4
6347
.9d
Non
-fed
eral
tot
al52
,711
,882
28,3
46,3
1011
,044
,194
13,3
21,3
7825
,228
,333
47.9
Fede
rale
3,25
6,23
987
0,87
226
.7Fe
dera
l em
ploy
ees
2,44
5,07
770
1,11
028
.7T
OT
AL
55,9
68,1
2126
,099
,205
46.6
(a)
Stat
es w
ith e
xclu
sive
fund
s (O
hio,
Nor
th D
akot
a, W
ashi
ngto
n, W
est V
irgi
nia,
and
Wyo
min
g) m
ay h
ave
smal
l am
ount
s of
ben
efits
pai
d in
the
pri
vate
car
rier
cat
egor
y. T
his
resu
lts fr
omtw
o so
urce
s: co
mpa
nies
with
gro
up p
olic
ies
that
ove
rlap
stat
es a
nd t
he fa
ct t
hat
som
e co
mpa
nies
incl
ude
exce
ss w
orke
rs’ c
ompe
nsat
ion
cove
rage
in t
heir
rep
orts
of w
orke
rs’ c
ompe
nsa-
tion
bene
fits
to A
.M. B
est.
(b)S
elf-
insu
ranc
e in
clud
es in
divi
dual
sel
f-in
sure
rs a
nd g
roup
sel
f-in
sura
nce.
(c)
Med
ical
per
cent
ages
bas
ed o
n da
ta p
rovi
ded
by N
CC
I, s
ee A
ppen
dix
F.
(d)M
edic
al p
erce
ntag
e ba
sed
on t
he w
eigh
ted
aver
age
of s
tate
s w
here
med
ical
dat
a w
ere
avai
labl
e, s
ee A
ppen
dix
F.(e
)Fe
dera
l ben
efits
incl
ude:
tho
se p
aid
unde
r th
e Fe
dera
l Em
ploy
ees’
Com
pens
atio
n A
ct fo
r ci
vilia
n em
ploy
ees;
the
port
ion
of t
he B
lack
Lun
g be
nefit
pro
gram
tha
t is
fina
nced
by
empl
oy-
ers;
and
a po
rtio
n of
ben
efits
und
er t
he L
ongs
hore
and
Har
bor
Wor
kers
’ Com
pens
atio
n A
ct t
hat
are
not
refle
cted
in s
tate
dat
a, n
amel
y, b
enef
its p
aid
by s
elf-
insu
red
empl
oyer
s an
d by
spec
ial f
unds
und
er t
he L
HW
CA
. See
App
endi
x H
for
mor
e in
form
atio
n ab
out
fede
ral p
rogr
ams.
Sour
ce: N
atio
nal A
cade
my
of S
ocia
l Ins
uran
ce e
stim
ates
bas
ed o
n da
ta r
ecei
ved
from
sta
te a
genc
ies,
the
U.S
. Dep
artm
ent
of L
abor
, A.M
. Bes
t, an
d th
e N
atio
nal C
ounc
il on
Com
pens
atio
n In
sura
nce.

22 NATIONAL ACADEMY OF SOCIAL INSURANCE
Tab
le 9
Med
ical
, Cas
h an
d To
tal B
enef
its,
by
stat
e, 2
003-
2004
a
(in
thou
sand
s)
2003
2004
2003
-200
4 Pe
rcen
t C
hang
eSt
ate
Med
ical
Cas
hTo
tal
Med
ical
Cas
hTo
tal
Med
ical
Cas
hTo
tal
Ala
bam
a36
4,61
621
5,56
858
0,18
435
7,73
921
7,95
857
5,69
7-1
.91.
1-0
.8A
lask
a10
1,41
782
,962
184,
379
108,
348
85,8
4819
4,19
56.
83.
55.
3A
rizo
na33
7,05
619
4,18
453
1,24
037
5,59
120
9,15
958
4,75
011
.47.
710
.1A
rkan
sas
139,
779
85,2
8222
5,06
113
6,94
688
,742
225,
689
-2.0
4.1
0.3
Cal
iforn
ia6,
329,
029
6,07
4,70
112
,403
,729
6,07
2,39
86,
387,
240
12,4
59,6
38-4
.15.
10.
5C
olor
ado
332,
713
424,
327
757,
041
406,
930
427,
663
834,
594
22.3
0.8
10.2
Con
nect
icut
288,
356
386,
392
674,
747
271,
039
413,
891
684,
930
-6.0
7.1
1.5
Del
awar
e76
,703
83,5
6116
0,26
475
,711
82,4
7915
8,19
0-1
.3-1
.3-1
.3D
istri
ct o
f Col
umbi
a32
,973
56,1
3589
,108
38,0
8960
,354
98,4
4315
.57.
510
.5Fl
orid
a1,
631,
140
1,18
0,16
22,
811,
302
1,63
7,27
01,
122,
442
2,75
9,71
20.
4-4
.9-1
.8G
eorg
ia50
2,97
455
8,99
51,
061,
969
538,
764
588,
890
1,12
7,65
47.
15.
36.
2H
awai
i10
5,50
316
9,42
027
4,92
210
3,90
016
7,39
027
1,29
0-1
.5-1
.2-1
.3Id
aho
112,
159
84,2
3519
6,39
412
4,27
786
,049
210,
326
10.8
2.2
7.1
Illin
ois
975,
428
1,12
8,22
92,
103,
658
1,07
3,61
41,
139,
757
2,21
3,37
210
.11.
05.
2In
dian
a37
8,31
018
1,11
155
9,42
141
3,97
919
4,73
860
8,71
79.
47.
58.
8Io
wa
205,
463
218,
734
424,
198
230,
117
215,
715
445,
832
12.0
-1.4
5.1
Kan
sas
160,
283
133,
190
293,
473
200,
913
164,
633
365,
546
25.3
23.6
24.6
Ken
tuck
y39
2,11
133
2,18
072
4,29
141
1,83
735
1,21
376
3,05
05.
05.
75.
4Lo
uisi
ana
297,
357
288,
122
585,
480
297,
065
292,
144
589,
209
-0.1
1.4
0.6
Mai
ne11
0,79
012
8,98
723
9,77
711
3,35
915
6,55
826
9,91
72.
321
.412
.6M
aryl
and
292,
542
408,
755
701,
297
317,
621
449,
955
767,
576
8.6
10.1
9.5
Mas
sach
uset
ts35
0,93
170
6,24
51,
057,
175
358,
708
687,
039
1,04
5,74
72.
2-2
.7-1
.1M
ichi
gan
542,
574
934,
276
1,47
6,85
056
9,85
594
7,53
11,
517,
386
5.0
1.4
2.7
Min
neso
ta41
3,72
647
1,28
088
5,00
645
5,24
847
8,72
693
3,97
510
.01.
65.
5M
issis
sipp
i16
2,55
312
8,46
129
1,01
417
0,66
813
4,84
830
5,51
65.
05.
05.
0M
isso
uri
534,
615
546,
255
1,08
0,87
056
4,84
155
5,02
91,
119,
871
5.7
1.6
3.6
Mon
tana
105,
286
95,5
7120
0,85
711
3,20
197
,859
211,
059
7.5
2.4
5.1

Workers’ Compensation: Benefits, Coverage, and Costs, 2004 • 23
Neb
rask
a17
1,36
111
9,05
829
0,41
916
6,86
311
6,28
628
3,14
8-2
.6-2
.3-2
.5N
evad
a15
0,15
117
6,40
632
6,55
617
5,79
618
2,14
135
7,93
717
.13.
39.
6N
ew H
amps
hire
123,
981
95,6
4821
9,62
911
9,68
594
,278
213,
964
-3.5
-1.4
-2.6
New
Jer
sey
660,
107
719,
128
1,37
9,23
566
9,26
572
9,09
31,
398,
358
1.4
1.4
1.4
New
Mex
ico
107,
936
81,4
9118
9,42
711
5,83
080
,293
196,
123
7.3
-1.5
3.5
New
Yor
k1,
039,
503
2,18
0,89
43,
220,
398
1,12
7,17
82,
210,
311
3,33
7,49
08.
41.
33.
6N
orth
Car
olin
a48
0,92
558
5,68
61,
066,
611
512,
146
646,
971
1,15
9,11
76.
510
.58.
7N
orth
Dak
ota
43,1
0235
,352
78,4
5346
,870
36,3
6783
,237
8.7
2.9
6.1
Ohi
o1,
140,
541
1,30
1,64
62,
442,
187
1,14
1,08
21,
301,
055
2,44
2,13
70.
00.
00.
0O
klah
oma
262,
953
290,
970
553,
922
263,
451
308,
550
572,
001
0.2
6.0
3.3
Ore
gon
245,
975
225,
332
471,
307
270,
253
236,
559
506,
813
9.9
5.0
7.5
Penn
sylv
ania
1,04
0,16
91,
525,
175
2,56
5,34
41,
068,
661
1,52
5,57
72,
594,
238
2.7
0.0
1.1
Rho
de I
sland
40,5
7990
,286
130,
865
49,9
9092
,278
142,
268
23.2
2.2
8.7
Sout
h C
arol
ina
312,
056
344,
879
656,
935
318,
811
369,
305
688,
115
2.2
7.1
4.7
Sout
h D
akot
a46
,331
27,4
3673
,767
48,1
2228
,350
76,4
723.
93.
33.
7Te
nnes
see
445,
703
396,
944
842,
647
462,
466
433,
342
895,
808
3.8
9.2
6.3
Texa
s1,
169,
889
687,
053
1,85
6,94
295
8,63
161
5,82
01,
574,
451
-18.
1-1
0.4
-15.
2U
tah
121,
849
64,4
9518
6,34
414
9,24
069
,023
218,
264
22.5
7.0
17.1
Ver
mon
t58
,147
61,8
1311
9,96
158
,611
69,4
6512
8,07
60.
812
.46.
8V
irgi
nia
393,
992
307,
601
701,
593
419,
955
342,
112
762,
067
6.6
11.2
8.6
Was
hing
ton
619,
553
1,18
0,52
31,
800,
076
636,
211
1,19
9,88
61,
836,
097
2.7
1.6
2.0
Wes
t Vir
gini
a 24
1,67
658
7,23
782
8,91
335
4,66
538
6,36
974
1,03
446
.8-3
4.2
-10.
6W
iscon
sin40
2,19
643
8,15
884
0,35
449
9,05
754
3,66
81,
042,
725
24.1
24.1
24.1
Wyo
min
g72
,090
42,1
6111
4,25
257
,463
62,5
9912
0,06
2-2
0.3
48.5
5.1
Non
-fed
eral
tot
al24
,667
,151
26,8
62,6
9451
,529
,845
25,2
28,3
3327
,483
,548
52,7
11,8
822.
32.
32.
3
a)In
sta
tes
with
a n
ote,
the
re w
as a
diff
eren
ce in
met
hods
bet
wee
n th
e tw
o ye
ars
bein
g co
mpa
red
for
at le
ast
one
com
pone
nt o
f the
est
imat
es. S
ome
of t
he p
erce
nt c
hang
e in
ben
efits
,th
eref
ore,
mig
ht b
e du
e to
the
diff
erin
g m
etho
ds. T
he n
otes
are
giv
en in
Tab
le 8
. For
mor
e de
tail
on s
tate
by
stat
e m
etho
dolo
gies
, see
, Sou
rces
and
Met
hods
: A C
ompa
nion
to W
orke
rs’C
ompe
nsat
ion:
Ben
efits
, Cov
erag
e, a
nd C
osts,
200
4se
ctio
n of
the
Aca
dem
y’s w
ebsit
e at
ww
w.n
asi.o
rg.
Sour
ce: N
atio
nal A
cade
my
of S
ocia
l Ins
uran
ce e
stim
ates
bas
ed o
n da
ta fr
om s
tate
age
ncie
s an
d A
.M. B
est.
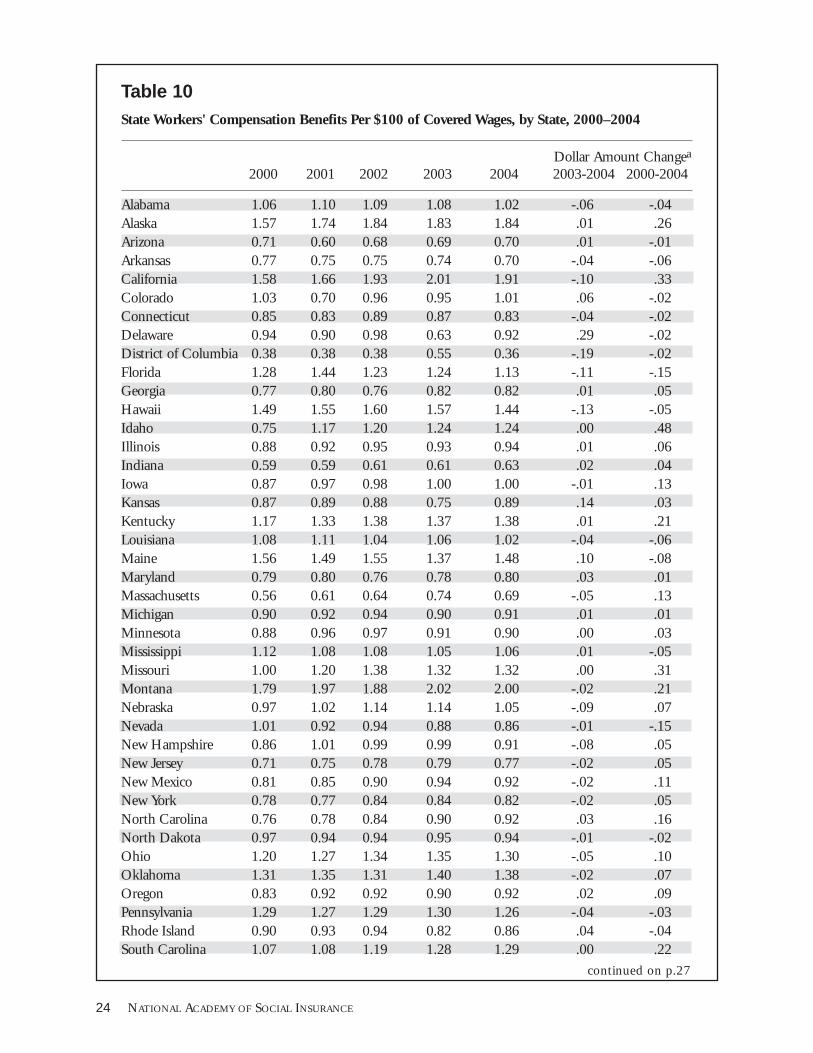
24 NATIONAL ACADEMY OF SOCIAL INSURANCE
Table 10
State Workers' Compensation Benefits Per $100 of Covered Wages, by State, 2000–2004
Dollar Amount Changea
2000 2001 2002 2003 2004 2003-2004 2000-2004
Alabama 1.06 1.10 1.09 1.08 1.02 -.06 -.04Alaska 1.57 1.74 1.84 1.83 1.84 .01 .26Arizona 0.71 0.60 0.68 0.69 0.70 .01 -.01Arkansas 0.77 0.75 0.75 0.74 0.70 -.04 -.06California 1.58 1.66 1.93 2.01 1.91 -.10 .33Colorado 1.03 0.70 0.96 0.95 1.01 .06 -.02Connecticut 0.85 0.83 0.89 0.87 0.83 -.04 -.02Delaware 0.94 0.90 0.98 0.63 0.92 .29 -.02District of Columbia 0.38 0.38 0.38 0.55 0.36 -.19 -.02Florida 1.28 1.44 1.23 1.24 1.13 -.11 -.15Georgia 0.77 0.80 0.76 0.82 0.82 .01 .05Hawaii 1.49 1.55 1.60 1.57 1.44 -.13 -.05Idaho 0.75 1.17 1.20 1.24 1.24 .00 .48Illinois 0.88 0.92 0.95 0.93 0.94 .01 .06Indiana 0.59 0.59 0.61 0.61 0.63 .02 .04Iowa 0.87 0.97 0.98 1.00 1.00 -.01 .13Kansas 0.87 0.89 0.88 0.75 0.89 .14 .03Kentucky 1.17 1.33 1.38 1.37 1.38 .01 .21Louisiana 1.08 1.11 1.04 1.06 1.02 -.04 -.06Maine 1.56 1.49 1.55 1.37 1.48 .10 -.08Maryland 0.79 0.80 0.76 0.78 0.80 .03 .01Massachusetts 0.56 0.61 0.64 0.74 0.69 -.05 .13Michigan 0.90 0.92 0.94 0.90 0.91 .01 .01Minnesota 0.88 0.96 0.97 0.91 0.90 .00 .03Mississippi 1.12 1.08 1.08 1.05 1.06 .01 -.05Missouri 1.00 1.20 1.38 1.32 1.32 .00 .31Montana 1.79 1.97 1.88 2.02 2.00 -.02 .21Nebraska 0.97 1.02 1.14 1.14 1.05 -.09 .07Nevada 1.01 0.92 0.94 0.88 0.86 -.01 -.15New Hampshire 0.86 1.01 0.99 0.99 0.91 -.08 .05New Jersey 0.71 0.75 0.78 0.79 0.77 -.02 .05New Mexico 0.81 0.85 0.90 0.94 0.92 -.02 .11New York 0.78 0.77 0.84 0.84 0.82 -.02 .05North Carolina 0.76 0.78 0.84 0.90 0.92 .03 .16North Dakota 0.97 0.94 0.94 0.95 0.94 -.01 -.02Ohio 1.20 1.27 1.34 1.35 1.30 -.05 .10Oklahoma 1.31 1.35 1.31 1.40 1.38 -.02 .07Oregon 0.83 0.92 0.92 0.90 0.92 .02 .09Pennsylvania 1.29 1.27 1.29 1.30 1.26 -.04 -.03Rhode Island 0.90 0.93 0.94 0.82 0.86 .04 -.04South Carolina 1.07 1.08 1.19 1.28 1.29 .00 .22
continued on p.27
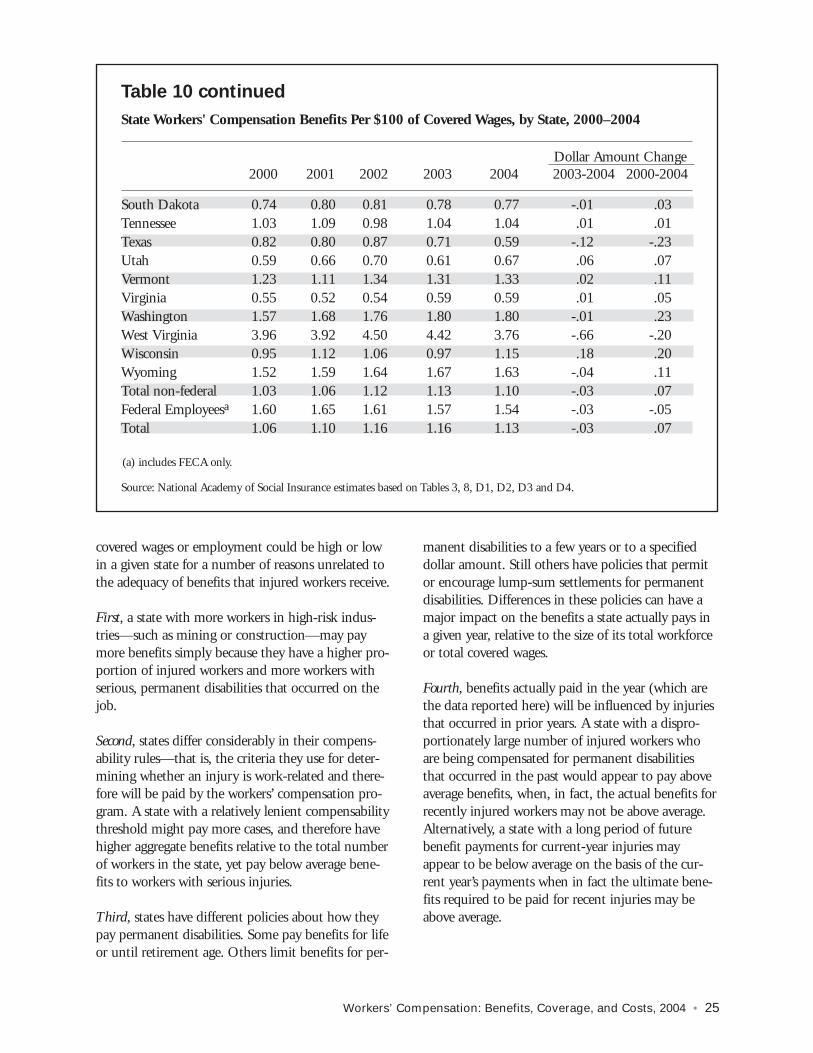
covered wages or employment could be high or lowin a given state for a number of reasons unrelated tothe adequacy of benefits that injured workers receive.
First, a state with more workers in high-risk indus-tries—such as mining or construction—may paymore benefits simply because they have a higher pro-portion of injured workers and more workers withserious, permanent disabilities that occurred on thejob.
Second, states differ considerably in their compens-ability rules—that is, the criteria they use for deter-mining whether an injury is work-related and there-fore will be paid by the workers’ compensation pro-gram. A state with a relatively lenient compensabilitythreshold might pay more cases, and therefore havehigher aggregate benefits relative to the total numberof workers in the state, yet pay below average bene-fits to workers with serious injuries.
Third, states have different policies about how theypay permanent disabilities. Some pay benefits for lifeor until retirement age. Others limit benefits for per-
manent disabilities to a few years or to a specifieddollar amount. Still others have policies that permitor encourage lump-sum settlements for permanentdisabilities. Differences in these policies can have amajor impact on the benefits a state actually pays ina given year, relative to the size of its total workforceor total covered wages.
Fourth, benefits actually paid in the year (which arethe data reported here) will be influenced by injuriesthat occurred in prior years. A state with a dispro-portionately large number of injured workers whoare being compensated for permanent disabilitiesthat occurred in the past would appear to pay aboveaverage benefits, when, in fact, the actual benefits forrecently injured workers may not be above average.Alternatively, a state with a long period of futurebenefit payments for current-year injuries mayappear to be below average on the basis of the cur-rent year’s payments when in fact the ultimate bene-fits required to be paid for recent injuries may beabove average.
Workers’ Compensation: Benefits, Coverage, and Costs, 2004 • 25
Table 10 continued
State Workers' Compensation Benefits Per $100 of Covered Wages, by State, 2000–2004
Dollar Amount Change2000 2001 2002 2003 2004 2003-2004 2000-2004
South Dakota 0.74 0.80 0.81 0.78 0.77 -.01 .03Tennessee 1.03 1.09 0.98 1.04 1.04 .01 .01Texas 0.82 0.80 0.87 0.71 0.59 -.12 -.23Utah 0.59 0.66 0.70 0.61 0.67 .06 .07Vermont 1.23 1.11 1.34 1.31 1.33 .02 .11Virginia 0.55 0.52 0.54 0.59 0.59 .01 .05Washington 1.57 1.68 1.76 1.80 1.80 -.01 .23West Virginia 3.96 3.92 4.50 4.42 3.76 -.66 -.20Wisconsin 0.95 1.12 1.06 0.97 1.15 .18 .20Wyoming 1.52 1.59 1.64 1.67 1.63 -.04 .11Total non-federal 1.03 1.06 1.12 1.13 1.10 -.03 .07Federal Employeesa 1.60 1.65 1.61 1.57 1.54 -.03 -.05Total 1.06 1.10 1.16 1.16 1.13 -.03 .07
(a) includes FECA only.
Source: National Academy of Social Insurance estimates based on Tables 3, 8, D1, D2, D3 and D4.

Fifth, variations in state wages can lead to cross-statedifferences in benefits per covered worker. In a state,the mix of industries and occupations influenceswages. Because the cash component of benefits paidis linked to wages, states with higher wages will tendto pay higher benefits all else being equal. To someextent, this is controlled for when using benefits rela-tive to covered wages. However, because benefits arecapped to not exceed a maximum dollar amount,states with many highly paid workers could havelower benefits relative to covered wages.
Sixth, the demographic composition of the work-force varies among states. Younger workers are morelikely to experience injuries, but older workers areprone to certain chronic conditions that are relativelyexpensive.
Seventh, state economic activity can influence bene-fits per covered worker in other ways apart from dif-fering wage rates. A state experiencing a recessionwill have fewer workers and fewer people workingovertime. Furthermore, the reductions in hoursworked will probably not be distributed evenlyacross industries or occupations. This will affectthose who are working, what they are earning, andthe distribution of the type of injury or illness occurring.
Eighth, variations among states in both the price ofmedical care services and the variations in use of ser-vices and practice patterns will have an impact onthe amount of medical benefits paid.
Ninth and finally, in-migration or out-migration in astate will affect benefits per covered worker. Forexample, a state that is paying a large number of per-manently disabled workers from past years wouldhave rising benefits relative to its current work forceif it experienced substantial out-migration of healthyworkers, but could have declining benefits per work-er if it experienced substantial in-migration of unin-jured workers. Yet the benefits actually received bypermanently injured workers in that state may nothave changed.
Caveats on comparing employer costs acrossstates. An employer’s costs for workers’ compensa-tion in different states is best compared by knowingthe premiums that comparable employers arecharged in each state (Thomason et al., 2001). These
premiums would be affected by the employer’s insur-ance classification and its own experience with pastinjury rates and the severity of injuries its workerssustained. Data on aggregate benefits per worker, orrelative to total wages in the state do not provide thisinformation for the following reasons.
First, a company in a high-risk industry would notnecessarily experience lower costs if it moved to astate with predominantly low-risk industries, sincethe migrating company will still be in the high-riskinsurance classification.
Second, changes in state policies would affect newemployers, but these changes are not fully reflectedin our data on benefits relative to wages. Premiumscharged to employers in a given year are based onthe costs of injuries it is expected to incur in thatyear under policies in effect that year. If a state hadchanged its policies either to lower future costs or tomake future benefits more adequate, those policieswould not be fully reflected in benefits currentlybeing paid to workers in that state as shown in Table10. For example, a state that tightened its ruleswould be expected to have lower future costs for newemployers, yet it would not show lower benefits perworker immediately because it would continue topay workers who were permanently disabled in thepast under the old rules.
Third, employers’ costs for workers’ compensationnationally exceed the benefits paid to workersbecause of factors such as administrative costs andprofits (or losses) of private carriers. The relationshipof employers’ costs relative to workers’ benefits variesamong states because of various factors, such as theextent of competition in the workers’ compensationinsurance market.
In brief, state-level benefits paid per worker or rela-tive to total wages in the state are a way to standard-ize aggregate benefit payments between large andsmall states. However, much more refined data andanalyses are needed to assess the adequacy of benefitsthat individual workers receive, or the costs that par-ticular employers would incur in different states.
Employer CostsEmployer costs for workers’ compensation in 2004were $87.4 billion, an increase of 7.0 percent from
26 NATIONAL ACADEMY OF SOCIAL INSURANCE

$81.7 billion in 2003 (Table 11). Relative to totalwages of covered workers, employer costs increasedby three cents to $1.76 per $100 of covered wages in2004, up from $1.73 per $100 of covered wages in2003 (Table 12).
For self-insured employers, the costs include benefitpayments made during the calendar year and theadministrative costs associated with providing thosebenefits. Because self-insured employers often do notseparately record administrative costs for workers’
compensation, their administrative costs must beestimated. They are assumed to be the same share ofbenefits as administrative costs for other insurers.This percentage is based on the ratio of administra-tive costs to total benefits as reported by privateinsurers to the National Association of InsuranceCommissioners. This ratio is based on direct lossadjustment expenses and expense for taxes, licenses,and fees. For more information on the self-insurancecosts estimates, see Appendix C. For the federal
Workers’ Compensation: Benefits, Coverage, and Costs, 2004 • 27
Table 11
Employer Costs for Workers’ Compensation by Type of Insurer, 1987–2004(in millions)
% Private Carriers State Funds Federala Self-InsuranceYear Total Change Total % of Total Total % of Total Total % of Total Total % of Total
1987 $38,095 * $25,448 66.8 $5,515 14.5 $1,728 4.5 $5,404 14.21988 43,284 13.6 28,538 65.9 6,660 15.4 1,911 4.4 6,175 14.31989 47,955 10.8 31,853 66.4 7,231 15.1 1,956 4.1 6,915 14.41990 53,123 10.8 35,054 66.0 8,003 15.1 2,156 4.1 7,910 14.91991 55,216 3.9 35,713 64.7 8,698 15.8 2,128 3.9 8,677 15.71992 57,395 3.9 34,539 60.2 9,608 16.7 2,454 4.3 10,794 18.81993 60,819 6.0 35,596 58.5 10,902 17.9 2,530 4.2 11,791 19.41994 60,517 -0.5 33,997 56.2 11,235 18.6 2,490 4.1 12,795 21.11995 57,089 -5.7 31,554 55.3 10,512 18.4 2,556 4.5 12,467 21.81996 55,293 -3.1 30,453 55.1 10,190 18.4 2,601 4.7 12,049 21.81997 53,544 -3.2 29,862 55.8 8,021 15.0 3,358 6.3 12,303 23.01998 53,431 -0.2 30,377 56.9 7,926 14.8 3,471 6.5 11,657 21.81999 55,386 3.7 32,631 58.9 7,552 13.6 3,496 6.3 11,708 21.12000 58,565 5.7 35,673 60.9 8,823 15.1 3,620 6.2 10,449 17.82001 64,663 10.4 37,930 58.7 11,453 17.7 3,778 5.8 11,503 17.82002 73,870 14.2 41,589 56.3 14,552 19.7 3,898 5.3 13,832 18.72003 81,667 10.6 45,384 55.6 17,642 21.6 3,970 4.9 14,671 18.02004 87,402 7.0 48,695 55.7 19,157 21.9 4,073 4.7 15,478 17.7
(a) In all years, federal costs include those paid under the Federal Employees’ Compensation Act for civilian employees andthe portion of the Black Lung benefit program that is financed by employers and are paid through the federal Black LungDisability Trust Fund, including interest payments on past Trust Fund advances from the U.S. Treasury. In years before1997, federal costs also include the other part of the Black Lung program that is financed solely by federal funds. In1997–2003, federal costs also include a portion of employer-financed benefits under the Longshore and Harbor WorkersCompensation Act that are not reflected in state data—namely, costs paid by self-insured employers and by special fundsunder the LHWCA. See Appendix H for more information about federal programs.
Source: National Academy of Social Insurance estimates of costs for private carriers and state funds are based on informationfrom A.M. Best and direct contact with state agencies. Costs for federal programs are from the Department of Labor and theSocial Security Administration. Self-insured costs are based on information from the National Association of InsuranceCommissioners.
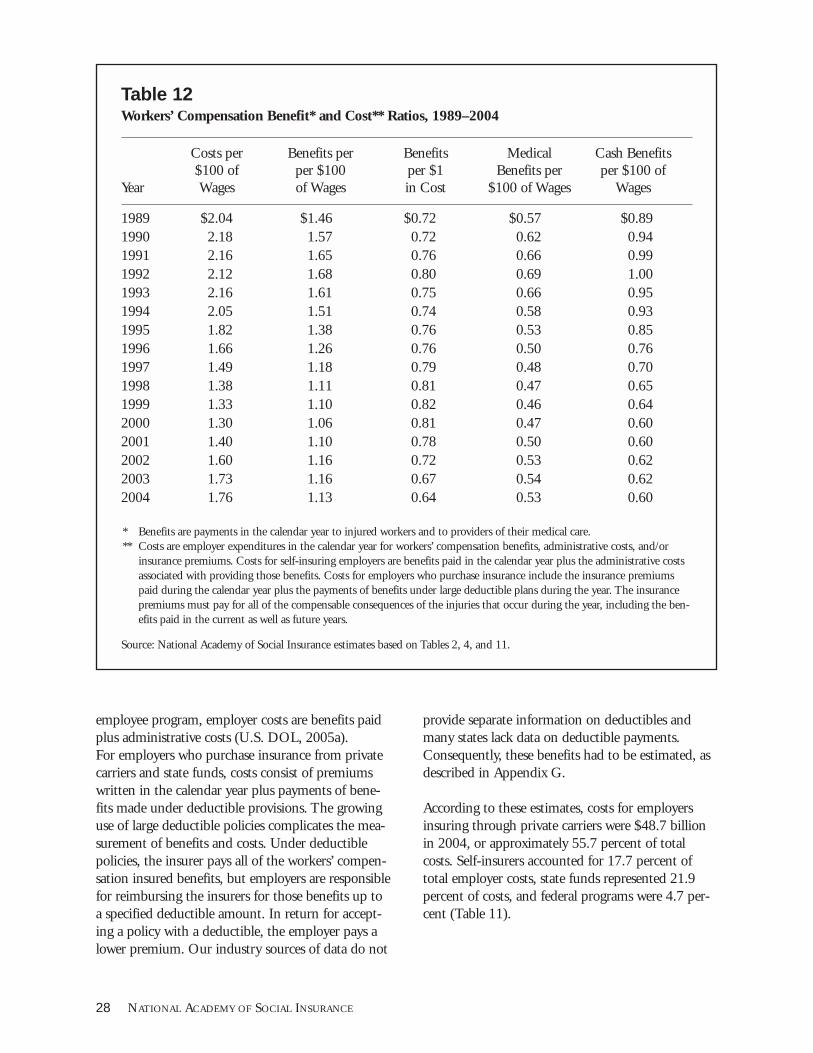
employee program, employer costs are benefits paidplus administrative costs (U.S. DOL, 2005a).For employers who purchase insurance from privatecarriers and state funds, costs consist of premiumswritten in the calendar year plus payments of bene-fits made under deductible provisions. The growinguse of large deductible policies complicates the mea-surement of benefits and costs. Under deductiblepolicies, the insurer pays all of the workers’ compen-sation insured benefits, but employers are responsiblefor reimbursing the insurers for those benefits up toa specified deductible amount. In return for accept-ing a policy with a deductible, the employer pays alower premium. Our industry sources of data do not
provide separate information on deductibles andmany states lack data on deductible payments.Consequently, these benefits had to be estimated, asdescribed in Appendix G.
According to these estimates, costs for employersinsuring through private carriers were $48.7 billionin 2004, or approximately 55.7 percent of totalcosts. Self-insurers accounted for 17.7 percent oftotal employer costs, state funds represented 21.9percent of costs, and federal programs were 4.7 per-cent (Table 11).
28 NATIONAL ACADEMY OF SOCIAL INSURANCE
Table 12Workers’ Compensation Benefit* and Cost** Ratios, 1989–2004
Costs per Benefits per Benefits Medical Cash Benefits$100 of per $100 per $1 Benefits per per $100 of
Year Wages of Wages in Cost $100 of Wages Wages
1989 $2.04 $1.46 $0.72 $0.57 $0.891990 2.18 1.57 0.72 0.62 0.941991 2.16 1.65 0.76 0.66 0.991992 2.12 1.68 0.80 0.69 1.001993 2.16 1.61 0.75 0.66 0.951994 2.05 1.51 0.74 0.58 0.931995 1.82 1.38 0.76 0.53 0.851996 1.66 1.26 0.76 0.50 0.761997 1.49 1.18 0.79 0.48 0.701998 1.38 1.11 0.81 0.47 0.651999 1.33 1.10 0.82 0.46 0.642000 1.30 1.06 0.81 0.47 0.602001 1.40 1.10 0.78 0.50 0.602002 1.60 1.16 0.72 0.53 0.622003 1.73 1.16 0.67 0.54 0.622004 1.76 1.13 0.64 0.53 0.60
* Benefits are payments in the calendar year to injured workers and to providers of their medical care.** Costs are employer expenditures in the calendar year for workers’ compensation benefits, administrative costs, and/or
insurance premiums. Costs for self-insuring employers are benefits paid in the calendar year plus the administrative costsassociated with providing those benefits. Costs for employers who purchase insurance include the insurance premiumspaid during the calendar year plus the payments of benefits under large deductible plans during the year. The insurancepremiums must pay for all of the compensable consequences of the injuries that occur during the year, including the ben-efits paid in the current as well as future years.
Source: National Academy of Social Insurance estimates based on Tables 2, 4, and 11.

Trend in Benefit andCost RatiosTable 12 shows the trend in benefits paid andemployer costs per $100 of covered wages over thelast 16 years. For the first time since 2000, workers’compensation benefits relative to covered wages fell.Employers’ costs per $100 of covered wages haveincreased continuously since 2000. Nonetheless,employer costs of $1.76 per $100 of covered wagesin 2004 remain well below their peak level of $2.18per $100 of wages in 1990.
What accounts for the difference between benefitspaid to workers and costs to employers? For self-insured employers (or the federal employee pro-gram), the difference reflects our estimates of admin-istrative costs (or actual reported costs in the case ofthe federal program). For self-insuring employers,the costs in a calendar year pertain to benefits paidin the same year.
For insured benefits, the difference between employ-er costs and benefits to workers reflects additionalfactors. One major factor is that the premiums in acalendar year must pay for all of the compensableconsequences of the injuries that occur during theyear, including the benefits paid in the current aswell as future years. Thus, the premiums for 2004include benefit payments during the year for 2004injuries, plus reserves for payment of benefits for the2004 injuries in 2005 and after. In addition, premi-ums must cover expenses such as administrative andloss adjustment costs, taxes, profits or losses of insur-ance carriers, and contributions for special funds,which can include the support of workers’ compen-sation agencies.
Premiums paid by employers and benefits paid toworkers do not change at the same rate from year toyear for a number of reasons. First, benefits and pre-miums do not reflect the same time period in thesame way. Benefits are those actually paid to workersin a given year, including benefits paid for injuriesthat occurred in prior years. Premiums written in agiven year reflect the insurer’s expected future liabili-ties for injuries that occur in the year. From theemployer’s perspective, the premiums written reflectthe employer’s cost for the year. From the insurer’sperspective, the premiums reflect all future costs theinsurer expects to incur for injuries that occur in the
year. Thus, an increase in expected liabilities couldlead to an increase in premiums and a decline inexpected liabilities could lead to a decline in premi-ums. Second, premiums can be influenced by insur-ers’ past and anticipated investment returns onreserves that they set aside to cover future liabilities.Thus, a decline in investment returns would con-tribute to an increase in premiums, while animprovement in investment returns could lead to adecline in premiums. Finally, premiums reflect insur-ers’ profits (or losses), since the profitability (or lackthereof) will affect the extent of dividends, scheduleratings, and deviations offered by the insurers.
Work Injuries,Occupational Illnessand FatalitiesWhile national data are not available on the numberof persons who file workers’ compensation claims orreceive benefits in a given year, the Bureau of LaborStatistics collects information about work-relatedfatalities and nonfatal work injuries or occupationalillnesses and the NCCI has information on workers’compensation claims in thirty-nine states (NCCI,2005).
Fatalities at Work
A total of 5,764 fatal work injuries occurred in 2004(Table 13), which represent a 3.4 percent increase inthe number of fatalities from 2003. Transportationincidents continued to be the leading cause of on-thejob fatalities in 2004, accounting for 45 percent ofthe total. Violent acts (homicides, suicides and ani-mal attacks), falls, and contact with objects andequipment were the other leading causes of death,accounting for 18 percent, 15 percent, and 14 per-cent respectively (U.S. DOL, 2005b).
Nonfatal Injuries and Illnesses
A total of 4.3 million nonfatal workplace injuriesand illnesses were reported in private industry work-places during 2004, resulting in a rate of 4.8 casesper one hundred full-time equivalent workers,according to a Bureau of Labor Statistics survey ofprivate sector employers (U.S. DOL, 2005c). Manyof these cases involved relatively minor injuries thatdid not result in lost workdays. The frequency of allinjuries and illnesses declined from 8.9 per 100 full-
Workers’ Compensation: Benefits, Coverage, and Costs, 2004 • 29

time workers in 1992 to 4.8 per 100 in 2004 (Table14).
A total of 1.3 million workplace injuries or illnessesthat required recuperation away from work beyondthe day of the incident were reported in privateindustry in 2004 (U.S. DOL, 2005d). The numberof reported injuries or illnesses per one hundred full-time workers declined from 3.0 in 1992 to 1.4 in2004 (Table 14). The median time away from workbeyond the day of the injury was eight days. Aboutone in four would not have met a three-day waitingperiod, and about 40 percent would not have met asix-day waiting period (U.S. DOL, 2005f).
A recent study indicates that the current nationalsystem for work-related injuries and illnesses, admin-istered by the BLS, markedly undercounts the totalnumber of injuries with chronic or acute conditions(Rosenman et al, 2006). The authors suggest a morecomprehensive surveillance system, not solely depen-dant on employer-based data sources, is needed forinformed decision-making on the allocation of pub-lic health resources.
Women are somewhat less likely than men to havereported workplace injuries that involve days away
30 NATIONAL ACADEMY OF SOCIAL INSURANCE
Figure 4
Nature of Injury or Illness: Percent of Nonfatal Occupational Injuries and Illnesses InvolvingDays Away from Work, U.S. Private Industry, 2004
Source: Bureau of Labor Statistics, U.S. Department of Labor, March, 2005f
Carpal tunnel syndrome 1.5%
Cuts, Lacerations, Punctures 7.8%Cu
Bruises, Contusions 9.1%
Fractures 7.5%Heat Burns1.5%
All other injuries25.1%
Sprains and Strains 41.7%
Tendonitis, Chemical burns,Amputations 1.8%
Multiple Traumatic Injuries 4.0%
Table 13Number of Fatal Occupational Injuries,1992–2004
Year Number of Injuries
1992 6,2171993 6,3311994 6,6321995 6,2751996 6,2021997 6,2381998 6,0551999 6,0542000 5,9202001 8,801
September 11 events 2,886Other 5,915
2002 5,5342003 5,5752004 5,764
Source: U.S. DOL 2005c.http://www.bls.gov/iif/oshcfoi1.htm

from work. While women make up 41.1 percent ofthe total hours worked (U.S. DOL, 2006b), theyaccount for 33.8 percent of reported injuries thatinvolved days away from work (U.S. DOL, 2005a).
The most common causes of reported injuries or ill-nesses were: Sprains and strains, most often involvingthe back (41.7 percent); bruises and contusions (9.1percent); cuts, lacerations and punctures (7.8 per-cent); fractures (7.5 percent); carpal tunnel syn-drome (1.5 percent); heat burns (1.5 percent); andtendonitis, chemical burns and amputations (1.8percent) (Figure 4).
Workers’ Compensation Claims
The National Council on Compensation Insurancereports on the frequency of workers’ compensationclaims for privately insured employers and some statefunds in thirty-six states (Table 15). These data showdeclining trends similar to national trends in work-place injuries reported by the Bureau of LaborStatistics. Claims per 100,000 insured workersdeclined steadily between 1992 and 2001.Temporary total disability claims are those in whichdays away from work exceeded the three- to seven-day waiting period. The frequency of these claimsdeclined by about 41 percent (Table 15). This
Workers’ Compensation: Benefits, Coverage, and Costs, 2004 • 31
Table 14
Private Industry Occupational Injury and Illness: Total Non-fatal Cases and Incidence Rates,1987–2004
Number of Cases (in millions) Incidence Rateb
All Cases Cases with Any Days All Cases Cases with Any DaysYeara Away from Work Away from Work
1987 6.0 2.5 8.3 3.41988 6.4 2.6 8.6 3.51989 6.6 2.6 8.6 3.41990 6.8 2.6 8.8 3.41991 6.3 2.6 8.4 3.21992 6.8 2.3 8.9 3.01993 6.7 2.3 8.5 2.91994 6.8 2.2 8.4 2.81995 6.6 2.0 8.1 2.51996 6.2 1.9 7.4 2.21997 6.1 1.8 7.1 2.11998 5.9 1.7 6.7 2.01999 5.7 1.7 6.3 1.92000 5.7 1.7 6.1 1.82001 5.2 1.5 5.7 1.72002c 4.7 1.4 5.3 1.62003 4.4 1.3 5.0 1.52004 4.3 1.3 4.8 1.4
a Data after 1991 exclude fatal work-related injuries and illnesses.b The incidence rate is the number of cases per one hundred full-time workers.c Data for 2002 and beyond are not strictly comparable to prior year data due to changes in OSHA recordkeeping
requirements.
Source: U.S. DOL 2005e.http://www.bls.gov/iif/home.htm

decline is very similar to the decline in injuriesreported by the BLS that involved days away fromwork. Between 1992 and 2001, the incidence ofinjuries that involved days away from work declinedby about 43 percent (from 3.0 per one hundred full-time workers in 1992 to 1.7 per one hundred full-time workers in 2001) (Table 14).
The frequency of total workers’ compensationclaims—including medical-only cases that involvelittle or no lost work time—declined by about 36percent between 1992 and 2001. This rate of declineis also very similar to the 36 percent decline in theincidence rate for all injuries reported to the BLS inthe same period (from 8.9 to 5.7 per one hundredfull-time workers between 1992 and 2001). Variousstudies indicate that some workplace injuries anddiseases do not show up as workers’ compensationclaims because workers don’t know they are eligibleor do not file for other reasons (Leigh and Robbins,2004; Leigh et al, 2000; Azaroff et al., 2002;Shannon and Lowe 2002; and Biddle et al., 1998).Other research suggests that tighter eligibility stan-dards and claims filing restrictions for workers’ com-
pensation may explain part of the decline in injuryrates as measured in BLS surveys. Boden and Ruser(2003) find that between 7.0 and 9.4 percent of thedecline in injury rates measured by BLS between1991 and 1997 is an indirect result of tighter eligi-bility standards and claims filing restrictions forworkers’ compensation. Fewer cases entered into theworkers’ compensation system could result in fewerinjuries reported to the BLS
Comparing Workers’Compensation withOther Disability BenefitProgramsOther sources of support for disabled workersinclude sick leave, short-term and long-term disabili-ty benefits, Social Security disability insurance, andMedicare. Unlike workers’ compensation, these pro-grams are not limited to injuries or illnesses causedon the job.
32 NATIONAL ACADEMY OF SOCIAL INSURANCE
Table 15
Number of Workers' Compensation Claims per 100,000 Insured Workers: Private Carriers in Thirty-six Jurisdictions, 1992-2001
Total (including Policy Period Temporary Total Permanent partial medical only)
1992 1,358 694 8,5041993 1,331 644 8,2791994 1,300 565 7,8751995 1,217 459 7,3771996 1,124 419 6,8371997 1,070 414 6,7251998 977 452 6,4741999 909 459 6,3302000 862 430 5,9032001 797 417 5,431
Percent decline, 1992–2001 -41.3 -39.9 -36.1
Source: NCCI 1996; 1997; 1998; 1999; 2000; 2001; 2002; 2003a; 2004b, 2005

Other Disability Benefits
Sick leave is the most common form of wagereplacement for short-term absences from work dueto illness or injury. Benefits typically pay 100 percentof wages for a few weeks. Laws in five states requireshort-term disability insurance: California, Hawaii,New Jersey, New York, and Rhode Island. Thesestate programs generally pay benefits that replace halfof the worker’s lost earnings, subject to a maximumweekly benefit. Most programs pay benefits for up totwenty-six weeks, although California pays for up tofifty-two weeks. In California and Rhode Island, thebenefits are financed solely by employee contribu-tions. In Hawaii, New Jersey, and New York,employers also contribute. Workers in other statesmay have short-term disability insurance that isoffered and financed, at least in part, by employers.Benefits usually last for up to twenty-six weeks andtypically replace about half of the worker’s priorearnings. About 39 percent of private sector employ-ees were covered by short-term disability insurancein 2004 (U.S. DOL, 2005f).
An estimated 70 percent of all private sector work-ers have some coverage for temporary sickness ordisability other than workers’ compensation. Theyinclude 26 percent who have only sick leave, 20percent who have only temporary disability insur-ance, and 24 percent who have both (Mashaw andReno, 1996). Thus, about 30 percent of private sec-tor employees have no provision other than work-ers’ compensation for wage replacement duringtemporary absence from work due to sickness ordisability.
Long-term disability insurance that is financed, atleast in part, by employers, covers about 30 percentof private sector employees. Such coverage is mostcommon among white-collar workers. About 40 per-cent of white-collar workers, 21 percent of blue-col-lar workers, and 11 percent of service workers hadthis coverage as of March 2005 (U.S. DOL, 2005d).Long-term disability insurance benefits are usuallypaid after a waiting period of three to six months, orafter short-term disability benefits end. Long-termdisability insurance is generally designed to replace60 percent of earnings, although replacement rates ofbetween 50 percent and 66 percent are also com-mon. Almost all long-term disability insurance iscoordinated with Social Security disability benefitsand workers’ compensation benefits. That is, the
long-term disability benefits are reduced dollar fordollar by the social insurance benefits. For example,if Social Security benefits replaced 40 percent of theworker’s prior earnings, the long-term disability ben-efit would pay the balance to achieve a 60 percentreplacement. Long-term disability insurance is alsosold in individual policies, typically to high-earningprofessionals. Such individual policies are not includ-ed in these data.
Retirement benefits may also be available to workerswho become disabled. Most defined benefit pensionplans have some disability provision; benefits may beavailable at the time of disability or may continue toaccrue until retirement age. Defined contributionplans will often make funds in the employee’saccount available to a disabled worker withoutpenalty.
Social Security DisabilityInsurance and Medicare
Workers’ compensation is surpassed in size only bythe federal Social Security disability insurance pro-gram and the accompanying Medicare program inproviding cash and medical benefits to disabledworkers.
While Social Security disability benefits and workers’compensation are the nation’s two largest work-baseddisability benefit programs, the two programs differ,in many respects. Workers are eligible for workers’compensation benefits from their first day ofemployment, while Social Security disability benefitsrequire workers to have a substantial work history.Workers’ compensation provides benefits for bothshort-term and long-term disabilities, and for partialas well as total disabilities. These benefits cover onlythose disabilities arising out of and in the course ofemployment. Social Security disability benefits arepaid only to workers who have long-term impair-ments that preclude any gainful work. SocialSecurity disability benefits are provided whether thedisability arose on or off the job. By law, the benefitsare paid only to workers who are unable to engage inany substantial gainful activity by reason of a med-ically determinable physical or mental impairmentthat is expected to last a year or result in death. Theimpairment has to be of such severity that the work-er is not only unable to do his or her prior work, butis unable to do any substantial gainful work thatexists in the national economy. Social Security dis-
Workers’ Compensation: Benefits, Coverage, and Costs, 2004 • 33

ability benefits begin after a five-month waiting peri-od. Medicare coverage begins for those on SocialSecurity disability benefits after a further twenty-four-month waiting period, or twenty-nine monthsafter the onset of disability.
Many who receive Social Security disability benefitshave impairments associated with aging. The portionof insured workers who receive benefits rises sharplyat older ages, from less than 1 percent of theyoungest insured workers to about 15 percent ofinsured workers age 60–64 (Reno and Eichner,2000). Relatively few individuals who receive SocialSecurity disability benefits return to work. Typically,they leave the disability benefit rolls when they dieor reach retirement age and shift to Social Securityretirement benefits.
While workers’ compensation paid $29.9 billion incash benefits and $26.1 billion for medical care in2004, Social Security paid $78.2 billion in wagereplacement benefits to disabled workers and theirdependents and Medicare paid $37.9 billion formedical and hospital care for disabled persons underage 65 (SSA 2006 and CMS, 2005). Thus, aggregateworkers’ compensation cash benefits were less than
half the total amount of Social Security disabilitybenefits, and workers’ compensation medical benefitswere less than three-fourth of the total amount paidby Medicare. Medicare benefits are less comprehen-sive than medical care under workers’ compensation.Medicare requires beneficiary cost sharing in theform of deductibles and co-insurance, and it doesnot cover certain services. At the same time,Medicare covers all medical conditions, not justwork-related injuries or illnesses. When a workerreceiving workers’ compensation is also Medicare eli-gible, Medicare is the secondary payer under theMedicare Secondary Payer Act.
Coordination between workers’
compensation and Social Security
disability benefits
If a worker becomes eligible for both workers’ com-pensation and Social Security disability benefits, oneof the programs will limit benefits in order to avoidexcessive payments relative to the worker’s past earn-ings. The Social Security amendments of 1965required that Social Security disability benefits bereduced, so that the combined total of workers’ com-pensation and Social Security disability benefits
34 NATIONAL ACADEMY OF SOCIAL INSURANCE
Table 16
Social Security Disability Insurance (DI) Beneficiaries with Workers' Compensation (WC) orPublic Disability Benefit (PDB) Involvement, December 2005
BeneficiariesTotal Workers Auxilliaries
Type of Case Number Percent Number Percent Number Percent
All disability insurance beneficiaries 8,305,702 100.0 6,518,989 100.0 1,786,713 100.0
Total with some connection to WC or PDB 1,440,772 17.3 1,065,004 16.3 375,768 21.0
Current connection to WC or PDB 798,476 9.6 590,658 9.1 207,818 11.6DI reduced by cap 192,948 2.3 128,852 2.0 64,096 3.6DI not reduced by cap 346,707 4.2 269,567 4.1 77,140 4.3Reverse jurisdiction 59,695 .7 45,179 .7 14,516 0.8Pending decision on WC or PDB 199,126 2.4 147,060 2.3 52,066 2.9
DI previously offset for WC or PDB 642,296 7.7 474,346 7.3 167,950 9.4
Source: Quarterly Workers’ Compensation Extract and the Disabled Beneficiaries and Dependents files, SSA, 2005b

would not exceed 80 percent of the workers’ priorearnings.1 States, however, were allowed to establishreverse offset laws, whereby workers’ compensationpayments would be reduced if the worker receivedSocial Security disability benefits. The reverse offsetshifts costs to Social Security that would otherwisefall upon the employer or insurer. Legislation in1981 eliminated the states’ option to adopt reverseoffset laws, but the sixteen states that already hadsuch laws were allowed to keep them.2
As of December 2005, about 8.3 million disabledworkers and their dependents received SocialSecurity disability benefits (Table 16). About 1.4million of these individuals (or 17.3 percent) hadsome connection to workers’ compensation or someform of public disability benefits. Of these, 0.8 mil-lion (or 10 percent of the total) had their social secu-
rity benefits reduced at some time on account of theoffset.
Trends in Social Security Disability
Benefits and Workers’ Compensation
Figure 5 illustrates the long-term trend in SocialSecurity disability benefits and workers’ compensa-tion as a share of covered wages. Social Security dis-ability benefits grew rapidly in the early 1970s andthen declined through the late 1980s, after policychanges in the late 1970s and early 1980s reducedbenefits and tightened eligibility rules. From 1990 to1996, Social Security benefits again rose as claimsand allowances increased, particularly during theeconomic recession of 1990–1991. Between 1996-2001, disability insurance benefits relative to coveredwages leveled off and then rose again following therecession of 2001.
Workers’ Compensation: Benefits, Coverage, and Costs, 2004 • 35
Figure 5
Social Security Disability Insurance and Workers’ Compensation Benefits as a Percent of Wages,1970-2004
* Starting in 1989, a new method was used to estimate covered wages for the workers' compensation program thataccounts for the decrease of benefits as a percent of covered wages in that year.
Source: National Academy of Social Insurance and the Office of the Chief Actuary, Social Security Administration.
0.0
0.2
0.4
0.6
0.8
1.0
1.2
1.4
1.6
1.8
Social Security Disability Insurance
Workers’ Compensation
200219981994199019861982197819741970 2004
1 The current cap remains at 80 percent of the worker’s average indexed earnings before disability. However, in the relatively few cases where Social Security disability benefits alone, for the worker and dependents, amount to more than the 80 percent of prior earnings,the benefits are not reduced below the DI amount.
2States with reverse offset laws are: California, Colorado, Florida, Hawaii, Illinois, Louisiana, Minnesota, Montana, Nevada, NewJersey, New York, North Dakota, Ohio, Oregon, Washington, and Wisconsin.

The trend in workers’ compensation benefits as ashare of covered wages followed a different pattern.Total workers’ compensation benefits (cash and med-ical combined) were less than Social Security disabili-ty benefits during the 1970s, but grew steadilythroughout the 1970s and surpassed Social Securitydisability benefits in the mid-1980s. When SocialSecurity benefits flattened out during the mid-1980s,workers’ compensation payments continued to growat a rapid rate. Then, as workers’ compensation pay-ments declined as a share of covered wages in1992–2000, Social Security benefits rose.
The opposite trends in workers’ compensation andSocial Security disability benefits during much of thelast twenty-five years raise the question of whetherretrenchments in one program increase demandsplaced on the other, and vice versa. The substi-tutability of Social Security disability benefits andworkers’ compensation for workers with severe, long-term disabilities that are, at least arguably, work relat-
ed, or might be exacerbated by the demands ofwork, has received little attention by researchers andis not well understood (Burton and Spieler, 2001).A recent study finds that work-related disabilities aremuch more common than might previously havebeen thought, both among older persons in generaland among recipients of Social Security disabilitybenefits in particular (Reville and Schoeni, 2005).Based on reports in the 1992 Health and RetirementStudy, more than one third (36 percent) of 51-61year olds whose health limits the amount of workthey can do became disabled because of an accident,injury, or illness at work. Of those receiving SocialSecurity disability insurance, a similar portion (37percent) attributed their disability to an accident,injury or illness at work. The study also finds thatthe 51–61 year olds who attribute their disablingconditions to their jobs are far more likely to receiveSocial Security disability insurance (29.0 percent)than to report ever having received workers’ compen-sation (12.3 percent).
36 NATIONAL ACADEMY OF SOCIAL INSURANCE
Table 17
Comparison of Accident-Year Incurred Losses with Calendar-Year Benefits Paid by PrivateCarriers and State Funds in Thirty-six States, 2000–2004
Accident year incurred lossesa Calendar year benefits paidb
Year Billions of dollars Percent Change Billions of dollars Percent change
2000 12.0 12.52001 12.3 2.4 12.8 2.62002 12.0 -2.7 13.0 1.12003 11.9 -.8 13.2 1.92004 12.4 4.4 13.1 -.8
Cumulative % change from 2000-2004 3.2 4.8
(a) These data are for the thirty-seven states reported in the Calendar-Accident Year Underwriting Results of the NationalCouncil on Compensation Insurance, page 17. They include private carrier and state fund (where relevant) losses incurredin Alabama, Alaska, Arizona, Arkansas, Colorado, Connecticut, the District of Columbia, Florida, Georgia, Hawaii,Idaho, Illinois, Indiana, Iowa, Kansas, Kentucky, Louisiana, Maine, Maryland, Mississippi, Missouri, Montana, Nebraska,Nevada, New Hampshire, New Mexico, North Carolina, Oklahoma, Oregon, Rhode Island, South Carolina, SouthDakota, Tennessee, Texas, Utah, Vermont, and Virginia.
Accident year data exclude benefits paid under the following categories: underground coal mining, F-classification,national defense project, and excess business. The accident year data also exclude benefits paid under deductible policies.
(b) Based on National Academy of Social Insurance data in this report for the states listed in note (a). These data are for pri-vate carriers and states funds (where relevant) and excludes benefits paid under deductible policies.
Source: NCCI 2005 and calendar year benefits estimated by the National Academy of Social Insurance.

Incurred LossesCompared withBenefits PaidThe Academy’s estimates of workers’ compensationbenefits in this report are the amounts paid to work-ers in a calendar year regardless of whether theinjuries occurred in the current year or a past year.This measure, calendar year benefits paid, is common-ly used in reporting about other social insurance, pri-vate employee benefits, and other income securityprograms. A different measure, accident year incurredlosses, is commonly used for workers’ compensationinsurance that is purchased from private carriers andsome state funds. It measures benefit liabilitiesincurred by the insurer for injuries that occur in aparticular year, regardless of whether the benefits arepaid in the current year or a future year. (The termlosses and benefits are used interchangeably becausebenefits to the worker are losses to the insurer.) Bothmeasures, calendar year benefits paid and accidentyear losses incurred, reveal important information.3
For the purpose of setting insurance premiums, it isvital to estimate the incurred losses that the premi-ums are to cover. When an employer purchasesworkers’ compensation insurance for a particularyear, the premiums cover current and future benefitliabilities for all injuries that occur during the policyyear. State rating bureaus and the National Councilon Compensation Insurance, which provides adviso-ry ratemaking and statistical services in thirty-sixstates, focus on accident year (or policy year)incurred losses.
Accident year incurred losses are considered moresensitive at picking up ultimate benefits that will beowed to newly injured workers in response to policychanges. For example, if a state lowered benefits ortightened compensability rules for new injuries as ofa given date, then future benefits would be expected
to decline. Similarly, if a state raised benefits orexpanded the range of injuries that would be com-pensated by workers’ compensation, then future ben-efits would be expected to increase. The policychange would show up immediately in estimates ofaccident year incurred losses, but it would show upmore slowly in measures of calendar year benefitspaid because the latter measure includes paymentsfor past injuries that would not be affected by thepolicy change.
A disadvantage of relying solely on accident yearincurred losses is that it takes many years before thelosses from a particular year are actually known; inthe meantime, estimates for the losses for that acci-dent year are updated annually. The NationalCouncil on Compensation Insurance updates acci-dent year incurred losses for sixteen years before thedata for a particular year are considered final. In con-trast, calendar year benefits paid are final at the endof the calendar year.
Accident year incurred losses are estimated for insur-ance policies purchased from private carriers andfrom some state funds, but this information is notroutinely available for other state funds and for self-insured employers. In addition, accident year dataexclude benefits under large deductible policies andall benefits of certain categories of privately insuredemployers. For the years 2000 through 2004, Table17 compares accident year losses incurred reported bythe National Council on Compensation Insuranceand calendar year benefits paid estimated by theNational Academy of Social Insurance for privatecarriers and state funds in the thirty-seven statesincluded in the NCCI data. From year to year, thetwo measures change at different rates, although overan extended period, the two measures tend to besimilar. Between 2000 and 2004, the cumulativeincrease in benefits paid was 4.8 percent comparedto a 3.2 percent increase for accident year incurredlosses.
Workers’ Compensation: Benefits, Coverage, and Costs, 2004 • 37
3 A fuller discussion of these measures is in Thomason et al. 2001, Appendix B.

38 NATIONAL ACADEMY OF SOCIAL INSURANCE

Workers’ Compensation: Benefits, Coverage, and Costs, 2004 • 39
GlossaryAASCIF: The American Association of StateCompensation Insurance Funds (AASCIF) is anassociation of workers' compensation insurance enti-ties – loosely referred to as state funds – that special-ize in writing workers' compensation insurance in asingle U.S. state or Canadian province. For moreinformation, visit www.aascif.org.
Accident Year: The year in which an injuryoccurred, or the year of onset of an illness. Accidentyear benefits refer to the benefits associated with allinjuries and illnesses occurring in that year, regardlessof the year they were actually paid.
BLS: The Bureau of Labor Statistics (BLS) in theU.S. Department of Labor is a statistical agency thatcollects, processes, analyzes, and disseminates statisti-cal data about the labor market. For more informa-tion, visit www.bls.gov.
Calendar year benefits: Benefits paid to workers ina given year, regardless of when the injury or illnessoccurred.
Combined operating ratio: The ratio of underwrit-ing results to premiums. It is the ratio of paymentsmade by insurers to premiums collected. It does nottake into account income that insurers receive fromthe investment of their reserves.
Covered employment: Jobs that are covered byworkers’ compensation programs.
CPS: The Current Population Survey (CPS) is amonthly survey of about U.S. 50,000 householdsconducted by the Bureau of the Census for theBureau of Labor Statistics. It is the primary source ofinformation on the labor force characteristics of theU.S. population. For more information, visitwww.bls.census.gov/cps.
Deductibles: Under deductible policies written byprivate carriers or state funds, the insurer pays all ofthe workers’ compensation benefits, but employersare responsible for reimbursing the insurer for thosebenefits up to a specified deductible amount.Deductibles may be written into an insurance policyon a per-injury basis, or an aggregate basis, or a com-bination of a per-injury basis with an aggregate cap.
DI: Disability insurance from the Social Securityprogram. See SSDI.
FECA: The Federal Employees' Compensation Act(FECA) provides workers' compensation coverage tothree million federal civilian and postal workersaround the world for employment-related injuriesand occupational diseases.
Incurred losses: Losses paid to date plus liabilitiesfor future benefits for injuries that occurred in aspecified period.
Loss adjustment expenses: Salaries and fees paid toadjusters, as well as other expenses incurred fromadjusting claims.
Losses: Benefits paid by insurers.
Managed Care: A system of health care payment ordelivery arrangements where the health planattempts to control or coordinate use of health ser-vices by its enrolled members in order to containhealth expenditures, improve quality, or both.Arrangements often involve a defined delivery systemof providers with some form of contractual arrange-ment with the plan.
NAIC: The National Association of InsuranceCommissioners (NAIC) is the national organizationof insurance regulators in each state. It assists stateinsurance regulators, individually and collectively, toachieve insurance regulatory goals. For more infor-mation, visit www.naic.org.
NCCI: National Council on CompensationInsurance, Inc. (NCCI) is a national organizationthat assists private carriers and insurance commis-sioners in setting workers’ compensation rates inthirty-seven states. For more information, visitwww.ncci.com.
Overall Operating Ratio: The ratio of [(1) the totalof all carrier expenditures, including losses, lossadjustment expenses, underwriting expenses, anddividends (2) minus investment income earned bycarriers on their reserves] (3) divided by premiums.
Permanent Partial Disability (PPD): A disabilitythat, although permanent, does not completely limita person’s ability to work.

40 NATIONAL ACADEMY OF SOCIAL INSURANCE
Permanent Total Disability (PTD): A permanentdisability that precludes all work.
Residual Market: The mechanism used to provideinsurance for employers who are unable to purchaseinsurance in the voluntary private market. In somestates the state fund is the “insurer of last resort.” Inothers, there is a separate pool financed by assess-ments of private insurers, which is also known as anassigned risk pool.
SSA: The U.S. Social Security Administration (SSA)administers the Social Security program, which paysretirement, disability and survivors’ benefits to work-ers and their families, and the federal SupplementalSecurity Income program that provides income sup-port benefits to low-income aged and disabled indi-viduals. For more information, visit www.ssa.gov.
SSDI: Social Security disability insurance (SSDI)pays benefits to insured workers who sustain severe,long-term work disabilities of any cause. Also, DI.
Temporary Partial Disability (TPD): A temporarydisability that does not completely limit a person’sability to work.
Temporary Total Disability (TTD): A disabilitythat temporarily precludes a person from performingthe pre-injury job or another job at the employerthat the worker could have performed prior to theinjury.
Underwriting expenses: Commissions, brokerageexpenses, general expenses, taxes, licenses, and fees.
Underwriting results: The sum of losses, loss adjust-ment expenses, and underwriting expenses.
Unemployment insurance (UI): Federal-state pro-gram that provides cash benefits to workers whobecome unemployed through no fault of their ownand who meet certain eligibility criteria set by thestates.
USDOL: The U.S. Department of LaborDepartment administers a variety of Federal laborlaws including those that guarantee workers’ rights tosafe and healthful working conditions; a minimumhourly wage and overtime pay, freedom fromemployment discrimination, unemployment insur-ance, and other income support. For more informa-tion, visit www.dol.gov.
WC: Workers’ compensation.
Work related injury-illness: An injury or illnessthat arises out of and in the course of employment.The definition of a work-related injury or diseasethat is compensable under a state’s workers’ compen-sation program can be quite complex and variesacross states.

Workers’ Compensation: Benefits, Coverage, and Costs, 2004 • 41
The National Academy of Social Insurance’s esti-mates of workers’ compensation coverage start withthe number of workers in each state who are coveredby Unemployment Insurance (UI) (U.S. DOL,2005e). Almost 92 or 93 percent (U.S. DOL,2005b) of workers are covered by UI. Those who arenot required to be covered include: Some farm anddomestic workers who earn less than a thresholdamount from one employer; some state and localemployees, such as elected officials; employees ofsome non-profit entities, such as religious organiza-tions, for whom coverage is optional in some states;unpaid family workers; and railroad employees whoare covered under a separate unemployment insur-ance program. Railroad workers are also not coveredby state workers’ compensation because they haveother arrangements (NASI, 2002).
The largest groups of workers who are not coveredunder either unemployment insurance or workers’compensation are self-employed individuals whohave not incorporated their businesses.
All U.S. employers who are required to pay unem-ployment taxes must report quarterly to their stateemployment security agencies information abouttheir employees and payroll covered by unemploy-ment insurance. These employer reports are the basisfor statistical reports prepared by the U.S. Bureau ofLabor Statistics, known as the ES-202 data. Thesedata are a census of the universe of U.S. workerswho are covered by unemployment insurance.
Key assumptions underlying NASI estimates ofworkers’ compensation coverage are: (1) Workerswhose employers do not report that they are coveredby UI are not covered by workers’ compensation. (2) Workers that report they are covered by UI aregenerally covered by workers’ compensation as well,except in the following cases:
(a) Workers in small firms (which are required toprovide UI coverage in every state) are not cov-ered by workers’ compensation if the state lawexempts small firms from mandatory workers’compensation coverage.
(b) Employees in agricultural industries (who maybe covered by UI) are not covered by workers’
compensation if the state law exempts agricul-tural employers from mandatory workers’ com-pensation coverage.
(c) In Texas, where workers’ compensation cover-age is elective for almost all employers, esti-mates are based on periodic surveys conductedby the Texas Research and Oversight Council.
All federal employees are covered by workers’ com-pensation, regardless of the state in which they work.
Small Firm Exemptions. NASI assumes that work-ers are not covered by workers’ compensation if theywork for small firms in the fourteen states thatexempt small employers from mandatory coverage.Private firms with fewer than three employees areexempt from mandatory coverage in eight states:Arkansas, Colorado, Georgia, Michigan, NewMexico, North Carolina, Virginia, and Wisconsin.Those with fewer than four employees are exempt intwo states: Florida, and South Carolina. Finally,firms with fewer than five employees are exemptfrom mandatory coverage in Alabama, Mississippi,Missouri, and Tennessee (U.S. DOL, 2004; AFL-CIO, 2003).
The number of employees in small firms is estimatedusing data from the U.S. Small Business Admini-stration for each state, which show the proportion ofemployees in all private firms who worked for firmswith fewer than five employees in 2002 (the mostrecent year for which data are available). Those per-centages for the fourteen states with numericalexemptions are: Alabama, 5.1 percent; Arkansas, 5.2percent; Colorado, 6.0 percent; Florida, 6 percent;Georgia, 4.7 percent; Michigan, 4.6 percent;Mississippi, 5.3 percent; Missouri, 4.9 percent; NewMexico, 6.1 percent; North Carolina, 4.8 percent;South Carolina, 5.0 percent; Tennessee, 4.3 percent;Virginia, 4.7 percent; and Wisconsin, 4.5 percent(U.S. SBA, 2002).
To estimate the proportion of workers in firms withfewer than three or four employees, we used nationaldata on small firms from the U. S. Census Bureau(U.S. Census Bureau, 1999). Of workers in firmswith fewer than five employees, 78.6 percent workedin firms with fewer than four employees and 56.5percent worked in firms with fewer than three
Appendix A: Coverage Estimates

42 NATIONAL ACADEMY OF SOCIAL INSURANCE
Tab
le A
1
Doc
umen
ting
Wor
kers
’ Com
pens
atio
n C
over
age
Est
imat
es, 2
004
Ann
ual A
vera
ges
UI
Cov
ered
Job
saW
orke
rs’ C
ompe
nsat
ion
Exe
mpt
ions
Priv
ate,
non
-W
C C
over
edW
C a
s a
Stat
eTo
tal
farm
firm
sSm
all F
irm
Agr
icul
ture
Texa
sJo
bs%
of U
I
Ala
bam
a1,
800,
817
1,50
3,42
5 74
,669
5,
821
-
1,72
0,32
7 95
.5A
lask
a27
9,10
9 22
0,33
7 -
27
9,10
9 10
0.0
Ari
zona
2,30
3,55
8 1,
966,
286
-
2,30
3,55
8 10
0.0
Ark
ansa
s1,
108,
379
934,
416
27,6
42
7,76
7 -
1,
072,
970
96.8
Cal
iforn
ia14
,705
,788
12
,404
,480
-
14
,705
,788
10
0.0
Col
orad
o2,
089,
688
1,78
8,73
0 15
,480
-
2,
074,
208
99.3
Con
nect
icut
1,61
1,11
2 1,
393,
149
-
1,61
1,11
2 10
0.0
Del
awar
e40
5,91
5 35
4,84
7 -
40
5,91
5 10
0.0
Dist
rict
of C
olum
bia
466,
907
429,
192
-
466,
907
100.
0Fl
orid
a7,
337,
314
6,36
1,95
9 29
7,94
9 -
7,
039,
365
95.9
Geo
rgia
3,74
7,43
3 3,
191,
766
84,1
77
-
3,66
3,25
6 97
.8H
awai
i55
3,65
5 46
1,88
9 -
55
3,65
5 10
0.0
Idah
o57
8,03
0 46
7,97
6 -
57
8,03
0 10
0.0
Illin
ois
5,61
0,84
8 4,
883,
026
-
5,61
0,84
8 10
0.0
Indi
ana
2,81
2,61
0 2,
441,
065
10,6
79
-
2,80
1,93
1 99
.6Io
wa
1,40
4,19
8 1,
184,
882
-
1,40
4,19
8 10
0.0
Kan
sas
1,27
0,89
3 1,
051,
175
7,80
5 -
1,
263,
088
99.4
Ken
tuck
y1,
692,
099
1,43
5,46
8 3,
726
-
1,68
8,37
3 99
.8Lo
uisi
ana
1,83
1,03
7 1,
494,
838
-
1,83
1,03
7 10
0.0
Mai
ne58
3,22
8 49
5,31
7 -
58
3,22
8 10
0.0
Mar
ylan
d2,
332,
478
2,01
0,67
4 -
2,
332,
478
100.
0M
assa
chus
etts
3,08
6,56
6 2,
736,
028
-
3,08
6,56
6 10
0.0
Mic
higa
n4,
246,
261
3,64
4,92
0 94
,167
-
4,
152,
094
97.8
Min
neso
ta2,
566,
853
2,21
6,71
1 -
2,
566,
853
100.
0M
issis
sipp
i1,
080,
480
862,
770
46,0
76
8,50
7 -
1,
025,
897
94.9
Mis
sour
i2,
573,
559
2,20
5,57
5 10
7,84
3 -
2,
465,
716
95.8
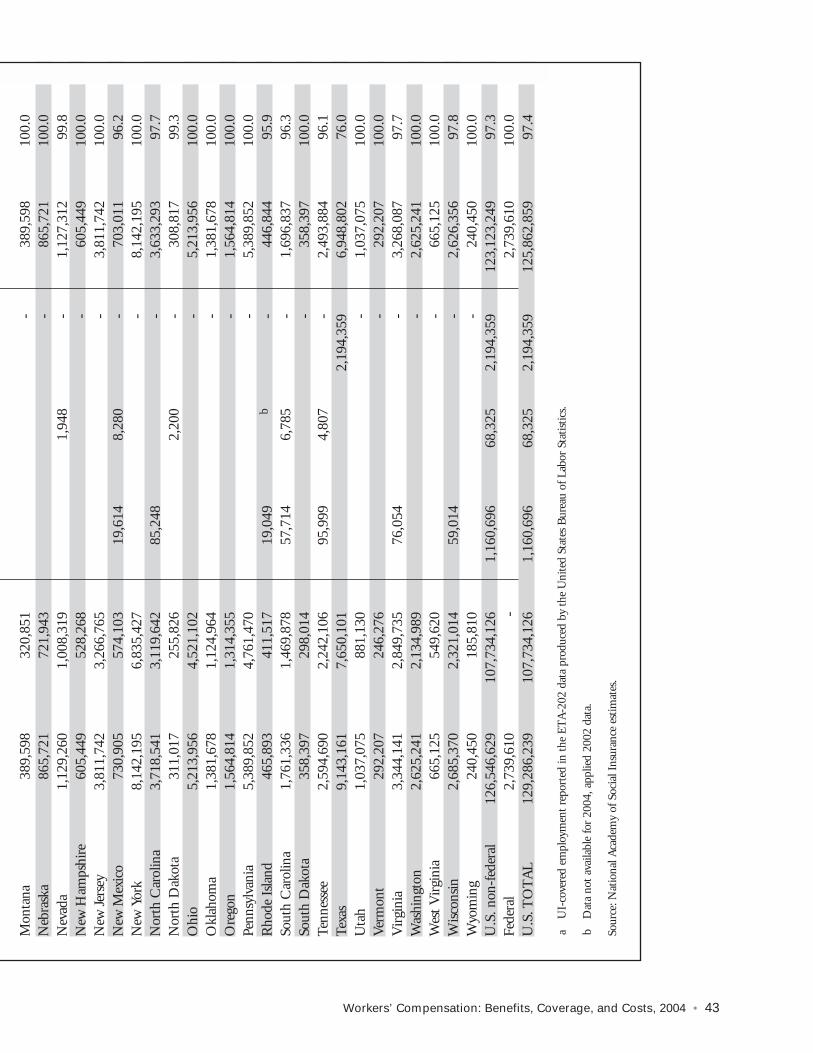
Workers’ Compensation: Benefits, Coverage, and Costs, 2004 • 43
Mon
tana
389,
598
320,
851
-
389,
598
100.
0N
ebra
ska
865,
721
721,
943
-
865,
721
100.
0N
evad
a1,
129,
260
1,00
8,31
9 1,
948
-
1,12
7,31
2 99
.8N
ew H
amps
hire
605,
449
528,
268
-
605,
449
100.
0N
ew J
erse
y3,
811,
742
3,26
6,76
5 -
3,
811,
742
100.
0N
ew M
exic
o73
0,90
5 57
4,10
3 19
,614
8,
280
-
703,
011
96.2
New
Yor
k8,
142,
195
6,83
5,42
7 -
8,
142,
195
100.
0N
orth
Car
olin
a3,
718,
541
3,11
9,64
2 85
,248
-
3,
633,
293
97.7
N
orth
Dak
ota
311,
017
255,
826
2,20
0 -
30
8,81
7 99
.3
Ohi
o5,
213,
956
4,52
1,10
2 -
5,
213,
956
100.
0O
klah
oma
1,38
1,67
8 1,
124,
964
-
1,38
1,67
8 10
0.0
Ore
gon
1,56
4,81
4 1,
314,
355
-
1,56
4,81
4 10
0.0
Penn
sylv
ania
5,38
9,85
2 4,
761,
470
-
5,38
9,85
2 10
0.0
Rho
de I
sland
465,
893
411,
517
19,0
49
b-
44
6,84
4 95
.9So
uth
Car
olin
a1,
761,
336
1,46
9,87
8 57
,714
6,
785
-
1,69
6,83
7 96
.3So
uth
Dak
ota
358,
397
298,
014
-
358,
397
100.
0Te
nnes
see
2,59
4,69
0 2,
242,
106
95,9
99
4,80
7 -
2,
493,
884
96.1
Texa
s9,
143,
161
7,65
0,10
1 2,
194,
359
6,94
8,80
2 76
.0U
tah
1,03
7,07
5 88
1,13
0 -
1,
037,
075
100.
0V
erm
ont
292,
207
246,
276
-
292,
207
100.
0V
irgi
nia
3,34
4,14
1 2,
849,
735
76,0
54
-
3,26
8,08
7 97
.7W
ashi
ngto
n2,
625,
241
2,13
4,98
9 -
2,
625,
241
100.
0W
est V
irgi
nia
665,
125
549,
620
-
665,
125
100.
0W
iscon
sin2,
685,
370
2,32
1,01
4 59
,014
-
2,
626,
356
97.8
Wyo
min
g24
0,45
0 18
5,81
0 -
24
0,45
0 10
0.0
U.S
. non
-fed
eral
126,
546,
629
107,
734,
126
1,16
0,69
6 68
,325
2,
194,
359
123,
123,
249
97.3
Fede
ral
2,73
9,61
0 -
2,
739,
610
100.
0U
.S. T
OT
AL
129,
286,
239
107,
734,
126
1,16
0,69
6 68
,325
2,
194,
359
125,
862,
859
97.4
aU
I-co
vere
d em
ploy
men
t re
port
ed in
the
ET
A-2
02 d
ata
prod
uced
by
the
Uni
ted
Stat
es B
urea
u of
Lab
or S
tatis
tics.
bD
ata
not
avai
labl
e fo
r 20
04, a
pplie
d 20
02 d
ata.
Sour
ce: N
atio
nal A
cade
my
of S
ocia
l Ins
uran
ce e
stim
ates
.

44 NATIONAL ACADEMY OF SOCIAL INSURANCE44 NATIONAL ACADEMY OF SOCIAL INSURANCE
Tab
le A
2
Cov
ered
Pay
roll
1989
-199
9 (i
n m
illio
ns)
Stat
e19
8919
9019
9119
9219
9319
9419
9519
9619
9719
9819
99
Ala
bam
a27
,510
29,3
5930
,675
32,8
2534
,396
36,4
5238
,784
40,7
2343
,240
45,6
3148
,038
Ala
ska
6,03
96,
378
6,66
56,
981
7,22
37,
530
7,65
97,
661
7,91
38,
256
8,38
2A
rizo
na29
,399
30,8
4531
,926
33,9
6236
,181
39,8
5243
,949
48,3
1052
,928
58,9
5763
,711
Ark
ansa
s14
,141
15,2
4016
,071
17,5
2118
,335
19,6
5721
,025
22,0
9123
,482
25,0
4826
,505
Cal
iforn
ia31
3,94
633
6,86
234
0,43
434
9,67
735
0,28
636
0,47
138
0,56
040
5,94
244
2,33
348
2,12
052
8,46
8C
olor
ado
30,5
3732
,717
34,7
5937
,582
40,3
1343
,293
47,0
1251
,234
56,3
7663
,161
69,5
91C
onne
ctic
ut44
,884
46,1
7146
,442
48,1
9049
,164
50,6
5653
,272
56,3
0261
,195
65,5
0769
,550
Del
awar
e7,
736
8,19
98,
451
8,72
09,
014
9,49
510
,215
11,0
3911
,926
12,9
8013
,858
Dist
rict
of C
olum
bia
13,5
4914
,196
14,2
5614
,828
15,1
3215
,643
15,9
9116
,629
17,4
0218
,650
20,6
22Fl
orid
a98
,308
105,
201
108,
024
114,
856
121,
822
129,
044
137,
876
147,
388
158,
197
173,
808
184,
929
Geo
rgia
56,9
2660
,537
62,0
4766
,573
70,7
9275
,950
82,6
0789
,627
96,7
7910
6,54
811
5,70
3H
awai
i10
,072
11,3
4712
,062
12,8
9413
,208
13,3
4113
,409
13,5
2113
,893
14,2
3914
,733
Idah
o6,
309
6,98
17,
487
8,20
78,
844
9,68
710
,463
11,0
5311
,776
12,5
8613
,620
Illin
ois
120,
739
127,
962
131,
379
139,
116
144,
370
151,
763
161,
181
170,
070
182,
787
196,
468
208,
109
Indi
ana
48,9
2951
,540
53,2
8256
,761
59,6
9163
,959
67,6
6271
,000
75,4
5681
,180
85,3
40Io
wa
20,8
0222
,222
23,1
8324
,763
25,8
9527
,713
29,4
5531
,112
33,2
4235
,841
37,9
19K
ansa
s19
,315
20,5
7321
,466
22,8
7223
,677
24,9
4326
,620
28,4
0930
,708
33,1
8835
,149
Ken
tuck
y25
,007
26,9
4428
,021
30,2
7631
,695
33,7
6735
,938
38,0
9840
,948
43,7
2946
,638
Loui
sian
a28
,498
30,8
3732
,551
34,0
8735
,299
37,4
9539
,888
41,8
2444
,916
48,1
1048
,844
Mai
ne9,
729
10,1
019,
975
10,3
9110
,687
11,1
5511
,684
12,1
9613
,011
13,8
8314
,856
Mar
ylan
d45
,555
48,3
8948
,693
50,3
9651
,859
54,3
6956
,955
59,9
9664
,619
69,4
1074
,498
Mas
sach
uset
ts75
,054
76,1
7875
,283
79,0
4681
,826
86,0
0592
,056
98,5
1910
6,52
111
5,73
212
6,24
9M
ichi
gan
91,1
3894
,637
95,3
5310
1,38
410
6,33
511
5,42
512
3,16
012
9,75
713
5,52
014
6,14
215
4,89
3M
inne
sota
43,8
0846
,631
48,4
6152
,349
54,5
9758
,004
62,0
4566
,960
72,0
1278
,552
83,9
95M
issis
sipp
i13
,816
14,6
3915
,228
16,2
6017
,416
19,0
9220
,206
21,2
0922
,577
24,2
6925
,396
Mis
sour
i42
,982
45,0
5246
,007
48,6
2450
,567
53,8
7857
,645
60,8
9665
,278
69,5
5673
,380

Workers’ Compensation: Benefits, Coverage, and Costs, 2004 • 45Workers’ Compensation: Benefits, Coverage, and Costs, 2004 • 45
Mon
tana
4,47
14,
761
5,08
85,
496
5,83
66,
175
6,51
56,
930
7,30
27,
767
8,14
7N
ebra
ska
11,6
7412
,625
13,2
7414
,198
14,8
7615
,935
17,1
0418
,227
19,5
9820
,885
22,2
54N
evad
a11
,996
13,4
4314
,013
15,2
5916
,540
18,3
8820
,316
22,7
4224
,781
27,2
1829
,774
New
Ham
pshi
re10
,921
10,9
7110
,874
11,5
6511
,926
12,7
2913
,732
14,6
7416
,003
17,4
7318
,663
New
Jer
sey
94,3
5398
,598
99,2
5610
5,06
210
8,32
711
2,82
211
8,14
512
4,13
213
2,49
614
2,86
215
2,38
6N
ew M
exic
o8,
901
9,55
310
,126
10,7
8511
,612
12,5
5713
,499
14,1
7315
,055
16,3
7817
,023
New
Yor
k21
7,34
522
8,70
622
7,91
424
1,08
224
5,46
525
1,58
726
4,62
128
1,03
229
8,39
132
3,09
534
3,62
8N
orth
Car
olin
a55
,811
59,3
0560
,889
65,5
5969
,469
74,2
6179
,727
85,0
5692
,460
100,
070
107,
166
Nor
th D
akot
a3,
816
4,06
04,
260
4,57
24,
823
5,13
85,
467
5,82
96,
203
6,59
16,
908
Ohi
o10
0,87
210
6,08
210
8,04
711
4,46
211
8,93
512
6,72
013
4,14
414
0,79
615
0,02
715
9,60
216
7,35
1O
klah
oma
20,8
7822
,275
23,2
2924
,318
25,1
8026
,257
27,4
1429
,075
31,0
5733
,482
34,8
25O
rego
n23
,269
25,3
5826
,555
28,4
2330
,101
32,4
5135
,322
38,5
0741
,999
44,5
2247
,365
Penn
sylv
ania
108,
001
114,
127
116,
536
123,
148
126,
453
131,
504
137,
993
144,
904
154,
476
164,
776
173,
798
Rho
de I
sland
8,97
69,
207
8,92
39,
394
9,73
610
,036
10,5
4710
,904
11,6
2012
,447
13,1
52So
uth
Car
olin
a25
,479
27,4
9028
,055
29,6
3331
,167
32,9
8635
,338
37,2
8739
,931
43,1
0045
,806
Sout
h D
akot
a3,
853
4,20
44,
513
4,93
65,
288
5,72
56,
159
6,53
16,
967
7,49
08,
052
Tenn
esse
e38
,365
40,5
4942
,205
45,9
3048
,868
52,6
1056
,555
59,3
6764
,031
68,2
9972
,255
Texa
s11
2,63
012
1,98
412
9,33
813
8,07
314
4,78
915
2,84
916
4,31
117
6,98
419
7,49
522
0,44
623
8,03
1U
tah
11,7
7112
,846
13,8
0515
,039
16,1
5217
,722
19,5
5921
,551
23,6
0725
,461
27,1
43V
erm
ont
4,84
55,
011
5,03
25,
324
5,54
35,
769
6,08
26,
415
6,78
67,
245
7,72
6V
irgi
nia
54,6
6457
,393
58,2
5261
,481
64,4
0568
,113
72,4
5477
,441
84,3
4194
,485
102,
718
Was
hing
ton
41,6
7346
,281
49,3
4653
,796
55,3
0258
,133
61,6
5666
,747
74,3
5382
,863
91,5
75W
est V
irgi
nia
11,2
0311
,991
12,3
1912
,987
13,3
5314
,139
14,6
8215
,200
15,7
1216
,305
16,8
15W
iscon
sin41
,905
44,9
1246
,744
50,4
2452
,984
56,4
0659
,821
63,1
1367
,847
72,3
3376
,769
Wyo
min
g3,
340
3,59
33,
781
3,94
04,
132
4,34
54,
465
4,60
14,
875
5,13
35,
448
US,
non
-fed
eral
2,26
9,32
02,
408,
829
2,46
5,37
72,
609,
047
2,70
5,53
82,
849,
854
3,02
9,17
63,
220,
284
3,47
2,44
73,
763,
879
4,02
7,75
5Fe
dera
l 90
,977
97,5
0010
2,03
510
9,59
511
3,44
911
4,99
511
3,56
811
6,47
011
8,95
912
1,49
012
3,28
6U
S T
OT
AL
2,36
0,29
72,
506,
330
2,56
7,41
22,
718,
642
2,81
8,98
72,
964,
850
3,14
2,74
43,
336,
753
3,59
1,40
63,
885,
370
4,15
1,04
0
Sour
ce: N
atio
nal A
cade
my
of S
ocia
l Ins
uran
ce E
stim
ates
.

46 NATIONAL ACADEMY OF SOCIAL INSURANCE
employees. These ratios were applied to the percent-age of workers in firms with fewer than five employ-ees in the respective states. For example, the propor-tion of Arkansas private sector workers in firms withfewer than three employees is: (5.4 percent) x (56.5percent) = 3.05 percent. These ratios are applied tothe number of UI covered workers in private, non-farm firms in each state. In the fourteen Statestogether, we estimate that 1.2 million workers wereexcluded from workers’ compensation coverage in2004 because of the small employer exclusion frommandatory coverage.
Agricultural Exemptions. We estimate agriculturalworkers to be excluded from workers’ compensationcoverage if they work in the sixteen states where agri-cultural employers are exempt from mandatory cov-erage. These states are: Alabama, Arkansas,Delaware, Georgia, Indiana, Kansas, Kentucky,Missouri, Mississippi, North Dakota, Nebraska, NewMexico, Nevada, Rhode Island, South Carolina, andTennessee. In each of these jurisdictions, we subtractfrom UI coverage those workers employed in agricul-tural industries.
Texas. In Texas, where workers’ compensation cover-age is elective for almost all employers, the NASI
estimate of coverage is based on periodic surveysconducted by the Texas Workers’ CompensationResearch Institute and the Texas Department ofInsurance, which found 76.0 percent of Texasemployees were covered in 2004 (TDI et al, 2004).This ratio was applied to all UI-covered Texasemployees other than federal government workers(who were not included in the surveys cited above).A prior survey in 2001 found that 84.0 percent ofnon-federal workers in Texas were covered (Shieldsand Campbell, 2001). We revised our past coverageestimate in Texas to 78.6 percent in 2003 and 81.3in 2002 to phase in the decline from 84.0 percent in2001 to 76.0 percent in 2004.
Table A2 provides estimates of covered wages bystate for the period 1989-1999. Estimates for 1997-1999 follow methods described in this appendix toestimate coverage in each state. For earlier years, the1997 ratio (of workers’ compensation covered pay-roll to total UI covered payroll) in each state is usedto estimate workers’ compensation covered payroll,drawing on UI-covered payroll data provided by theU.S. Bureau of Labor Statistics.

Workers’ Compensation: Benefits, Coverage, and Costs, 2004 • 47
Appendix B: Questionnaire for State Agencies

48 NATIONAL ACADEMY OF SOCIAL INSURANCE

Workers’ Compensation: Benefits, Coverage, and Costs, 2004 • 49
Estimates of benefits paid and employer costs forworkers’ compensation by the National Academy ofSocial Insurance (NASI) rely on two main sources:Responses to the NASI survey questionnaire fromstate agencies and data purchased from A.M. Best, aprivate company that specializes in collecting insur-ance data and rating insurance companies.
The A.M. Best data show the experience of privatecarriers in every state, but do not include any infor-mation about self-insured employers or about bene-fits paid under deductible arrangements. The A.M.Best data show total “direct losses” (that is, benefits)paid in each state in 2000–2004, by private carriersand by twenty-one entities that we classify as statefunds, based on their membership in the AmericanAssociation of State Compensation Insurance Funds.A.M. Best did not provide information on the statefund in Colorado, Montana, Oklahoma, SouthCarolina, or on exclusive state funds in Ohio, NorthDakota, Washington, West Virginia, and Wyoming.
The 2004 NASI survey questionnaire for state agen-cies asked states to report data for five years, from2000 through 2004. These historical data were usedto revise and update estimates for these past years.
In Table C-1, the shaded areas indicate the informa-tion provided by each state in response to the survey.
Private Carrier Benefits
Of the fifty-one jurisdictions, forty-six allow privatecarriers to write workers’ compensation policies. Ofthese, twenty-three jurisdictions were able to providedata on the amount of benefits paid by private carri-ers. In the other states, A.M. Best data were used toestimate private carrier benefits. An estimate of bene-fits paid under deductible policies were added tobenefits paid reported by A.M. Best to estimate totalprivate carrier benefits in these states. Methods forestimating deductible amounts are described inAppendix G.
State Fund Benefits
Twenty-six states have a state fund for writing work-ers’ compensation policies. Of these, thirteen wereable to provide benefit data. A.M. Best data andNAIC (National Association of InsuranceCommissioners) data were used to estimate state
fund benefits in states unable to provide the data. Anestimate of benefits paid under deductible policieswas added to benefits reported by A.M. Best to esti-mate total state fund benefits in these states.
Self-Insured Benefits
All jurisdictions except North Dakota and Wyomingallow employers to self-insure. Twenty-eight of thesejurisdictions were able to provide data on benefitspaid by self-insurers. Self-insurance benefits wereimputed for the twenty-one states that were unableto provide data. The self-insurance imputation meth-ods are described in Appendix E.
Benefits under Deductible Policies
Forty-six jurisdictions allow carriers to writedeductible policies for workers compensation. OfThese jurisdictions, five were able to provide theamount of benefits paid under deductible policies.Benefits under deductible arrangements were esti-mated for another thirteen states by subtractingA.M. Best data on benefits paid (which do notinclude deductible benefits) from data reported bythe state agency (which, in these cases, includeddeductible benefits). Deductible benefits in theremaining states were estimated using a ratio ofManual Equivalent Premiums, as described inAppendix G.
Medical Benefits
The agency data for medical share were used in ninestates. The National Council on CompensationInsurance estimates of the medical share of the bene-fits were used in thirty-seven jurisdictions. Othermethods were used for five states for which no infor-mation was available from the state or NCCI. Moredetail on methods to estimate medical benefits is inAppendix F.
Employer Costs
NASI estimates of employer costs for benefits paidunder private insurance and state funds are the sumof “direct premiums written” as reported by A.M.Best and the NAIC, plus our estimate of benefitspaid under deductible arrangements (which are notreflected in premiums). In some cases, data providedby state agencies are used instead of A.M. Best data.State fund premium data for Minnesota, Montana,
Appendix C: Data Availability

50 NATIONAL ACADEMY OF SOCIAL INSURANCE
North Dakota, and Washington were provided bythe state agencies.
For self-insured employers, the costs include benefitpayments and administrative costs. Because self-insured employers often do not separately recordadministrative costs for workers’ compensation, theiradministrative costs must be estimated. They areassumed to be the same share of benefits as adminis-trative costs for other insurers. This percentage isbased on the ratio of administrative costs to totalbenefits as reported by private insurers to theNational Association of Insurance Commissioners
(NAIC, 1998; 1999; 2000; 2001; 2002; 2003;2004; 2005). This ratio is based on direct loss adjust-ment expenses and their expense for taxes, licenses,and fees. The ratios were:1997: 15.7 percent1998: 14.5 percent1999: 15.8 percent2000: 14.0 percent2001: 14.6 percent2002: 14.8 percent2003: 17.1 percent2004: 16.19 percent
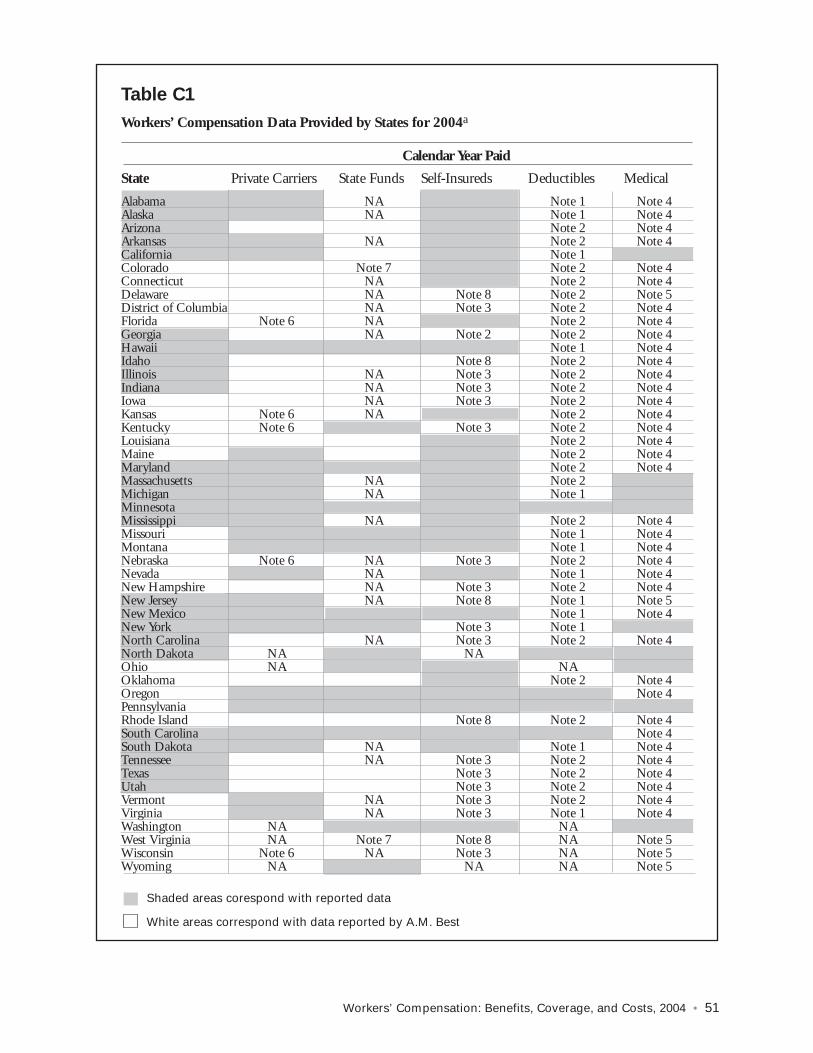
Workers’ Compensation: Benefits, Coverage, and Costs, 2004 • 51
Table C1
Workers’ Compensation Data Provided by States for 2004a
Calendar Year Paid
State Private Carriers State Funds Self-Insureds Deductibles Medical
Alabama NA Note 1 Note 4Alaska NA Note 1 Note 4Arizona Note 2 Note 4Arkansas NA Note 2 Note 4California Note 1Colorado Note 7 Note 2 Note 4Connecticut NA Note 2 Note 4Delaware NA Note 8 Note 2 Note 5District of Columbia NA Note 3 Note 2 Note 4Florida Note 6 NA Note 2 Note 4Georgia NA Note 2 Note 2 Note 4Hawaii Note 1 Note 4Idaho Note 8 Note 2 Note 4Illinois NA Note 3 Note 2 Note 4Indiana NA Note 3 Note 2 Note 4Iowa NA Note 3 Note 2 Note 4Kansas Note 6 NA Note 2 Note 4Kentucky Note 6 Note 3 Note 2 Note 4Louisiana Note 2 Note 4Maine Note 2 Note 4Maryland Note 2 Note 4Massachusetts NA Note 2Michigan NA Note 1MinnesotaMississippi NA Note 2 Note 4Missouri Note 1 Note 4Montana Note 1 Note 4Nebraska Note 6 NA Note 3 Note 2 Note 4Nevada NA Note 1 Note 4New Hampshire NA Note 3 Note 2 Note 4New Jersey NA Note 8 Note 1 Note 5New Mexico Note 1 Note 4New York Note 3 Note 1North Carolina NA Note 3 Note 2 Note 4North Dakota NA NAOhio NA NAOklahoma Note 2 Note 4Oregon Note 4PennsylvaniaRhode Island Note 8 Note 2 Note 4South Carolina Note 4South Dakota NA Note 1 Note 4Tennessee NA Note 3 Note 2 Note 4Texas Note 3 Note 2 Note 4Utah Note 3 Note 2 Note 4Vermont NA Note 3 Note 2 Note 4Virginia NA Note 3 Note 1 Note 4Washington NA NAWest Virginia NA Note 7 Note 8 NA Note 5Wisconsin Note 6 NA Note 3 NA Note 5Wyoming NA NA NA Note 5
Shaded areas corespond with reported data
White areas correspond with data reported by A.M. Best

(a) Data was provided by state workers' compensation agen-cies, insurance rating boards, departments of labor, andindustrial commissions.
NA: Not applicable.
Note 1: Data were not directly available but could be com-puted by subtracting various components from total benefitfigures provided.
Note 2: Computed from information provided on premiums.
Note 3: Self-insured benefits as described in Appendix E.
Note 4: Medical data provided by NCCI .
Note 5: Medical data estimated based on data provided byNCCI.
Note 6: Data provided by agency either was not complete orprovided accident year data hence AM Best data were used.
Note 7: Data provided by National Association of InsuranceCommissioners (NAIC).
Note 8: Self-insured data was imputed using last years data.
52 NATIONAL ACADEMY OF SOCIAL INSURANCE

Workers’ Compensation: Benefits, Coverage, and Costs, 2004 • 53
In preparing the 2004 estimates for workers’ com-pensation benefits, the National Academy of SocialInsurance reviewed and revised all data for calendaryears 2000-2003. The revision process began byrequesting historical data from state workers’ com-pensation agencies and from AM Best. The revisedbenefit estimates are reported in the following tables.Revisions to the historical data increase consistencyin historical methodology and enhance comparabili-ty between years. The following are key revisionsmade to the historical data:
■ Revised data consistently use the same medicalbenefit estimation methodology described inAppendix F.
■ Revised data consistently use the samedeductible estimation methodology describedin Appendix G.
■ Self-insurance benefit imputations were revisedusing historical data as reported in Appendix E.
■ Changes in data reported by state agencies werecaptured by the revised data questionnaire andare reflected in the revised estimates.
■ Administrative costs for self-insurance were re-estimated based on updated information fromthe National Association of InsuranceCommissioners as described in Appendix C.
The revised data in this Appendix should be used inplace of previously published data. Historical datadisplayed in the body of this report incorporate theserevisions.
Appendix D: Revised Data for 2000–2003

54 NATIONAL ACADEMY OF SOCIAL INSURANCE
Tab
le D
1
Wor
kers
’ Com
pens
atio
n B
enef
its
by T
ype
of I
nsur
eran
d M
edic
al B
enef
its,
by
Stat
e, 2
003
(in
thou
sand
s)
Priv
ate
Stat
eSe
lf-M
edic
alPe
rcen
tSt
ate
Tota
lC
arri
ersa
Fund
sIn
sure
dbB
enef
itsM
edic
al
Ala
bam
a$5
80,1
84$2
94,7
460
$285
,438
$364
,616
62.8
c
Ala
ska
184,
379
140,
585
043
,794
101,
417
55.0
c
Ari
zona
531,
240
173,
290
270,
071
87,8
7833
7,05
663
.4c
Ark
ansa
s22
5,06
115
8,05
70
67,0
0413
9,77
962
.1c
Cal
iforn
ia12
,403
,729
5,90
3,92
02,
917,
587
3,58
2,22
36,
329,
029
51.0
Col
orad
o75
7,04
125
0,27
635
7,84
814
8,91
733
2,71
343
.9c
Con
nect
icut
674,
747
458,
665
021
6,08
228
8,35
642
.7c
Del
awar
e16
0,26
411
5,44
20
44,8
2276
,703
47.9
d
Dist
rict
of C
olum
bia
89,1
0868
,263
020
,845
32,9
7337
.0c
Flor
ida
2,81
1,30
22,
274,
185
053
7,11
71,
631,
140
58.0
c
Geo
rgia
1,06
1,96
972
3,71
50
338,
254
502,
974
47.4
c
Haw
aii
274,
922
162,
168
24,6
5288
,102
105,
503
38.4
c
Idah
o19
6,39
467
,239
117,
483
11,6
7211
2,15
957
.1c
Illin
ois
2,10
3,65
81,
623,
893
047
9,76
597
5,42
846
.4c
Indi
ana
559,
421
472,
930
086
,491
378,
310
67.6
c
Iow
a42
4,19
833
5,33
00
88,8
6820
5,46
348
.4c
Kan
sas
293,
473
230,
247
063
,226
160,
283
54.6
c
Ken
tuck
y72
4,29
143
2,08
067
,050
225,
162
392,
111
54.1
c
Loui
sian
a58
5,48
029
2,15
614
7,55
814
5,76
629
7,35
750
.8c
Mai
ne23
9,77
796
,727
67,9
6175
,089
110,
790
46.2
c
Mar
ylan
d70
1,29
743
1,67
716
5,06
110
4,55
929
2,54
241
.7c
Mas
sach
uset
ts1,
057,
175
904,
215
015
2,96
035
0,93
133
.2M
ichi
gan
1,47
6,85
087
7,00
70
599,
843
542,
574
36.7
Min
neso
ta88
5,00
654
9,18
411
3,62
922
2,19
341
3,72
646
.7M
issis
sippi
291,
014
165,
513
012
5,50
116
2,55
355
.9c
Mis
sour
i1,
080,
870
657,
912
124,
147
298,
811
534,
615
49.5
c
Mon
tana
200,
857
74,0
0991
,932
34,9
1710
5,28
652
.4c
Neb
rask
a29
0,41
921
2,48
50
77,9
3417
1,36
159
.0c
Nev
ada
326,
556
214,
946
011
1,61
015
0,15
146
.0c
New
Ham
pshi
re21
9,62
917
8,96
80
40,6
6112
3,98
156
.5c
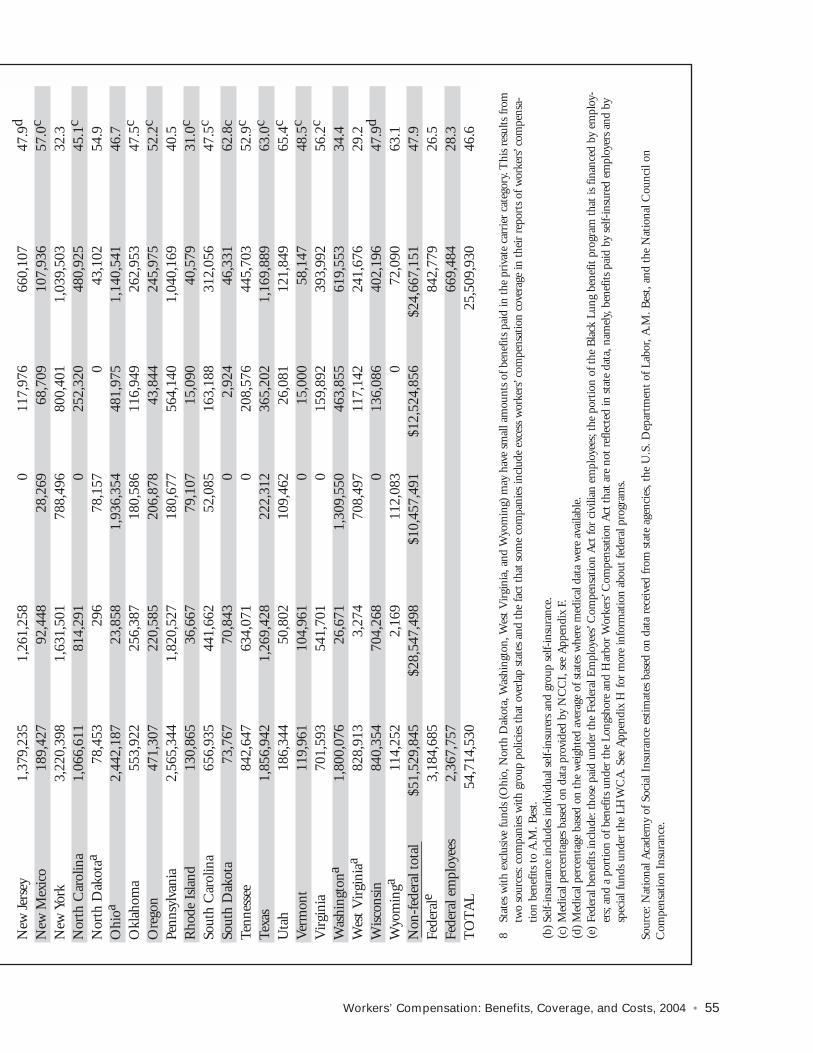
Workers’ Compensation: Benefits, Coverage, and Costs, 2004 • 55
New
Jer
sey
1,37
9,23
51,
261,
258
011
7,97
666
0,10
747
.9d
New
Mex
ico
189,
427
92,4
4828
,269
68,7
0910
7,93
657
.0c
New
Yor
k3,
220,
398
1,63
1,50
178
8,49
680
0,40
11,
039,
503
32.3
Nor
th C
arol
ina
1,06
6,61
181
4,29
10
252,
320
480,
925
45.1
c
Nor
th D
akot
aa78
,453
296
78,1
570
43,1
0254
.9O
hioa
2,44
2,18
723
,858
1,93
6,35
448
1,97
51,
140,
541
46.7
Okl
ahom
a55
3,92
225
6,38
718
0,58
611
6,94
926
2,95
347
.5c
Ore
gon
471,
307
220,
585
206,
878
43,8
4424
5,97
552
.2c
Penn
sylv
ania
2,56
5,34
41,
820,
527
180,
677
564,
140
1,04
0,16
940
.5R
hode
Isla
nd13
0,86
536
,667
79,1
0715
,090
40,5
7931
.0c
Sout
h C
arol
ina
656,
935
441,
662
52,0
8516
3,18
831
2,05
647
.5c
Sout
h D
akot
a73
,767
70,8
430
2,92
446
,331
62.8
cTe
nnes
see
842,
647
634,
071
020
8,57
644
5,70
352
.9c
Texa
s1,
856,
942
1,26
9,42
822
2,31
236
5,20
21,
169,
889
63.0
c
Uta
h18
6,34
450
,802
109,
462
26,0
8112
1,84
965
.4c
Ver
mon
t11
9,96
110
4,96
10
15,0
0058
,147
48.5
c
Vir
gini
a70
1,59
354
1,70
10
159,
892
393,
992
56.2
c
Was
hing
tona
1,80
0,07
626
,671
1,30
9,55
046
3,85
561
9,55
334
.4W
est V
irgi
niaa
828,
913
3,27
470
8,49
711
7,14
224
1,67
629
.2W
iscon
sin84
0,35
470
4,26
80
136,
086
402,
196
47.9
d
Wyo
min
ga11
4,25
22,
169
112,
083
072
,090
63.1
Non
-fed
eral
tot
al$5
1,52
9,84
5$2
8,54
7,49
8$1
0,45
7,49
1$1
2,52
4,85
6$2
4,66
7,15
147
.9Fe
dera
le3,
184,
685
842,
779
26.5
Fede
ral e
mpl
oyee
s2,
367,
757
669,
484
28.3
TO
TA
L54
,714
,530
25,5
09,9
3046
.6
8St
ates
with
exc
lusiv
e fu
nds
(Ohi
o, N
orth
Dak
ota,
Was
hing
ton,
Wes
t Vir
gini
a, a
nd W
yom
ing)
may
hav
e sm
all a
mou
nts
of b
enef
its p
aid
in t
he p
riva
te c
arri
er c
ateg
ory.
Thi
s re
sults
from
two
sour
ces:
com
pani
es w
ith g
roup
pol
icie
s th
at o
verla
p st
ates
and
the
fact
tha
t so
me
com
pani
es in
clud
e ex
cess
wor
kers
’ com
pens
atio
n co
vera
ge in
the
ir r
epor
ts o
f wor
kers
’ com
pens
a-tio
n be
nefit
s to
A.M
. Bes
t.(b
)Sel
f-in
sura
nce
incl
udes
indi
vidu
al s
elf-
insu
rers
and
gro
up s
elf-
insu
ranc
e.(c
)M
edic
al p
erce
ntag
es b
ased
on
data
pro
vide
d by
NC
CI,
see
App
endi
x F.
(d)M
edic
al p
erce
ntag
e ba
sed
on t
he w
eigh
ted
aver
age
of s
tate
s w
here
med
ical
dat
a w
ere
avai
labl
e.(e
)Fe
dera
l ben
efits
incl
ude:
tho
se p
aid
unde
r th
e Fe
dera
l Em
ploy
ees’
Com
pens
atio
n A
ct fo
r ci
vilia
n em
ploy
ees;
the
port
ion
of t
he B
lack
Lun
g be
nefit
pro
gram
tha
t is
finan
ced
by e
mpl
oy-
ers;
and
a po
rtio
n of
ben
efits
und
er t
he L
ongs
hore
and
Har
bor
Wor
kers
’ Com
pens
atio
n A
ct t
hat
are
not
refle
cted
in s
tate
dat
a, n
amel
y, b
enef
its p
aid
by s
elf-
insu
red
empl
oyer
s an
d by
spec
ial f
unds
und
er t
he L
HW
CA
. See
App
endi
x H
for
mor
e in
form
atio
n ab
out
fede
ral p
rogr
ams.
Sour
ce: N
atio
nal A
cade
my
of S
ocia
l Ins
uran
ce e
stim
ates
bas
ed o
n da
ta r
ecei
ved
from
sta
te a
genc
ies,
the
U.S
. Dep
artm
ent
of L
abor
, A.M
. Bes
t, an
d th
e N
atio
nal C
ounc
il on
Com
pens
atio
n In
sura
nce.

56 NATIONAL ACADEMY OF SOCIAL INSURANCE
Tab
le D
2
Wor
kers
’ Com
pens
atio
n B
enef
its
by T
ype
of I
nsur
er a
nd M
edic
al B
enef
its,
by
Stat
e, 2
002
(in
thou
sand
s)
Priv
ate
Stat
eSe
lf-M
edic
alPe
rcen
tSt
ate
Tota
lC
arri
ersa
Fund
sIn
sure
dbB
enef
itsM
edic
al
Ala
bam
a$5
65,2
64
$290
,009
$0
$2
75,2
55
$343
,115
60
.7c
Ala
ska
180,
046
138,
454
0 41
,592
97
,225
54
.0c
Ari
zona
505,
278
195,
025
232,
168
78,0
85
303,
672
60.1
c
Ark
ansa
s22
1,47
4 16
0,19
7 0
61,2
77
138,
200
62.4
c
Cal
iforn
ia11
,582
,431
6,
065,
550
2,19
1,96
2 3,
324,
919
5,80
8,98
5 50
.2C
olor
ado
760,
958
299,
716
322,
249
138,
993
343,
192
45.1
c
Con
nect
icut
675,
895
467,
522
0 20
8,37
3 28
0,49
7 41
.5c
Del
awar
e15
2,93
3 10
3,56
6 0
49,3
67
72,0
86
47.1
d
Dist
rict
of C
olum
bia
93,9
60
71,9
05
0 22
,055
34
,013
36
.2c
Flor
ida
2,67
8,08
2 2,
208,
833
0 46
9,24
9 1,
523,
829
56.9
c
Geo
rgia
974,
661
661,
456
0 31
3,20
5 46
4,91
3 47
.7c
Haw
aii
267,
827
167,
539
17,9
08
82,3
80
99,6
32
37.2
c
Idah
o18
5,68
8 77
,068
97
,545
11
,075
10
5,28
5 56
.7c
Illin
ois
2,12
3,87
8 1,
656,
030
0 46
7,84
7 94
3,00
2 44
.4c
Indi
ana
547,
305
462,
687
0 84
,618
35
9,03
2 65
.6c
Iow
a40
0,22
6 32
5,00
6 0
75,2
20
202,
514
50.6
c
Kan
sas
341,
606
235,
253
0 10
6,35
3 18
5,15
1 54
.2c
Ken
tuck
y70
8,42
4 45
4,42
7 56
,283
19
7,71
4 38
1,84
0 53
.9c
Loui
sian
a56
2,81
2 26
5,18
7 15
3,76
9 14
3,85
7 29
6,60
2 52
.7c
Mai
ne26
1,73
4 99
,212
75
,470
87
,051
10
3,64
7 39
.6c
Mar
ylan
d66
4,28
2 40
0,91
4 14
8,65
7 11
4,71
1 26
8,37
0 40
.4c
Mas
sach
uset
ts90
2,84
0 76
2,32
4 0
140,
517
294,
359
32.6
Mic
higa
n1,
512,
457
846,
823
0 66
5,63
4 52
3,26
0 34
.6M
inne
sota
921,
518
611,
861
98,0
96
211,
561
438,
278
47.6
Mis
sissi
ppi
290,
378
172,
668
0 11
7,71
0 18
0,61
5 62
.2c
Mis
sour
i1,
115,
832
715,
537
112,
786
287,
509
554,
568
49.7
c
Mon
tana
177,
877
70,0
99
75,8
60
31,9
18
95,3
42
53.6
c
Neb
rask
a28
2,84
4 20
6,94
3 0
75,9
01
161,
504
57.1
c
Nev
ada
324,
597
210,
474
0 11
4,12
3 13
3,31
7 41
.1c
New
Ham
pshi
re21
1,73
4 17
5,18
8 0
36,5
45
117,
724
55.6
c

Workers’ Compensation: Benefits, Coverage, and Costs, 2004 • 57
New
Jer
sey
1,32
8,65
0 1,
225,
172
0 10
3,47
7 62
6,26
8 47
.1d
New
Mex
ico
175,
845
89,2
58
24,9
48
61,6
38
99,8
80
56.8
c
New
Yor
k3,
142,
392
1,58
0,74
3 78
0,63
6 78
1,01
3 96
8,46
2 30
.8N
orth
Car
olin
a98
7,73
1 75
0,66
7 0
237,
064
423,
737
42.9
c
Nor
th D
akot
aa73
,515
22
0 73
,295
0
39,2
04
53.3
Ohi
oa2,
388,
186
37,6
52
1,87
8,25
7 47
2,27
7 1,
106,
572
46.3
Okl
ahom
a50
8,93
1 25
1,23
1 14
0,45
0 11
7,25
1 23
4,61
7 46
.1c
Ore
gon
474,
547
238,
333
192,
157
44,0
57
240,
121
50.6
c
Penn
sylv
ania
2,47
8,70
9 1,
761,
444
157,
299
559,
966
990,
861
40.0
Rho
de I
sland
141,
066
48,0
46
77,4
02
15,6
18
43,0
25
30.5
c
Sout
h C
arol
ina
592,
530
398,
098
43,7
70
150,
661
265,
453
44.8
c
Sout
h D
akot
a73
,382
69
,996
0
3,38
6 45
,130
61
.5c
Tenn
esse
e77
7,26
4 59
9,80
9 0
177,
455
398,
737
51.3
c
Texa
s2,
307,
054
1,68
0,24
0 24
6,26
5 38
0,55
0 1,
432,
681
62.1
c
Uta
h21
1,88
3 76
,492
10
5,72
1 29
,670
14
1,11
4 66
.6c
Ver
mon
t11
9,32
9 10
7,32
9 0
12,0
00
62,8
86
52.7
c
Vir
gini
a62
6,95
4 49
5,61
7 0
131,
337
339,
182
54.1
c
Was
hing
tona
1,71
6,10
7 28
,768
1,
225,
007
462,
332
590,
036
34.4
Wes
t Vir
gini
aa83
2,60
8 3,
588
697,
271
131,
749
246,
579
29.6
Wis
cons
in89
6,55
6 75
6,59
9 0
139,
957
422,
598
47.1
d
Wyo
min
ga10
7,47
5 5,
913
101,
562
0 68
,585
63
.8N
on-f
eder
al t
otal
$50,
155,
557
$28,
782,
692
$9,3
26,7
92$1
2,04
6,07
3$2
3,63
9,49
847
.1Fe
dera
le3,
153,
626
840,
445
26.7
Fede
ral E
mpl
oyee
s2,
317,
325
665,
378
28.7
TO
TA
L53
,309
,183
24,4
79,9
4345
.9
(a)
Stat
es w
ith e
xclu
sive
fund
s (O
hio,
Nor
th D
akot
a, W
ashi
ngto
n, W
est V
irgi
nia,
and
Wyo
min
g) m
ay h
ave
smal
l am
ount
s of
ben
efits
pai
d in
the
pri
vate
car
rier
cat
egor
y. T
his
resu
lts fr
omtw
o so
urce
s: co
mpa
nies
with
gro
up p
olic
ies
that
ove
rlap
stat
es a
nd t
he fa
ct t
hat
som
e co
mpa
nies
incl
ude
exce
ss w
orke
rs’ c
ompe
nsat
ion
cove
rage
in t
heir
rep
orts
of w
orke
rs’ c
ompe
nsa-
tion
bene
fits
to A
.M. B
est.
(b)S
elf-
insu
ranc
e in
clud
es in
divi
dual
sel
f-in
sure
rs a
nd g
roup
sel
f-in
sura
nce.
(c)
Med
ical
per
cent
ages
bas
ed o
n da
ta p
rovi
ded
by N
CC
I, s
ee A
ppen
dix
F.(d
)Med
ical
per
cent
age
base
d on
the
wei
ghte
d av
erag
e of
sta
tes
whe
re m
edic
al d
ata
wer
e av
aila
ble.
(e)
Fede
ral b
enef
its in
clud
e: t
hose
pai
d un
der
the
Fede
ral E
mpl
oyee
s’ C
ompe
nsat
ion
Act
for
civi
lian
empl
oyee
s; th
e po
rtio
n of
the
Bla
ck L
ung
bene
fit p
rogr
am t
hat
is fi
nanc
ed b
y em
ploy
-er
s; an
d a
port
ion
of b
enef
its u
nder
the
Lon
gsho
re a
nd H
arbo
r W
orke
rs’ C
ompe
nsat
ion
Act
tha
t ar
e no
t re
flect
ed in
sta
te d
ata,
nam
ely,
ben
efits
pai
d by
sel
f-in
sure
d em
ploy
ers
and
bysp
ecia
l fun
ds u
nder
the
LH
WC
A. S
ee A
ppen
dix
H fo
r m
ore
info
rmat
ion
abou
t fe
dera
l pro
gram
s.
Sour
ce: N
atio
nal A
cade
my
of S
ocia
l Ins
uran
ce e
stim
ates
bas
ed o
n da
ta r
ecei
ved
from
sta
te a
genc
ies,
the
U.S
. Dep
artm
ent
of L
abor
, A.M
. Bes
t, an
d th
e N
atio
nal C
ounc
il on
Com
pens
atio
n In
sura
nce.

58 NATIONAL ACADEMY OF SOCIAL INSURANCE
Tab
le D
3
Wor
kers
’ Com
pens
atio
n B
enef
its
by T
ype
of I
nsur
er a
nd M
edic
al B
enef
its,
by
Stat
e, 2
001
(in
thou
sand
s)
Priv
ate
Stat
eSe
lf-M
edic
alPe
rcen
tSt
ate
Tota
lC
arri
ersa
Fund
sIn
sure
dbB
enef
itsM
edic
al
Ala
bam
a$5
62,7
73$
304,
347
$ $2
58,4
25$
342,
729
60.9
c
Ala
ska
163,
111
125,
678
037
,434
86,1
2352
.8c
Ari
zona
436,
037
206,
979
148,
810
80,2
4826
7,72
661
.4c
Ark
ansa
s21
7,71
915
2,33
10
65,3
8813
3,24
461
.2c
Cal
iforn
ia10
,082
,580
5,57
3,93
01,
544,
302
2,96
4,34
84,
690,
006
46.5
Col
orad
o56
6,35
430
7,51
611
7,80
914
1,02
924
6,93
043
.6c
Con
nect
icut
641,
341
450,
892
019
0,44
926
8,08
041
.8c
Del
awar
e13
8,37
193
,723
044
,647
64,3
3446
.5d
Dist
rict
of C
olum
bia
91,1
4874
,570
016
,578
36,1
8639
.7c
Flor
ida
3,03
3,95
52,
441,
956
059
1,99
91,
720,
253
56.7
c
Geo
rgia
1,02
9,37
471
5,16
40
314,
209
497,
188
48.3
c
Haw
aii
248,
100
163,
287
9,18
275
,631
97,2
5539
.2c
Idah
o17
9,64
082
,400
87,8
299,
411
100,
957
56.2
c
Illin
ois
2,07
9,76
81,
583,
265
049
6,50
393
3,81
644
.9c
Indi
ana
524,
111
443,
079
081
,032
342,
768
65.4
c
Iow
a39
0,23
531
8,27
10
71,9
6518
0,28
946
.2c
Kan
sas
340,
483
240,
527
099
,956
194,
416
57.1
c
Ken
tuck
y67
1,87
543
1,88
443
,755
196,
237
372,
891
55.5
c
Loui
sian
a58
7,85
531
0,40
713
2,80
414
4,64
331
0,97
552
.9c
Mai
ne24
5,14
597
,219
60,9
2687
,000
109,
825
44.8
c
Mar
ylan
d68
1,63
340
8,59
315
7,70
911
5,33
128
8,33
142
.3c
Mas
sach
uset
ts88
1,41
774
6,40
90
135,
008
286,
093
32.5
Mic
higa
n1,
477,
986
809,
463
066
8,52
348
2,60
232
.7M
inne
sota
904,
451
610,
309
91,6
2220
2,52
043
0,61
047
.6M
issis
sipp
i28
4,72
918
3,23
80
101,
491
156,
031
54.8
c
Mis
sour
i95
8,70
860
9,40
091
,486
257,
822
508,
256
53.0
c
Mon
tana
179,
613
79,4
4670
,987
29,1
8095
,195
53.0
c
Neb
rask
a24
7,61
618
3,66
80
63,9
4814
1,88
457
.3c
Nev
ada
309,
321
210,
299
099
,022
126,
504
40.9
c
New
Ham
pshi
re21
5,15
816
7,09
60
48,0
6212
2,21
056
.8c

Workers’ Compensation: Benefits, Coverage, and Costs, 2004 • 59
New
Jer
sey
1,25
5,97
41,
135,
842
012
0,13
258
3,94
946
.5d
New
Mex
ico
159,
050
81,8
8421
,218
55,9
4893
,204
58.6
c
New
Yor
k2,
978,
224
1,44
0,90
479
7,10
974
0,21
191
3,24
430
.7N
orth
Car
olin
a90
5,25
370
5,18
80
200,
065
405,
553
44.8
c
Nor
th D
akot
aa71
,267
468
70,7
990
38,1
3853
.5O
hioa
2,24
8,36
933
,376
1,76
2,62
245
2,37
199
9,43
544
.5O
klah
oma
526,
070
292,
480
120,
815
112,
775
250,
935
47.7
c
Ore
gon
472,
691
253,
207
179,
395
40,0
8922
5,94
647
.8c
Penn
sylv
ania
2,40
6,27
21,
700,
651
144,
523
561,
097
943,
970
39.2
Rho
de I
sland
135,
703
53,6
3664
,273
17,7
9441
,525
30.6
c
Sout
h C
arol
ina
532,
374
367,
262
39,4
4412
5,66
824
3,82
745
.8c
Sout
h D
akot
a70
,660
68,2
100
2,45
043
,173
61.1
c
Tenn
esse
e84
3,06
264
5,67
60
197,
386
435,
863
51.7
c
Texa
s2,
212,
275
1,62
3,70
224
6,19
234
2,38
11,
334,
002
60.3
c
Uta
h19
7,60
673
,614
87,5
2236
,470
131,
606
66.6
c
Ver
mon
t97
,654
81,2
460
16,4
0944
,042
45.1
c
Vir
gini
a60
4,38
346
8,58
80
135,
794
340,
872
56.4
c
Was
hing
tona
1,63
8,99
727
,538
1,18
7,23
542
4,22
456
4,06
134
.4W
est V
irgi
niaa
713,
130
633
615,
581
96,9
1619
2,55
827
.0W
isco
nsin
923,
761
787,
332
013
6,42
953
6,70
558
.1c
Wyo
min
ga10
0,07
63,
017
97,0
590
67,5
6767
.5d
Non
-fed
eral
tot
al$
47,4
63,4
57$
27,9
69,8
02$
7,99
1,00
8$
11,5
02,6
48$
22,0
63,8
8246
.5Fe
dera
le3,
069,
267
780,
176
25.4
Fede
ral e
mpl
oyee
s2,
223,
088
623,
057
28.0
TO
TA
L50
,532
,724
22,8
44,0
5845
.2
(a)
Stat
es w
ith e
xclu
sive
fund
s (O
hio,
Nor
th D
akot
a, W
ashi
ngto
n, W
est V
irgi
nia,
and
Wyo
min
g) m
ay h
ave
smal
l am
ount
s of
ben
efits
pai
d in
the
pri
vate
car
rier
cat
egor
y. T
his
resu
lts fr
omtw
o so
urce
s: co
mpa
nies
with
gro
up p
olic
ies
that
ove
rlap
stat
es a
nd t
he fa
ct t
hat
som
e co
mpa
nies
incl
ude
exce
ss w
orke
rs’ c
ompe
nsat
ion
cove
rage
in t
heir
rep
orts
of w
orke
rs’ c
ompe
nsa-
tion
bene
fits
to A
.M. B
est.
(b)S
elf-
insu
ranc
e in
clud
es in
divi
dual
sel
f-in
sure
rs a
nd g
roup
sel
f-in
sura
nce.
(c)
Med
ical
per
cent
ages
bas
ed o
n da
ta p
rovi
ded
by N
CC
I, s
ee A
ppen
dix
F.(d
)Med
ical
per
cent
age
base
d on
the
wei
ghte
d av
erag
e of
sta
tes
whe
re m
edic
al d
ata
wer
e av
aila
ble.
(e)
Fede
ral b
enef
its in
clud
e: t
hose
pai
d un
der
the
Fede
ral E
mpl
oyee
s’ C
ompe
nsat
ion
Act
for
civi
lian
empl
oyee
s; th
e po
rtio
n of
the
Bla
ck L
ung
bene
fit p
rogr
am t
hat
is fi
nanc
ed b
y em
ploy
-er
s; an
d a
port
ion
of b
enef
its u
nder
the
Lon
gsho
re a
nd H
arbo
r W
orke
rs’ C
ompe
nsat
ion
Act
tha
t ar
e no
t re
flect
ed in
sta
te d
ata,
nam
ely,
ben
efits
pai
d by
sel
f-in
sure
d em
ploy
ers
and
bysp
ecia
l fun
ds u
nder
the
LH
WC
A. S
ee A
ppen
dix
H fo
r m
ore
info
rmat
ion
abou
t fe
dera
l pro
gram
s.
Sour
ce: N
atio
nal A
cade
my
of S
ocia
l Ins
uran
ce e
stim
ates
bas
ed o
n da
ta r
ecei
ved
from
sta
te a
genc
ies,
the
U.S
. Dep
artm
ent
of L
abor
, A.M
. Bes
t, an
d th
e N
atio
nal C
ounc
il on
Com
pens
atio
n In
sura
nce.

60 NATIONAL ACADEMY OF SOCIAL INSURANCE
Tab
le D
4
Wor
kers
’ Com
pens
atio
n B
enef
its
by T
ype
of I
nsur
er a
nd M
edic
al B
enef
its,
by
Stat
e, 2
000
(in
thou
sand
s)
Priv
ate
Stat
eSe
lf-M
edic
alPe
rcen
tSt
ate
Tota
lC
arri
ersa
Fund
sIn
sure
dbB
enef
itsM
edic
al
Ala
bam
a$5
29,1
89$3
04,9
64$0
$224
,225
$315
,040
59.5
c
Ala
ska
139,
378
109,
467
029
,911
74,5
3153
.5c
Ari
zona
497,
955
230,
991
196,
364
70,5
9930
1,02
860
.5c
Ark
ansa
s21
3,96
916
2,14
70
51,8
2212
7,71
159
.7c
Cal
iforn
ia9,
449,
145
5,61
5,73
61,
173,
754
2,65
9,65
54,
306,
573
45.6
Col
orad
o81
0,30
133
9,52
126
4,63
620
6,14
435
6,63
444
.0c
Con
nect
icut
638,
435
452,
501
018
5,93
424
7,24
038
.7c
Del
awar
e13
7,73
788
,253
049
,483
62,3
0445
.2d
Dist
rict
of C
olum
bia
85,9
0963
,485
022
,424
43,9
9851
.2c
Flor
ida
2,57
6,87
52,
350,
035
022
6,84
01,
395,
609
54.2
c
Geo
rgia
964,
995
665,
212
029
9,78
244
6,48
146
.3c
Haw
aii
231,
359
153,
977
9,70
667
,676
89,3
4938
.6c
Idah
o11
3,59
850
,841
53,5
629,
195
63,7
8356
.1c
Illin
ois
1,94
8,33
01,
487,
042
046
1,28
885
8,97
344
.1c
Indi
ana
528,
901
447,
129
081
,772
343,
603
65.0
c
Iow
a34
2,93
028
0,79
10
62,1
4016
9,16
949
.3c
Kan
sas
322,
707
225,
234
097
,473
193,
093
59.8
c
Ken
tuck
y57
5,29
239
7,03
029
,797
148,
465
309,
219
53.7
c
Loui
sian
a54
6,54
428
3,91
311
7,00
114
5,63
127
2,72
849
.9c
Mai
ne24
4,71
410
5,09
950
,024
89,5
9110
4,86
442
.9c
Mar
ylan
d64
1,04
438
6,99
613
5,29
411
8,75
424
9,52
738
.9c
Mas
sach
uset
ts80
0,83
767
7,12
20
123,
716
246,
854
30.8
Mic
higa
n1,
474,
058
796,
329
067
7,72
947
2,35
532
.0M
inne
sota
797,
787
529,
436
88,0
7018
0,28
136
9,40
846
.3M
issis
sipp
i29
2,67
720
1,53
00
91,1
4816
3,79
056
.0c
Mis
sour
i77
9,78
650
7,71
360
,290
211,
782
376,
084
48.2
c
Mon
tana
154,
797
63,4
3766
,736
24,6
2481
,160
52.4
c
Neb
rask
a22
9,64
418
0,83
80
48,8
0612
6,34
055
.0c
Nev
ada
323,
567
219,
985
010
3,58
215
1,23
246
.7c
New
Ham
pshi
re17
8,52
214
1,19
70
37,3
2580
,753
45.2
d

Workers’ Compensation: Benefits, Coverage, and Costs, 2004 • 61
New
Jer
sey
1,18
2,64
41,
087,
702
094
,941
534,
961
45.2
d
New
Mex
ico
143,
592
74,7
5213
,865
54,9
7477
,197
53.8
c
New
Yor
k2,
909,
115
1,34
6,94
583
9,13
672
3,03
486
9,84
329
.9N
orth
Car
olin
a87
2,66
966
0,38
90
212,
280
387,
672
44.4
c
Nor
th D
akot
aa69
,966
432
69,5
340
37,8
6654
.1O
hioa
2,09
8,54
528
,216
1,63
0,45
343
9,87
687
1,62
341
.5O
klah
oma
485,
371
282,
357
110,
131
92,8
8222
3,42
146
.0c
Ore
gon
425,
460
235,
228
158,
660
31,5
7220
7,92
148
.9c
Penn
sylv
ania
2,37
8,82
81,
660,
330
154,
580
563,
919
906,
449
38.1
Rho
de I
sland
126,
721
56,5
7351
,451
18,6
9839
,040
30.8
c
Sout
h C
arol
ina
515,
381
355,
648
37,0
0412
2,73
023
1,26
744
.9c
Sout
h D
akot
a63
,165
60,9
680
2,19
737
,291
59.0
c
Tenn
esse
e78
0,53
461
2,99
20
167,
542
399,
744
51.2
c
Texa
s2,
160,
372
1,58
4,36
521
8,58
935
7,41
81,
292,
666
59.8
c
Uta
h17
2,87
066
,557
80,5
9625
,717
115,
513
66.8
c
Ver
mon
t10
1,98
586
,984
015
,001
48,8
6947
.9c
Vir
gini
a60
2,03
546
7,16
30
134,
872
315,
522
52.4
c
Was
hing
tona
1,52
6,51
420
,742
1,13
5,12
037
0,65
253
3,62
835
.0W
est V
irgi
niaa
693,
057
2,67
958
9,26
010
1,11
718
7,57
527
.1W
isco
nsin
768,
282
656,
232
011
2,05
045
3,27
559
.0W
yom
inga
89,0
4193
388
,108
058
,803
66.0
Non
-fed
eral
tot
al$4
4,73
7,13
0$2
6,86
6,14
0$7
,421
,719
$10,
449,
272
$20,
229,
579
45.2
Fede
rale
2,95
7,40
469
7,82
523
.6Fe
dera
l em
ploy
ees
2,11
8,85
954
2,50
525
.6To
tal
47,6
94,5
3420
,927
,404
43.9
(a)
Stat
es w
ith e
xclu
sive
fund
s (O
hio,
Nor
th D
akot
a, W
ashi
ngto
n, W
est V
irgi
nia,
and
Wyo
min
g) m
ay h
ave
smal
l am
ount
s of
ben
efits
pai
d in
the
pri
vate
car
rier
cat
egor
y. T
his
resu
lts fr
omtw
o so
urce
s: co
mpa
nies
with
gro
up p
olic
ies
that
ove
rlap
stat
es a
nd t
he fa
ct t
hat
som
e co
mpa
nies
incl
ude
exce
ss w
orke
rs’ c
ompe
nsat
ion
cove
rage
in t
heir
rep
orts
of w
orke
rs’ c
ompe
nsa-
tion
bene
fits
to A
.M. B
est.
(b)S
elf-
insu
ranc
e in
clud
es in
divi
dual
sel
f-in
sure
rs a
nd g
roup
sel
f-in
sura
nce.
(c)
Med
ical
per
cent
ages
bas
ed o
n da
ta p
rovi
ded
by N
CC
I, s
ee A
ppen
dix
F.(d
)Med
ical
per
cent
age
base
d on
the
wei
ghte
d av
erag
e of
sta
tes
whe
re m
edic
al d
ata
wer
e av
aila
ble.
(e)
Fede
ral b
enef
its in
clud
e: t
hose
pai
d un
der
the
Fede
ral E
mpl
oyee
s’ C
ompe
nsat
ion
Act
for
civi
lian
empl
oyee
s; th
e po
rtio
n of
the
Bla
ck L
ung
bene
fit p
rogr
am t
hat
is fi
nanc
ed b
y em
ploy
-er
s; an
d a
port
ion
of b
enef
its u
nder
the
Lon
gsho
re a
nd H
arbo
r W
orke
rs’ C
ompe
nsat
ion
Act
tha
t ar
e no
t re
flect
ed in
sta
te d
ata,
nam
ely,
ben
efits
pai
d by
sel
f-in
sure
d em
ploy
ers
and
bysp
ecia
l fun
ds u
nder
the
LH
WC
A. S
ee A
ppen
dix
H fo
r m
ore
info
rmat
ion
abou
t fe
dera
l pro
gram
s.
Sour
ce: N
atio
nal A
cade
my
of S
ocia
l Ins
uran
ce e
stim
ates
bas
ed o
n da
ta r
ecei
ved
from
sta
te a
genc
ies,
the
U.S
. Dep
artm
ent
of L
abor
, A.M
. Bes
t, an
d th
e N
atio
nal C
ounc
il on
Com
pens
atio
n In
sura
nce.
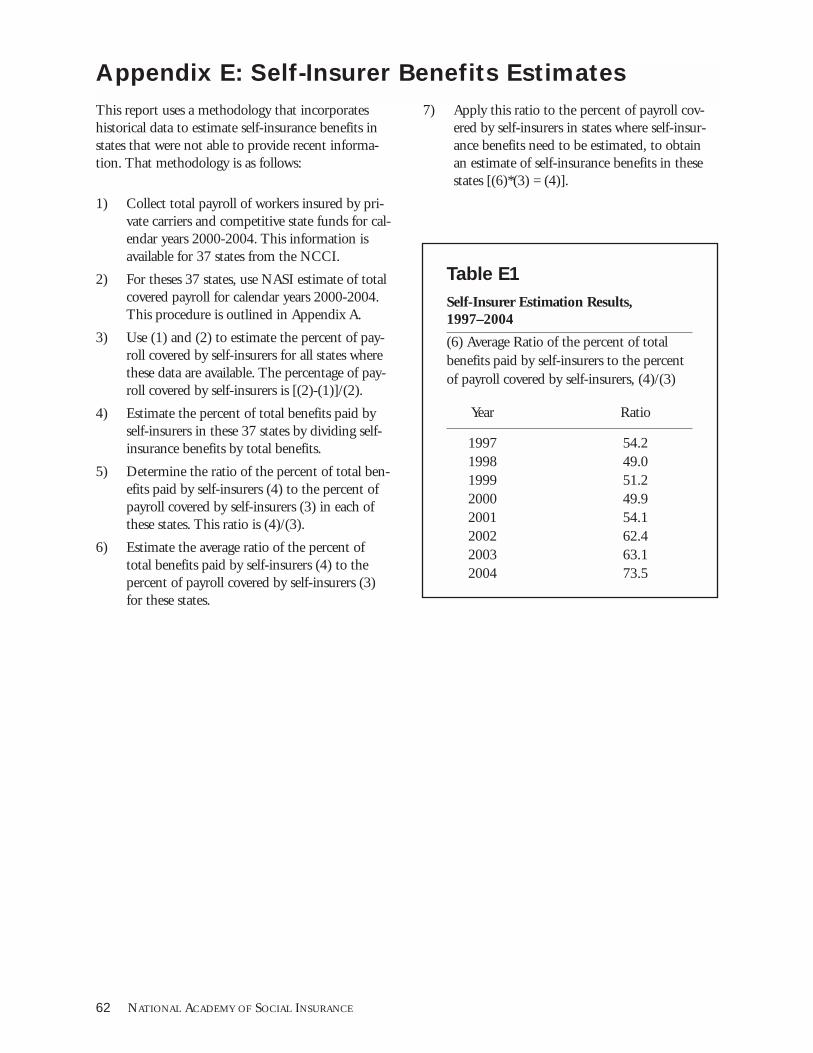
62 NATIONAL ACADEMY OF SOCIAL INSURANCE
This report uses a methodology that incorporateshistorical data to estimate self-insurance benefits instates that were not able to provide recent informa-tion. That methodology is as follows:
1) Collect total payroll of workers insured by pri-vate carriers and competitive state funds for cal-endar years 2000-2004. This information isavailable for 37 states from the NCCI.
2) For theses 37 states, use NASI estimate of totalcovered payroll for calendar years 2000-2004.This procedure is outlined in Appendix A.
3) Use (1) and (2) to estimate the percent of pay-roll covered by self-insurers for all states wherethese data are available. The percentage of pay-roll covered by self-insurers is [(2)-(1)]/(2).
4) Estimate the percent of total benefits paid byself-insurers in these 37 states by dividing self-insurance benefits by total benefits.
5) Determine the ratio of the percent of total ben-efits paid by self-insurers (4) to the percent ofpayroll covered by self-insurers (3) in each ofthese states. This ratio is (4)/(3).
6) Estimate the average ratio of the percent oftotal benefits paid by self-insurers (4) to thepercent of payroll covered by self-insurers (3)for these states.
7) Apply this ratio to the percent of payroll cov-ered by self-insurers in states where self-insur-ance benefits need to be estimated, to obtainan estimate of self-insurance benefits in thesestates [(6)*(3) = (4)].
Appendix E: Self-Insurer Benefits Estimates
Table E1
Self-Insurer Estimation Results,1997–2004
(6) Average Ratio of the percent of totalbenefits paid by self-insurers to the percentof payroll covered by self-insurers, (4)/(3)
Year Ratio
1997 54.21998 49.01999 51.22000 49.92001 54.12002 62.42003 63.12004 73.5

Workers’ Compensation: Benefits, Coverage, and Costs, 2004 • 63
Estimates by the National Academy of SocialInsurance (NASI) of the percent of total benefitspaid that were for medical care are based on reportsfrom state agencies and from estimates provided bythe National Council on Compensation Insurance(NCCI).
For 2004, we used the NCCI data for the medicalshare for thirty-seven states.
The National Council on Compensation Insurance(NCCI) is a national organization that assists privatecarriers and insurance commissioners in settingworkers’ compensation rates in selected states. NCCIprovided NASI estimates of the percent of private
carrier benefits paid that were for medical care inthirty-seven states. For nine states we used theagency information on medical share given to NASIby the state agencies. For 2004, we used these per-centages to estimate the share of total benefits(including self-insured benefits) that were for med-ical care in five jurisdictions for which state reportsof medical benefits were not available.
For five states, Delaware, New Jersey, West Virginia,Wisconsin and Wyoming neither state reports norNCCI estimates of medical benefits were available.For these states, the weighted average of the share oftotal benefits that were for medical care in the otherforty-six jurisdictions was used.
Appendix F: Medical Benefit Estimates

64 NATIONAL ACADEMY OF SOCIAL INSURANCE64 NATIONAL ACADEMY OF SOCIAL INSURANCE
NASI has six methods for estimating deductible ben-efits and total benefits, depending on what is report-ed by the state.
Method A:
State reports deductible amounts.
Method: Use deductible amount reported by state. Five States: Minnesota, North Dakota, Oregon,Pennsylvania, and South Carolina.
Method B:
States say deductibles are included in their totals, butdo not report amounts of deductibles.Method: Estimate deductibles by subtracting NetLosses Paid as reported by A.M. Best from statereport.
Thirteen States: Alabama, Alaska, California,Hawaii, Michigan, Missouri, Montana, Nevada,New Jersey, New Mexico, New York, South Dakotaand Virginia.
Note: Before using A.M. Best data, state fund andprivate carrier data are separated out from both datareported by A.M. Best and state agencies (where nec-essary, i.e., where A.M. Best or the state agency clas-sify as private carrier an entity that we classify as astate fund).
Method C:
State reports benefit amounts and report their totalsdo not include deductibles, which are allowed in thestate. State does not report deductible amounts.
Method: Estimate deductible amount, using a ratioof Manual Equivalent Premiums. Add the estimateto the state reported amount to estimate the totalstate private carrier benefits.
Two States: Arkansas and Maine.
Method D:
Deductibles are not allowed in the state.
Method: Use state reports as totals. Deductiblesequal zero.
Five States: Ohio, Washington, West Virginia,Wisconsin, and Wyoming.
Method E:
State does not report benefit amounts. Deductiblesare allowed.
Method: Use Net Losses Paid as reported by A.M.Best and add estimated deductibles, based on theratio of Manual Equivalent Premiums.
Twenty-six Jurisdictions: Arizona, Colorado,Connecticut, Delaware, the District of Columbia,Florida, Georgia, Idaho, Illinois, Indiana, Iowa,Kansas, Kentucky, Louisiana, Maryland,Massachusetts, Mississippi, Nebraska, NewHampshire, North Carolina, Oklahoma,Rhode Island, Tennessee, Texas, Utah and Vermont.
Appendix G: Deductible Benefit Estimates
Workers’ Compensation: Benefits, Coverage, and Costs, 2004 • 65
Various federal programs compensate certain cate-gories of workers for disabilities caused on the joband provide benefits to dependents of workers whodie of work-related causes. Each program isdescribed briefly below along with an explanation ofwhether and how it is included in our national totalsof workers’ compensation benefits. Our aim in thisreport is to include in national totals for workers’compensation those federally administered programsthat are financed by employers and that are not oth-erwise included in workers’ compensation benefitsreported by states, such as the benefits paid underthe Federal Employees’ Compensation Act. Programsthat cover private sector workers and are financed byfederal general revenues, such as the RadiationExposure Compensation Act, are not included in ournational totals for workers’ compensation benefitsand employer costs. More detail on these programs isin given below.
Federal Employees. The Federal Employees’Compensation Act of 1916, which superseded previ-ous workers’ compensation laws for federal employ-ees, provided the first comprehensive workers’ com-pensation program for federal civilian employees. In2004, total benefits were $2,445 million, of which29 percent were for medical care. The share of bene-fits for medical care is lower than in most state pro-grams because federal cash benefits, particularly forhigher-wage workers, replace a larger share of pre-injury wages than is the case in most state programs.Administrative costs of the program were $132 mil-lion in calendar year 2004, or 5.4 percent of totalbenefits (U.S. DOL, 2006a). Table H-1 reports ben-efits and administrative costs for federal civilianemployees under the Federal Employees’ Compensa-tion Act in 1997 through 2004. These benefits toworkers and costs to the federal government asemployer are included in national totals in thisreport, and are classified with federal programs.
Longshore and Harbor Workers. The Longshoreand Harbor Workers’ Compensation Act (LHWCA)requires employers to provide workers’ compensationprotection for longshore, harbor, and other maritimeworkers. The original program, enacted in 1927,covered maritime employees injured while workingover navigable waters because the Supreme Courtheld that the Constitution prohibits states fromextending coverage to such individuals. The program
also covers other workers who fall outside the juris-diction of state programs, such as employees on over-seas military bases, those working overseas for privatecontractors of the United States, and private employ-ees engaged in offshore drilling enterprises.
Private employers cover longshore and harbor work-ers by purchasing private insurance or self-insuring.In fiscal year 2004, about 300 self-insured employersand 250 insurance companies reported a total of22,646 lost-time injuries to the federal Office ofWorkers’ Compensation Programs. Total benefitspaid under the Act in 2004 were $747 million,which included $279 million paid by private insur-ance carriers, $322 million paid by self-insuredemployers, $135 million paid from the federallyadministered special fund for second injuries andother purposes, and $11 million for the District ofColumbia Workers’ Compensation Act (DCCA)Fund. Federal direct administrative costs were $12.6million or about 1.7 percent of benefits paid (TableH2). The Academy’s data series on benefits and costsof workers’ compensation includes at least part of thebenefits paid by private carriers under the LHWCAin the states where the companies operate. The bene-fits are not identified separately in the informationprovided by A.M. Best and state agencies. Benefitspaid by private employers who self-insure under theLongshore and Harbor Workers’ Compensation Actare not reported by states or A.M. Best. Conse-quently, these benefits and employer costs are includ-ed with federal programs in this report.
Table H-2 shows benefits reported to the U.S.Department of Labor by insurers and self-insuredemployers under the Longshore and HarborWorkers’ Compensation Act in 1997 through 2004.Ideally, benefits and employer costs under theLHWCA would be counted in the states where theemployee is located, because our estimates of coveredemployment and covered workers count these work-ers and wages in the states where they work. Webelieve that at least part of LHWCA benefits paidthrough private insurance carriers are included instate data that are reported to us by A.M. Best or thestates. At the same time, self-insured employersunder the LHWCA are not included in A.M. Bestdata and are unlikely to be included in state reports;benefits paid from the LHWCA special funds arenot included in state data. Thus, for 1997–2004
Appendix H: Federal Programs

66 NATIONAL ACADEMY OF SOCIAL INSURANCE66 NATIONAL ACADEMY OF SOCIAL INSURANCE66 NATIONAL ACADEMY OF SOCIAL INSURANCE
Table H1
Federal Employees’ Compensation Act, Benefits and Costs, 1997–2004 (in thousands)
1997 1998 1999 2000 2001 2002 2003 2004
Total Benefits $1,900,779 $2,009,862 $1,999,915 $2,118,859 $2,223,088 $2,317,325 $2,367,757 $2,445,077
Compensation Benefits 1,440,867 1,536,430 1,474,168 1,576,354 1,600,031 1,651,947 1,698,273 1,743,967
Medical Benefits 459,912 473,432 525,747 542,505 623,057 665,378 669,484 701,110
% Medical 24 24 26 26 28 29 28 29
Direct Administrative Costs 80,893 80,235 87,425 91,532 109,326 115,226 130,672 131,920
Total Costs 1,981,672 2,090,097 2,087,340 2,210,391 2,332,414 2,432,551 2,498,429 2,576,997
Indirect Administrative Costsa 6,835 5,750 5,584 6,197 5,056 4,596 4,806 4,587
(a) Includes legal and investigative support from the Office of the Solicitor and the Office of the Inspector General. Funded by GeneralRevenues.
Source: U.S. DOL 2006b.
Table H2
Longshore and Harbor Workers’ Compensation Act, Benefits and Costs, 1997–2004(in thousands)
1997 1998 1999 2000 2001 2002 2003 2004
Total Benefits $617,927 $642,321 $659,800 $671,991 $689,149 $700,563 $716,218 $747,358
Insurance Carriers 219,352 238,464 232,778 249,671 236,726 246,603 262,753 278,887
Self-Insured Employers 263,255 261,559 283,991 278,952 307,708 310,940 309,843 322,520
LHWCA Special Fund 123,772 129,777 131,152 131,564 133,374 131,684 132,504 135,073
DCCA Special Fund 11,548 12,521 11,879 11,804 11,341 11,336 11,118 10,878
Total Annual Assessments 121,300 122,000 141,300 145,700 145,000 136,000 135,800 148,500
LHWCA 110,000 111,000 130,000 133,000 133,000 125,000 125,000 137,000
DCCA 11,300 11,000 11,300 12,700 12,000 11,000 10,800 11,500
Administrative Expenses1 9,356 9,821 10,822 11,144 11,713 11,970 12,314 12,611
General Revenue 8,378 8,596 8,947 9,373 9,807 9,988 10,297 10,495
Trust Fund 978 1,225 1,875 1,771 1,906 1,982 2,017 2,116
Indirect Administrative Costs2 1,799 2,107 2,247 1,787 2,207 2,514 2,347 2,396
1 Longshore program administrative funding is divided between two sources. Industry oversight and claims activities are funded fromgeneral tax revenues. The program also exercises fiduciary responsibility for a Special Fund, which draws its revenue primarily fromannual industry assessments based on anticipated benefit liabilities. This Fund makes direct benefits payments for certain categories ofclaims and provides funding for the program’s rehabilitation staff and Special Fund oversight activities.
2 Includes legal and investigative support from the Office of the Solicitor and the Office of the Inspector General. Funded by GeneralRevenues.
Source: U.S. DOL 2006b.

data, our estimates of total federal benefits includebenefits paid by self-insured employers and the spe-cial funds under the LHWCA. Without other infor-mation, we assume that privately insured benefitsunder the program are included in state reports.Whether and how LHWCA benefits can be reflectedin state reports is a subject for analysis.
Coal Miners with Black Lung Disease. The BlackLung Benefits Act, enacted in 1969, provides com-pensation for coal miners with pneumoconiosis, orblack lung disease, and their survivors. The programhas two parts. Part B is financed by federal generalrevenues, and was administered by the SocialSecurity Administration until 1997 when adminis-tration shifted to the U.S. Department of Labor. PartC is paid through the Black Lung Disability TrustFund, which is financed by coal-mine operatorsthrough a federal excise tax on coal that is minedand sold in the United States. In this report, only thePart C benefits that are financed by employers areincluded in national totals of workers’ compensationbenefits and employer costs in 1997–2004. Totalbenefits in 2004 were $714 million, of which $371million was paid under Part B and $343 million waspaid under Part C. Part C benefits include $53 mil-lion for medical care.
Medical benefits are available only to Part C benefi-ciaries and only for diagnosis and treatment of blacklung disease. Medical benefits are a small share ofblack lung benefits because many of the recipients ofbenefits are deceased coal miners’ dependents, whosemedical care is not covered by the program. Federaldirect administrative costs were $38.1 million orabout 5.3 percent of benefit payments.
Table H-3 shows benefits under the Black LungBenefit program in 1997 through 2004 for bothparts of the program. Its benefits are paid directly bythe responsible mine operator or insurer or from thefederal Black Lung Disability Trust Fund. No dataare available on the experience of employers whoself-insure under the Black Lung program. Any suchbenefits and costs are not reflected in Table H-3 andare not included in national estimates.
Energy Employees. The Energy EmployeesOccupational Illness Compensation Program pro-vides lump-sum payments up to $150,000 to civilianworkers (and/or their survivors) who became ill as aresult of exposure to radiation, beryllium, or silica in
the production or testing of nuclear weapons. This isPart B of the program, which went into effect in July2001. It provides smaller lump-sum payments toindividuals found eligible for an award under theRadiation Exposure Compensation Act. Medicalbenefits are awarded for the treatment of coveredconditions. Total benefits in 2004 were $276 mil-lion, of which $250 million were paid as compensa-tion benefits (U.S. DOL, 2006b). These general rev-enue financed benefits are not included in ournational totals. Table H-4 provides information onPart B of the Energy Employees Occupational IllnessCompensation Program Act of 2000.
Workers Exposed to Radiation. The RadiationExposure Compensation Act of 1990 provides lump-sum compensation payments to individuals whocontracted certain cancers and other serious diseasesas a result of exposure to radiation released duringabove ground nuclear weapons tests or duringemployment in underground uranium mines. Thelump-sum payments are specified in law and rangefrom $50,000 to $100,000. From the beginning ofthe program through March 2006, 15,127 claimswere paid for a total of $1,003 million, or roughly$66,314 a claim (U.S. DOJ, 2006). The program isfinanced with federal general revenues and is notincluded in national totals in this report. Table H-5shows cumulative payments under the RadiationExposure Compensation Act since its enactment in1990.
Veterans of Military Service. U.S. military person-nel are covered by the federal veterans’ compensationprogram of the Department of Veterans Affairs,which provides cash benefits to veterans who sus-tained total or partial disabilities while on activeduty. In September 2005, 2.6 million veterans werereceiving monthly compensation payments for ser-vice- connected disabilities. Of these, 45 percent ofthe veterans had a disability rating of 30 percent orless, while the others had higher-rated disabilities.Total monthly payments for the disabled veteransand their dependents were $1.9 billion as ofSeptember 2005, or about $23.4 billion on an annu-al basis (U.S. Department of Veterans Affairs, 2005).Veterans’ compensation is not included in ournational estimates of workers’ compensation.
Table H-6 provides information on the Veterans’Compensation program. This program is somewhatsimilar to workers’ compensation in that it is
Workers’ Compensation: Benefits, Coverage, and Costs, 2004 • 67

financed by the employer (the federal government)and compensates for injuries or illness caused on thejob (the armed forces). It is different from otherworkers’ compensation programs in many respects.With cash benefits of about $23.4 billion in 2005,veterans’ compensation is about 78.3 percent of thesize of total cash benefits in other workers’ compen-sation programs, which were $29.9 billion in 2004.Because it is large and qualitatively different fromother programs, veterans’ compensation benefits arereported, but they are not included in national totalsto measure trends in regular workers’ compensationprograms.
Railroad Employees and Merchant Seamen.Finally, federal laws specify employee benefits forrailroad workers involved in interstate commerce andmerchant seamen. The benefits are not workers’compensation benefits and are not included in ournational totals. Instead, these programs providehealth insurance and short-term and long-term cashbenefits for ill or injured workers whether or nottheir conditions are work-related. Under federal laws,these workers also retain the right to bring tort suitsagainst their employers for negligence in the case ofwork-related injuries or illness (Williams and Barth,1973).
68 NATIONAL ACADEMY OF SOCIAL INSURANCE68 NATIONAL ACADEMY OF SOCIAL INSURANCE68 NATIONAL ACADEMY OF SOCIAL INSURANCE
Table H3
Black Lung Benefits Act, Benefits and Costs, 1997–2004 (In thousands)
1997 1998 1999 2000 2001 2002 2003 2004
Total Benefits $1,095,585 $1,000,383 $982,787 $929,690 $872,787 $826,980 $771,149 $713,932
Part C Compensation 388,656 373,707 360,470 346,903 332,620 316,585 303,724 289,699
Medical Benefits 92,041 80,450 74,776 69,322 61,136 65,756 59,739 52,992
Part B Compensation 614,888 546,226 547,541 513,465 479,031 444,639 407,686 371,241
Total Direct Administrative Costs 25,759 31,030 33,246 32,866 34,657 36,123 37,393 38,062
Part C (DOL) 25,759 26,698 29,023 28,591 29,897 31,488 31,991 32,157
Part B (SSA) * 4,332 4,223 4,275 4,760 4,635 5,402 5,905
Trust Fund Advances from
U.S. Treasuryb 370,000 360,000 402,000 490,000 505,000 465,000 525,000 497,000
Interest Payments on Past Advances 470,635 494,726 515,016 541,117 567,814 595,589 620,582 650,579
Coal Tax Revenues Received
by the Black Lung Trust Fund 635,342 634,270 569,704 512,799 511,520 588,000 480,080 577,575
Indirect Administrative Costsa 19,903 20,115 20,882 21,348 22,207 23,050 23,459 23,914
* information not available(a) Includes legal and investigative support from the Office of the Solicitor and the Office of the Inspector General, services provided by
the Department of the Treasury, and costs for the Office of Administrative Law Judges (OALJ) and the Benefits Review Board (BRB).(Note: OALJ and BRB costs are not included for any other program, but cannot be separately identified for Coal Mine Workers’Compensation).
(b) Total Trust Fund debt (cumulative advances) at the end of CY 2004 was $8,740,557,000. In the recent past, most, if not all, of theseadvances were necessary to pay interest charges on past debt.
Source: U.S. DOL 2006b.
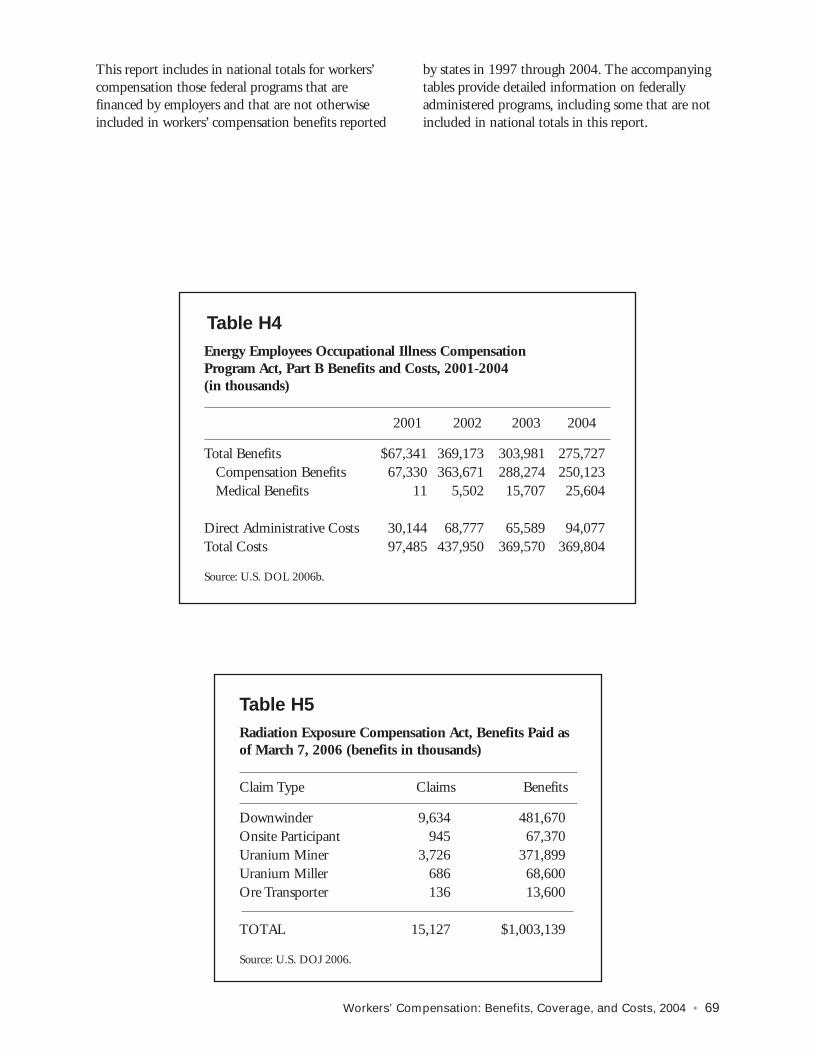
Workers’ Compensation: Benefits, Coverage, and Costs, 2004 • 69
This report includes in national totals for workers’compensation those federal programs that arefinanced by employers and that are not otherwiseincluded in workers’ compensation benefits reported
by states in 1997 through 2004. The accompanyingtables provide detailed information on federallyadministered programs, including some that are notincluded in national totals in this report.
Table H4
Energy Employees Occupational Illness Compensation Program Act, Part B Benefits and Costs, 2001-2004(in thousands)
2001 2002 2003 2004
Total Benefits $67,341 369,173 303,981 275,727Compensation Benefits 67,330 363,671 288,274 250,123Medical Benefits 11 5,502 15,707 25,604
Direct Administrative Costs 30,144 68,777 65,589 94,077Total Costs 97,485 437,950 369,570 369,804
Source: U.S. DOL 2006b.
Table H5
Radiation Exposure Compensation Act, Benefits Paid as of March 7, 2006 (benefits in thousands)
Claim Type Claims Benefits
Downwinder 9,634 481,670Onsite Participant 945 67,370Uranium Miner 3,726 371,899Uranium Miller 686 68,600Ore Transporter 136 13,600
TOTAL 15,127 $1,003,139
Source: U.S. DOJ 2006.

70 NATIONAL ACADEMY OF SOCIAL INSURANCE70 NATIONAL ACADEMY OF SOCIAL INSURANCE70 NATIONAL ACADEMY OF SOCIAL INSURANCE
Table H6
Federal Veterans’ Compensation Program, Compensation Paid in September, 2005(benefits in thousands)
Class of Dependent Number Monthly Value
Veteran Recipients - total 2,636,979 $1,953,621
Veterans less than 30 percent disabled (no dependency benefit) 1,199,271 171,956Veterans 30 percent or more disabled 1,437,708 1,781,665
Without dependents 455,347 525,079With dependents 982,361 1,256,586
Spouse only 666,815 890,165Spouse, child or children 247,650 282,806Spouse, child or children, and parents or parents 847 1,584Spouse, parent or parents 1,160 2,374Child or children only 63,208 74,149Child or children, and parent or parents 374 672Parent or parents only 2,307 4,837
Total dependents on whose account additional compensation was being paid 1,465,485 -
Spouse 916,472 - Children 543,849 - Parents 5,164 -
Source: U.S. Department of Veterans Affairs 2005, Table 12.
Workers’ Compensation: Benefits, Coverage, and Costs, 2004 • 71
ReferencesA.M. Best. 2005. Private data request. Oldwick, NJ:A.M. Best.
American Association of State CompensationInsurance Funds (AASCIF), AASCIF Fact Book,2005, www.aascif.org
Azaroff, Lenore S., Charles Levenstein, and DavidWegman. 2002. “Occupational Injury and IllnessSurveillance: Conceptual Filters ExplainUnderreporting.” American Journal of Public Health,92, no. 9 (September): 1421–1429. Washington,DC: American Journal of Public Health.
Barth, Peter. 2004. “Compensating Workers forPermanent Partial Disabilities.” Social SecurityBulletin, 65, no.4.
Barth, Peter, Mike Helvacian, and Te-Chun Liu.2002. Who Obtains Permanent Partial DisabilityBenefits: A Six State Analysis. Cambridge, MA:Workers Compensation Research Institute.
Barth, Peter, and Michael Niss. 1999. PermanentPartial Disability Benefits: Interstate Differences.Cambridge, MA: Workers Compensation ResearchInstitute.
Biddle, Jeff, Karen Roberts, Kenneth D. Rosenman,and Edward M. Welch. 1998. “What Percentage ofWorker with Work-Related Illness Receive Workers’Compensation Benefits?” Journal Of Occupationaland Environmental Medicine 40, no. 4 (April):325–331. East Lansing, MI: American College ofOccupational and Environmental Medicine.
Boden, Leslie I., and John W. Ruser. 2003.“Workers’ Compensation ‘Reforms,’ Choice ofMedical Care Provider, and Reported WorkplaceInjuries.” Review of Economics and Statistics 85, no. 4(November): 923-929. Cambridge, MA: The MITPress.
Burton Jr., John F. 1997. Workers’ Compensation,Twenty-Four-Hour Coverage, and Managed Care. InDisability: Challenges for Social Insurance, Health CareFinancing, and Labor Market Policy. Edited byVirginia P. Reno, Jerry L. Mashaw, and BillGradison. Washington, DC: National Academy ofSocial Insurance.
Burton Jr., John F. 2005. Permanent PartialDisability Benefits. In Workplace Injuries andDiseases: Prevention and Compensation; Essays inHonor of Terry Thomason. Edited by Karen Roberts,John F. Burton, Jr., and Matthew M. Bodah.Kalamazoo, MI: W.E. Upjohn Institute forEmployment Research.
Burton Jr., John F., and Emily Spieler. 2001.“Workers’ Compensation and Older Workers.”Health and Income Security for an Aging Workforce,no. 3. Washington, DC: National Academy of SocialInsurance.
Clayton, Ann. (2004) “ Workers’ Compensation: ABackground for Social Security Professionals.” SocialSecurity Bulletin 65, No. 4.
Centers for Medicare & Medicaid Services (CMS).2005. Private data request.
Hunt, H. Allan ed. 2004. Adequacy of EarningsReplacement in Workers’ Compensation Programs.Kalamazoo, MI: W.E. Upjohn Institute forEmployment Research and NASI.
Leigh, J. Paul, Steven Markowitz, Marianne Fahs,and Philip Landrigan. 2000. Costs of OccupationalInjuries and Illnesses. Ann Arbor, MI: The Universityof Michigan Press.
Leigh, J. Paul and John A. Robbins, (2004),“Occupational Disease and Workers’ Compensation:Coverage and Costs, and Consequences.” TheMilbank Quarterly, Vol. 82(4): pp 689-721.
Mashaw, Jerry L., and Virginia P. Reno. 1996. TheEnvironment of Disability Income Policy: Programs,People, History, and Context. Washington, DC:National Academy of Social Insurance
National Academy of Social Insurance (NASI).2002. “Workers’ Compensation Coverage: TechnicalNote on Estimates.” Workers’ Compensation DataFact Sheet, no. 2. Washington, DC: NationalAcademy of Social Insurance.
National Association of Insurance Commissioners(NAIC). 1998. Statistical Compilation of AnnualStatement Information for Property/Casualty InsuranceCompanies in 1997. Kansas City, MO: NAIC.

———. 1999. Statistical Compilation of AnnualStatement Information for Property/Casualty InsuranceCompanies in 1998. Kansas City, MO: NAIC.———. 2000. Statistical Compilation of AnnualStatement Information for Property/Casualty InsuranceCompanies in 1999. Kansas City, MO: NAIC.———. 2001. Statistical Compilation of AnnualStatement Information for Property/Casualty InsuranceCompanies in 2000. Kansas City, MO: NAIC.———. 2002. Statistical Compilation of AnnualStatement Information for Property/Casualty InsuranceCompanies in 2001. Kansas City, MO: NAIC.———. 2003. Statistical Compilation of AnnualStatement Information for Property/Casualty InsuranceCompanies in 2002. Kansas City, MO: NAIC.———. 2004. Statistical Compilation of AnnualStatement Information for Property/Casualty InsuranceCompanies in 2003. Kansas City, MO: NAIC.———.2005 Statistical Compilation of AnnualStatement Information for Property/Casualty InsuranceCompanies in 2004. Kansas City, MO: NAIC
National Council on Compensation Insurance, Inc.(NCCI). 1996. Annual Statistical Bulletin, 1996Edition. Boca Raton, FL: NCCI.———. 1997. Annual Statistical Bulletin, 1997Edition. Boca Raton, FL: NCCI.———. 1998. Annual Statistical Bulletin, 1998Edition. Boca Raton, FL: NCCI.———. 1999. Annual Statistical Bulletin, 1999Edition. Boca Raton, FL: NCCI.———. 2000. Annual Statistical Bulletin, 2000Edition. Boca Raton, FL: NCCI.———. 2001. Annual Statistical Bulletin, 2001Edition. Boca Raton, FL: NCCI.———. 2002. Annual Statistical Bulletin, 2002Edition. Boca Raton, FL: NCCI.———. 2002b. Workers’ Compensation Issues Report2002, Boca Raton, FL: NCCI.———. 2003a. Annual Statistical Bulletin, 2003Edition. Boca Raton, FL: NCCI.———. 2003b. Private data request. Hoboken, NJ:NCCI.———. 2004a. Workers’ Compensation Issues Report2004, Boca Raton, FL: NCCI.———. 2004b. Annual Statistical Bulletin, 2004Edition. Boca Raton, FL: NCCI.———. 2004c. Calendar-Accident Year UnderwritingResults. Boca Raton, FL: NCCI.———. 2005. Annual Statistical Bulletin. BocaRaton, FL: NCCI.
Reno, Virginia, and June Eichner. 2000. “EnsuringHealth and Income Security for an AgingWorkforce.” Health and Income Security for an AgingWorkforce, no. 1. Washington, DC: NationalAcademy of Social Insurance.
Reville, Robert T and Robert F. Schoeni, (2005),“The Fraction of Disability Caused at Work,” SocialSecurity Bulletin, 65, no.4.
Rosenman, Kenneth D, Alice Kalush, Mary JoReilly, Joseph C. Gardiner, Matthew reeves andZhewui Luo. 2006. “ How Much Work-RelatedInjury and Illness is Missed By the Current NationalSurveillance System?” Journal of OccupationalEnvironmental Medicine, 48(4), pp357-365.
Shannon, Harry S., and Graham S. Lowe. 2002.“How Many Injured Workers Do Not File Claimsfor Workers’ Compensation Benefits?” AmericanJournal of Industrial Medicine 42:467–473.Hoboken, NJ: Wiley-Liss, Inc.
Shields, J., and D.C. Campbell. 2001.Nonsubscription to the Texas Workers’ CompensationSystem: 2001 Estimates. Texas Monitor 6, no. 4 (win-ter): 1-6. Austin, TX: Texas Research and OversightCouncil on Worker’s Compensation.
Social Security Administration (SSA). Office ofResearch, Evaluation, and Statistics. 2004a. AnnualStatistical Supplement, 2005. Washington, DC: SSA.———. 2005b. Unpublished data from the Officeof Disability. Baltimore, MD: SSA.———. 2005c. Unpublished data from the Officeof the Chief Actuary. Baltimore, MD: SSA.———. 2006. The 2005 Annual Report of the Boardof Trustees of the Federal Old Age and SurvivorsInsurance and Disability Insurance Trust Funds.Washington, DC: SSA.
TDI (Texas Department of Insurance) and Workers’Compensation Research Group. 2004. EmployerParticipation in the Texas Workers’ CompensationSystem: 2004 Estimates http://www.tdi.state.tx.us/wc/regulation/roc/pdf/wc0904est.pdf
Thomason, Terry, Timothy P. Schmidle, and John F.Burton Jr. 2001. Workers’ Compensation: Benefits,Costs, and Safety under Alternative InsuranceArrangements. Kalamazoo, MI: W.E. UpjohnInstitute for Employment Research.
72 NATIONAL ACADEMY OF SOCIAL INSURANCE72 NATIONAL ACADEMY OF SOCIAL INSURANCE72 NATIONAL ACADEMY OF SOCIAL INSURANCE

Workers’ Compensation: Benefits, Coverage, and Costs, 2004 • 73
U.S. Census Bureau. 1999. The Number of Firmsand Establishments, Employment, Annual Payroll,and Receipts in 1997 by Industry and EmploymentSize of Enterprise. Washington, DC: U.S. CensusBureau.
U.S. Chamber of Commerce. 2002. 2002 Analysis ofWorkers’ Compensation Laws. Washington, DC: U.S.Chamber of Commerce.
U.S. Department of Justice (U.S. DOJ). 2006.Private Data Request. Washington, DC: U.S. DOJ.
U.S. Department of Labor (U.S. DOL).Employment Standards Administration. Office ofWorkers’ Compensation Programs. ———2004. State Workers’ Compensation Laws.Washington, DC: U.S. DOL.———. 2005a. Bureau of Labor Statistics.Geographic Profile of Employment and Unemployment,2004. Washington, DC: U.S. DOL.2———. 2005b. Bureau of Labor Statistics. NationalCensus of Fatal Occupational Injuries in 2004. News.USDL 04-1830 (August). Washington, DC: U.S.DOL.———. 2005c. Bureau of Labor Statistics.Workplace Injuries and Illnesses in 2004. News.USDL 04-2486 (November). Washington, DC: U.S. DOL.———. 2005d. Bureau of Labor Statistics.Employee Benefits in Private Industry, 2004. News.USDL 04-2296 (November). Washington, DC: U.S. DOL.———. 2005e. ES 202 Report. Washington, DC:U.S. DOL.———. 2005f. Bureau of Labor Statistics. Lost-Worktime Injuries and Illnesses: Characteristics andResulting Days Away From Work, 2004. News. USDL05-521 (December). Washington, DC: U.S. DOL.
———. 2006a. Employment StandardsAdministration. Office of Workers’ CompensationPrograms. Private data request. Washington, DC:U.S. DOL.———. 2006b. Bureau of Labor Statistics.Employment, Hours, and Earnings from the CurrentEmployment Statistics survey (National)
U.S. Department of Veterans Affairs. VeteransBenefit Administration. 2004. VA AdministrativeReport, RCS 20-0239. Washington, DC: U.S.Department of Veterans Affairs.
U.S. Small Business Administration (U.S. SBA).Office of Advocacy. 2002. Employer Firms,Establishments, Employment, and Annual Payroll byFirm Size and State, 2002. Washington, DC: U.S.SBA.
Williams, C. Arthur and Peter S. Barth. 1973.Compendium on Workmens’ Compensation, NationalCommission on State Workmen’s Compensation Laws,Washington, DC: Government Printing Office.
Sengupta I, Virginia Reno and John F. Burton Jr.,and. 2005. Workers’ Compensation: Benefits, Coverage,and Costs, 2003. Washington, DC: NationalAcademy of Social Insurance.
Yates, Elizabeth, and John F. Burton Jr. 2005.“Workers’ Compensation Insurance IndustryIncreases Profitability in 2004.” Workers’Compensation Policy Review 5, no. 4 (July/August):2-8. Princeton, NJ: Workers’ Disability IncomeSystems.

74 NATIONAL ACADEMY OF SOCIAL INSURANCE74 NATIONAL ACADEMY OF SOCIAL INSURANCE74 NATIONAL ACADEMY OF SOCIAL INSURANCE


www.nasi.orgPrice $75.00ISBN: 1-884902-46-4<union bug>


