

Tackling Graduate Unemployment through Employment Subsidies: An Assessment of the SIVP Programme in Tunisia
Stijn Broecke
No
158 - October 2012
Correct citation: Broecke, Stijn (2012), Tackling Graduate Unemployment through Employment Subsidies: An
Assessment of the SIVP Programme in Tunisia, Working Paper Series N° 158 African Development Bank, Tunis,
Tunisia.
Steve Kayizzi-Mugerwa (Chair) Anyanwu, John C. Faye, Issa Ngaruko, Floribert Shimeles, Abebe Salami, Adeleke Verdier-Chouchane, Audrey
Coordinator
Working Papers are available online at
http:/www.afdb.org/
Copyright © 2012
African Development Bank
Angle de l’avenue du Ghana et des rues
Pierre de Coubertin et Hédi Nouira
BP 323 -1002 TUNIS Belvédère (Tunisia)
Tel: +216 71 333 511
Fax: +216 71 351 933
E-mail: [email protected]
Salami, Adeleke
Editorial Committee Rights and Permissions
All rights reserved.
The text and data in this publication may be
reproduced as long as the source is cited.
Reproduction for commercial purposes is
forbidden.
The Working Paper Series (WPS) is produced
by the Development Research Department
of the African Development Bank. The WPS
disseminates the findings of work in progress,
preliminary research results, and development
experience and lessons, to encourage the
exchange of ideas and innovative thinking
among researchers, development
practitioners, policy makers, and donors. The
findings, interpretations, and conclusions
expressed in the Bank’s WPS are entirely
those of the author(s) and do not necessarily
represent the view of the African Development
Bank, its Board of Directors, or the countries
they represent.
Tackling Graduate Unemployment through Employment Subsidies:
An Assessment of the SIVP Programme in Tunisia
By Stijn Broecke1
1 Development Research Department, African Development Bank. The author is grateful to the Observatoire National de
l’Emploi et des Qualifications (ONEQ) for granting access to the data as well as for clarifications about the SIVP
programme. Loubna Bourkane, Ousman Gajigo and Amadou B. Diallo provided useful comments on earlier drafts.
AFRICAN DEVELOPMENT BANK GROUP
Working Paper No. 158 October 2012
Office of the Chief Economist

Abstract
High unemployment and disillusioned
youth lie at the basis of the ‘Arab
Spring’ which has recently swept
through much of the Middle East and
Northern Africa. Despite changes in
governments, the root problem has not
been solved and political leaders, aware
of the delicate and potentially explosive
situation, have put the issue high up the
policy agenda. This paper evaluates
Tunisia’s largest labour market
programme, the SIVP: an employment
subsidy aimed at university graduates.
Using a tracer survey of the 2004
graduating cohort, a range of matching
techniques are applied to estimate the
effect of the programme on a number of
labour market outcomes. Although
selection into the programme is not
random, we cannot rule out that
graduates who benefited from a SIVP
have better labour market outcomes
than those who did not: they are less
likely to be inactive, and less likely to be
unemployed – an effect which is
particularly strong for graduates at
highest risk of being unemployed. The
results do indicate, however, that the
programme is poorly targeted and hence
not very cost-effective. The paper ends
with recommendations for re-designing
the policy, as well as pointers for future
research.
Keywords: graduate unemployment, employment subsidy, MENA
JEL classification: J08, J20
5
1. Introduction
On 17th December 2010, Mohamed Bouazizi, a street vendor in the rural town of Sidi Bouzid in Tunisia,
set himself on fire. His death two weeks later sparked demonstrations and riots across the country which
led to the Tunisian revolution and the Arab Spring more widely. Although it was later denied (including
by his own family members) that he had a university degree, his desperate act was blamed at least in part
on the high level of graduate unemployment in the country. Irrespective of the truth regarding Mohamed
Bouazizi’s qualifications, it is widely agreed that the level of unemployment among university graduates
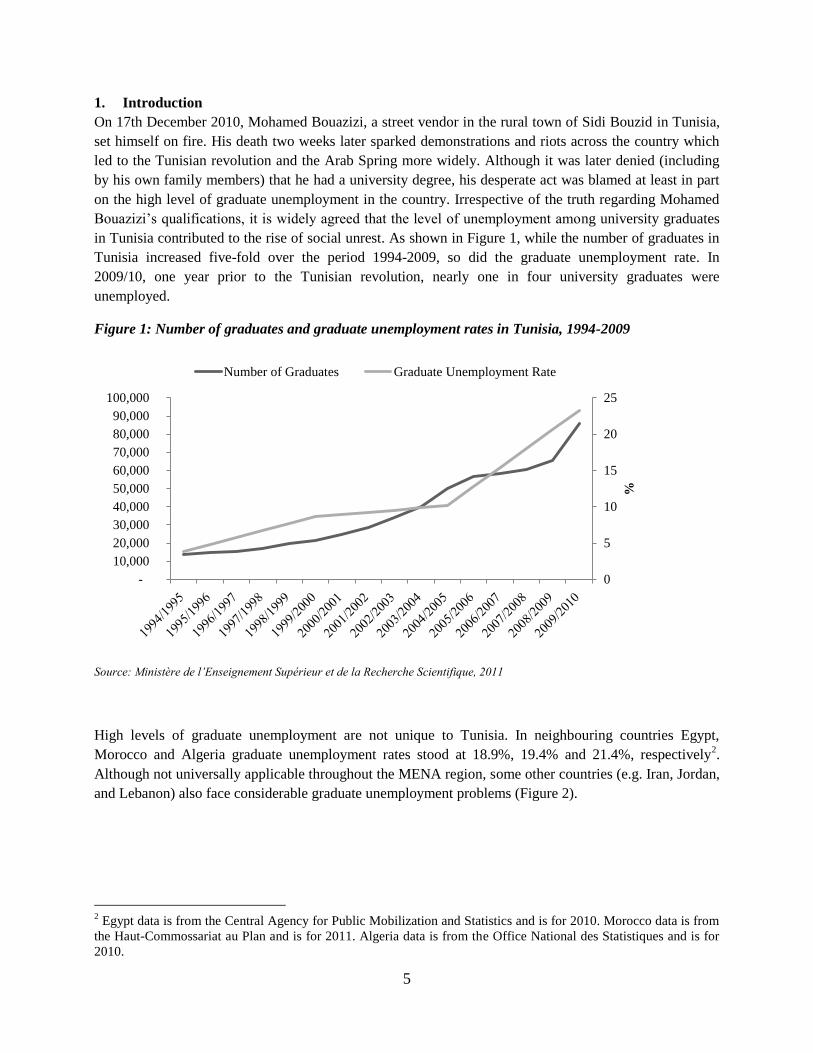
in Tunisia contributed to the rise of social unrest. As shown in Figure 1, while the number of graduates in
Tunisia increased five-fold over the period 1994-2009, so did the graduate unemployment rate. In
2009/10, one year prior to the Tunisian revolution, nearly one in four university graduates were
unemployed.
Figure 1: Number of graduates and graduate unemployment rates in Tunisia, 1994-2009
Source: Ministère de l’Enseignement Supérieur et de la Recherche Scientifique, 2011
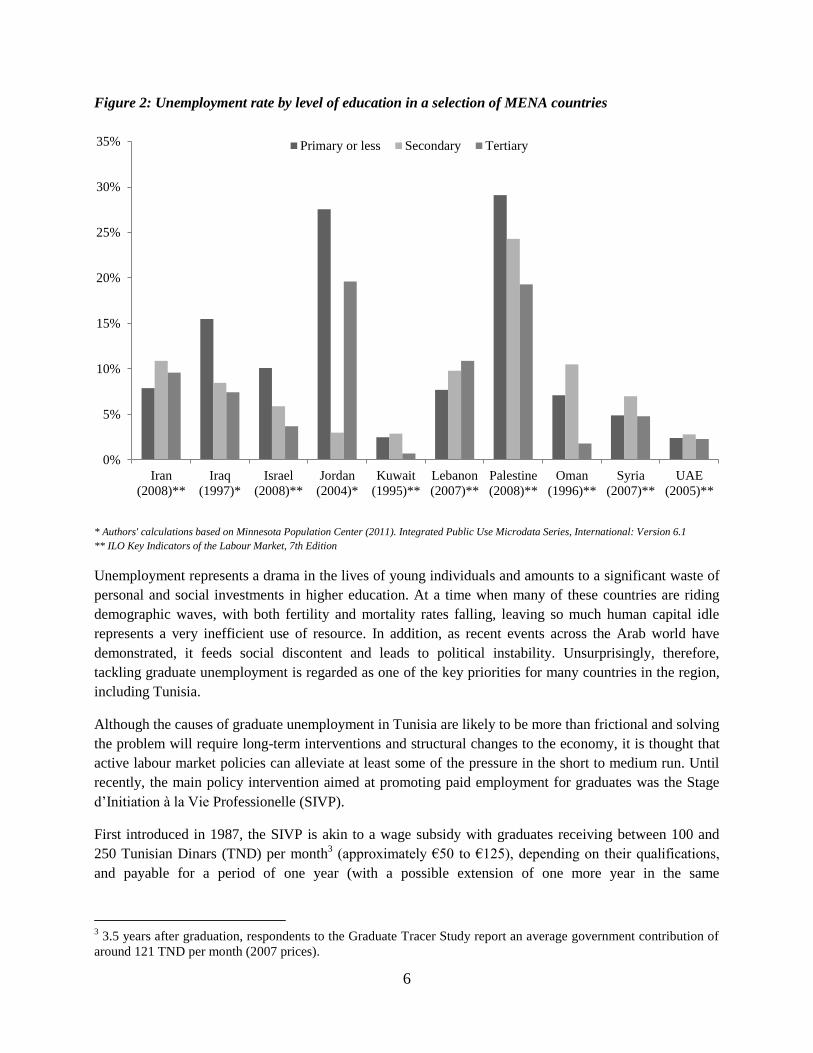
High levels of graduate unemployment are not unique to Tunisia. In neighbouring countries Egypt,
Morocco and Algeria graduate unemployment rates stood at 18.9%, 19.4% and 21.4%, respectively2.
Although not universally applicable throughout the MENA region, some other countries (e.g. Iran, Jordan,
and Lebanon) also face considerable graduate unemployment problems (Figure 2).
2 Egypt data is from the Central Agency for Public Mobilization and Statistics and is for 2010. Morocco data is from
the Haut-Commossariat au Plan and is for 2011. Algeria data is from the Office National des Statistiques and is for
2010.
0
5
10
15
20
25
-
10,000
20,000
30,000
40,000
50,000
60,000
70,000
80,000
90,000
100,000
%
Number of Graduates Graduate Unemployment Rate
6
Figure 2: Unemployment rate by level of education in a selection of MENA countries
* Authors' calculations based on Minnesota Population Center (2011). Integrated Public Use Microdata Series, International: Version 6.1
** ILO Key Indicators of the Labour Market, 7th Edition
Unemployment represents a drama in the lives of young individuals and amounts to a significant waste of
personal and social investments in higher education. At a time when many of these countries are riding
demographic waves, with both fertility and mortality rates falling, leaving so much human capital idle
represents a very inefficient use of resource. In addition, as recent events across the Arab world have
demonstrated, it feeds social discontent and leads to political instability. Unsurprisingly, therefore,
tackling graduate unemployment is regarded as one of the key priorities for many countries in the region,
including Tunisia.
Although the causes of graduate unemployment in Tunisia are likely to be more than frictional and solving
the problem will require long-term interventions and structural changes to the economy, it is thought that
active labour market policies can alleviate at least some of the pressure in the short to medium run. Until
recently, the main policy intervention aimed at promoting paid employment for graduates was the Stage
d’Initiation à la Vie Professionelle (SIVP).
First introduced in 1987, the SIVP is akin to a wage subsidy with graduates receiving between 100 and
250 Tunisian Dinars (TND) per month3 (approximately €50 to €125), depending on their qualifications,
and payable for a period of one year (with a possible extension of one more year in the same
3 3.5 years after graduation, respondents to the Graduate Tracer Study report an average government contribution of
around 121 TND per month (2007 prices).
0%
5%
10%
15%
20%
25%
30%
35%
Iran
(2008)**
Iraq
(1997)*
Israel
(2008)**
Jordan
(2004)*
Kuwait
(1995)**
Lebanon
(2007)**
Palestine
(2008)**
Oman
(1996)**
Syria
(2007)**
UAE
(2005)**
Primary or less Secondary Tertiary

7
organisation4). Firms receive exemption from taxes and national insurance contributions and can top up
the graduate’s salary with a tax-free supplement5. To be eligible, graduates need to be registered with the
national employment agency (ANETI) and be looking for work. Eligible firms need to be part of the social
security system, have an intern-to-permanent-staff ratio not exceeding 40% and, in order to obtain any
new interns, need to demonstrate that they have absorbed half of their previous interns into their regular
headcount.
As with the number of graduates overall, the number of graduates benefiting from a SIVP has grown
rapidly over time, from under 15,000 in 2004 to just over 45,000 in 2011 (Figure 3). In 2010, the national
SIVP budget was approximately TND 45.5 million (or around €22 million).
Figure 3: Number of SIVP Beneficiaries, 2004-2011
Source: ANETI, 2011
Given the seriousness of graduate unemployment in Tunisia6 (and other countries in the MENA region),
the urgency to do something about it, and the importance of the SIVP in the Government’s employment
policies, an assessment of the programme is timely. Moreover, as a recent review of active labour market
programmes in the Arab-Mediterranean region concluded: “despite considerable international evidence,
there is little systematic analysis on the effectiveness of active labour market policies in Arab-
Mediterranean countries” (Angel-Urdinola, Semlali and Brodmann 2010)7. The purpose of this paper is to
contribute to this limited evidence base.
4 In some cases, graduates may be eligible for a second spell in another organisation.
5 In 2007, this supplement was on average 238 TND per month, according to the GTS data.
6 For a recent article discussing the issue of youth unemployment in Tunisia, see Stampini and Verdier-Chouchane
(2011) and for an in-depth analysis of graduate unemployment see Ministère de l’Emploi et de L’Insertion
Professionnelle des Jeunes and World Bank (2009). 7 The same review notes that “while ALMPs are widely used in AMCs, there are notable differences in their
provision and implementation: ALMPs are mostly provided in Tunisia, Morocco and Algeria, while in countries like
Egypt, Jordan and Syria programs are often provided by civil society, international organisations and line
ministries.”
2004 2005 2006 2007 2008 2009 2010 2011
-
5,000
10,000
15,000
20,000
25,000
30,000
35,000
40,000
45,000
50,000
8
Unsurprisingly, the key issue we face in assessing the SIVP is that selection into the programme is non-
random. The paper relies on a variety of matching methods to estimate the effect of the programme. The
dataset employed is a graduate tracer study of over 4,000 university graduates who qualified in 2004 and
were interviewed in both 2005 (one and a half years after graduation) and 2007 (three and a half years
after graduation). This dataset also contains a “calendar” recording monthly activities over the entire
period since graduation (44 months).
Although selection into the programme is not random (see Section 3), we cannot rule out that graduates
who benefited from a SIVP have better labour market outcomes than those who did not: they are less
likely to be inactive and less likely to be unemployed – and this effect is particularly strong for graduates
at the highest risk of unemployment. There is little evidence that SIVP beneficiaries end up in more
precarious employment (as measured by contract type) or worse-paid jobs – despite anecdotal evidence to
the contrary. We do find, however, that the programme is poorly targeted and hence not very cost-
effective.
The remainder of this paper proceeds as follows. Section 2 provides a brief review of the literature on the
effectiveness and design of employment subsidies. Section 3 describes the datasets used in this paper and
offers some descriptive statistics on the characteristics of SIVP beneficiaries. Section 4 uses multivariate
analysis to predict the probability of benefiting from a SIVP and, in doing so, addresses the issue of how
effectively the programme is targeted. Section 5 then estimates the impact of the programme on a range of
employment outcomes. Section 6 concludes and offers some recommendations on how to improve the
programme, as well as pointers for future research.
2. Literature review
The objective of employment subsidies (which usually take the form of either direct wage subsidies or
social security waivers) is to reduce the cost of hiring new employees and, as a result, increase the demand
for labour. Wage subsidies can be used either to keep on existing employees and avoid job losses, or to
encourage firms to hire new workers. In the latter case, if targeted exclusively at the unemployed and
provided only for a limited period of time, they are also sometimes referred to as “hiring vouchers”
(Brown, Merkl and Snower, 2011). They are often targeted at particular sub-groups8 and allow employers
to pre-test workers prior to committing to permanently hire them at full wage. They also provide workers
with an opportunity to gain valuable work experience. One key advantage of employment subsidies is that
they are flexible and can be scaled up relatively quickly, making them a particularly useful countercyclical
tool. As a result, there appears to be increasing interest in such programmes in developing countries that
are facing growing unemployment problems. The SIVP in Tunisia is one example at hand, but Morocco
(Idmaj) and Algeria (CTA) have similar programmes (Subrahmanyam, 2011), and South Africa is about to
launch one (Groh et al, 2012).
However, the evidence on the effectiveness of employment subsidies is mixed at best. In their review of
active labour market programs in developing and transition countries, Betcherman et al (2004) conclude
that the clear majority of subsidy programs do not appear to have net positive impacts on the longer-term
8 In particular, employers may be averse to hiring young workers based on the assumption that they are less
productive than workers in their prime. Subsidies to employers may encourage the hiring of young workers since
they compensate the employer’s (perceived) risk of low productivity until the worker can demonstrate his or her real
productivity (Isbell and Smith, 1991).

9
employability or earnings of participants. Whilst Kluve (2010) is more lenient in his conclusions and
argues that, although it has been shown that employment subsidies can have a beneficial impact on
individual employment probability, their effectiveness crucially depends on their design features because
deadweight losses (hiring from the target groups that would have occurred also in the absence of the
program) and substitution effects (the extent to which jobs created for the target groups replaces jobs for
other groups) can be important9. The best designed employment subsidies are those that are: targeted at
the long-term unemployed (Brown, Merkl and Snower, 2011); offered for a limited time period of time,
and combined with other programmes such as on the job training, counselling and job search assistance
(Kluve, 2006). Despite concerns from an economic perspective, employment subsidies are often popular
because there is a strong social element to these programmes.
The literature available about the evaluation of employment policies in Tunisia is scarce. According to
Stampini and Verdier-Chouchane (2011) most of the existing literature on employment in Tunisia adopts a
macroeconomic perspective. Ministère de l’Emploi et de L’Insertion Professionnelle des Jeunes and
World Bank (2009) provide an insight on the employment opportunities of a sample of university
graduates, but no evaluation of employment policies. In one of the only studies I am aware of, Marouani
(2009) provides a prospective cost-effectiveness analysis of the impact of alternative labour market
policies using a dynamic general equilibrium model. The main finding is that a wage subsidy targeted at
highly skilled intensive sectors is more effective than tax reductions or investment subsidies. However,
wage subsidies are not enough to reduce unemployment significantly.
3. Data and descriptive statistics
The graduate tracer study (GTS) data used in this paper consists of an initial sample of 4,763 individuals
who qualified in 2004 and were surveyed on two occasions: once in 2005 (1.5 years after graduation) and
then again in 2007 (3.5 years after graduation). The sample attrition over time was relatively low: 89%
responded to the first survey (n=4,250) and 79% (n=3,751) to the second. The surveys contain a range of
socio-demographic and labour market information on the graduates as well as month-by-month calendar
data on their main activity. The analysis presented here will be on the 3,751 graduates who responded to
both surveys, appropriately weighted to be representative of the original sample contacted.
Figure 4 below shows the main activity of graduates over a 44-month period covered by the survey. As
shown by the graph, the first six months of the calendar fall halfway through the academic year, so many
students are still inactive/studying (month 1 of the calendar coincides with February 2004). The initial
unemployment rate is very high (74% in month 9, or about three months after graduation for most students
in the survey), but falls steadily over time (to 35% in month 44). The proportion on SIVP at any one point
in time never exceeds 10%, and reaches a peak around month 18 (or around 15 months after graduation).
9 In addition, some authors (Burtless, 1985; Dubin and River, 1993) have found that such programmes could have a
stigmatising effect.

10
Figure 4: Main activity after graduation, by month
Table 1 below summarises some of the key characteristics of graduates by SIVP status. Women were
slightly less likely than men to have benefited from a SIVP in the first three and a half years (44 months)
after graduation10
, and SIVP recipients were marginally younger. The distribution of SIVP by governorate
of residence in 2004 shows a bias towards large urban areas (e.g.: Tunis, Ariana, Nabeul, Bizerte11
). Those
with a “good” or “satisfactory” degree (as opposed to those with just a “pass” or a “very good” degree) are
more likely to benefit from SIVP. And, at the major level, Social Science, Law and Language graduates
are considerably less likely to benefit, and those with Finance and Management degrees most likely to
benefit. Overall, therefore, these descriptive statistics suggest that the programme may not be targeting
those most in need – an issue explored in more depth in Section 4 below.
10
Once in receipt, women and men benefit from the programme for an equal period of time: the average length of a
SIVP in the data is just over 11 months. 11
A finding confirmed by World Bank (2012).
0%
10%
20%
30%
40%
50%
60%
70%
80%
90%
100%M
1
M3
M5
M7
M9
M1
1
M1
3
M1
5
M1
7
M1
9
M2
1
M2
3
M2
5
M2
7
M2
9
M3
1
M3
3
M3
5
M3
7
M3
9
M4
1
M4
3
Inactive
Unemployed
Employed
SIVP

11
Table 1: Characteristics of SIVP beneficiaries, GTS
no SIVP SIVP ALL
Gender: Female 57.7% 56.0% 57.2%
Age 28.0 27.8 28.0
Father’s Education: Primary or less 57.4% 54.3% 56.6%
Father’s Education: Secondary 30.3% 33.2% 31.1%
Father’s Education: Tertiary 12.3% 12.6% 12.4%
Internship 61.5% 76.0% 65.4%
Major: Architecture 0,2% 0,2% 0,2%
Major: Arts 1,6% 3,2% 2,0%
Major: Finance and Management 24,4% 39,1% 28,3%
Major: Engineering 8,3% 6,9% 7,9%
Major: Health and Social 5,1% 6,0% 5,3%
Major: IT and Media Studies 8,6% 8,7% 8,6%
Major: Law and Languages 17,2% 10,0% 15,3%
Major: Medicine 2,2% 2,2% 2,2%
Major: Other 8,5% 2,3% 6,9%
Major: Science 15,5% 16,5% 15,8%
Major: Social Science 8,6% 5,0% 7,6%
Degree Attainment: Pass 62.9% 58.3% 61.7%
Degree Attainment: Satisfactory 22.8% 24.1% 23.1%
Degree Attainment: Good 10.5% 13.9% 11.4%
Degree Attainment: Very Good 3.9% 3.7% 3.8%
Bac: Mathematics 21.6% 22.1% 21.8%
Bac: Technical 10.4% 12.8% 11.0%
Bac: Science 23.3% 29.2% 24.9%
Bac: Economics and Management 13.5% 17.5% 14.5%
Bac: Arts 31.2% 18.4% 27.8%
Governorate: Tunis 13,9% 20,0% 15,5%
Governorate: Ariana 5,9% 8,1% 6,5%
Governorate: Ben Arous 7,7% 7,8% 7,7%
Governorate: Manouba 3,2% 3,5% 3,3%
Governorate: Nabeul 5,5% 8,4% 6,3%
Governorate: Zaghouan 1,1% 1,1% 1,1%
Governorate: Bizerte 3,3% 4,3% 3,6%
Governorate: Beja 2,0% 1,1% 1,8%
Governorate: Jendouba 1,9% 1,2% 1,7%
Governorate: Le Kef 2,4% 1,4% 2,2%
Governorate: Siliana 2,3% 0,9% 1,9%
Governorate: Sousse 7,1% 4,8% 6,5%
Governorate: Monastir 5,6% 6,1% 5,7%
Governorate: Mahdia 3,3% 2,7% 3,1%
Governorate: Sfax 9,9% 10,6% 10,1%
Governorate: Kairouan 3,2% 1,6% 2,8%
Governorate: Kasserine 3,4% 0,8% 2,8%
Governorate: Sidi Bouzid 2,7% 2,6% 2,7%
Governorate: Gabes 3,8% 1,7% 3,2%
Governorate: Medenine 3,7% 3,6% 3,6%
Governorate: Tataouine 1,4% 0,2% 1,1%
Governorate: Gafsa 4,5% 3,5% 4,2%
Governorate: Tozeur 0,9% 1,3% 1,0%
Governorate: Kebili 1,4% 2,7% 1,7%

12
Table 2 describes some of the key outcome variables in the GTS data, by SIVP status. SIVP appears to
reduce the risk of joblessness and unemployment. There is no statistically significant effect on the
likelihood of working with a contract. However, those who benefited from SIVP are less likely to obtain
an open-ended contract. There is no statistically significant difference in salary, but SIVP beneficiaries are
more likely to end up working in the private sector, and less likely to work for very large organisations
(200+ employees).
Table 2: Employment outcomes of SIVP beneficiaries
No SIVP SIVP Difference P-value
Jobless 0.394 0.313 -0.081 0.000
Unemployed 0.328 0.266 -0.062 0.001
Contract 0.844 0.854 0.011 0.548
Open-ended contract 0.522 0.377 -0.145 0.000
Salary (monthly, TND) 552.6 530.7 -21.830 0.245
Firm type
Public administration 0.260 0.101 -0.159 0.000
Public body/enterprise 0.300 0.177 -0.123 0.001
Private national business 0.339 0.566 0.227 0.000
Private mixed/foreign 0.100 0.156 0.055 0.000
Firm size
None 0.013 0.013 0.000 0.978
<6 0.107 0.116 0.009 0.567
6-9 0.035 0.081 0.046 0.000
10-19 0.058 0.090 0.032 0.011
20-49 0.078 0.081 0.002 0.858
50-199 0.143 0.177 0.034 0.063
200+ 0.566 0.443 -0.123 0.000

13
4. Participation in SIVP
The descriptive statistics presented in the previous section suggested that participation in the SIVP is not
random, but also that the programme may not necessarily be targeting the graduates at highest risk of
being unemployed. This section presents the results of multivariate analysis to discover the factors that are
associated with increased likelihood of benefiting from the programme. In particular, it investigates
whether the risk of unemployment is at all related with the probability of participating in SIVP. In
addition, it documents differences in the timing of SIVP take-up, and the factors associated with that. The
results from this analysis suggest that SIVP take-up (and its timing) is not at all related to the risk factors
predicting graduate unemployment. If anything, individuals residing in the most unemployment-stricken
governorates are the least likely to benefit from a SIVP subsidy. All this suggests that the SIVP
programme should be revised to be better targeted on those who need them most.
4.1 Unemployment
This section starts with an analysis of the determinants of unemployment in the first six months after
graduation. In theory, graduates are not entitled to participate in the SIVP programme in the first six
months after graduation, so a variable is constructed measuring the number of months a graduate spent
unemployed in those first six months12
. The results of these regressions (with an increasing number of
explanatory variables as we move from left to right) are presented in Table 3 below. Women, older
students and graduates with less educated fathers are more likely to be unemployed. So are those
graduating with certain degrees (Finance and Management; IT and Media Studies: and Science), those
with worse degree outcomes, and those resident in certain governorates (Nabeul, Siliana, Gabes,
Tataouine and Gafsa).
4.2 Participation in SIVP
The next set of regressions estimate the characteristics associated with SIVP take-up. Although we would
hope that SIVP participation would be related to the likelihood of being unemployed (or with the
characteristics associated with unemployment risk), Table 4 demonstrates that this is far from so. In fact,
none of the characteristics associated with increased unemployment predict the likelihood of SIVP take-
up. Even the time spent unemployed in the first six months after graduation does not predict SIVP
participation. More surprisingly even, it is found that individuals residing in the governorates with the
highest likelihood of unemployment after graduation are also least likely to participate in the SIVP
programme. All this points to a serious miss-targeting of the SIVP employment subsidies.
4.3 Timing of SIVP participation
Not only does the allocation of SIVP subsidies not appear to be related to the likelihood of unemployment.
In addition, we find that the timing of SIVP take-up is negatively related to the risk of unemployment in
the first six months after graduation (see Table 5) – i.e. individuals least at risk of unemployment in the
first six months after graduation are quickest in obtaining a SIVP subsidised placement. Similarly, some of
the individuals residing in governorates associated with a high risk of graduate unemployment are likely to
face the longest delays in obtaining a SIVP (Nabeul, Kairouan, Sidi Bouzid and Gabes).
12
I have also experimented with a measure of joblessness rather than unemployment, and the main conclusions
drawn in this section remain essentially unchanged.

14
Table 3: Predicting unemployment after graduation
(i) (ii) (iii)
Gender: Female 0.33*** 0.32*** 0.34***
Age 0.06** 0.05* 0.05**
Father's Education: Secondary -0.51*** -0.49*** -0.38***
Father's Education: Tertiary -1.03*** -0.97*** -0.85***
Internship 0.06 0.01 0.00
Major: Arts 1.72 1.65 1.64
Major: Finance and Management 2.13* 1.99* 1.98*
Major: Engineering 1.39 1.35 1.33
Major: Health and Social 1.81 1.73 1.67
Major: IT and Media Studies 2.54** 2.49* 2.42*
Major: Law and Languages 1.86 1.64 1.63
Major: Medicine 0.99 0.98 1.05
Major: Other 1.08 0.91 0.77
Major: Science 2.35* 2.28* 2.09*
Major: Social Science 2.01* 1.89 1.81
Degree Attainment: Satisfactory -0.48*** -0.49*** -0.49***
Degree Attainment: Good -0.35* -0.39** -0.36*
Degree Attainment: Very good -0.32 -0.32 -0.26
Bac: Technical
0.57*** 0.56***
Bac: Experimental science
0.30* 0.32**
Bac: Economics and Management
0.57*** 0.51***
Bac: Arts
0.42** 0.36*
Governorate: Governorate: Ariana
-0.28
Governorate: Ben Arous
0.66***
Governorate: Manouba
0.31
Governorate: Nabeul
1.40***
Governorate: Zaghouan
-0.21
Governorate: Bizerte
0.68**
Governorate: Beja
0.54
Governorate: Jendouba
0.87**
Governorate: Le Kef
-0.45
Governorate: Siliana
1.44***
Governorate: Sousse
0.40*
Governorate: Monastir
-0.20
Governorate: Mahdia
0.25
Governorate: Sfax
-0.40*
Governorate: Kairouan
0.58*
Governorate: Kasserine
0.63*
Governorate: Sidi Bouzid
0.84**
Governorate: Gabes
1.50***
Governorate: Medenine
0.63**
Governorate: Tataouine
1.53***
Governorate: Gafsa
1.17***
Governorate: Tozeur
0.59
Governorate: Kebili 1.06*** * p<0.05; ** p<0.01; *** p<0.001; Omitted categories: Gender: Male; Father's Education: Primary; Major: Architecture; Degree Attainment:
Pass; Bac: Mathematics; Governorate: Tunis

15
Table 4: Predicting SIVP take-up
(i) (ii) (iii) (iv)
Months Unemployed -0.00 -0.00 0.00
Gender: Female -0.02 -0.02 -0.01 -0.01
Age -0.00 -0.00 -0.00 -0.00
Father's Education: Secondary 0.01 0.01 0.00 0.00
Father's Education: Tertiary -0.00 -0.00 -0.02 -0.02
Internship 0.09*** 0.08*** 0.08*** 0.08***
Major: Arts 0.19 0.21 0.22 0.23
Major: Finance and Management 0.15 0.17 0.18 0.19
Major: Engineering 0.00 0.00 0.01 0.01
Major: Health and Social 0.07 0.08 0.12 0.12
Major: IT and Media Studies 0.03 0.04 0.07 0.07
Major: Law and Languages 0.01 0.06 0.08 0.08
Major: Medicine 0.02 0.01 0.04 0.04
Major: Other -0.12 -0.08 -0.05 -0.04
Major: Science 0.07 0.06 0.09 0.09
Major: Social Science -0.00 0.03 0.05 0.05
Degree Attainment: Satisfactory 0.01 0.01 0.00 0.00
Degree Attainment: Good 0.05 0.04 0.03 0.03
Degree Attainment: Very good -0.02 -0.02 -0.02 -0.02
Bac: Technical
0.05 0.05 0.05
Bac: Experimental science
0.03 0.03 0.03
Bac: Economics and Management
-0.01 -0.02 -0.02
Bac: Arts
-0.04 -0.04 -0.04
Governorate: Governorate: Ariana
-0.02 -0.02
Governorate: Ben Arous
-0.08* -0.08*
Governorate: Manouba
-0.08 -0.08
Governorate: Nabeul
0.01 0.01
Governorate: Zaghouan
-0.04 -0.04
Governorate: Bizerte
-0.01 -0.01
Governorate: Beja
-0.17** -0.17**
Governorate: Jendouba
-0.15** -0.15**
Governorate: Le Kef
-0.16** -0.16**
Governorate: Siliana
-0.18*** -0.18***
Governorate: Sousse
-0.14*** -0.13***
Governorate: Monastir
-0.06 -0.06
Governorate: Mahdia
-0.09 -0.09
Governorate: Sfax
-0.06* -0.06*
Governorate: Kairouan
-0.19*** -0.19***
Governorate: Kasserine
-0.22*** -0.22***
Governorate: Sidi Bouzid
-0.07 -0.07
Governorate: Gabes
-0.21*** -0.21***
Governorate: Medenine
-0.09* -0.09*
Governorate: Tataouine
-0.27*** -0.27***
Governorate: Gafsa
-0.10* -0.10*
Governorate: Tozeur
0.01 0.02
Governorate: Kebili 0.08 0.08 * p<0.05; ** p<0.01; *** p<0.001; Omitted categories: Gender: Male; Father's Education: Primary; Major: Architecture; Degree Attainment:
Pass; Bac: Mathematics; Governorate: Tunis

16
Table 5: Predicting timing of SIVP take-up
(i) (ii) (iii) (iv)
Months Unemployed 0.95*** 0.96*** 0.90***
Gender: Female 1.09 0.89 1.01 1.35
Age 0.13 0.10 0.14 0.22
Father's Education: Secondary -0.19 -0.25 0.05 -0.26
Father's Education: Tertiary 0.61 0.34 0.51 -0.32
Internship -0.78 -0.64 -0.73 -0.72
Major: Arts 12.21 12.92 12.17 13.03
Major: Finance and Management 7.95 8.92 8.24 9.21
Major: Engineering 6.33 6.73 6.80 8.02
Major: Health and Social 4.42 4.58 3.18 3.56
Major: IT and Media Studies 6.36 7.05 6.56 8.35
Major: Law and Languages 7.96 8.91 8.30 9.21
Major: Medicine 6.21 5.50 5.58 6.69
Major: Other 7.04 7.74 7.13 8.06
Major: Science 8.49 9.00 8.54 10.18
Major: Social Science 10.60 11.25 10.32 11.40
Degree Attainment: Satisfactory -1.57 -1.50 -1.69* -1.90*
Degree Attainment: Good -0.69 -0.52 -0.52 -0.83
Degree Attainment: Very good -2.75 -2.41 -2.59 -3.10
Bac: Technical
-1.02 -1.10 -0.52
Bac: Experimental science
1.33 1.36 1.91*
Bac: Economics and Management
-1.85 -1.65 -0.81
Bac: Arts
-0.25 -0.02 0.29
Governorate: Governorate: Ariana
1.08 1.18
Governorate: Ben Arous
-1.85 -1.52
Governorate: Manouba
3.04 3.24
Governorate: Nabeul
2.05 3.41*
Governorate: Zaghouan
0.93 -0.09
Governorate: Bizerte
-1.95 -0.75
Governorate: Beja
2.63 2.67
Governorate: Jendouba
-0.45 -0.35
Governorate: Le Kef
0.76 0.10
Governorate: Siliana
0.76 1.44
Governorate: Sousse
2.09 2.40
Governorate: Monastir
-0.60 -0.98
Governorate: Mahdia
0.19 0.27
Governorate: Sfax
0.15 -0.30
Governorate: Kairouan
6.39* 7.07**
Governorate: Kasserine
-1.64 -0.78
Governorate: Sidi Bouzid
4.36* 5.07*
Governorate: Gabes
7.58** 9.01***
Governorate: Medenine
0.27 1.13
Governorate: Tataouine
0.37 0.46
Governorate: Gafsa
0.87 1.63
Governorate: Tozeur
4.00 4.17
Governorate: Kebili 0.82 1.93 * p<0.05; ** p<0.01; *** p<0.001; Omitted categories: Gender: Male; Father's Education: Primary; Major: Architecture; Degree Attainment:
Pass; Bac: Mathematics; Governorate: Tunis

17
5. The impact of SIVP on employment outcomes
This section tests the relationship between SIVP participation and a range of employment outcomes. This
is achieved by using a variety of estimation techniques (OLS and various matching algorithms). It is found
that SIVP has a positive outcome on the likelihood of having a job (particularly for those at highest risk of
unemployment), but there is less strong evidence that the programme has any effect on the likelihood of
having a contract, the type of contract, or on salaries. SIVP beneficiaries are less likely to find
employment with a large firm, and more likely to enter the private sector.
Table 6 below provides the results of a series of regression and matching estimates of the effect of SIVP
on labour market outcomes. The first row of each table presents the “raw” effect of the SIVP programme
on the outcomes of interest. SIVP beneficiaries are 8.1 percentage points and 6.2 percentage points less
likely to be jobless and unemployed, respectively. There is no statistically significant difference in the
likelihood of having a contract (conditional upon being in employment) but, when in receipt of a contract,
SIVP recipients appear to be less likely to have an open-ended one. We do not detect any statistically
significant effect of the programme on the salaries of workers. SIVP beneficiaries are less likely to find
employment with large firms, but more likely to find a job in the private sector.
The multivariate analysis slightly lowers the estimate of the effect of the programme on joblessness and
unemployment – but they remain statistically significant and relatively stable across all specifications.
Participation in the SIVP programme leads to an estimated reduction in the likelihood of joblessness of
around 7 percentage points, and an estimated fall in the probability of being unemployed of around 6
percentage points. The effects on working for a contract, having an open-ended contract, and salaries are
also considerably reduced in the multivariate/matching models – and most estimates have become
insignificant. So, although SIVP appears to increase the likelihood of obtaining a job, it does not appear to
have any impact on the quality of that job. The effect on the type of firm in which graduates find
employment holds up in the multivariate analysis.
Table 7 breaks down the analysis by the graduate’s unemployment experience in the first six months after
graduation, in order to explore heterogeneity in the programme’s impact by risk of unemployment. Two
sub-samples are taken: individuals who spent zero to one month unemployed; and individuals who spent
five to six months unemployed. 26% of those who spent zero or one month unemployed in the first six
months after graduation benefited from a SIVP. Similarly, 26% of those who spent five or six months
unemployed in the first six months after graduation benefited from a SIVP. The results are interesting and
suggest that, among the group experiencing the highest unemployment incidence immediately after
graduation, the SIVP has a much larger impact on both joblessness and unemployment. In this group,
SIVP beneficiaries are also significantly more likely to obtain a job with a contract. In the group
experiencing low unemployment in the first six months after graduation, the SIVP has some impact on
salaries (with SIVP beneficiaries earning higher salaries) as well as on the likelihood of working for a
large firm (the chance being lower). This suggests that focusing the SIVP on high risk groups only would
result in larger employment gains.

18
Table 6: Effect of SIVP on labour market outcomes
Joblessness T-stat Unemployment T-stat Contract T-stat Open-ended contract T-stat Salary T-stat Large Firm T-stat Private Sector T-stat
Descriptive
-0.081 -4.13
-0.062 -3.20
0.011 0.60
-0.145 -5.46
-21.83 -1.16
-0.14 -6.49
0.38 18.33
OLS
-0.067 -3.34
-0.055 -2.78
0.027 1.46
-0.031 -1.23
13.45 0.75
-0.11 -4.98
0.24 11.46
PSM
1 to 1 (no replacement)
-0.072 -3.01
-0.057 -2.41
0.013 0.60
-0.030 -0.94
35.47 2.13
-0.16 -6.12
0.27 11.01
Nearest Neigbour (3)
-0.075 -3.22
-0.059 -2.54
0.012 0.54
-0.030 -0.94
20.88 1.24
-0.14 -5.37
0.27 10.45
Radius Caliper (0.01)
-0.061 -2.97
-0.051 -2.51
0.023 1.19
-0.053 -1.88
2.54 0.14
-0.14 -5.61
0.24 10.63
Kernel
-0.064 -3.17
-0.056 -2.81
0.024 1.30
-0.052 -1.88
8.12 0.45
-0.13 -5.46
0.25 10.97
Local Linear
-0.063
-0.056
0.023
-0.049
5.22
-0.13
0.25
Mahalanobis Matching -0.084 -3.12 -0.078 -2.91 0.029 1.14 -0.038 -1.03 18.50 0.93 -0.12 -3.85 0.25 8.45

19
Table 7: Analysis by unemployment experience in first 6 months after graduation
LOW UNEMPLOYMENT Joblessness T-stat Unemployment T-stat Contract T-stat Open-ended contract T-stat Salary T-stat Large Firm T-stat Private Sector T-stat
Descriptive
-0.110 -3.47
-0.058 -1.98
0.015 0.54
-0.317 -7.87
-99.23 -4.24
-0.20 -5.14
0.40 10.94
OLS
-0.156 -4.73
-0.118 -3.74
0.048 1.63
-0.187 -4.34
-70.42 -3.17
-0.20 -4.95
0.24 6.45
PSM
1 to 1 (no replacement)
-0.145 -3.88
-0.092 -2.60
0.040 1.26
-0.172 -3.50
-116 -4.05
-0.21 -4.56
0.27 6.14
Nearest Neigbour (3)
-0.144 -3.65
-0.082 -2.15
0.049 1.42
-0.172 -3.16
-99 -2.56
-0.19 -3.87
0.24 5.06
Radius Caliper (0.01)
-0.124 -3.39
-0.074 -2.10
0.043 1.26
-0.148 -2.78
-95 -2.72
-0.20 -4.03
0.24 5.17
Kernel
-0.119 -3.40
-0.072 -2.14
0.033 1.04
-0.169 -3.48
-106 -3.42
-0.22 -4.83
0.26 5.97
Local Linear
-0.125
-0.074
0.037
-0.167
-106
-0.22
0.26
Mahalanobis Matching -0.125 -2.78 -0.104 -2.40 -0.009 -0.22 -0.212 -3.57 -96 -2.91 -0.21 -3.83 0.26 4.72
HIGH UNEMPLOYMENT Joblessness T-stat Unemployment T-stat Contract T-stat Open-ended contract T-stat Salary T-stat Large Firm T-stat Private Sector T-stat
Descriptive
-0.210 -8.20
-0.200 -7.71
0.103 4.32
-0.316 -9.63
-69.84 -2.79
-0.10 -3.23
0.35 11.61
OLS
-0.209 -7.77
-0.195 -7.17
0.138 5.35
-0.202 -5.81
-30.81 -1.17
-0.06 -1.60
0.23 7.34
PSM
1 to 1 (no replacement)
-0.211 -6.90
-0.191 -6.27
0.129 4.76
-0.252 -6.90
-34 -1.23
-0.09 -2.51
0.28 7.78
Nearest Neigbour (3)
-0.229 -7.30
-0.209 -6.60
0.122 3.99
-0.244 -5.83
-28 -0.92
-0.09 -2.08
0.26 6.47
Radius Caliper (0.01)
-0.219 -7.86
-0.211 -7.42
0.122 4.28
-0.235 -5.86
-34 -1.26
-0.08 -1.90
0.28 7.53
Kernel
-0.210 -7.78
-0.203 -7.44
0.126 4.88
-0.235 -6.42
-41 -1.47
-0.08 -2.29
0.26 7.70
Local Linear
-0.213
-0.206
0.125
-0.242
-43
-0.08
0.27
Mahalanobis Matching -0.217 -6.15 -0.197 -5.48 0.118 3.51 -0.188 -4.11 -6 -0.26 -0.04 -0.80 0.27 6.18
20
6. Conclusion
This paper looked at the SIVP – an employment subsidy in Tunisia aimed at increasing graduate
employment. The effect of the programme on a range of outcome variables was estimated using a survey
of graduates and a variety of matching techniques. Although non-random selection into the programme is
an issue, we cannot rule out that SIVPs have positive effects on the likelihood of being in employment -
an effect that is particularly strong for graduates at high risk of unemployment. There is also little
evidence that SIVPs have a detrimental effect on the quality of employment (as measured by contract-
type and salary), contradicting what is often claimed anecdotally.
Until recently, the SIVP absorbed the lion’s share of Tunisia’s active labour market policies budget.
Given that: (i) in the best case scenario, we estimate that the SIVP programme leads to a 8 percentage
point increase in the likelihood of a graduate finding employment; (ii) that, each year, around 45,000
graduates benefit from the programme; and that (iii) the average employment rate of graduates who did
not benefit from SIVP was 60%, an additional 3,600 graduates find jobs each year thanks to the SIVP
programme – at a cost of around €6,300 per graduate (or 12,600 TND), compared to an average graduate
salary 3.5 years after graduation of around 6,600 TND per year.
As a result, although the programme should probably be kept (particularly in the short to medium run,
while structural reforms are put in place), the targeting of its funds could and should be improved in order
to minimise its deadweight loss13
. To begin with, the subsidy should be restricted to job-seekers who have
been registered with ANETI and who, despite demonstrating job-seeking efforts, have been unable to find
work for a considerable period of time (18 months, for example)14
. Second, the programme should be
better targeted geographically. Part of the problem is that more deprived governorates also have a less-
developed industrial base, so fewer SIVP subsidies are going to be available, by definition. One solution
to this problem could be to drop the requirement that the company should be part of the social security
system, so that smaller, informal enterprises also become eligible to recruit SIVP interns15
. This, in turn,
could help these smaller companies grow. Other aspects of the subsidy (the time limit as well as the
combination with other programmes) should be kept as they have been demonstrated to be good practice
in the design of employment subsidies.
This paper has looked at the effect of the SIVP programme on individual graduate outcomes. However, as
pointed out previously, one important aspect of such programmes is the risk that they lead to substitution
and displacement effects. Unfortunately, this is not something we could have investigated with the data
available. Analysis of Labour Force Surveys over a number of years, possibly combined with
administrative data on the availability of SIVP internships by geographical area and over time, would
permit such analysis and represents an important avenue for future research.
13
World Bank (2012) finds that around 75% of firms who benefited from SIVP (and other programmes) said they
would have recruited even in the absence of the programme. 14
The recently introduced AMAL programme is being revised to better target individuals: the long-term
unemployed, as well as those who graduated in certain high unemployment disciplines. The SIVP should be revised
in a similar vein. http://www.emploi.gov.tn/fileadmin/user_upload/PDF/Cadre_juridique/Francais/Emploi-
fr/promotion_de_l_emploi/Decret2012_953-fran.pdf 15
Although this would, of course, make monitoring more difficult and hence increase the risk of abuse. One other
option would be to turn the SIVP into a voucher following the graduate. This is a system already being proposed by
the Government.

21
References
Angel-Urdinola, D.F., A. Semlali and S. Brodmann (2010). ‘Non-public provision of active labor market
programs in Arab-Mediterranean countries: An inventory of youth programs’ World Bank Social
Protection Discussion Paper 1005.
Betcherman, G., K. Olivas and A. Dar (2004). ‘Impacts of active labor market programs: New evidence
from evaluations with particular attention to developing and transition countries’ World Bank Social
Protection Discussion Paper 0402.
Brown, A.J.G., C. Merkl And D.J. Snower (2011). ‘Comparing the effectiveness of employment
subsidies’ Labour Economics, 18(2), pages 168-179.
Burtless, G. (1985). ‘Are targeted wage subsidies harmful? Evidence from a wage voucher experiment’
Industrial and Labor Relations Review, 39(1), pages 105-115.
Dubin, J. and D. Rivers (1993). ‘Experimental estimates of the impact of wage subsidies’ Journal of
Econometrics, 56(1/2), pages 219-42.
Groh, M., N. Krishnan, D; McKenzie and T. Vishwanath (2012). ‘Soft skills or hard cash? The impact of
training and wage subsidy programs on female youth employment in Jordan’ World Bank Policy
Research Working Paper 6141.
Isbell, S. and L. Smith (1991). ‘Wage subsidies as an anti-discrimination policy’ Population Research
and Policy Review, 10, pages 257–271.
Kluve, J. (2010). ‘The effectiveness of European labor market programs’ Labour Economics, 17(6), pages
904-918.
Marco, S. and A. Verdier-Chouchane (2011). ‘Labor market dynamics in Tunisia: The issue of youth
unemployment’ Review of Middle East Economics and Finance, Berkeley Electronic Press, 7(2), pages 1-
35.
Marouani, M.A. (2010). ‘More jobs for university graduates: some policy options for Tunisia’ Applied
Economics Letters, 17(10), pages 933-937.
Martin, J.P. (2000). ‘What works among Active Labour Market Policies: Evidence from OECD countries'
experiences’ OECD Economic Studies, 30, pages 79-113.
Ministère de l’Emploi et de l’Insertion Professionnelle des Jeunes and World Bank (2009). ‘L’insertion
des jeunes diplômés de l’enseignement supérieur – promotion 2004 : Analyse comparative des résultats
de deux enquêtes (2005 et 2007)’ République Tunisienne 51565.
Subrahmanyam, G. (2011). ‘Tackling youth unemployment in the Maghreb’, African Development Bank
Economic Brief, 2011.
World Bank (2012). ‘Evaluation stratégique du Fonds National pour l’Emploi de la Tunisie’, draft June
2012.

22
Recent Publications in the Series
nº Year Author(s) Title
157 2012 Mthuli Ncube, Eliphas Ndou and Nombulelo
Gumata
How are the US financial shocks transmitted into South
Africa?
Structural VAR evidence
156 2012 Albert Mafusire and Zuzana Brixiova Macroeconomic Shock Synchronization In The East African
Community
155 2012 John Page Youth, Jobs, and Structural Change: Confronting Africa’s “Employment Problem”
154 2012 Thouraya Triki and Ousman Gajigo Credit Bureaus and Registries and Access to Finance: New
Evidence from 42 African Countries
153 2012 Cedric Achille Mbenge Mezui Accessing Local markets for Infrastructure: Lessons for
Africa
152 2012 Alain Kabundi Dynamics of Inflation in Uganda
151 2012 Dick Durevall and Bo Sjö The Dynamics of Inflation in Ethiopia and Kenya
150 2012 Mthuli Ncube, Abebe Shimeles and
Audrey Verdier-Chouchane South Africa’s Quest for Inclusive Development
149 2012 John C. Anyanwu Accounting for Poverty in Africa: Illustration with Survey
Data from Nigeria
148 2012
John C. Anyanwu, Yaovi Gassesse Siliadin
and Eijkeme Okonkwo
Role of Fiscal Policy in Tackling the HIV/AIDS Epidemic
in Southern Africa


