

1
WORKING PAPER
“Index of Industrial Production
&
Annual Survey of Industries
M.C. Singhi
Views expressed in this paper are those of the author(s) and may not be attributed to the Government of India.
2
Measuring Industrial Performance
There are multiple sources of information about the manufacturing industries.
In the organised manufacturing sector, the most comprehensive information set-
up consists of Annual Survey of Industries (ASI). This survey covers all factories,
which employ 10 or more workers using power or 20 or more workers not using
power. ASI is conducted every year but results are available with a time lag of 2
to 3 years. The collection of data is done through a structured and detailed
schedule filled in by the persons of the Field Operations Division (FOD) of
National Sample Survey Organisation (NSSO) and is based on statement of
accounts of the unit. The frame of ASI is the factories on the register of the Chief
Inspector of Factories (CIF). Registration with CIF being mandatory, it is
perceived as comprehensive and complete. This frame, in actual practice,
however, suffers from both inclusion and exclusion error. “The ratio of number
of missing units (as estimated from NSS 51st round) to estimated number of
working units as per ASI was of the order of 117 per cent for the year 1994-95;
and the corresponding ratio with respect to other two variables were 28 per cent
for total number of workers and 4.1 per cent for gross value added (GVA)1.”
Though the number of excluded units declined in 2000-01, the ratio of value
added of these missing units increased to 12.7 per cent. The magnitude of
inclusion error has also been equally large. “There were 29619 units (as
estimated from NSS 51st round), which employed less than 10 workers.2”
Notwithstanding the inclusion and exclusion error, ASI has traditionally been
(and still is) the most comprehensive and reliable source of organised
manufacturing sector data providing disaggregated industry specific details of
production, investment, employment and costs.
2. For the other category of factories/establishments, which are not covered
under the ASI, the information is collected through the unorganised sector
surveys conducted by National Sample Survey Organisation (NSSO) every 5
years. The last such survey was undertaken in 2005. The ASI and the
unorganised sector surveys together therefore cover the complete manufacturing
sector. The National Accounts use ASI and unorganised sector results to provide
information on value addition in the registered and unregistered manufacturing
sector on an annual basis by direct or blow up approach. Though the ASI has
1 Discrepancies and Validation of Indian Manufacturing Data- J.S.Bedi and P K Banerjee, Economic and political weekly, March 10, 2007
3
the inclusion and exclusion error, the NSSO surveys, which essentially use area
based frames, cover the units which are not part of ASI. The ASI and NSSO
surveys are, therefore, mutually exclusive and non-overlapping and
notwithstanding the misrepresentation on either side cover the entire
manufacturing sector or complete enumeration.
3. Industries are also classified as small scale industries (SSI) and Non SSI.
Their classification is in terms of the investment in plant & machinery in a unit.
Currently units, which have investment in plant & machinery of Rs 500 lakh
and below, are classified as SSI. For the SSI sector the information is also
collected independently by Development Commissioner, Micro, Small & Medium
Enterprises (DCMSME) through its field offices. DCMSME also conducts a
census on SSI sector every 10 years and the last census for which results are
available pertain to the year 2003-04. However, while the definition of a factory
under CIF has remained the same, which makes the information available on a
comparable basis for a time series, investment limit used for classifying
industries as SSI and non-SSI has undergone several changes over time. Unit
level data from ASI and NSSO surveys though could be used to generate SSI and
non SSI units, but this disaggregation is rather cumbersome. SSI and ASI units
are not mutually exclusive as while the former is based on investment criteria,
for ASI inclusion is based on employment. But since the coverage of ASI and
NSSO survey is mutually exclusive, complete information on manufacturing
sector could be considered as being available.
Index of Industrial Production
4. ASI survey is annual but its summary results get delayed by 2-3 years and
detailed results take even longer. NSSO’s unorganised sector survey is
quinquennial so information on inter year could only be estimated. Even NSSO
survey results become available with a considerable time lag. Most countries,
therefore, have an index of industrial production (IIP) as a short term indicator
of industrial performance. IIP usually measures changes over time in the volume
of work done in various sectors of industry, limited to the production of
commodities, excluding agriculture and services, i.e. mining and quarrying,
manufacturing, electricity, gas and water, and construction. As a volume index,
it is defined as the ratio of the volume of commodities produced within a
2 Discrepancies and Validation of Indian Manufacturing Data- J.S.Bedi and P K Banerjee, Economic and political weekly, March 10, 2007
4
specified group of industries in a given time period to the volume produced in
the same group of industries in a specified base period. The Systems of National
Accounts 1993 (1993 SNA) defines a volume index that “measures the average of
the proportionate changes in the quantities of a specified set of goods and
services between two periods of time.3” The quantities compared are generally
homogenous while the changes for different goods and services are weighted by
their economic importance as measured by their values in one or other, or both,
periods.
5. IIP is considered to be one of the lead indicators for short-term economic
analysis because of its strong relationship with economic fluctuations in the rest
of economy. Most of services, like transport, storage, communication, real estate,
insurance and banking are industry dependant and are considerably influenced
by industrial performance. IIP is, therefore, also used as core ingredient in the
compilation of annual and quarterly national accounts and forecasts of GDP.
Furthermore, the availability of IIP on a monthly basis makes it amenable to be
used as a reference series in the compilation of cyclical indicators. Major
advantages of the production index compared to other indicators are its
combination of fast availability (relative to GDP for example) and its detailed
activity breakdown such as the coverage of manufacturing sub segments. While
inter country practices for compilation of IIP are not uniform, they do seem to
converge in many respects. A recent compilation by the UN on country practices
on collection and compilation of IIP (ESA/STATE/2008/8) covering 69 countries
indicate the commonality of approaches in IIP compilation. Percentage of
countries adopting common practices across specified parameters varies from 54
per cent (frequency of change in weights) to 93 per cent (use of base year
information for weights).
Table 1: Country practices for compilation of IIP
No of Countries adopting
Per cent of countries
Coverage- Mining, Manufacturing and Electricity 53 76.8
Survey as Data Source 55 79.7
Monthly Frequency 54 78.3
Combination of Volumes and Deflators for compilation 43 62.3
Use of Base year information for weights 64 92.8
3 System of National Account, 1993
5
5 Year frequency of weight changes 37 53.6
Fixed Base Approach 42 60.9
The system adopted in OECD countries prior to the revision of the IIP series to
2005 base, which is generally similar to the practices adopted in other countries,
is indicated in Annex 1.
Index of Industrial Production- Indian experience
6. IIP in India uses base year weights, which remain fixed through the entire
period of the series and uses a combination of volumes and deflators in its
compilation. While the usual preference is for volumes (like numbers, tonnes),
deflators are used for items/sectors which are not normally amenable to a
volume based measure. The commodity specific Wholesale Price Index is used as
deflators. It has a monthly frequency and covers mining, manufacturing and
electricity as its broad sectors with disaggregated results being provided at 2-
digit industry groups for the manufacturing. The disaggregated classification of
manufacturing sector is based on National Industrial Classification (NIC)
generally compatible with International Standard Industrial Classification
(ISICs). IIP in India is also available on the basis of sources of demand, such as,
basic goods, intermediates, capital goods and consumer goods. However relative
to the generally adopted practice, change of base year and as such the revision
of the weights in IIP has taken a little longer in India. Further while ASI and NAS
is the data source for weights, there are industry specific source agencies for
providing monthly production figures, which is a unique to India. The IIP
weights for the three broad sectors during last three revisions have been as
under:
Table 2: Weights to the Broad Groups in IIP
1970 1980-81 1993-94
Mining 96.90 114.64 104.73
Manufacturing 810.80 771.07 793.58
Electricity 92.30 114.29 101.68
Total 1000.0 1000.0 1000.0
7. IIP adopts a top down approach in assigning weights. The weights at the
first stage of disaggregation, i.e. manufacturing, mining and electricity are in
terms of their relative importance in GDP of these sectors and are derived from
National Accounts aggregates. Manufacturing constitutes roughly four fifths of
6
IIP weights. Weights at the second stage of disaggregation, i.e. at the 2 digits NIC
of manufacturing are again allocated on the basis of the relative value added of
the sub sectors as in NAS. Weights at the commodity level, which is the third
stage, are in terms of relative value added/output of the selected items in the
basket. In the first two stages, item basket has no influence on the weights, as
these are independently derived from NAS/ASI and results of the NSSO surveys
for the base year while at the third stage these are derived from the sample of
commodities finally selected in the index in such a manner that the total weights
of the commodities within a group is equal to the weights assigned at that group
level. In the selection of commodities (items), a cut off point in terms of the value
added/value of output is also considered. In selection of products, however,
chosen cut-off output/value added level is usually based on the ASI data or the
organised sector of the manufacturing (it to some extent covers SSI sector).
However, adjustments/substitution is made at the time of finalisation of the
basket on the basis of the regular availability of production returns every month.
The substitution/merger of items or their deletion is done in consultation with
the source agencies. Though item basket and weights remain freeze for the
entire series, abnormalities noticed in responses/product change, etc. are
considered on case to case basis.
8. While the responsibility of generating IIP and its release has been
entrusted to the Central Statistical Organisation (CSO), (in most other countries
also the National Statistical Bureau is the agency for compilation and release of
IIP) the index as is being compiled today gets data from 15 source agencies
which includes Central Electricity Authority, Indian Bureau of Mines (IBM
generates the index for mining sector and it is used in IIP), Office of Textile
Commissioner, DC(MSME), Department Of Industrial Policy & Promotion (DIPP),
Iron & Steel Controller and others. However, for 337 items (covered under 213
item groups4) in the manufacturing sector, the source agency is DIPP. Multiple
industry specific source agencies for furnishing of production data facilitates
capturing of the new units that come into production and to ensure better data
quality and specifications. It is also cost effective and perhaps more credible in
terms of information availability. In terms of the number of items, DIPP
accounts for 61 per cent of items and 52.0 per cent of the weights. For the
manufacturing sector, DIPP acts as a source for 65 per cent of the IIP weights.
4 Four of these items were dropped subsequently in 2001 both because of an erratic response and there being a single respondent reducing the number of products for DIPP to 209.

7
Its item basket includes even the items, which are reserved for the SSI sector
and extends to the sectors/items not specifically assigned to it administratively.
DIPP also has the responsibility of monitoring industrial performance and as
such the major data user of IIP. The arms length relation with the data user
(DIPP) and data generator (CSO) ensures that data are not get contaminated
with the user bias. SSI or MSME sector has a limited presence in IIP, both in
terms of the weights assigned to MSME products or the number of products
actually included in the basket. IIP, therefore, essentially is an index of
organised sector, in so far as it relates to the manufacturing component. IIP is
currently released on 12th day of the following month (with a time lag of around
6 weeks5) with simultaneous access to all users6. Advance release calendar and
access of information including the one relating to compilation methodology are
available in terms Standard Data Dissemination Standards (SDDS) of the
International Monetary Fund (IMF).
9. The number of items covered in 1993-94 IIP series including their
grouping into product groups and their source agency is indicated in Table 3
below:
Table 3: Number of Items and Weights as per Source Agency
Source Agency Items Item Groups
Weights (1000)
Remarks
Indian Bureau of Mines 64 1 104.73 Largely in Public Sector & generally considered reliable
Directorate of Sugar 1 1 22.43 Partially controlled
Salt Commissioner 1 1 0.52 Commodity Specific Administrative Agency & reliable
Directorate of Vanaspati 12 11 16.98 -- as above --
Tea Board 1 1 7.63 -- as above --
Coffee Board 1 1 1.01 -- as above --
Textile Commissioner 50 9 123.28 -- as above --
Jute Commissioner 7 5 5.90 -- as above --
Coal Controller 3 3 1.22 -- as above --
Ministry of Petroleum 16 14 23.87 -- as above --
Development Commissioner Iron & Steel
43 20 59.10 -- as above --
Railway Board 4 4 5.56 Departmental Undertaking & generally reliable
Department of Industrial Policy & Promotion
337 213 519.59 Diversified Commodity Basket, large response group
5 The release date was advanced by about 7 weeks compared to the earlier IIP series 6 There is no preferential access to any user agency for IIP data
8
Development Commissioner MSME
18 18 6.51 Small weight but large response group
Central Electricity Authority
1 1 101.69 Largely PSUs in Central or State sector
10. It needs to be observed that except for the DIPP, the source agencies are
rather product specific and generally have a narrow response base (except the
textiles). In case of textiles, though response base is fairly large, commodity
specific agency provides obvious advantage in having an access to information.
The DIPP is in fact the source for all manufacturing items for which it has not
been possible to have a product specific source. In that sense it could also be the
residual source, and yet the most dominant of all. DIPP receives production
returns on monthly basis and submission of this return is mandatory7 for all
establishments employing 50 or more workers using power. This access of
information of monthly production retunes facilitates obtaining information from
units engaged in production of items not assigned to DIPP.
Representativeness of IPP as a lead indicator
How has the validation being attempted?
11. Representativeness of IIP has been a matter of debate, particularly after
1991 or the post-industrial deregulation and reforms phase.8 Though the
submission of production returns has continued to be mandatory, a general
perception is that the response may have deteriorated. Representativeness of IIP
is also important because of its being used as a tracking variable for industrial
growth. Further, since IIIP, the manufacturing component of it in particular,
has a correspondence with ASI; IIP is amenable for being validated through the
ASI results. Validation, therefore, satisfies both the criteria of desirability and
feasibility. One additional reason for a regular validation of IIP is its perceived
departure from randomness in selection of products/items as substitution of
products, often based on the regular availability of data, results in some
departure from randomness9. Product basket of IIP, therefore, shows some kind
of predominance for continuity.
7 These monthly production returns were earlier submitted to Director General of Technical Development (DGTD) under Industrial (Development and Regulation) Act. These returns are submitted to Industrial Statistical Unit of DIPP. 8 Prior to 1991, Director General of Technical Development (DGTD) as the licensing agency could get information as its administrative by-product. 9 The substitution and deletion of products identified in the first instance primarily happens for the manufacturing sector.
9
12. The magnitude of the index and growth rates as shown by IIP at the
aggregate and sub-group level and their association with the NAS/ASI
(population figures) could be an indicator for determining the representativeness
of the index and its validity of being used as the "lead indicator". IIP and the
index constructed of its three broad groups from NAS indicate that while these
two indices converge for electricity sector, considerable differences exist for
mining and manufacturing sectors10. NAS based index is higher for mining
sector while IIP is higher for the manufacturing sector. (Table 4):
Table 4: IIP and NAS based index (1993-94=100)
National Accounts- New Series Index of Industrial Production
Mining Manufa-cturing Electricity Mining
Manufa-cturing Electricity
1993-94 100 100 100 100 100 100
2000-01 138.8 160.8 152.9 130.3 167.9 154.4
2008-09 209.4 275.6 221.8 176 295.1 223.7
Compound Average Annual growth (per cent)
1993-2009 5.05 6.99 5.45 3.84 7.48 5.51
1993-2001 4.80 7.02 6.25 3.85 7.68 6.40
2001-2009 5.27 6.97 4.76 3.83 7.30 4.74
IIP (Manufacturing) and NAS/ASI
13. Nearly 80 per cent of IIP weights are for manufacturing sector. Further,
while mining and electricity are single product based sectors and has a
designated source agency, manufacturing is further disaggregated into 17
groups. It may, therefore, be interesting to compare IIP and ASI at overall
manufacturing and its group levels. The National accounts estimates for gross
value added for manufacturing sector are available at current and constant
(1999-2000) prices. IIP being a volume index is at constant prices, comparable
series of ASI (Output) and ASI (Value Added) has been prepared in the following
manner:
a. Using NAS estimates of the value added for the organised manufacturing
sector at current and constant prices, a set of deflators have been
10 NAS/ASI estimates are considered as true estimates.
10
developed with a base year 1993-94 for all the groups with in
manufacturing sector.
b. Applying the deflators so obtained, ASI estimates of value of output and
value added at current prices have been converted to constant 1993-94
prices at the manufacturing group levels11. Separate indices have been
constructed for ASI-Output and ASI-Value added because while at group
level weights in IIP are derived from value added, at commodity level
relative weights are assigned based on output. The Committee of CSO
constituted for revising the base year of IIP did consider both the output
and value added as being the determinants of weights for 1993-94
series12, though the series finally adopted value added for inter se weights
among the groups.
c. Using these estimates at constant prices, manufacturing index has been
constructed for ASI (Output) and ASI (Value Added) for the sub groups
and for the manufacturing sector as a whole.
d. Since NAS estimates are available at constant prices, index of organised
manufacturing sector and total manufacturing sector has been prepared
with 1993-94 as the base. Though IIP is predominantly an index of
organised manufacturing sector13, being a short term macro indicator its
representativeness for the entire sector is considered desirable. Further, if
the rate of growth of the unorganised sector converges, IIP could proxy the
growth of both these sectors.
e. A chain based index of IIP has also been constructed by using the weights
derived from the relative movement of index at 2-digit level with a view to
identify the structural shifts in a limited way14.
14. Annual index (with a common base) so constructed and the observed rates
of growth for manufacturing segment with alternate sources (Table 5) indicate
11 NAS based deflators have been used as against WPI because these are sector specific and a single deflator could be used for one industry group.
12 Report of the Technical Advisory Committee to consider Construction of state Level indices for Industrial Production and Revision of base for the IIP to 1993-94 13 There are only 18 products representing MSME sector and their combined weight is only 0.65 per cent of IIP. 14 Chain based IIP is constructed by assigning weights in each year derived from the index at 2 digit level of the previous year. Inter se weights of the items selected are not changed.
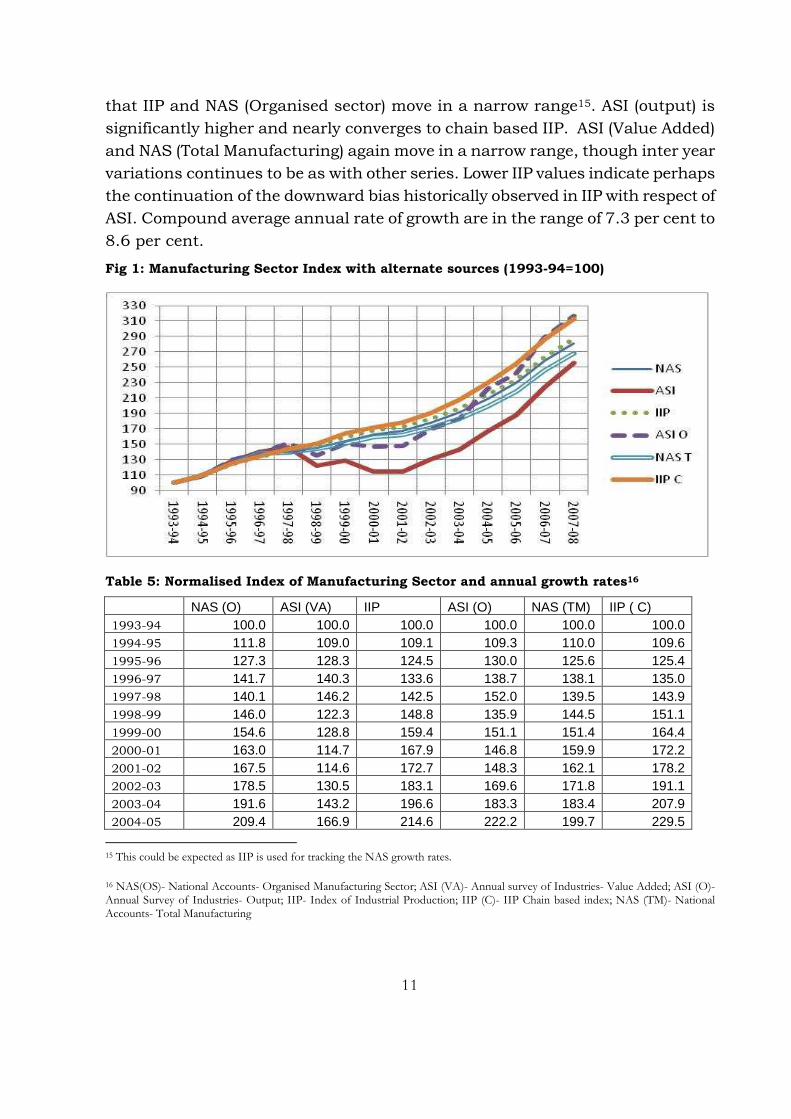
11
that IIP and NAS (Organised sector) move in a narrow range15. ASI (output) is
significantly higher and nearly converges to chain based IIP. ASI (Value Added)
and NAS (Total Manufacturing) again move in a narrow range, though inter year
variations continues to be as with other series. Lower IIP values indicate perhaps
the continuation of the downward bias historically observed in IIP with respect of
ASI. Compound average annual rate of growth are in the range of 7.3 per cent to
8.6 per cent.
Fig 1: Manufacturing Sector Index with alternate sources (1993-94=100)
Table 5: Normalised Index of Manufacturing Sector and annual growth rates16
NAS (O) ASI (VA) IIP ASI (O) NAS (TM) IIP ( C) 1993-94 100.0 100.0 100.0 100.0 100.0 100.0 1994-95 111.8 109.0 109.1 109.3 110.0 109.6 1995-96 127.3 128.3 124.5 130.0 125.6 125.4 1996-97 141.7 140.3 133.6 138.7 138.1 135.0 1997-98 140.1 146.2 142.5 152.0 139.5 143.9 1998-99 146.0 122.3 148.8 135.9 144.5 151.1 1999-00 154.6 128.8 159.4 151.1 151.4 164.4 2000-01 163.0 114.7 167.9 146.8 159.9 172.2 2001-02 167.5 114.6 172.7 148.3 162.1 178.2 2002-03 178.5 130.5 183.1 169.6 171.8 191.1 2003-04 191.6 143.2 196.6 183.3 183.4 207.9 2004-05 209.4 166.9 214.6 222.2 199.7 229.5
15 This could be expected as IIP is used for tracking the NAS growth rates.
16 NAS(OS)- National Accounts- Organised Manufacturing Sector; ASI (VA)- Annual survey of Industries- Value Added; ASI (O)- Annual Survey of Industries- Output; IIP- Index of Industrial Production; IIP (C)- IIP Chain based index; NAS (TM)- National Accounts- Total Manufacturing

12
2005-06 230.2 187.9 234.2 242.2 218.8 254.4 2006-07 258.6 224.2 263.5 289.1 245.7 286.6 2007-08 280.7 255.7 287.2 316.3 267.8 313.0 Rate of Growth (per cent)
1994-95 11.8 9.0 9.1 9.3 10.0 9.6 1995-96 13.9 17.8 14.1 18.9 14.1 14.4 1996-97 11.3 9.3 7.3 6.6 10.0 7.7 1997-98 -1.2 4.2 6.6 9.6 1.0 6.7 1998-99 4.2 -16.4 4.4 -10.6 3.6 5.0 1999-00 5.9 5.4 7.2 11.2 4.7 8.8 2000-01 5.5 -11.0 5.4 -2.9 5.7 4.8 2001-02 2.7 -0.1 2.9 1.0 1.4 3.5 2002-03 6.6 13.9 6.0 14.4 6.0 7.2 2003-04 7.3 9.7 7.4 8.1 6.8 8.7 2004-05 9.3 16.5 9.1 21.2 8.9 10.4 2005-06 9.9 12.5 9.1 9.0 9.6 10.8 2006-07 12.3 19.3 12.5 19.4 12.3 12.7 2007-08 8.6 14.1 9.0 9.4 9.0 9.2 Compound Average Annual Growth (CAGR)
1993-94 to
2007-08 7.65 6.94 7.83 8.57 7.29 8.49
15. There are significant inter year variations, as is evident from the annual
rate of growth (and also the indices) observed for various indices. It is, however,
interesting to note that in the first four years of the release of IIP series, all the
indices of manufacturing sector performance move almost together. A break
occurs afterwards and deviations tend to get wider17. The variations in the index
so constructed and growth rates of IIP and NAS/ASI could either be due to
weights, item basket, response quantity and quality or a combination of one or
more of these factors.
16. Earlier analysis of this type had indicated that both at the two digits
disaggregated and IIP (which is being examined latter in this paper) as a whole,
the association has generally become weak in the later part of the index when it
becomes dated. It was pointed out that, "This is mainly because the primary
data that is used for computing the index has become poorer in quality and
probably scarcer in quantity18." This was also admitted at the official level in the
Press Note issued by CSO, which mentioned "for the registered sector, the
17 One of the reaons for the indices to move together in first 4-5 years could be nearness of the base. It could also be because the effective launch of the new series happens after a gap of 5-6 years and it is possible to make additions/deletions in item basket based on responses and other information. 18 R Nagraj, Economic and Political Weekly. February 6, 1999

13
quality of production data supplied by source agencies suffer from substantial
non-response19". Similar views were expressed by the Statistical Commission,
which also held the poor response as being responsible for IIP becoming non-
representative of industrial performance20.”
17. A study for the earlier series of IIP done by the Office of the Economic
Adviser has also indicated that IIP suffers from a downward bias in industrial
growth. The main difference using the IIP data and NAS estimates of output of
the registered manufacturing sector at constant prices was indicated to have
widened from minus 1.2 per cent during 1960-61 to 1969-70 to (-) 2.2 per cent
during 1970-71 to 1979-80 and (-) 2.7 per cent during 1980-81 to 1989-9021. It
also mentioned that IIP suffered from an operational problem in so far as its
inability (or limited capacity) to fully capture the growth due to entry of new
firms. The IIP series may appear comparable and hence robust where new
addition of units more or less matches the units which have ceased production.
This, however, is not the appropriate way of information capturing as the
observed robustness of the index could merely be a coincidence22. Further, it is
an anomalous situation because while additions/deletion of capacity of unit in
the frame is captured, the new units which bring in new capacities are not
considered.
18. A comparative study of industrial growth as measured by IIP and ASI (for
the period 1993-94 to 2000-2001) also observed that the industrial growth
shown by both IIP and ASI are almost same till the year 1998-99 and that after
the year 1998-99, the deviation between two series become prominent even
though for some point, the growth comes closer. Thus, the comparison of growth
pattern for manufacturing sector, as a whole, for the two series IIP and ASI
indices, supports the view that so long as current year is not very distant from
the base year, IIP is able to measure the industrial growth fairly accurately. But
when the current year is too distant from the base year, deviation between ASI
indices and IIP become significant. This observation is very evident when
comparison of Growth pattern at 2-digit level of National Industrial Classification
(NIC) is made23.
19 Ministry of Statistics and Programme Implementation 20 National Statistical Commission, 2001 21 Singhi and Mishra, Industrial Statistics, Office of the Economic Adviser, 1997 22 Singhi and Mishra, Industrial Statistics, Office of the Economic Adviser, 1997 23 Shri R.K. Kamra and Shri S. Chakraborty
14
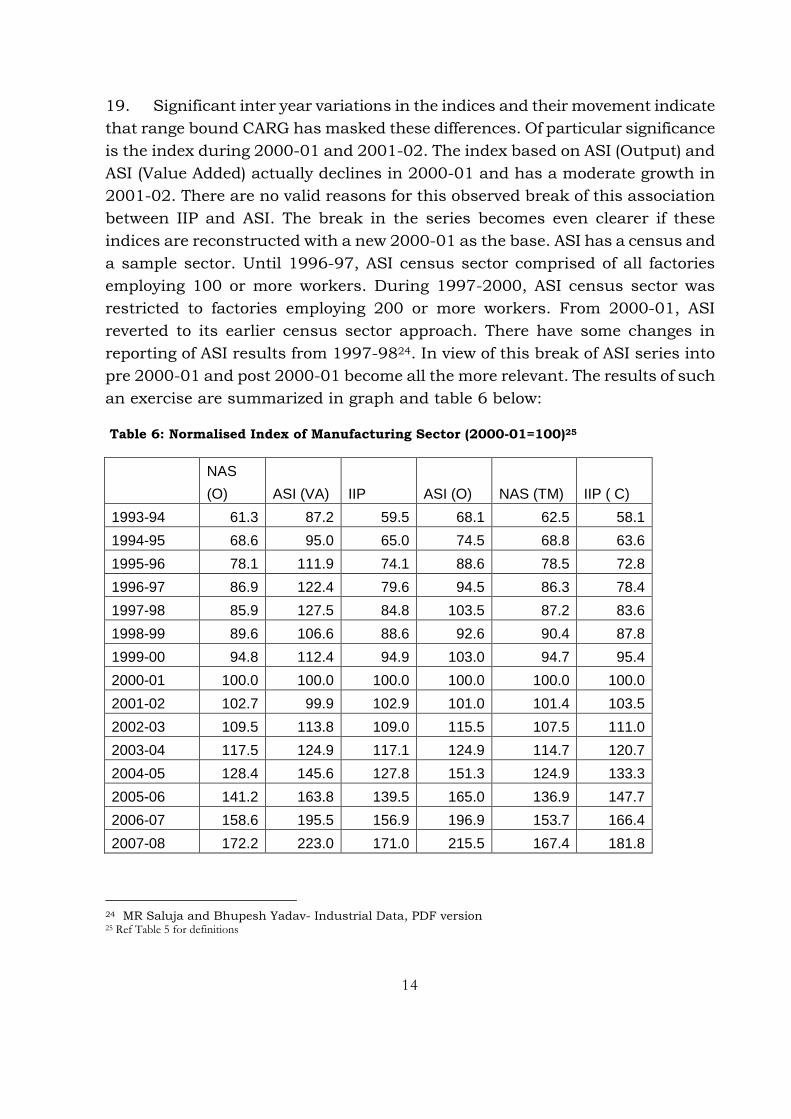
19. Significant inter year variations in the indices and their movement indicate
that range bound CARG has masked these differences. Of particular significance
is the index during 2000-01 and 2001-02. The index based on ASI (Output) and
ASI (Value Added) actually declines in 2000-01 and has a moderate growth in
2001-02. There are no valid reasons for this observed break of this association
between IIP and ASI. The break in the series becomes even clearer if these
indices are reconstructed with a new 2000-01 as the base. ASI has a census and
a sample sector. Until 1996-97, ASI census sector comprised of all factories
employing 100 or more workers. During 1997-2000, ASI census sector was
restricted to factories employing 200 or more workers. From 2000-01, ASI
reverted to its earlier census sector approach. There have some changes in
reporting of ASI results from 1997-9824. In view of this break of ASI series into
pre 2000-01 and post 2000-01 become all the more relevant. The results of such
an exercise are summarized in graph and table 6 below:
Table 6: Normalised Index of Manufacturing Sector (2000-01=100)25
NAS
(O) ASI (VA) IIP ASI (O) NAS (TM) IIP ( C)
1993-94 61.3 87.2 59.5 68.1 62.5 58.1
1994-95 68.6 95.0 65.0 74.5 68.8 63.6
1995-96 78.1 111.9 74.1 88.6 78.5 72.8
1996-97 86.9 122.4 79.6 94.5 86.3 78.4
1997-98 85.9 127.5 84.8 103.5 87.2 83.6
1998-99 89.6 106.6 88.6 92.6 90.4 87.8
1999-00 94.8 112.4 94.9 103.0 94.7 95.4
2000-01 100.0 100.0 100.0 100.0 100.0 100.0
2001-02 102.7 99.9 102.9 101.0 101.4 103.5
2002-03 109.5 113.8 109.0 115.5 107.5 111.0
2003-04 117.5 124.9 117.1 124.9 114.7 120.7
2004-05 128.4 145.6 127.8 151.3 124.9 133.3
2005-06 141.2 163.8 139.5 165.0 136.9 147.7
2006-07 158.6 195.5 156.9 196.9 153.7 166.4
2007-08 172.2 223.0 171.0 215.5 167.4 181.8
24 MR Saluja and Bhupesh Yadav- Industrial Data, PDF version 25 Ref Table 5 for definitions
15
Fig 2: Manufacturing Indices- Alternate Sources (2000-01=100)
20. With shift of the base for all indices to 2000-01, while the convergence of
IIP series with NAS (both organised and total manufacturing) continues, IIP level
becomes significantly long compared to both ASI [output] and ASI [value added]
and a downward bias of IIP becomes even sharper. The convergence (or
continuing convergence) of IIP and NAS series happens because for the new
series, NAS uses IIP for GDP and other estimates and not ASI.
21. While looking at representativeness of IIP, it has to be seen that the
factory in the context of IDR Act (as the data from DIPP generally pertains to the
IDR units) is defined as an establishment engaged in the manufacturing process
having 50 workers or more workers if using power or having 100 workers or
more otherwise. Thus, the definition of factory in IDR is more restrictive than
that of the Factories Act and data resources naturally come from that restrictive
segment26. However, since the basic objective of the index is to provide an
assessment of the direction and quantum of growth and not the output levels, it
26 Further, if the frame of the units is also considered fixed together with a fixed weight and fixed item, dynamism of the industrial sector remains all the more less captured.

16
is a moot question whether one should be concerned for all segments of the
manufacturing sector. What would then be more relevant is to ensure that, at
the time of changing the base year, the weights are allocated on the basis of
estimates of “total production” (factory plus non-factory) of the major items being
manufactured in the economy. Nonetheless this restrictive response (which is
because of the coverage of source agency) increases the need for regular data
validation27.
22. But IIP is not supposed to simply indicate one magic number representing
overall industrial/manufacturing growth. Because, in that case, there would not
be a need for such a detailed item basket a sample of products may be good
enough. Moreover, it could be possible to find some other proxy variables, which
could provide that figure with much less cost and effort. It would, therefore, be
more interesting to look at the association between IIP and NAS/ASI at a little
more disaggregated level. It does not stand to logic that a carefully selected
detailed item basket covering over 500 items is not sufficient enough to ensure
representativeness of IIP at 17 broad two digit NIC levels28. The number of
responses and items covered at that level of disaggregation 29are adequate
enough to capture the industrial performance at that level.
23. To test the proposition that the movement and direction shown by IIP and
NAS/ASI are associated to a considerable extent, a simple correlation coefficient
has been calculated for the IIP and the NAS/ASI beside compound average
annual growth (Group wise indices and rate of growth are at Annex A). The
association as observed from correlation coefficient using group wise indices
particularly with the ASI (both output and value added variants) is robust. This
is to be expected as the indices have moved upwards. However, when rate of
growth of the two indices at aggregate manufacturing level and at the level of
sub group is considered, the association becomes weak.
24. CAGR during 1993-2008 indicates IIP growth is high compared with ASI
(VA) and lower for ASI (output). Average mean difference, however, is less than 1
27 Validation of IIP is feasible because ASI data set which more or less corresponds to IIP Manufacturing becomes available, though with a time lag. The validation could be done both by the source agencies and the CSO so that similar mistakes could be avoided in next round or corrective actions could be taken while series is on. 28 IIP is expected to be fairly representative at 2 digit level of NIC. However, its representativeness at the use based disaggregation is not automatic. 29 In fact, CSO considers IIP at 2-digit NIC level robust. At the IIP disaggregated in terms of use based industries, grouping industries as basic goods, intermediates, capital goods and consumer goods, the association is considered weak.

17
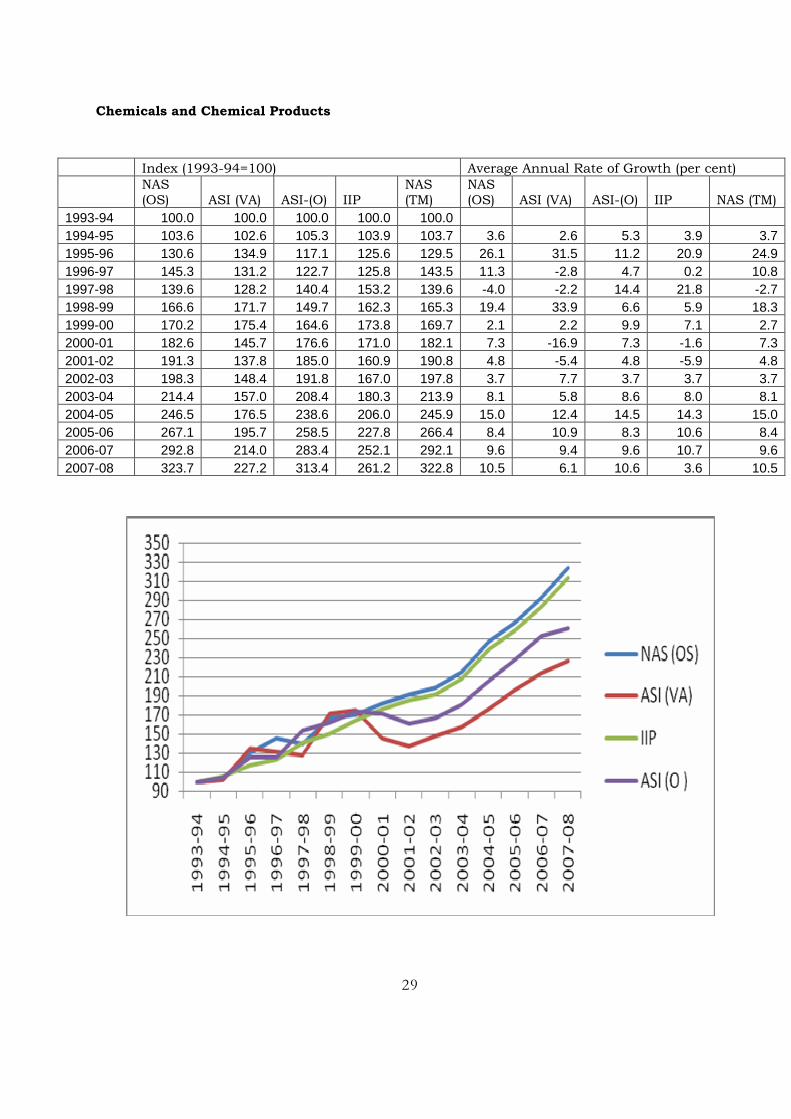
per cent each year. Food products and chemicals and chemical products are in
fact the two products where IIP growth is higher than the growth rates observed
for these sectors through ASI. In other sectors, the difference between IIP growth
and growth based on ASI is generally negative. The downward bias is strong in
many industry sub groups, particularly wood and products, rubber, petroleum
and plastic products.
Table 7: Correlation between IIP and ASI (Output) and ASI (Value Added) at Index and Growth rate levels
Correlation between IIP and
ASI Indices
Correlation between IIP and
ASI growth rates
ASI Output
ASI Value
added ASI Output
ASI Value
added
Food products 0.896 0.982 0.244 0.519
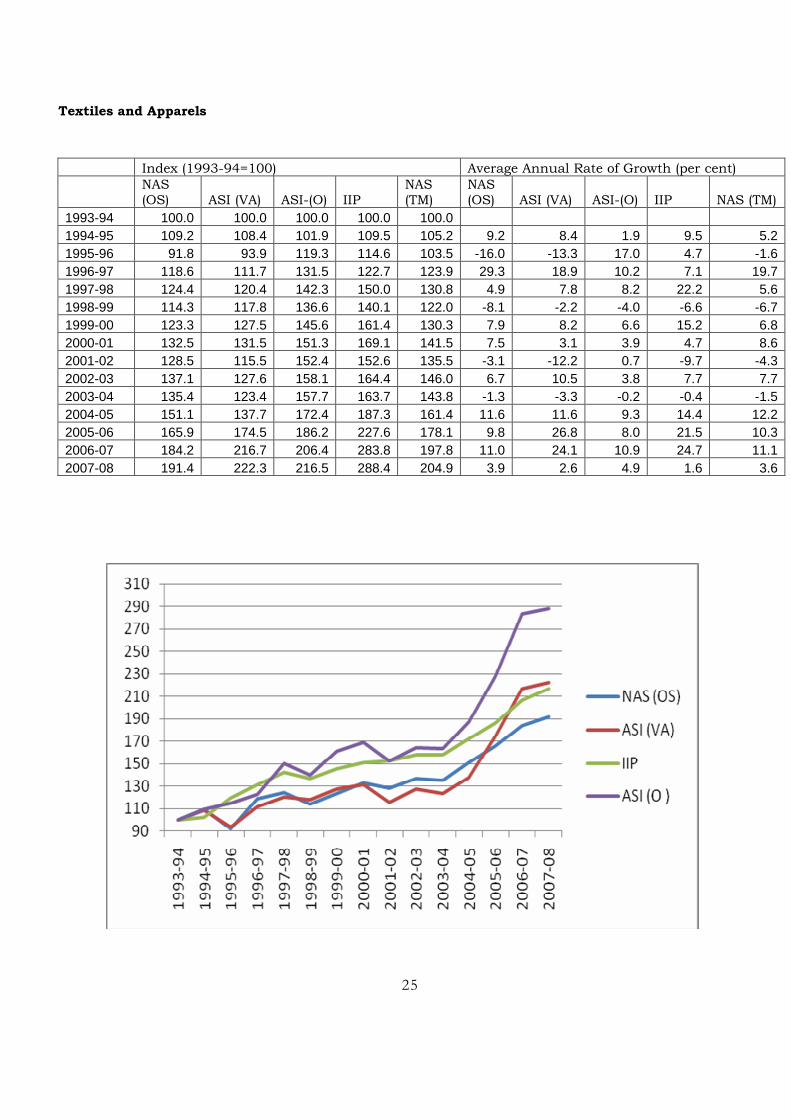
Textiles and apparels 0.917 0.970 0.265 0.582
Wood and wood products 0.103 -0.284 0.053 0.072
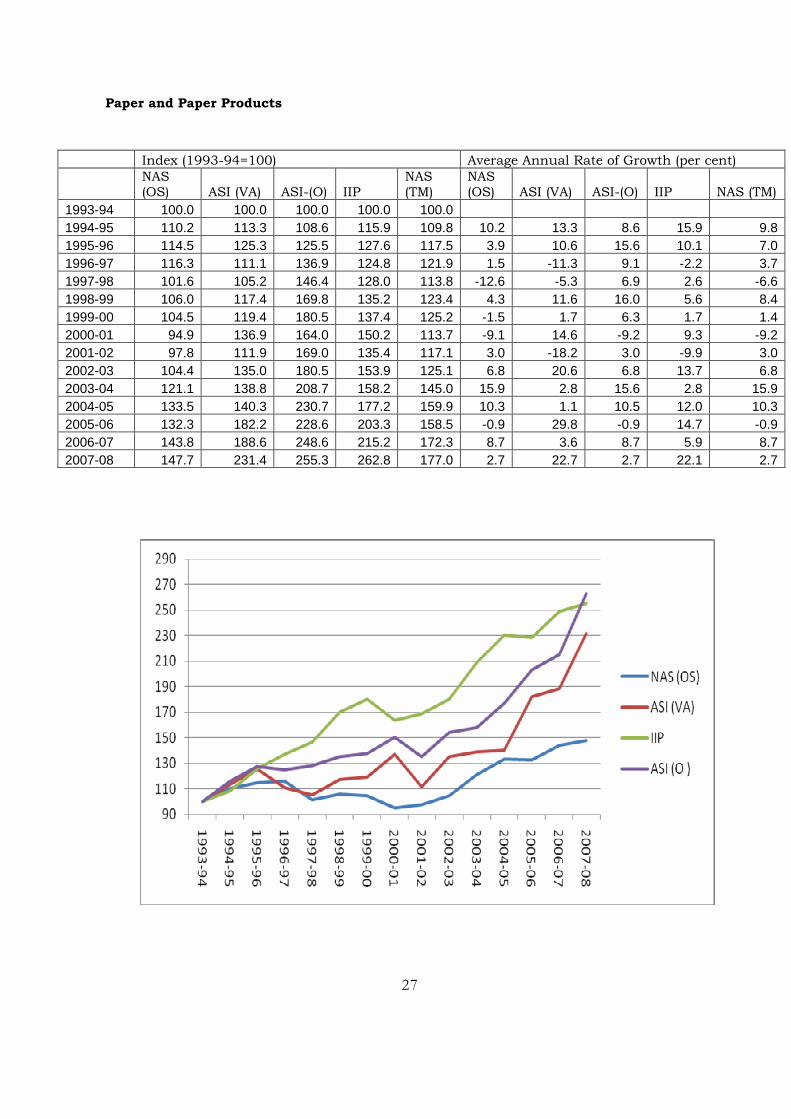
Paper and paper products 0.834 0.913 -0.242 -0.142
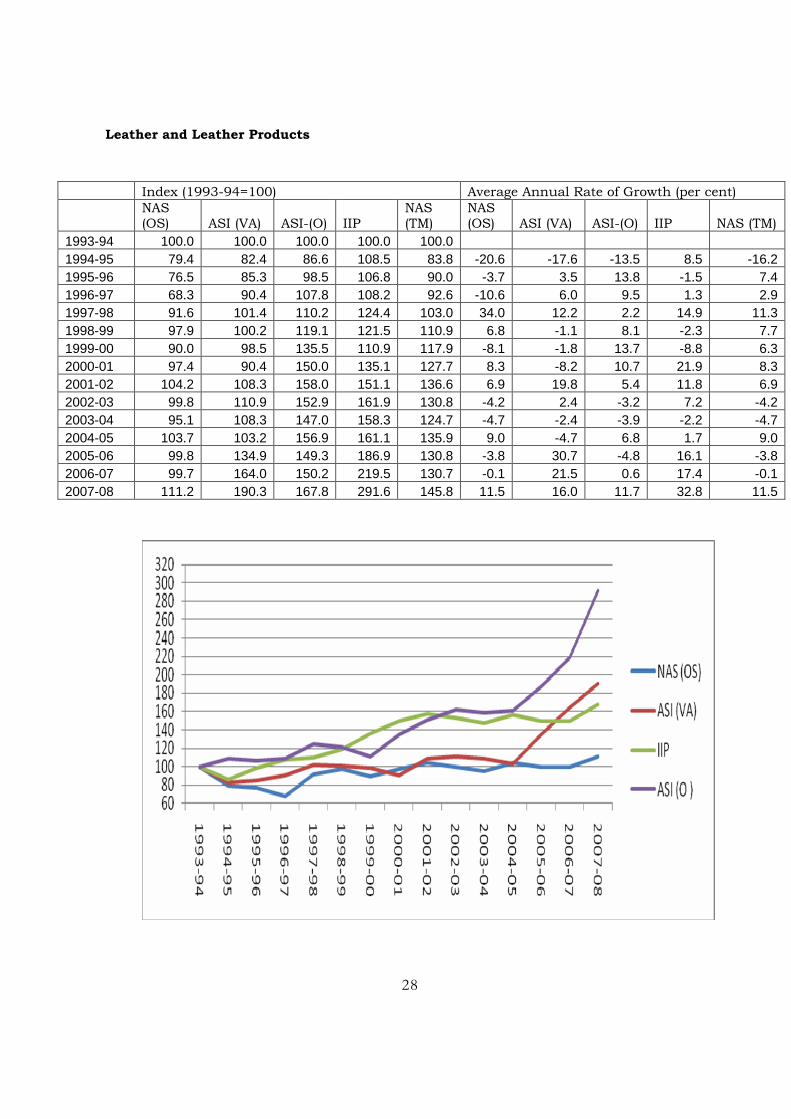
Leather and leather products 0.623 0.741 0.046 -0.084
Chemicals and chemical products 0.910 0.979 0.185 0.789
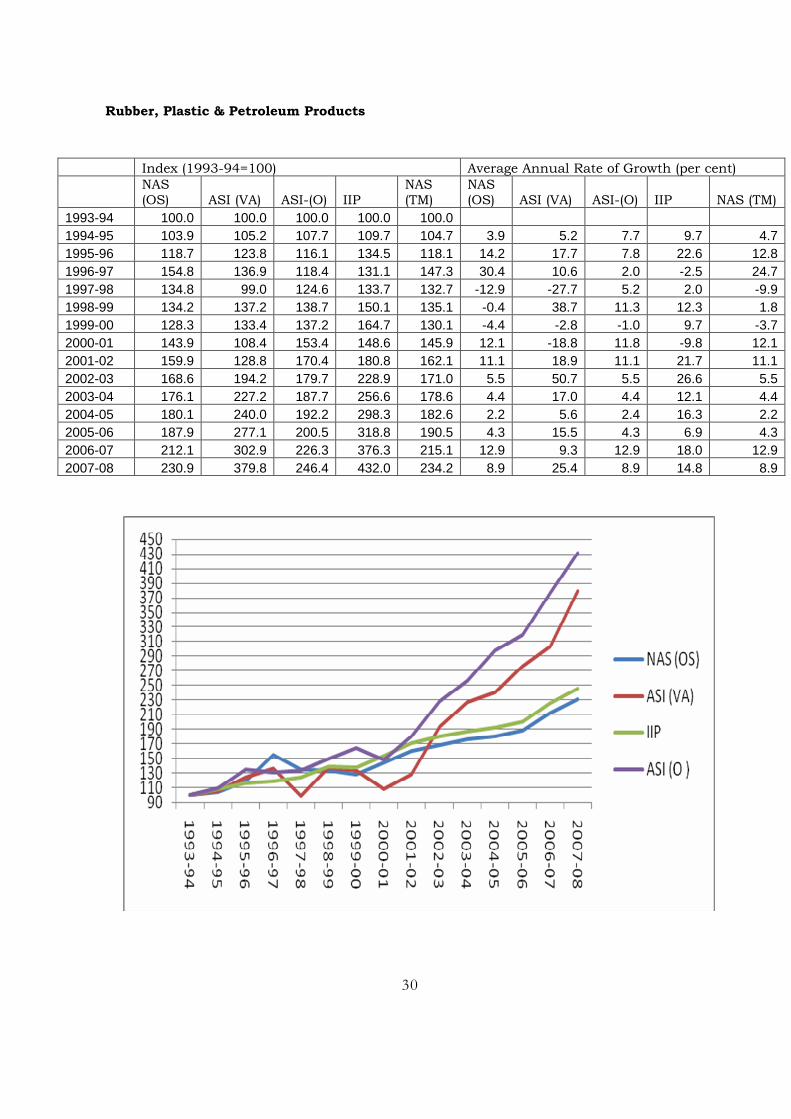
Rubber, Plastic & Petroleum
Products 0.929 0.968 0.134 0.115
Non mineral metallic products 0.897 0.958 0.532 0.597
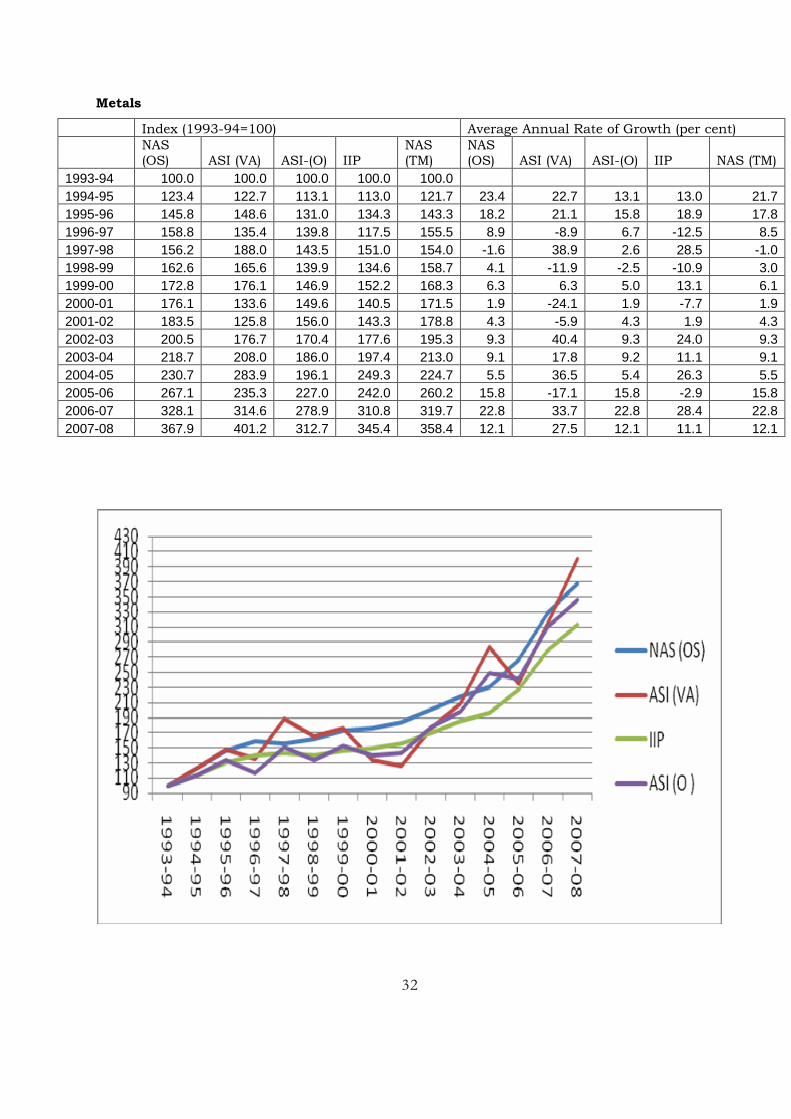
Metals 0.944 0.981 0.353 0.404
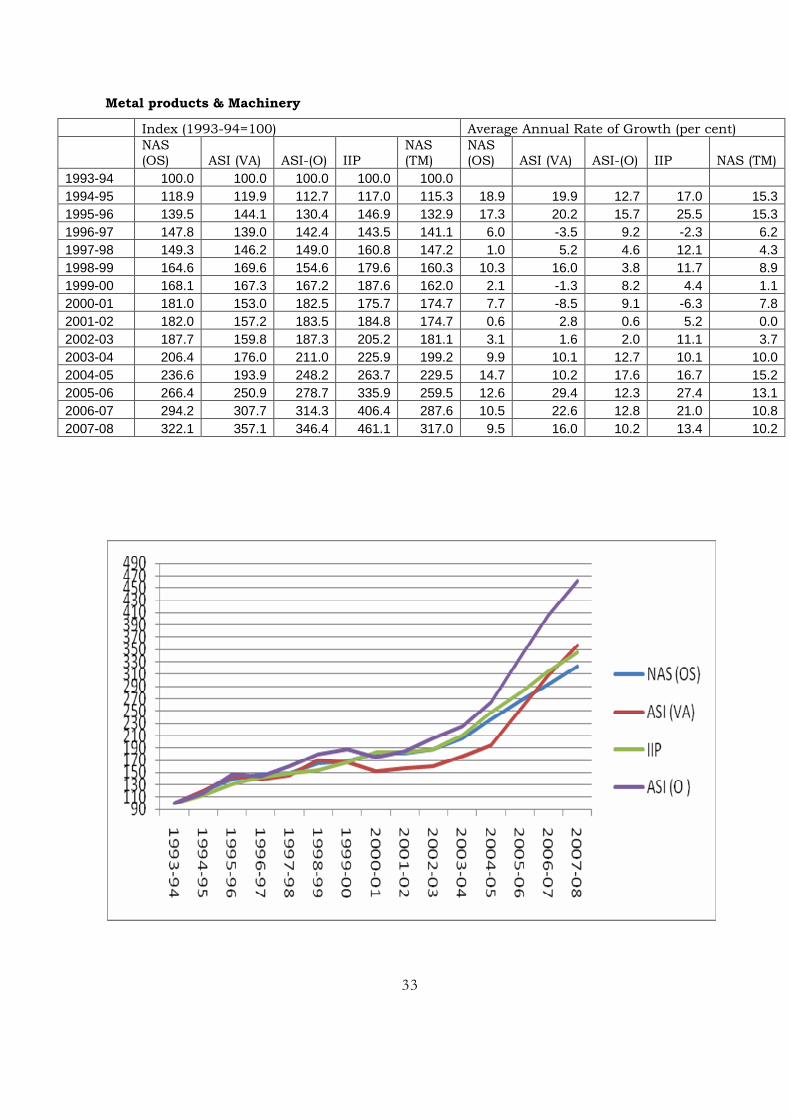
Metal products & Machinery 0.959 0.985 0.459 0.465
Transport equipments and parts 0.938 0.943 0.433 0.035
Overall Manufacturing 0.900 0.977 0.748 0.751
25. As indicated earlier there was a disconnect between ASI and IIP during
1997-2000. It has, therefore, been considered important to look at the
correlation between IIP and ASI indices including the correlation in the growth
rates by breaking the series into two with the first series comparing the indices
and growth rates for the period 1993-2000 and the second comparing it for the
period 2000-2008. It is observed that the correlation between the indices is
significantly lower during the period 1993-94 to 2000-2001. However, at the
level of growth rates, the association becomes weak during the second period.

18
Table 8: Compound Annual growth (1993-94 to 2007-08) of manufacturing group (per cent)
NAS (OS)
ASI (VA) IIP
ASI (O )
NAS (T)
Average Annual
Difference in growth
rates
ASI (VA) ASI (O)
Food products 6.18 5.35 7.08 6.43 6.20 1.73 0.65
Textiles and apparels 4.75 5.87 5.67 7.86 5.26 -0.2 -2.19
Wood and wood products 5.27 3.60 1.77 7.21 2.03 -1.83 -5.44
Paper and paper products 2.83 6.18 6.92 7.15 4.16 0.74 -0.23
Leather and leather products 0.76 4.70 3.77 7.94 2.73 -0.93 -4.17
Chemicals and chemical products 8.75 6.04 8.50 7.10 8.73 2.46 1.4
Rubber, Plastic & Petroleum Products 6.16 10.00 6.65 11.02 6.27 -3.35 -4.37
Non mineral metallic products 7.72 11.54 8.74 8.81 8.13 -2.8 -0.07
Metals 9.75 10.43 8.48 9.26 9.55 -1.95 -0.78
Metal products & Machinery 8.71 9.52 9.28 11.54 8.59 -0.24 -2.26
Transport equipments and parts 9.58 10.83 9.97 12.92 9.62 -0.86 -2.95
Overall Manufacturing 7.65 6.94 7.83 8.57 7.29 0.89 -0.74
Table 9: Correlation between Indices and rates of growth of IIP and ASI
1993-94 to 2000-2001
2000-01 to 2005-06
1993-94 to 2007-08
IIP & ASI (VA)-Index 0.433 0.999 0.900 IIP & ASI (0) - Index 0.902 0.998 0.977 IIP & ASI (VA)-Growth rate 0.845 0.890 0.748 IIP & ASI (0) – Growth rate 0.835 0.723 0.751
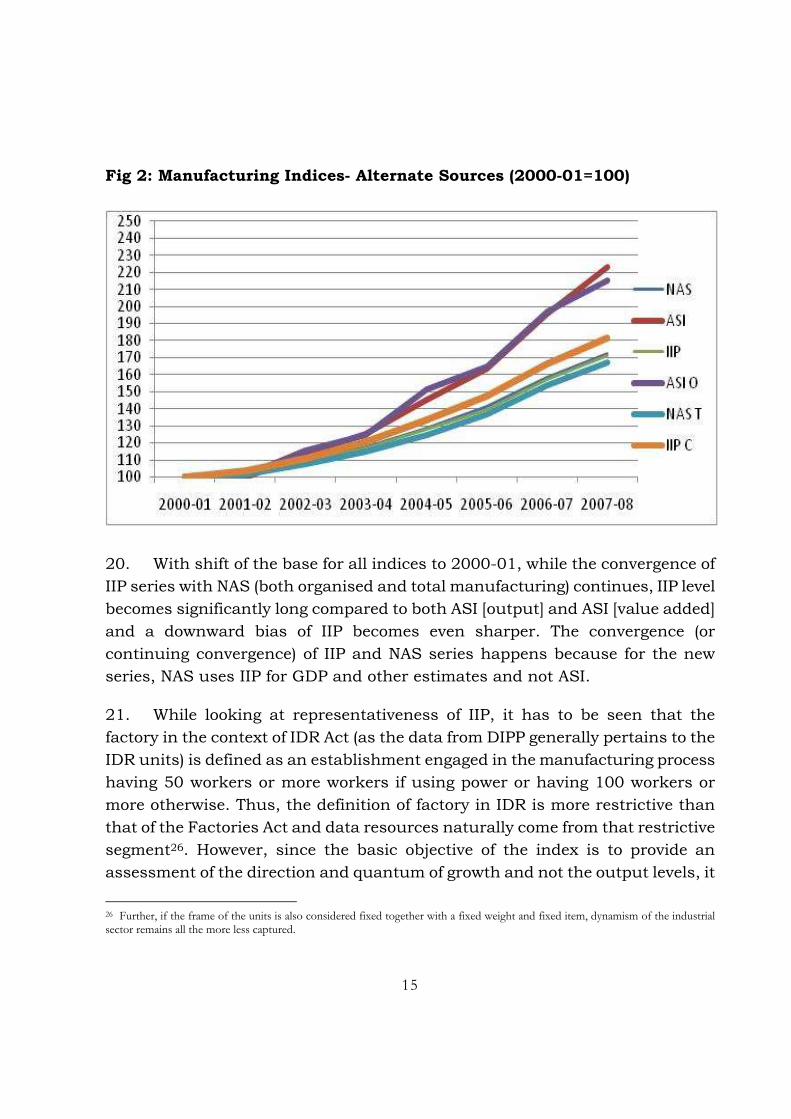
26. CAGR during 2000-01 to 2007-08 indicate that the downward bias in the
growth rate measured in terms of IIP becomes significant when compared with
the growth rates of the manufacturing sector based on ASI. The only two sectors
comprising the food products and chemicals and chemical products continue to
show a higher rate of growth in terms of IIP. The difference in two growth rates
is substantially higher for wood & wood products, rubber, plastic & petroleum
products, metal products and machinery and transport equipments and parts.
19
Overall downward bias in the manufacturing growth measured in terms of IIP
sticks to (-) 3.62 per cent and (-) 4.17 per cent, depending on whether the
comparison is with ASI (Output) of ASI (Value Added).
Table 10: Compound Annual growth (2000-01 to 2007-08) of manufacturing group (per cent)
NAS (OS)
ASI (VA) IIP
ASI (O )
NAS (T)
Average Annual
Difference in growth rates
ASI (VA) ASI (O)
Food products 6.22 5.13 6.83 6.36 5.92 1.7 0.47
Textiles and apparels 5.39 7.79 5.26 7.93 5.43 -2.53 -2.67
Wood and wood products 2.96 13.20 2.96 15.15 2.96 -10.24 -12.19
Paper and paper products 6.53 7.79 6.53 8.32 6.53 -1.26 -1.79
Leather and leather products 1.91 11.22 1.62 11.62 1.91 -9.6 -10
Chemicals and chemical products 8.53 6.55 8.54 6.24 8.53 1.99 2.3
Rubber, Plastic & Petroleum Products 6.99 19.62 7.00 16.47 6.99 -12.62 -9.47
Non mineral metallic products 5.78 12.98 5.77 9.39 5.78 -7.21 -3.62
Metals 11.10 17.00 11.11 13.71 11.10 -5.89 -2.6
Metal products & Machinery 8.59 12.87 9.59 14.78 8.89 -3.28 -5.19
Transport equipments and parts 10.32 17.22 10.32 16.68 10.32 -6.9 -6.36
Overall Manufacturing 8.07 12.14 7.97 11.59 7.64 -4.17 -3.62
Alternative IIP – A failed experiment
27. In response to the growing unreliability of the current IIP, Arun Ghosh
Committee in 1998 suggested computing an alternative IIP (AIPP) by using
monthly production data collected from factories employing 200 and more
workers through NSSO. An exploratory exercise was undertaken by the Field
Operations Division of NSSO for April 92 to March 1994. Initially NSSO, through
personal visits, collected with a response rate of up to 80 per cent of factories.
This method could not be continued as fell to around 27 per cent in eight
months. The average response rate for 12 months during which data were
collected by FOD field staff was 46 per cent, which is lower than the response
rate of the existing source agencies30. Therefore, the data collection by personal
visits does not seem any better than that collected by the source agencies.
Other issues
30 R Nagraj, Economic and Political weekly, February 6, 1999
20
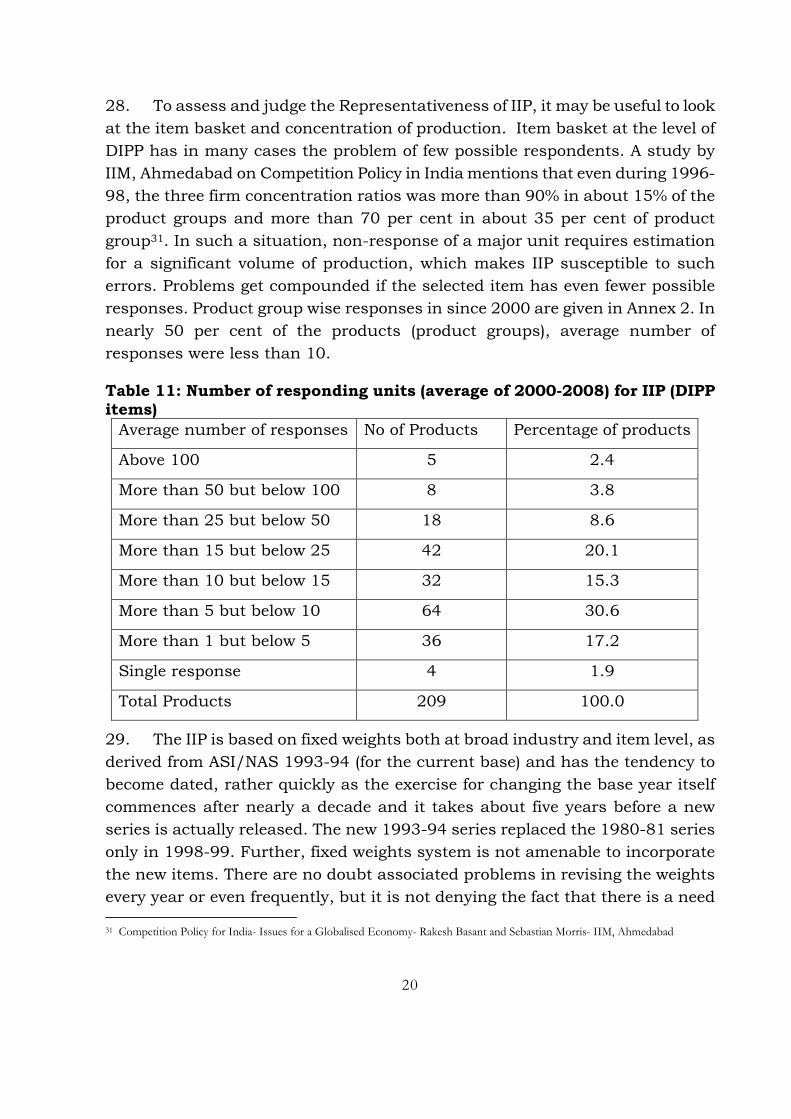
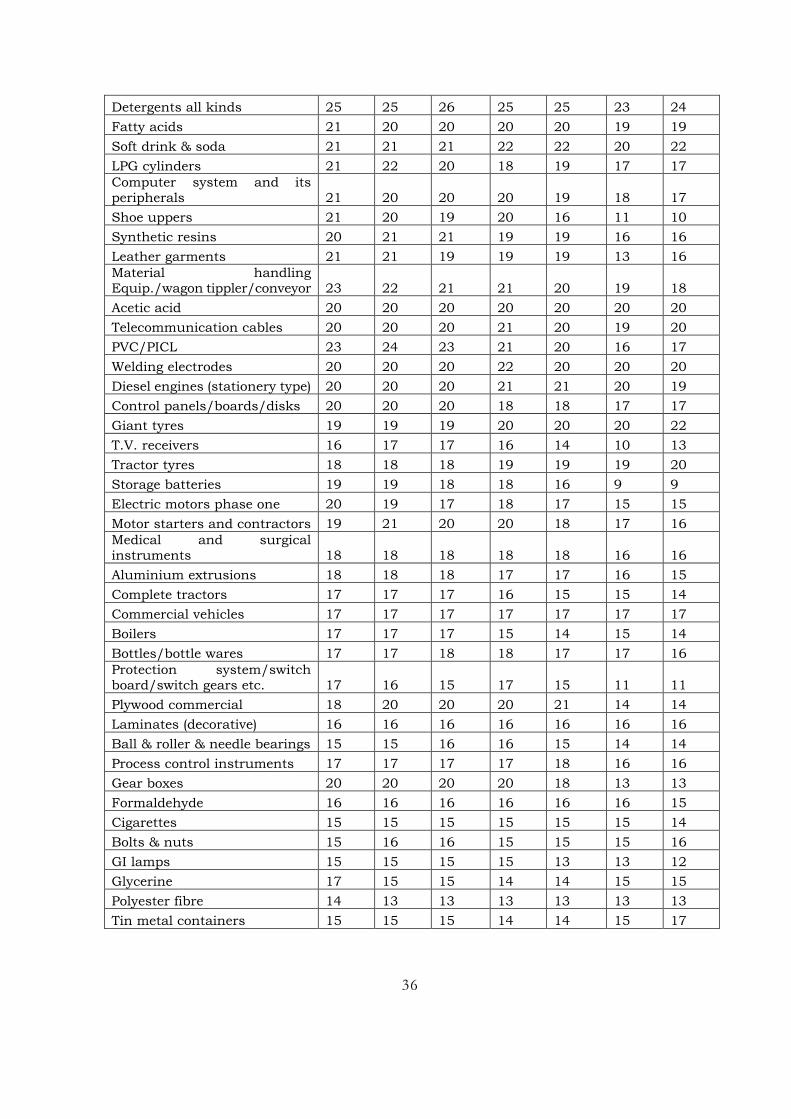
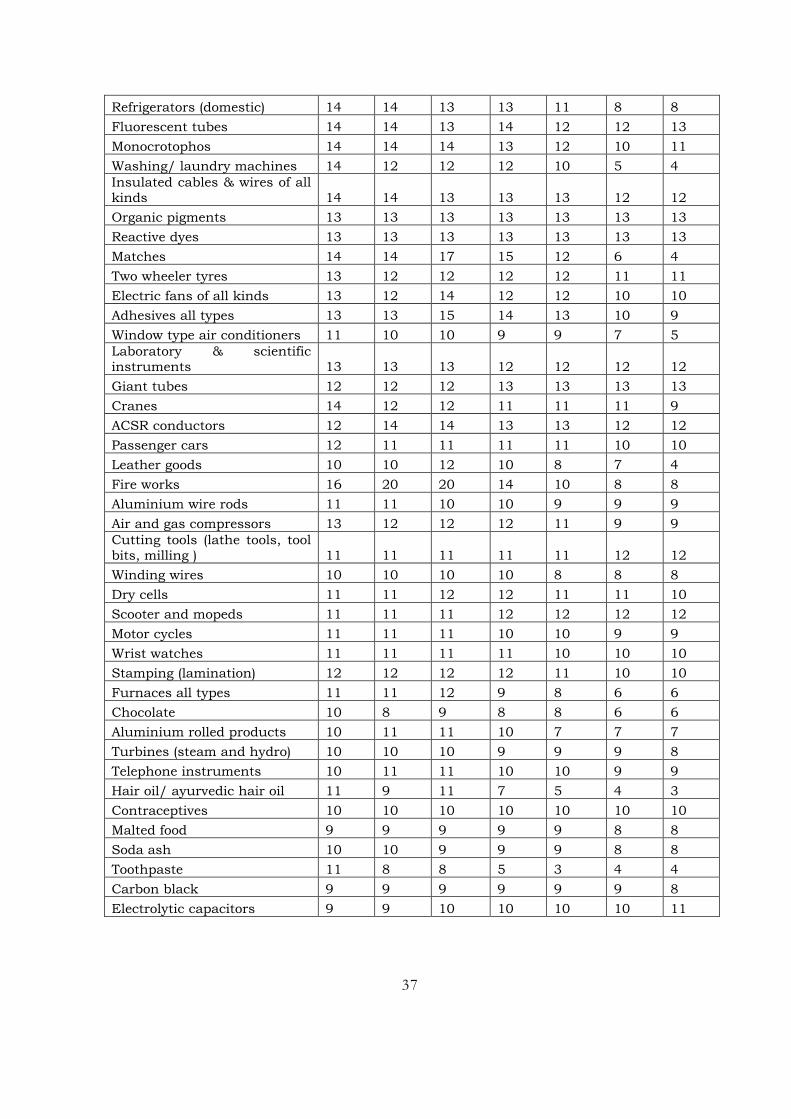
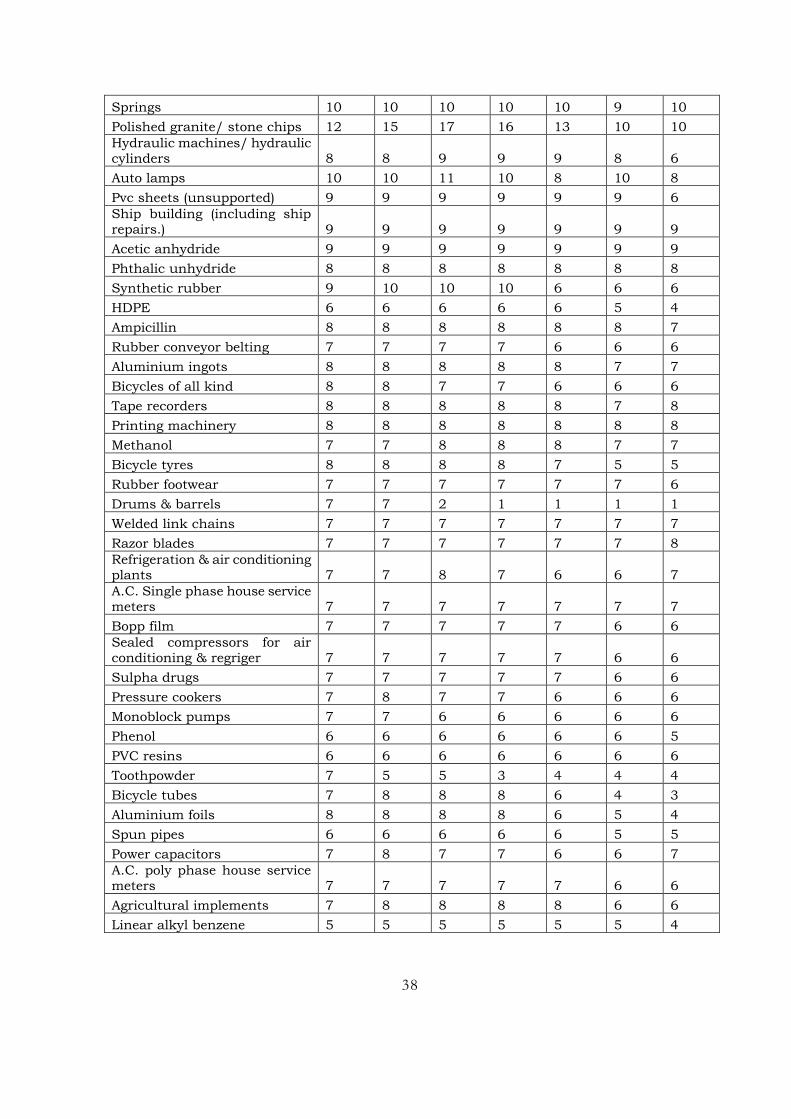
28. To assess and judge the Representativeness of IIP, it may be useful to look
at the item basket and concentration of production. Item basket at the level of
DIPP has in many cases the problem of few possible respondents. A study by
IIM, Ahmedabad on Competition Policy in India mentions that even during 1996-
98, the three firm concentration ratios was more than 90% in about 15% of the
product groups and more than 70 per cent in about 35 per cent of product
group31. In such a situation, non-response of a major unit requires estimation
for a significant volume of production, which makes IIP susceptible to such
errors. Problems get compounded if the selected item has even fewer possible
responses. Product group wise responses in since 2000 are given in Annex 2. In
nearly 50 per cent of the products (product groups), average number of
responses were less than 10.
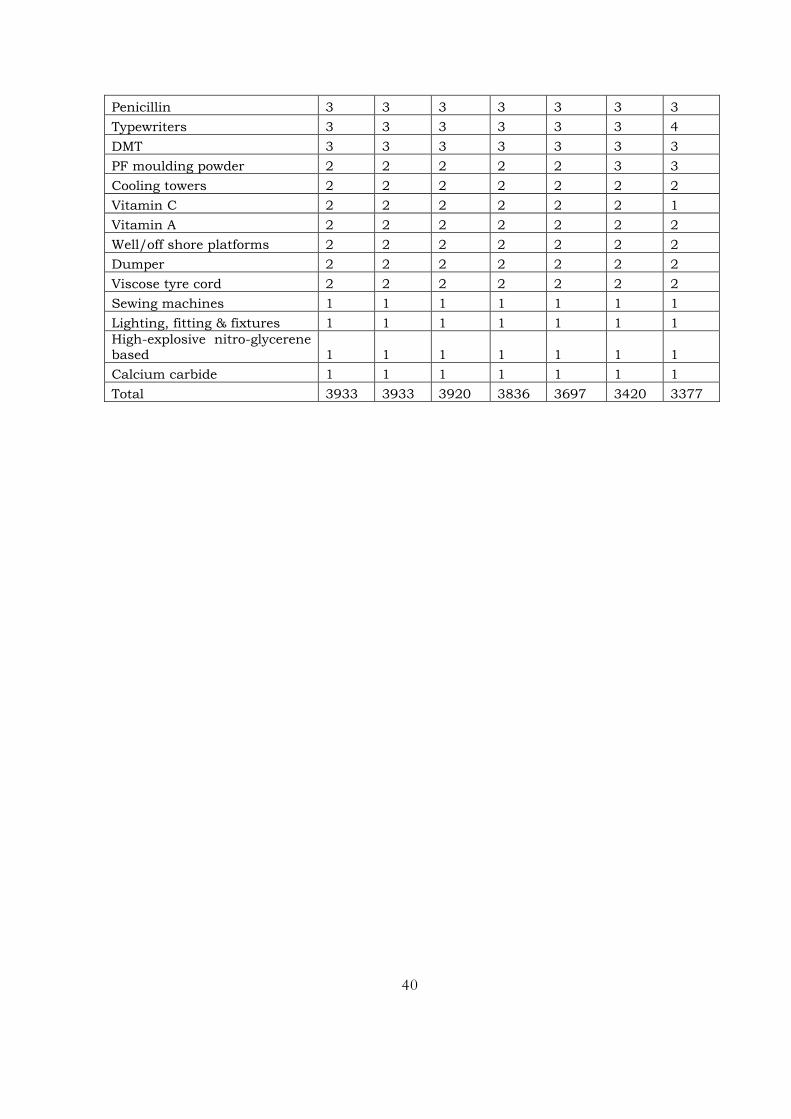
Table 11: Number of responding units (average of 2000-2008) for IIP (DIPP items)
Average number of responses No of Products Percentage of products
Above 100 5 2.4
More than 50 but below 100 8 3.8
More than 25 but below 50 18 8.6
More than 15 but below 25 42 20.1
More than 10 but below 15 32 15.3
More than 5 but below 10 64 30.6
More than 1 but below 5 36 17.2
Single response 4 1.9
Total Products 209 100.0
29. The IIP is based on fixed weights both at broad industry and item level, as
derived from ASI/NAS 1993-94 (for the current base) and has the tendency to
become dated, rather quickly as the exercise for changing the base year itself
commences after nearly a decade and it takes about five years before a new
series is actually released. The new 1993-94 series replaced the 1980-81 series
only in 1998-99. Further, fixed weights system is not amenable to incorporate
the new items. There are no doubt associated problems in revising the weights
every year or even frequently, but it is not denying the fact that there is a need
31 Competition Policy for India- Issues for a Globalised Economy- Rakesh Basant and Sebastian Morris- IIM, Ahmedabad
21
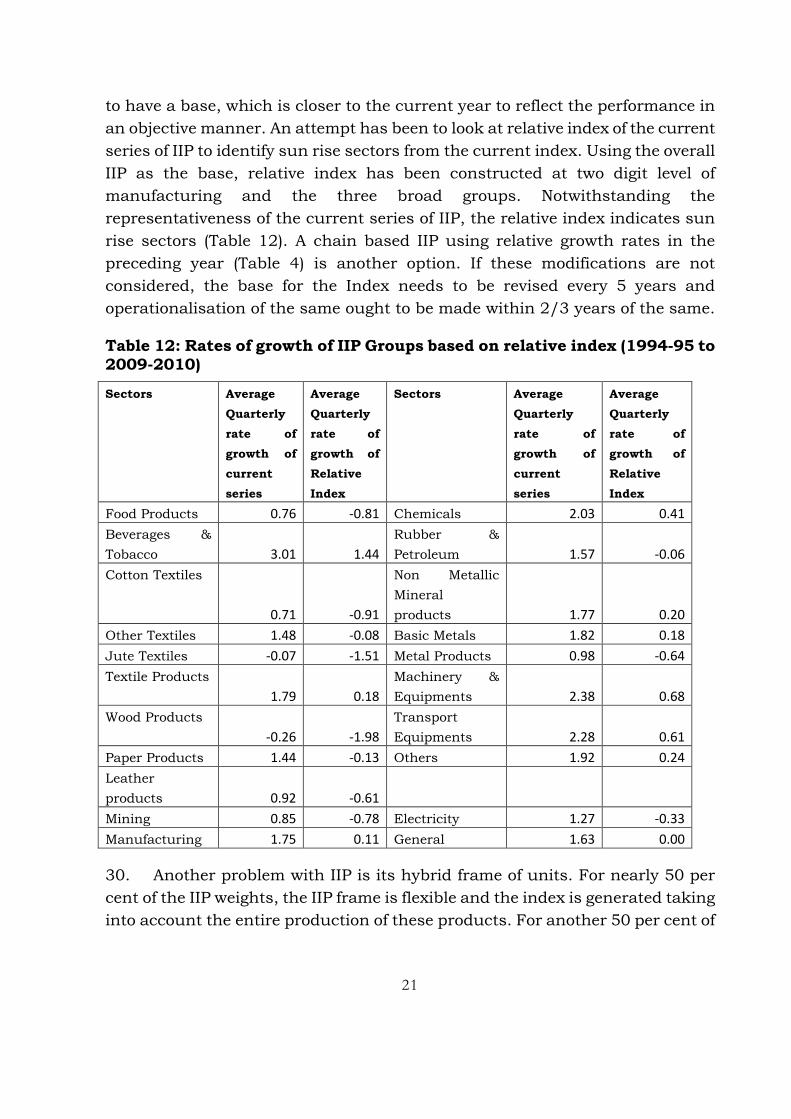
to have a base, which is closer to the current year to reflect the performance in
an objective manner. An attempt has been to look at relative index of the current
series of IIP to identify sun rise sectors from the current index. Using the overall
IIP as the base, relative index has been constructed at two digit level of
manufacturing and the three broad groups. Notwithstanding the
representativeness of the current series of IIP, the relative index indicates sun
rise sectors (Table 12). A chain based IIP using relative growth rates in the
preceding year (Table 4) is another option. If these modifications are not
considered, the base for the Index needs to be revised every 5 years and
operationalisation of the same ought to be made within 2/3 years of the same.
Table 12: Rates of growth of IIP Groups based on relative index (1994-95 to 2009-2010)
Sectors Average
Quarterly
rate of
growth of
current
series
Average
Quarterly
rate of
growth of
Relative
Index
Sectors Average
Quarterly
rate of
growth of
current
series
Average
Quarterly
rate of
growth of
Relative
Index
Food Products 0.76 -0.81 Chemicals 2.03 0.41
Beverages &
Tobacco 3.01 1.44
Rubber &
Petroleum 1.57 -0.06
Cotton Textiles
0.71 -0.91
Non Metallic
Mineral
products 1.77 0.20
Other Textiles 1.48 -0.08 Basic Metals 1.82 0.18
Jute Textiles -0.07 -1.51 Metal Products 0.98 -0.64
Textile Products
1.79 0.18
Machinery &
Equipments 2.38 0.68
Wood Products
-0.26 -1.98
Transport
Equipments 2.28 0.61
Paper Products 1.44 -0.13 Others 1.92 0.24
Leather
products 0.92 -0.61
Mining 0.85 -0.78 Electricity 1.27 -0.33
Manufacturing 1.75 0.11 General 1.63 0.00
30. Another problem with IIP is its hybrid frame of units. For nearly 50 per
cent of the IIP weights, the IIP frame is flexible and the index is generated taking
into account the entire production of these products. For another 50 per cent of
22
the IIP weight the frame of units is fixed. IIP in these products captures only the
change in the production of the units in the frame. This leads to a downward
bias because it ignores the new units which come into production. In a note of
dissent to the Report of the Technical Advisory Committee on revision of base
change of IIP, the DIPP had mentioned that for the organised sector the fixed
frame approach may not be appropriate32. In fact, all manufacturing units
covered under the Industrial (Development and Regulation) Act are required to
submit a monthly production return (MPR) to DIPP. This MPR forms the basis of
information that is then furnished to CSO for generation of index. This
submission of MPR is mandatory for all IDR units (units employing 50 or more
workers with power). While there may have some slackness in enforcing this
mandatory provision, non inclusion of the new units in nearly half of IIP weight
products is perhaps a methodological compromise.
31. Another problem with the Index is the unit of measurement. Since Index is
a fixed base, real growth for most of the items is measured in terms of quantities
such as tonnage, numbers. For capital goods and other heterogeneous products,
the unit of measurement is value, which is then deflated by appropriate price
deflators. Currently WPI is used as deflators. But the problem arises in respect
of items that are measured in terms of quantity as it bundles the commodities of
different values into a single unit. There are over 40 items in the current series
of IIP which has numbers as a unit. Value range of the products bundled as
numbers (wheel mounted dumpers/loaders; glazed tiles; diesel engines for DIPP
and MSME; air conditioners, refrigerators; cars; commercial vehicles; wrist
watches; washing machines covering domestic and laundry type as a single
product; air/gas compressors for DIPP and MSME; gear boxes; electric fans, etc)
may be quite significant. Globally value deflated by appropriate price deflators is
the most common measure of volume indices.
32. The system is also not able to capture the technological changes. As on
date we neither have such a methodology nor do we adopt a splicing method for
incorporating new item/deleting the obsolete items. Splicing is not necessarily
merger of two index series; it could be merger of items. Further, where there are
items which have less than three producers/possible respondents, it may be
32 DIPP has generally adopted the DGTD frame, updated based on entry of new units. Further, despite the abolition of Industrial Licensing for most of the products, DIPP receives the Industrial Entrepreneur Memoranda (IEMs). Units also file part B with the implementation of IEMs.

23
more appropriate to club them with other items in the same industry group,
because the estimates in case of non response could drastically alter the index
values. The difficulties of aggregation of different products could be sorted by
using the value with appropriate deflators. It is also in conformity of the basic
tenets of data collection of not disclosing the identity of individual source.
33. There are no clear-cut guidelines for the number of months the data
should be repeated for non-reporting units. Last reported month sometimes give
a misleading picture as happened in April 2000. Provisional and revised growth
rates differed significantly. Since data sets are frozen after four months, entire
revision is booked in the immediate month, causing at times really significant
differences. IIP as is being compiled currently is biased towards the ASI census
sector or organised manufacturing. While, it may be possible to have a separate
index for unorganised sector at sectoral or at aggregate level, possibility its
merger with organised sector IIP to generate a combined number and aggregate
and sector level needs to be explored.
34. The current series of IIP, as was with the earlier series, witnesses a
gradual erosion of representativeness because of its dated base and non
dynamic response. There has not being a regular validation of IIP with alternate
data sources by way of an established institutional mechanism. While revision of
base is a time consuming and difficult exercise, such difficulties get
compounded, particularly in terms of response for the back series of
information, if the base change takes longer. A quicker change and its faster
operationalization become critical. However, as this study and the previous
studies indicate the downward bias of IIP has not only persisted but also
increased over time, there is need to look at the methodology of IIP. Validation of
IIP and ASI is not only necessary to see the persistence of the difference in
industrial performance based on these two sources, it is also necessary for
validation of ASI. Abnormal fluctuations have also been observed in ASI data33.
The validation is critical for the credibility of the entire industrial statistical
information system.
33 An Analytical Study of ASI Data, Dr Pravin Shukla- Paper presented in National Seminar on ASI, October 7, 2010
24
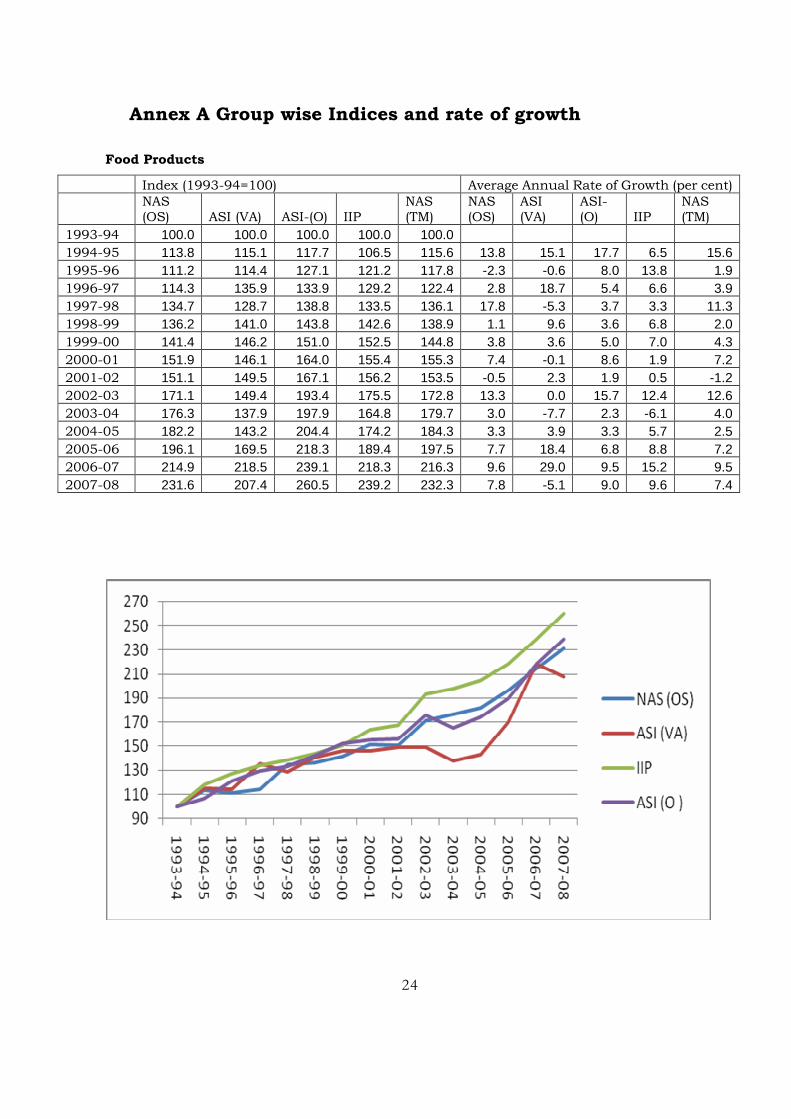
Annex A Group wise Indices and rate of growth
Food Products
Index (1993-94=100) Average Annual Rate of Growth (per cent)
NAS (OS) ASI (VA) ASI-(O) IIP
NAS (TM)
NAS (OS)
ASI (VA)
ASI-(O) IIP
NAS (TM)
1993-94 100.0 100.0 100.0 100.0 100.0 1994-95 113.8 115.1 117.7 106.5 115.6 13.8 15.1 17.7 6.5 15.6 1995-96 111.2 114.4 127.1 121.2 117.8 -2.3 -0.6 8.0 13.8 1.9 1996-97 114.3 135.9 133.9 129.2 122.4 2.8 18.7 5.4 6.6 3.9 1997-98 134.7 128.7 138.8 133.5 136.1 17.8 -5.3 3.7 3.3 11.3 1998-99 136.2 141.0 143.8 142.6 138.9 1.1 9.6 3.6 6.8 2.0 1999-00 141.4 146.2 151.0 152.5 144.8 3.8 3.6 5.0 7.0 4.3 2000-01 151.9 146.1 164.0 155.4 155.3 7.4 -0.1 8.6 1.9 7.2 2001-02 151.1 149.5 167.1 156.2 153.5 -0.5 2.3 1.9 0.5 -1.2 2002-03 171.1 149.4 193.4 175.5 172.8 13.3 0.0 15.7 12.4 12.6 2003-04 176.3 137.9 197.9 164.8 179.7 3.0 -7.7 2.3 -6.1 4.0 2004-05 182.2 143.2 204.4 174.2 184.3 3.3 3.9 3.3 5.7 2.5 2005-06 196.1 169.5 218.3 189.4 197.5 7.7 18.4 6.8 8.8 7.2 2006-07 214.9 218.5 239.1 218.3 216.3 9.6 29.0 9.5 15.2 9.5 2007-08 231.6 207.4 260.5 239.2 232.3 7.8 -5.1 9.0 9.6 7.4
25
Textiles and Apparels
Index (1993-94=100) Average Annual Rate of Growth (per cent)
NAS (OS) ASI (VA) ASI-(O) IIP
NAS (TM)
NAS (OS) ASI (VA) ASI-(O) IIP NAS (TM)
1993-94 100.0 100.0 100.0 100.0 100.0 1994-95 109.2 108.4 101.9 109.5 105.2 9.2 8.4 1.9 9.5 5.2 1995-96 91.8 93.9 119.3 114.6 103.5 -16.0 -13.3 17.0 4.7 -1.6 1996-97 118.6 111.7 131.5 122.7 123.9 29.3 18.9 10.2 7.1 19.7 1997-98 124.4 120.4 142.3 150.0 130.8 4.9 7.8 8.2 22.2 5.6 1998-99 114.3 117.8 136.6 140.1 122.0 -8.1 -2.2 -4.0 -6.6 -6.7 1999-00 123.3 127.5 145.6 161.4 130.3 7.9 8.2 6.6 15.2 6.8 2000-01 132.5 131.5 151.3 169.1 141.5 7.5 3.1 3.9 4.7 8.6 2001-02 128.5 115.5 152.4 152.6 135.5 -3.1 -12.2 0.7 -9.7 -4.3 2002-03 137.1 127.6 158.1 164.4 146.0 6.7 10.5 3.8 7.7 7.7 2003-04 135.4 123.4 157.7 163.7 143.8 -1.3 -3.3 -0.2 -0.4 -1.5 2004-05 151.1 137.7 172.4 187.3 161.4 11.6 11.6 9.3 14.4 12.2 2005-06 165.9 174.5 186.2 227.6 178.1 9.8 26.8 8.0 21.5 10.3 2006-07 184.2 216.7 206.4 283.8 197.8 11.0 24.1 10.9 24.7 11.1 2007-08 191.4 222.3 216.5 288.4 204.9 3.9 2.6 4.9 1.6 3.6

26
Wood and Wood Products
Index (1993-94=100) Average Annual Rate of Growth (per cent)
NAS (OS) ASI (VA) ASI-(O) IIP
NAS (TM)
NAS (OS) ASI (VA) ASI-(O) IIP NAS (TM)
1993-94 100.0 100.0 100.0 100.0 100.0 1994-95 93.6 96.7 99.3 100.5 99.0 -6.4 -3.3 -0.7 0.5 -1.0 1995-96 91.9 99.1 123.2 100.3 121.3 -1.8 2.5 24.1 -0.2 22.6 1996-97 126.4 158.2 131.9 131.9 131.6 37.5 59.7 7.0 31.6 8.4 1997-98 80.8 76.7 128.5 92.0 125.6 -36.0 -51.5 -2.6 -30.2 -4.5 1998-99 143.5 52.1 121.0 68.5 122.3 77.6 -32.1 -5.8 -25.6 -2.6 1999-00 162.8 75.0 101.4 86.1 105.1 13.4 44.1 -16.2 25.7 -14.1 2000-01 167.3 68.9 104.3 98.8 108.0 2.8 -8.1 2.8 14.7 2.8 2001-02 148.9 84.2 92.8 156.7 96.2 -11.0 22.1 -10.9 58.6 -11.0 2002-03 122.7 91.2 76.5 130.8 79.2 -17.6 8.3 -17.6 -16.6 -17.6 2003-04 131.1 94.8 81.7 160.5 84.6 6.9 4.0 6.9 22.7 6.9 2004-05 119.9 90.8 74.8 185.7 77.4 -8.5 -4.2 -8.5 15.7 -8.5 2005-06 113.1 147.7 70.5 201.2 73.0 -5.7 62.6 -5.7 8.4 -5.7 2006-07 146.0 105.2 91.0 221.2 94.3 29.1 -28.7 29.1 9.9 29.1 2007-08 205.2 164.1 127.9 265.2 132.5 40.5 56.0 40.5 19.9 40.5
27
Paper and Paper Products
Index (1993-94=100) Average Annual Rate of Growth (per cent)
NAS (OS) ASI (VA) ASI-(O) IIP
NAS (TM)
NAS (OS) ASI (VA) ASI-(O) IIP NAS (TM)
1993-94 100.0 100.0 100.0 100.0 100.0 1994-95 110.2 113.3 108.6 115.9 109.8 10.2 13.3 8.6 15.9 9.8 1995-96 114.5 125.3 125.5 127.6 117.5 3.9 10.6 15.6 10.1 7.0 1996-97 116.3 111.1 136.9 124.8 121.9 1.5 -11.3 9.1 -2.2 3.7 1997-98 101.6 105.2 146.4 128.0 113.8 -12.6 -5.3 6.9 2.6 -6.6 1998-99 106.0 117.4 169.8 135.2 123.4 4.3 11.6 16.0 5.6 8.4 1999-00 104.5 119.4 180.5 137.4 125.2 -1.5 1.7 6.3 1.7 1.4 2000-01 94.9 136.9 164.0 150.2 113.7 -9.1 14.6 -9.2 9.3 -9.2 2001-02 97.8 111.9 169.0 135.4 117.1 3.0 -18.2 3.0 -9.9 3.0 2002-03 104.4 135.0 180.5 153.9 125.1 6.8 20.6 6.8 13.7 6.8 2003-04 121.1 138.8 208.7 158.2 145.0 15.9 2.8 15.6 2.8 15.9 2004-05 133.5 140.3 230.7 177.2 159.9 10.3 1.1 10.5 12.0 10.3 2005-06 132.3 182.2 228.6 203.3 158.5 -0.9 29.8 -0.9 14.7 -0.9 2006-07 143.8 188.6 248.6 215.2 172.3 8.7 3.6 8.7 5.9 8.7 2007-08 147.7 231.4 255.3 262.8 177.0 2.7 22.7 2.7 22.1 2.7
28
Leather and Leather Products
Index (1993-94=100) Average Annual Rate of Growth (per cent)
NAS (OS) ASI (VA) ASI-(O) IIP
NAS (TM)
NAS (OS) ASI (VA) ASI-(O) IIP NAS (TM)
1993-94 100.0 100.0 100.0 100.0 100.0 1994-95 79.4 82.4 86.6 108.5 83.8 -20.6 -17.6 -13.5 8.5 -16.2 1995-96 76.5 85.3 98.5 106.8 90.0 -3.7 3.5 13.8 -1.5 7.4 1996-97 68.3 90.4 107.8 108.2 92.6 -10.6 6.0 9.5 1.3 2.9 1997-98 91.6 101.4 110.2 124.4 103.0 34.0 12.2 2.2 14.9 11.3 1998-99 97.9 100.2 119.1 121.5 110.9 6.8 -1.1 8.1 -2.3 7.7 1999-00 90.0 98.5 135.5 110.9 117.9 -8.1 -1.8 13.7 -8.8 6.3 2000-01 97.4 90.4 150.0 135.1 127.7 8.3 -8.2 10.7 21.9 8.3 2001-02 104.2 108.3 158.0 151.1 136.6 6.9 19.8 5.4 11.8 6.9 2002-03 99.8 110.9 152.9 161.9 130.8 -4.2 2.4 -3.2 7.2 -4.2 2003-04 95.1 108.3 147.0 158.3 124.7 -4.7 -2.4 -3.9 -2.2 -4.7 2004-05 103.7 103.2 156.9 161.1 135.9 9.0 -4.7 6.8 1.7 9.0 2005-06 99.8 134.9 149.3 186.9 130.8 -3.8 30.7 -4.8 16.1 -3.8 2006-07 99.7 164.0 150.2 219.5 130.7 -0.1 21.5 0.6 17.4 -0.1 2007-08 111.2 190.3 167.8 291.6 145.8 11.5 16.0 11.7 32.8 11.5
29
Chemicals and Chemical Products
Index (1993-94=100) Average Annual Rate of Growth (per cent)
NAS (OS) ASI (VA) ASI-(O) IIP
NAS (TM)
NAS (OS) ASI (VA) ASI-(O) IIP NAS (TM)
1993-94 100.0 100.0 100.0 100.0 100.0 1994-95 103.6 102.6 105.3 103.9 103.7 3.6 2.6 5.3 3.9 3.7 1995-96 130.6 134.9 117.1 125.6 129.5 26.1 31.5 11.2 20.9 24.9 1996-97 145.3 131.2 122.7 125.8 143.5 11.3 -2.8 4.7 0.2 10.8 1997-98 139.6 128.2 140.4 153.2 139.6 -4.0 -2.2 14.4 21.8 -2.7 1998-99 166.6 171.7 149.7 162.3 165.3 19.4 33.9 6.6 5.9 18.3 1999-00 170.2 175.4 164.6 173.8 169.7 2.1 2.2 9.9 7.1 2.7 2000-01 182.6 145.7 176.6 171.0 182.1 7.3 -16.9 7.3 -1.6 7.3 2001-02 191.3 137.8 185.0 160.9 190.8 4.8 -5.4 4.8 -5.9 4.8 2002-03 198.3 148.4 191.8 167.0 197.8 3.7 7.7 3.7 3.7 3.7 2003-04 214.4 157.0 208.4 180.3 213.9 8.1 5.8 8.6 8.0 8.1 2004-05 246.5 176.5 238.6 206.0 245.9 15.0 12.4 14.5 14.3 15.0 2005-06 267.1 195.7 258.5 227.8 266.4 8.4 10.9 8.3 10.6 8.4 2006-07 292.8 214.0 283.4 252.1 292.1 9.6 9.4 9.6 10.7 9.6 2007-08 323.7 227.2 313.4 261.2 322.8 10.5 6.1 10.6 3.6 10.5
30
Rubber, Plastic & Petroleum Products
Index (1993-94=100) Average Annual Rate of Growth (per cent)
NAS (OS) ASI (VA) ASI-(O) IIP
NAS (TM)
NAS (OS) ASI (VA) ASI-(O) IIP NAS (TM)
1993-94 100.0 100.0 100.0 100.0 100.0 1994-95 103.9 105.2 107.7 109.7 104.7 3.9 5.2 7.7 9.7 4.7 1995-96 118.7 123.8 116.1 134.5 118.1 14.2 17.7 7.8 22.6 12.8 1996-97 154.8 136.9 118.4 131.1 147.3 30.4 10.6 2.0 -2.5 24.7 1997-98 134.8 99.0 124.6 133.7 132.7 -12.9 -27.7 5.2 2.0 -9.9 1998-99 134.2 137.2 138.7 150.1 135.1 -0.4 38.7 11.3 12.3 1.8 1999-00 128.3 133.4 137.2 164.7 130.1 -4.4 -2.8 -1.0 9.7 -3.7 2000-01 143.9 108.4 153.4 148.6 145.9 12.1 -18.8 11.8 -9.8 12.1 2001-02 159.9 128.8 170.4 180.8 162.1 11.1 18.9 11.1 21.7 11.1 2002-03 168.6 194.2 179.7 228.9 171.0 5.5 50.7 5.5 26.6 5.5 2003-04 176.1 227.2 187.7 256.6 178.6 4.4 17.0 4.4 12.1 4.4 2004-05 180.1 240.0 192.2 298.3 182.6 2.2 5.6 2.4 16.3 2.2 2005-06 187.9 277.1 200.5 318.8 190.5 4.3 15.5 4.3 6.9 4.3 2006-07 212.1 302.9 226.3 376.3 215.1 12.9 9.3 12.9 18.0 12.9 2007-08 230.9 379.8 246.4 432.0 234.2 8.9 25.4 8.9 14.8 8.9

31
Non metallic mineral products
Index (1993-94=100) Average Annual Rate of Growth (per cent)
NAS (OS) ASI (VA) ASI-(O) IIP
NAS (TM)
NAS (OS) ASI (VA) ASI-(O) IIP NAS (TM)
1993-94 100.0 100.0 100.0 100.0 100.0 1994-95 111.1 111.5 108.3 108.1 110.0 11.1 11.5 8.3 8.1 10.0 1995-96 137.8 144.1 133.9 124.4 136.3 24.0 29.2 23.6 15.1 23.9 1996-97 186.9 126.6 144.5 126.0 170.7 35.7 -12.2 7.9 1.3 25.2 1997-98 154.1 150.2 163.9 141.4 157.9 -17.5 18.7 13.5 12.2 -7.5 1998-99 135.9 142.2 177.5 137.7 151.8 -11.8 -5.3 8.3 -2.6 -3.8 1999-00 193.5 202.4 220.8 184.2 203.9 42.4 42.4 24.4 33.8 34.3 2000-01 191.2 196.4 218.2 173.9 201.5 -1.2 -3.0 -1.2 -5.6 -1.2 2001-02 193.4 190.1 220.7 168.9 203.9 1.2 -3.2 1.2 -2.9 1.2 2002-03 203.3 184.4 232.0 179.9 214.3 5.1 -3.0 5.1 6.5 5.1 2003-04 210.7 192.0 240.6 193.8 222.1 3.6 4.1 3.7 7.7 3.6 2004-05 214.1 254.6 244.3 232.7 225.6 1.6 32.6 1.5 20.1 1.6 2005-06 237.6 247.8 271.1 231.6 250.5 11.0 -2.7 11.0 -0.5 11.0 2006-07 268.0 347.9 305.8 275.3 282.5 12.8 40.4 12.8 18.9 12.8 2007-08 283.3 461.5 323.2 326.0 298.6 5.7 32.7 5.7 18.4 5.7
32
Metals
Index (1993-94=100) Average Annual Rate of Growth (per cent)
NAS (OS) ASI (VA) ASI-(O) IIP
NAS (TM)
NAS (OS) ASI (VA) ASI-(O) IIP NAS (TM)
1993-94 100.0 100.0 100.0 100.0 100.0 1994-95 123.4 122.7 113.1 113.0 121.7 23.4 22.7 13.1 13.0 21.7 1995-96 145.8 148.6 131.0 134.3 143.3 18.2 21.1 15.8 18.9 17.8 1996-97 158.8 135.4 139.8 117.5 155.5 8.9 -8.9 6.7 -12.5 8.5 1997-98 156.2 188.0 143.5 151.0 154.0 -1.6 38.9 2.6 28.5 -1.0 1998-99 162.6 165.6 139.9 134.6 158.7 4.1 -11.9 -2.5 -10.9 3.0 1999-00 172.8 176.1 146.9 152.2 168.3 6.3 6.3 5.0 13.1 6.1 2000-01 176.1 133.6 149.6 140.5 171.5 1.9 -24.1 1.9 -7.7 1.9 2001-02 183.5 125.8 156.0 143.3 178.8 4.3 -5.9 4.3 1.9 4.3 2002-03 200.5 176.7 170.4 177.6 195.3 9.3 40.4 9.3 24.0 9.3 2003-04 218.7 208.0 186.0 197.4 213.0 9.1 17.8 9.2 11.1 9.1 2004-05 230.7 283.9 196.1 249.3 224.7 5.5 36.5 5.4 26.3 5.5 2005-06 267.1 235.3 227.0 242.0 260.2 15.8 -17.1 15.8 -2.9 15.8 2006-07 328.1 314.6 278.9 310.8 319.7 22.8 33.7 22.8 28.4 22.8 2007-08 367.9 401.2 312.7 345.4 358.4 12.1 27.5 12.1 11.1 12.1
33
Metal products & Machinery
Index (1993-94=100) Average Annual Rate of Growth (per cent)
NAS (OS) ASI (VA) ASI-(O) IIP
NAS (TM)
NAS (OS) ASI (VA) ASI-(O) IIP NAS (TM)
1993-94 100.0 100.0 100.0 100.0 100.0 1994-95 118.9 119.9 112.7 117.0 115.3 18.9 19.9 12.7 17.0 15.3 1995-96 139.5 144.1 130.4 146.9 132.9 17.3 20.2 15.7 25.5 15.3 1996-97 147.8 139.0 142.4 143.5 141.1 6.0 -3.5 9.2 -2.3 6.2 1997-98 149.3 146.2 149.0 160.8 147.2 1.0 5.2 4.6 12.1 4.3 1998-99 164.6 169.6 154.6 179.6 160.3 10.3 16.0 3.8 11.7 8.9 1999-00 168.1 167.3 167.2 187.6 162.0 2.1 -1.3 8.2 4.4 1.1 2000-01 181.0 153.0 182.5 175.7 174.7 7.7 -8.5 9.1 -6.3 7.8 2001-02 182.0 157.2 183.5 184.8 174.7 0.6 2.8 0.6 5.2 0.0 2002-03 187.7 159.8 187.3 205.2 181.1 3.1 1.6 2.0 11.1 3.7 2003-04 206.4 176.0 211.0 225.9 199.2 9.9 10.1 12.7 10.1 10.0 2004-05 236.6 193.9 248.2 263.7 229.5 14.7 10.2 17.6 16.7 15.2 2005-06 266.4 250.9 278.7 335.9 259.5 12.6 29.4 12.3 27.4 13.1 2006-07 294.2 307.7 314.3 406.4 287.6 10.5 22.6 12.8 21.0 10.8 2007-08 322.1 357.1 346.4 461.1 317.0 9.5 16.0 10.2 13.4 10.2

34
Transport and Equipments
Index (1993-94=100) Average Annual Rate of Growth (per cent)
NAS (OS) ASI (VA) ASI-(O) IIP
NAS (TM)
NAS (OS) ASI (VA) ASI-(O) IIP NAS (TM)
1993-94 100.0 100.0 100.0 100.0 100.0 1994-95 119.8 118.7 112.9 125.9 119.0 19.8 18.7 12.9 25.9 19.0 1995-96 184.2 180.8 132.5 174.5 178.7 53.8 52.4 17.3 38.6 50.1 1996-97 177.0 187.5 149.1 177.9 174.0 -3.9 3.7 12.6 2.0 -2.6 1997-98 171.0 163.3 152.9 165.3 169.1 -3.4 -12.9 2.5 -7.1 -2.8 1998-99 143.3 142.6 183.6 152.9 147.6 -16.2 -12.7 20.1 -7.5 -12.7 1999-00 184.7 182.1 194.1 201.2 185.7 28.8 27.7 5.7 31.6 25.8 2000-01 181.1 138.7 190.3 186.0 182.1 -1.9 -23.9 -1.9 -7.5 -1.9 2001-02 193.4 160.3 203.3 192.9 194.5 6.8 15.6 6.8 3.7 6.8 2002-03 221.6 188.7 232.9 242.5 222.8 14.6 17.8 14.6 25.7 14.6 2003-04 259.2 255.1 272.6 290.2 260.6 16.9 35.1 17.1 19.6 16.9 2004-05 270.0 323.1 283.7 506.4 271.5 4.2 26.7 4.1 74.5 4.2 2005-06 304.3 399.9 319.7 445.4 305.9 12.7 23.8 12.7 -12.1 12.7 2006-07 350.0 429.0 367.7 517.7 351.9 15.0 7.3 15.0 16.3 15.0 2007-08 360.1 421.7 378.4 547.9 362.0 2.9 -1.7 2.9 5.8 2.9
35
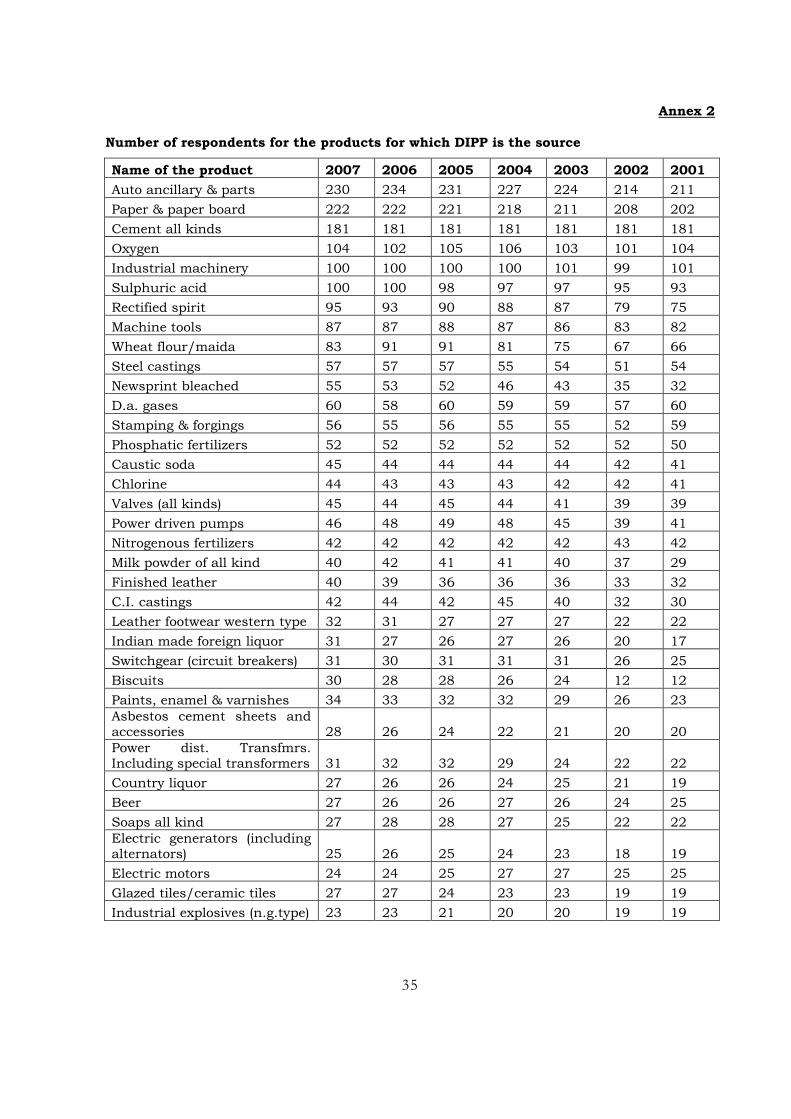
Annex 2
Number of respondents for the products for which DIPP is the source
Name of the product 2007 2006 2005 2004 2003 2002 2001
Auto ancillary & parts 230 234 231 227 224 214 211
Paper & paper board 222 222 221 218 211 208 202
Cement all kinds 181 181 181 181 181 181 181
Oxygen 104 102 105 106 103 101 104
Industrial machinery 100 100 100 100 101 99 101
Sulphuric acid 100 100 98 97 97 95 93
Rectified spirit 95 93 90 88 87 79 75
Machine tools 87 87 88 87 86 83 82
Wheat flour/maida 83 91 91 81 75 67 66
Steel castings 57 57 57 55 54 51 54
Newsprint bleached 55 53 52 46 43 35 32
D.a. gases 60 58 60 59 59 57 60
Stamping & forgings 56 55 56 55 55 52 59
Phosphatic fertilizers 52 52 52 52 52 52 50
Caustic soda 45 44 44 44 44 42 41
Chlorine 44 43 43 43 42 42 41
Valves (all kinds) 45 44 45 44 41 39 39
Power driven pumps 46 48 49 48 45 39 41
Nitrogenous fertilizers 42 42 42 42 42 43 42
Milk powder of all kind 40 42 41 41 40 37 29
Finished leather 40 39 36 36 36 33 32
C.I. castings 42 44 42 45 40 32 30
Leather footwear western type 32 31 27 27 27 22 22
Indian made foreign liquor 31 27 26 27 26 20 17
Switchgear (circuit breakers) 31 30 31 31 31 26 25
Biscuits 30 28 28 26 24 12 12
Paints, enamel & varnishes 34 33 32 32 29 26 23
Asbestos cement sheets and accessories 28 26 24 22 21 20 20
Power dist. Transfmrs. Including special transformers 31 32 32 29 24 22 22
Country liquor 27 26 26 24 25 21 19
Beer 27 26 26 27 26 24 25
Soaps all kind 27 28 28 27 25 22 22
Electric generators (including alternators) 25 26 25 24 23 18 19
Electric motors 24 24 25 27 27 25 25
Glazed tiles/ceramic tiles 27 27 24 23 23 19 19
Industrial explosives (n.g.type) 23 23 21 20 20 19 19
36
Detergents all kinds 25 25 26 25 25 23 24
Fatty acids 21 20 20 20 20 19 19
Soft drink & soda 21 21 21 22 22 20 22
LPG cylinders 21 22 20 18 19 17 17
Computer system and its peripherals 21 20 20 20 19 18 17
Shoe uppers 21 20 19 20 16 11 10
Synthetic resins 20 21 21 19 19 16 16
Leather garments 21 21 19 19 19 13 16
Material handling Equip./wagon tippler/conveyor 23 22 21 21 20 19 18
Acetic acid 20 20 20 20 20 20 20
Telecommunication cables 20 20 20 21 20 19 20
PVC/PICL 23 24 23 21 20 16 17
Welding electrodes 20 20 20 22 20 20 20
Diesel engines (stationery type) 20 20 20 21 21 20 19
Control panels/boards/disks 20 20 20 18 18 17 17
Giant tyres 19 19 19 20 20 20 22
T.V. receivers 16 17 17 16 14 10 13
Tractor tyres 18 18 18 19 19 19 20
Storage batteries 19 19 18 18 16 9 9
Electric motors phase one 20 19 17 18 17 15 15
Motor starters and contractors 19 21 20 20 18 17 16
Medical and surgical instruments 18 18 18 18 18 16 16
Aluminium extrusions 18 18 18 17 17 16 15
Complete tractors 17 17 17 16 15 15 14
Commercial vehicles 17 17 17 17 17 17 17
Boilers 17 17 17 15 14 15 14
Bottles/bottle wares 17 17 18 18 17 17 16
Protection system/switch board/switch gears etc. 17 16 15 17 15 11 11
Plywood commercial 18 20 20 20 21 14 14
Laminates (decorative) 16 16 16 16 16 16 16
Ball & roller & needle bearings 15 15 16 16 15 14 14
Process control instruments 17 17 17 17 18 16 16
Gear boxes 20 20 20 20 18 13 13
Formaldehyde 16 16 16 16 16 16 15
Cigarettes 15 15 15 15 15 15 14
Bolts & nuts 15 16 16 15 15 15 16
GI lamps 15 15 15 15 13 13 12
Glycerine 17 15 15 14 14 15 15
Polyester fibre 14 13 13 13 13 13 13
Tin metal containers 15 15 15 14 14 15 17
37
Refrigerators (domestic) 14 14 13 13 11 8 8
Fluorescent tubes 14 14 13 14 12 12 13
Monocrotophos 14 14 14 13 12 10 11
Washing/ laundry machines 14 12 12 12 10 5 4
Insulated cables & wires of all kinds 14 14 13 13 13 12 12
Organic pigments 13 13 13 13 13 13 13
Reactive dyes 13 13 13 13 13 13 13
Matches 14 14 17 15 12 6 4
Two wheeler tyres 13 12 12 12 12 11 11
Electric fans of all kinds 13 12 14 12 12 10 10
Adhesives all types 13 13 15 14 13 10 9
Window type air conditioners 11 10 10 9 9 7 5
Laboratory & scientific instruments 13 13 13 12 12 12 12
Giant tubes 12 12 12 13 13 13 13
Cranes 14 12 12 11 11 11 9
ACSR conductors 12 14 14 13 13 12 12
Passenger cars 12 11 11 11 11 10 10
Leather goods 10 10 12 10 8 7 4
Fire works 16 20 20 14 10 8 8
Aluminium wire rods 11 11 10 10 9 9 9
Air and gas compressors 13 12 12 12 11 9 9
Cutting tools (lathe tools, tool bits, milling ) 11 11 11 11 11 12 12
Winding wires 10 10 10 10 8 8 8
Dry cells 11 11 12 12 11 11 10
Scooter and mopeds 11 11 11 12 12 12 12
Motor cycles 11 11 11 10 10 9 9
Wrist watches 11 11 11 11 10 10 10
Stamping (lamination) 12 12 12 12 11 10 10
Furnaces all types 11 11 12 9 8 6 6
Chocolate 10 8 9 8 8 6 6
Aluminium rolled products 10 11 11 10 7 7 7
Turbines (steam and hydro) 10 10 10 9 9 9 8
Telephone instruments 10 11 11 10 10 9 9
Hair oil/ ayurvedic hair oil 11 9 11 7 5 4 3
Contraceptives 10 10 10 10 10 10 10
Malted food 9 9 9 9 9 8 8
Soda ash 10 10 9 9 9 8 8
Toothpaste 11 8 8 5 3 4 4
Carbon black 9 9 9 9 9 9 8
Electrolytic capacitors 9 9 10 10 10 10 11
38
Springs 10 10 10 10 10 9 10
Polished granite/ stone chips 12 15 17 16 13 10 10
Hydraulic machines/ hydraulic cylinders 8 8 9 9 9 8 6
Auto lamps 10 10 11 10 8 10 8
Pvc sheets (unsupported) 9 9 9 9 9 9 6
Ship building (including ship repairs.) 9 9 9 9 9 9 9
Acetic anhydride 9 9 9 9 9 9 9
Phthalic unhydride 8 8 8 8 8 8 8
Synthetic rubber 9 10 10 10 6 6 6
HDPE 6 6 6 6 6 5 4
Ampicillin 8 8 8 8 8 8 7
Rubber conveyor belting 7 7 7 7 6 6 6
Aluminium ingots 8 8 8 8 8 7 7
Bicycles of all kind 8 8 7 7 6 6 6
Tape recorders 8 8 8 8 8 7 8
Printing machinery 8 8 8 8 8 8 8
Methanol 7 7 8 8 8 7 7
Bicycle tyres 8 8 8 8 7 5 5
Rubber footwear 7 7 7 7 7 7 6
Drums & barrels 7 7 2 1 1 1 1
Welded link chains 7 7 7 7 7 7 7
Razor blades 7 7 7 7 7 7 8
Refrigeration & air conditioning plants 7 7 8 7 6 6 7
A.C. Single phase house service meters 7 7 7 7 7 7 7
Bopp film 7 7 7 7 7 6 6
Sealed compressors for air conditioning & regriger 7 7 7 7 7 6 6
Sulpha drugs 7 7 7 7 7 6 6
Pressure cookers 7 8 7 7 6 6 6
Monoblock pumps 7 7 6 6 6 6 6
Phenol 6 6 6 6 6 6 5
PVC resins 6 6 6 6 6 6 6
Toothpowder 7 5 5 3 4 4 4
Bicycle tubes 7 8 8 8 6 4 3
Aluminium foils 8 8 8 8 6 5 4
Spun pipes 6 6 6 6 6 5 5
Power capacitors 7 8 7 7 6 6 7
A.C. poly phase house service meters 7 7 7 7 7 6 6
Agricultural implements 7 8 8 8 8 6 6
Linear alkyl benzene 5 5 5 5 5 5 4

39
Particle board 5 5 5 5 5 5 5
PVC pipes/tubes 7 9 9 7 7 5 4
Asbestos cement pressure building pipes 5 5 6 5 5 5 5
Auto rickshaws 5 5 6 6 5 5 5
Alarm time pieces 5 6 6 5 5 4 4
Endosulfan 5 5 5 5 5 5 5
H.T. insulators 5 5 5 5 5 5 5
Agarbathi 7 10 12 9 5 3 3
Railway/ concrete sleeper 5 5 5 5 5 5 5
Diamond tools 5 5 5 5 5 5 5
Wheel mtd dump loaders 5 5 5 5 5 5 5
Corrugated boxes/cartons (all kinds) 6 7 9 11 8 3 2
Ethylene 4 4 4 4 4 4 4
Ethylene glycol 5 5 5 5 5 5 5
Rubber hoses (other type) 5 5 5 5 5 5 4
LDPE 4 4 4 4 4 4 4
Optical whitening agents 5 4 4 4 5 4 4
Titanium dioxide 4 4 4 4 4 4 4
Trimethoprin 4 4 4 4 4 3 3
Cine film & x-ray films 4 4 4 4 4 3 3
Wire ropes 4 4 4 4 4 4 5
T.v. picture tubes 4 3 3 3 3 2 2
Jeep type vehicles 4 4 4 4 4 4 5
Pulp rayon grade 4 4 4 4 4 4 4
Parts & acces. (pump & compressor) 4 4 4 4 4 4 3
Gelatine 4 4 4 4 4 4 4
Graphite electrodes and anodes 4 4 4 4 4 4 4
Aluminium collapsible tubes 4 4 4 4 4 4 5
Viscose staple fibre 4 4 4 3 3 3 3
Nylon tyre cord 4 4 4 4 4 4 4
Azo dyes 4 4 4 4 4 4 4
Leather footwear Indian type 3 3 3 3 3 3 2
Caprolactum 3 3 3 3 3 2 2
Rubber chemicals 3 3 3 3 3 3 3
Copper metal (cathode) 3 4 4 6 4 3 3
Lifts 3 3 3 3 3 3 3
Syringes (all types) 3 3 3 3 3 3 1
Metallic utensils excluding pressure cookers 7 8 10 9 6 2 2
Writing instruments 4 4 4 5 4 1 1
Photo film / roll film 3 3 3 3 3 2 2
40
Penicillin 3 3 3 3 3 3 3
Typewriters 3 3 3 3 3 3 4
DMT 3 3 3 3 3 3 3
PF moulding powder 2 2 2 2 2 3 3
Cooling towers 2 2 2 2 2 2 2
Vitamin C 2 2 2 2 2 2 1
Vitamin A 2 2 2 2 2 2 2
Well/off shore platforms 2 2 2 2 2 2 2
Dumper 2 2 2 2 2 2 2
Viscose tyre cord 2 2 2 2 2 2 2
Sewing machines 1 1 1 1 1 1 1
Lighting, fitting & fixtures 1 1 1 1 1 1 1
High-explosive nitro-glycerene based 1 1 1 1 1 1 1
Calcium carbide 1 1 1 1 1 1 1
Total 3933 3933 3920 3836 3697 3420 3377


