

WORKING PAPERS IN ECONOMICS
No 257
Island Status, Country Size and Institutional Quality in Former Colonies
by
Heather Congdon Fors
June 2007
ISSN 1403-2473 (print) ISSN 1403-2465 (online)
SCHOOL OF BUSINESS, ECONOMICS AND LAW, GÖTEBORG UNIVERSITY
Department of Economics
Visiting address Vasagatan 1 Postal address P.O. Box 640, SE 405 30
Göteborg, Sweden
Phone + 46 (0) 31 786 0000

Island Status, Country Size and
Institutional Quality in Former Colonies
Heather Congdon Fors∗
Department of Economics
Göteborg University
email: [email protected]
Abstract
The purpose of this paper is to explore the effects of island status
and country size on institutional quality, and to determine if these insti-
tutional effects can explain the relatively strong economic performance
of islands and small countries. One of the main findings of this paper
is that the relationship between island status and institutional quality
is significantly positive, and that these results are robust to the inclu-
sion of a number of control variables. Further, we find that country
size is negatively related to institutional quality, which is in keeping
with previous results. Finally, using an instrumental variable method
we demonstrate that when Rule of Law is included in regressions on
levels of per capita GDP, the positive effects of small country size and
island status disappear. These results provide further support for our
hypothesis that institutions account for these countries’ relatively better
economic performance.
Keywords: islands, political institutions, economic institutions,
rule of law, development.
JEL Codes: N40, O10
∗I am grateful for comments from Arne Bigsten, Anke Hoeffler, Johanna Jussila Hammes
and Ola Olsson. All remaining errors are of course my own. I gratefully acknowledge
financial support from the Wallander-Hedelius Foundation.

1 Introduction
The purpose of this paper is to explore the effects of island status and country
size on institutional quality, and to determine if these institutional effects
can explain the relatively strong economic performance of islands and small
countries. The positive relationship between the general quality of institutions
and per capita income is well documented in the empirical literature (Hall and
Jones, 1999; Acemoglu et al, 2001, 2002; Easterly and Levine, 2003; Rodrik
et al, 2004) and as such, the effects of island status and country size on
institutional quality are likely to be pertinent to the economic development
of these countries.
The number of small states in the world has been increasing in recent
decades, stimulating an interest among economists in the effects of country
size and, to a lesser extent, island status on economic growth.1 Interestingly,
the conclusions reached in much of the existing theoretical and empirical lit-
erature regarding these effects tend to diverge. In the theoretical literature,
small countries are thought to suffer from their small labor force, limited in-
ternal markets and high per capita costs of public goods provision. Islands
are thought to face the disadvantages of isolation, remoteness and the corre-
spondingly greater transportation costs that arise as a result. Therefore, the
general conclusions of the theoretical literature are that small country size and
island status act to impede economic growth. The empirical evidence indi-
cates, however, that islands do not face a significant disadvantage in terms of
economic development (Armstrong and Read, 2003) and that small countries
may actually perform better economically than larger countries (Easterly and
Kraay, 2000).
In this paper, we argue that islands and small countries exhibit signifi-
cantly better institutional quality, and that this institutional effect may ac-
count for the divergence in the theoretical and empirical results discussed
above. Support for this hypothesis is found in previous research that indi-
cates that small country size and island status are beneficial to the develop-
ment of democracy (Diamond and Tsalik, 1999; Clague et al, 2001; Srebrnik,
2004). There is even some emerging evidence that small countries (in terms
of geographical area) score significantly better on the World Bank governance
1The issue of country size an island status is particularly relevant in the case of developingcountries. According to the World Bank, there are currently 151 sovereign developingcountries in the world. Of these, 40 have a population of 1.5 million or less, and 29 are islandswith no shared borders. Further, islands constitute the majority of the small countries; 26of the 40 countries with populations under 1.5 million are islands (World Bank, 2006a).
1

indicator Rule of Law than their larger counterparts (Hansson and Olsson,
2006).
The aims of the empirical analysis in this paper are as follows: first, the
impact of island status and country size on institutional quality in former
colonies is examined, drawing on previous theoretical and empirical research.
We are interested in determining whether or not small countries and islands
do in fact have stronger institutions on average. While there exists theoretical
and empirical research that indicates that small country size and island status
are positively related to democratic institutions, there is little research into
the effect of country size and island status on economic institutions. This is
particularly true in the case of islands. Therefore, one contribution of this pa-
per is to establish whether or not small countries and islands have relatively
better economic institutions. Second, we test to see whether the empirical
results indicating that small countries and islands perform relatively better
economically than their larger, continental counterparts can be explained by
differences in institutional quality. To our knowledge there is no other study
that has linked institutional quality to the relatively strong economic per-
formance of islands and small countries. The focus on former colonies is in
keeping in with much of the existing literature on the determinants of insti-
tutional quality, where the colonial experience is thought to play a key role
(Sokoloff and Engerman, 2000; Acemoglu et al, 2001, 2002; Bertocchi and
Canova, 2002; Lange, 2004).2
As many islands countries are small both in terms of population and geo-
graphical area, we believe that it is important to include both size and island
status in the analysis simultaneously in order to rule out the possibility that
islands perform better on measures of institutional quality due purely to their
relatively small size.3 Further, while country size is often measured in terms
of population, there are also arguments for measuring it in terms of geo-
graphical area. Therefore, both measures of country size are included in the
analysis. In addition, two different types of institutions are analyzed. The
first is the Freedom House measure Political Rights, which serves as our mea-
sure of democracy. The second is the World Bank governance indicator Rule
of Law, which serves as our measure of economic institutions. The reason for
2This is not to say that only former colonies have been analyzed in the literature; someresearch has focused on the historical explanations of institutional quality in Europe, forexample (North, 1990; Acemoglu, Johnson and Robinson, 2005).
3 Indeed, there is a tendency in the literature to focus on the specific case of small islanddeveloping states (SIDS), further confounding these two effects (see Brigulio (1995), forexample).
2

examining two different measures of institutional quality is that while democ-
racy is important in its own right, there is evidence that it is not as strongly
related to economic development as other measures of institutions, such as
Rule of Law (Barro, 1996; Rodrik et al, 2004).
One of the main findings of this paper is that the relationship between
island status and institutional quality is significantly positive. Further, these
results are robust to the inclusion of a number of control variables. In keeping
with the results reported above, country size is negatively related to institu-
tional quality. In the case of Political Rights, however, country size becomes
insignificant when a control for island status is included in the regression.
Therefore, country size appears to be less powerful in explaining Political
Rights compared to Rule of Law. Further, using an instrumental variable
method we demonstrate that when Rule of Law is included in regressions on
levels of per capita GDP, the positive effects of small country size and island
status disappear. These results provide further support for our hypothesis
that institutional quality accounts for these countries’ relatively better eco-
nomic performance.
The rest of the paper is organized as follows. Section two provides an
overview of the existing theoretical and empirical literature related to the
effects of country size and island status on institutions and economic growth.
The data and empirical model are presented in section 3, while the results
of the empirical analysis are discussed in section 4. Section 5 concludes the
paper.
2 Country size, islands and institutional quality
2.1 Country size
The idea that country size may be related to democracy is not new. The
Greek philosophers Plato and Aristotle believed that a small population was
essential for a well-functioning democracy. Such beliefs about the optimal-
ity of small population were also found in the works of later philosophers,
including Montesquieu and Rousseau. As a result, most political scientists
and economists interested in the effects of country size on democracy or eco-
nomic growth measure country size in terms of population (see Diamond and
Tsalik (1999), Easterly and Kraay (2000), Armstrong and Read (2000, 2002,
2003) and Knack and Azfar (2003), for example). In the case of democracy,
a small population is thought to bring with it the advantage of homogeneity
and greater participation in the democratic process on the part of the indi-
3

vidual citizens. In terms of economic growth, however, a small population
has been thought to be detrimental. The Lewis model of industrialization,
for example, assumes that the typical developing country has a large agri-
cultural sector and a correspondingly large agricultural labor force (Lewis,
1954). These conditions are obviously not met by small countries. Countries
with small populations are also thought to suffer from their small domestic
markets and the resulting inability to take advantage of scale economies, as
well as the reduced domestic competition and risk for monopolies that arises.
Further, small countries may face difficulties in diversifying their output, leav-
ing them more vulnerable to external economic shocks (Armstrong and Read,
2003). Finally, small countries may face a disadvantage in the provision of
public goods, as a small population leads to a higher per capita cost of public
goods. Therefore, models that attempt to explain country size as an endoge-
nous choice variable tend to focus on the trade-off between the democratic
advantages and the economic disadvantages of a small population (Alesina
and Spolaore, 1997, 2003).
Another, much less common, means of measuring country size is area
(Dahl and Tufte, 1973; Rigobon and Rodrik, 2005; Hansson and Olsson,
2006). In this case, country size is thought to affect the total cost (rather
than per capita cost) of public goods provision. Hansson and Olsson (2006)
argue that the diffusion of public goods (among which they include institu-
tions such as rule of law) from the capital to the hinterland is more efficient
in geographically small countries than in larger countries.4 Therefore, it may
not be the case that geographically small countries suffer from a significantly
higher per capita cost of public goods if provision of public goods is signifi-
cantly more expensive in geographically large countries. In terms of economic
growth, however, geographic size is thought to have little impact. While
land area may possibly act as a proxy for natural resource abundance, there
is little evidence that area is correlated with measures of economic activity
(Armstrong and Read, 2003).
While there is some theoretical and empirical evidence that country size
in terms of area may be endogenous (Alesina and Spolaore, 1997, 2003), we
would argue that this is not likely to be the case with former colonies. Sup-
4They further argue that countries with a centrally located capital are even betterequipped to disseminate public goods throughout the country. This argument bears somesimilarity to the argument put forth by Herbst (2000), where the geographical attributes ofa country play an important role in the capability of the state to effectively broadcast itspower across the entire nation.
4

port for this assumption is found first and foremost in Africa, where borders
are often considered to have been drawn in a somewhat arbitrary fashion
(Herbst, 2000; Engelbert et al, 2002). Population, on the other hand, is more
variable over time than area. Further, population is more likely to be directly
related to the level of economic development, making it potentially difficult to
distinguish the effects of population on institutional quality from the effects
of income. Therefore, measuring country size in terms of area may have some
advantages over population. It is difficult, however, to argue a priori for one
measure of country size over the other. Therefore, we will test both measures
separately in the remainder of this paper.5
2.2 Islands
The characteristics that are often assumed to set islands apart from non-
islands are isolation and remoteness. Despite this, many researchers include
countries such as Dominican Republic, Papua New Guinea and East Timor
in the island category. Perhaps a stricter definition of an island is a country
with no land borders. One advantage of this definition is that it makes it even
more reasonable to assume that country size in area is exogenous.6
Baldicchino (2005) argues that island jurisdictions are better suited to
the accumulation of social capital, making them more likely to develop into
democracies and facilitating in their economic development. In terms of eco-
nomic growth, small island countries are thought to face the disadvantage
of increased transportation costs due to their geographic isolation, including
potentially high internal transportation costs in the case of island archipela-
goes (Armstrong and Read, 2003). Therefore, island status is, much like
small size, thought to be an advantage in terms of political institutions, but
a disadvantage in terms of economic growth.
2.3 Previous empirical results
There is growing empirical evidence that countries with small populations,
and small island countries in particular, are more likely to be stable democ-
racies than their large, continental counterparts (Hadenius, 1992; Stepan and
Skach, 1993; Diamond and Tsalik, 1999; Clague et al, 2001, Srebrnik, 2004).
The question that arises, however, is whether these results are driven by the
fact that a small population is thought to have a positive effect on democracy,
5 In our sample of former colonies, the correlation between area and population is 0.8499.6One could of course argue that the size of islands is not fully exogenous, as there are
island nations that consist of several small islands. We believe, however, that country sizecan be considered quite exogenous despite these exceptions.
5

or whether there is an additional advantage to island status not captured by
size alone. Further, there is some evidence that the link between wealth and
democracy is much weaker in small islands than in large countries, i.e. small
islands are more likely to be democracies even when per capita GDP is low
(Ott, 2000; Anckar, 2002).
Rigobon and Rodrik (2005) estimate the impact of population and area on
democracy simultaneously and find that area has no effect, while population
has a highly significant negative effect on democracy. Their estimates for
the effect of population and area on rule of law show that both variables
are negative and significant, but with a low overall effect compared to the
other control variables. Hansson and Olsson (2006) find a robust negative
relationship between rule of law and country size measured in terms of area.
Overall, the results support the hypothesis that small country size is beneficial
for institutional quality.
The empirical evidence on the effects of country size on economic growth
run counter to the expected results, i.e. there is no great disadvantage associ-
ated with a small population (Armstrong and Read, 2003). In fact, Easterly
and Kraay (2000) found that microstates perform better economically than
larger countries, even after taking into account an array of control variables.
Further, there does not seem to be an economic disadvantage of being an
island (Armstrong and Read, 2003). We believe that the explanation for the
divergence in the theoretical and empirical results lies in institutional quality,
i.e. small countries and islands have stronger institutions than large countries
and non-islands, accounting for the relatively better economic performance
of these countries. This hypothesis will be explored in more detail in the
remainder of the paper.
3 Data specification and general empirical model
Armstrong and Read (2003) and Rigobon and Rodrik (2005) distinguish be-
tween political institutions and economic institutions, where the former are
generally measured in terms of a country’s democratic system and political
sovereignty. The definition of economic institutions, however, is less clear.
Armstrong and Read are interested in economic institutions in terms of eco-
nomic policy sovereignty, i.e. the extent to which a country can determine its
own monetary, fiscal and trade policies, for example. Rigobon and Rodrik, on
the other hand, do not explicitly define economic institutions, but measure
them using the World Bank governance indicator Rule of Law, which measures
6

legal outcomes such as the likelihood of crime, the enforceability of contracts,
and the effectiveness of the court system and the police (Kaufmann, Kraay
and Mastruzzi, 2005). Other common measures of economic institutions used
in empirical analysis are Risk of Government Expropriation (Acemoglu et al,
2001, 2002) and Social Infrastructure (Hall and Jones, 1999). There is some
debate in the literature as to whether these measures can truly be called in-
stitutions (see Glaeser et al (2004), for example) and as such, these measures
are sometimes referred to as structural policies. Despite this debate, measures
such as Rule of Law continue to be used as indicators of institutional quality.
For the purpose of this paper, we will use the Freedom House measure
Political Rights for 2004 as our measure of political institutions.7 Political
rights are measured based for example on how well the electoral process func-
tions, the extent of political pluralism and participation, and how well the
government functions (Freedom House, 2005). Our measure of economic in-
stitutional quality will be the World Bank governance indicator Rule of Law
for 2004. Further, the paper focuses on former colonies, in keeping with much
of the previous research. One reason for this is that former colonies are more
likely to exhibit exogenously determined country size, as discussed in section
2 above. Further, the sample is restricted to former European colonies outside
of continental Europe that were fully independent as of 2004. The reason for
this is two-fold: first, our measure of political institutions (Political Rights) is
only available for independent countries. Second, it is not clear whether po-
litically dependent countries are able to independently choose the institutions
they implement. The second point will be addressed in more detail in section
3.6 below. With these restrictions in mind, our main sample consists of 120
former colonies. Many of the countries included in the sample are very small,
both in terms of population and area. As a result, many of these smallest
countries are not included in cross-country regressions, often due to missing
or unreliable data (this is especially true in the case of economic variables,
such as per capita GDP).
The data for Political Rights and Rule of Law is available for all 120
countries. The original Rule of Law data runs from -2.5 to 2.5 and has been
normalized for the purpose of this paper to run from 0 to 10, where 0 is
7Another measure of democracy commonly used in the literature is the Polity measure.This data is not available, however, for many of the smallest countries in the world. As aresult, I find it preferable to use the Freedom House measure, which is highly correlated withthe Polity measure (the correlation coefficient is 0.9067 for the 93 countries in the samplewhere both the Polity and the Freedom House measures are available).
7

the lowest score a country can achieve and 10 is the highest. The original
Political Rights data runs from 1 to 7, where 1 is the highest score a country
can achieve and 7 is the lowest. Therefore, we invert the Political Rights data
in order to make the two measures of institutions more easily comparable.
Equation (1) summarizes the general empirical model employed in this
paper:
Insti = α0 + α1Islandi + α2Si + α3Xi + ε (1)
where Insti is a measure of institutional quality (in our case, Political Rights
or Rule of Law) in country i and Islandi is a dummy variable taking the value
of one if the country is an island. For the purpose of this paper, only islands
without land borders will be considered as islands.8 Si is logged country
size measured in thousands of square kilometers or population in thousands
(LArea and LPop), Xi is a vector of control variables, and ε is the normally
distributed error term. The coefficients of prime interest are α1and α2, with
α1 expected to be greater than zero and α2 expected to be less than zero
when the other control variables are taken into account.
4 Results
4.1 The basic model
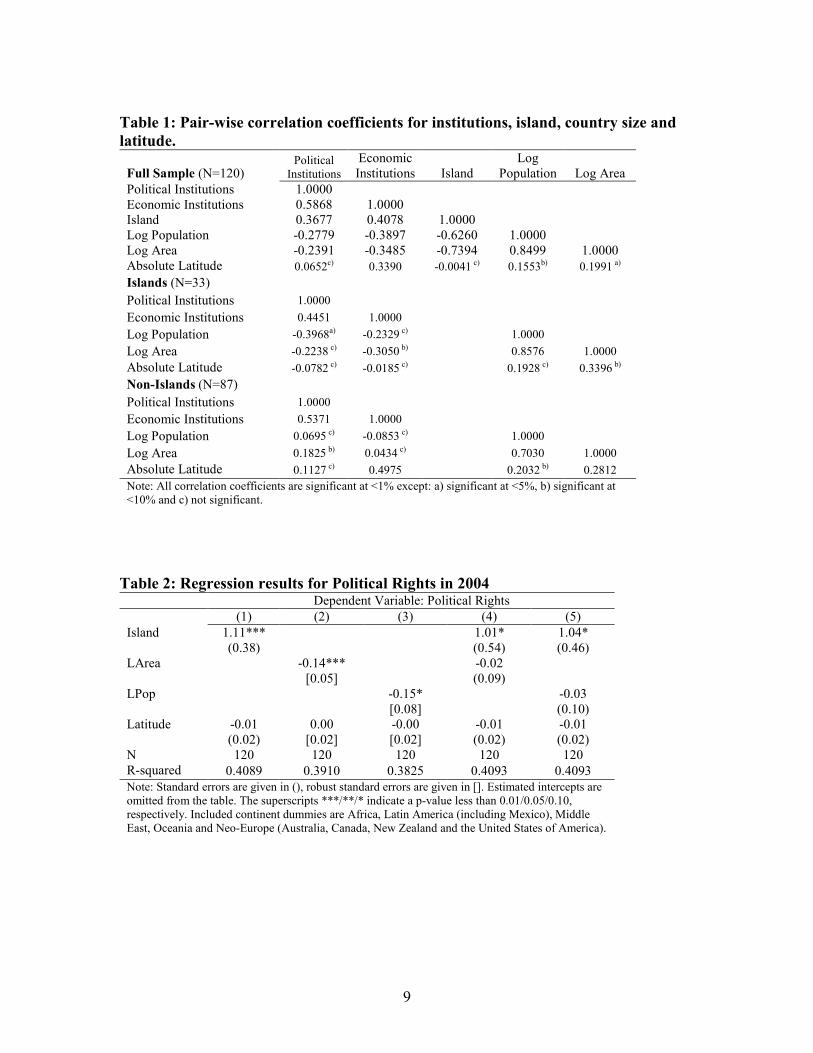
Table 1 shows the correlation coefficients between our two measures of insti-
tutional quality, island status, our two measures of size, and absolute latitude.
For the full sample, there is a negative correlation between country size and
institutional quality, while island status is positively correlated with institu-
tional quality. The correlation between country size and institutional quality
in the sub-samples is weaker and is likely affected by outliers in terms of
country size, such as Canada and the Untied States of America. Therefore, a
multivariate analysis is likely to yield more interesting results.
Table 2 presents the regression results for political institutional quality
(i.e. the dependent variable is Political Rights), controlling for absolute lat-
itude (Latitude) and continent. The absolute value of latitude is meant to
capture exogenous geographic factors that are thought to influence the for-
mation of good institutions, such as the disease environment and the suit-
ability of land for agriculture (Diamond, 1997; Herbst, 2000; Sachs, 2001).
Continent dummies for Oceania, Africa, the Middle East and Latin America
8The only two exceptions to this are Cuba, which has a 29 km border with GuantanamoBay, and Australia, which has no land borders but is considered to be a continent ratherthan an island.
8
9
Table 1: Pair-wise correlation coefficients for institutions, island, country size and
latitude.
Full Sample (N=120) Political
Institutions
Economic
Institutions Island
Log
Population Log Area
Political Institutions 1.0000
Economic Institutions 0.5868 1.0000
Island 0.3677 0.4078 1.0000
Log Population -0.2779 -0.3897 -0.6260 1.0000
Log Area -0.2391 -0.3485 -0.7394 0.8499 1.0000
Absolute Latitude 0.0652c) 0.3390 -0.0041 c) 0.1553b) 0.1991 a)
Islands (N=33)
Political Institutions 1.0000
Economic Institutions 0.4451 1.0000
Log Population -0.3968a) -0.2329 c) 1.0000
Log Area -0.2238 c) -0.3050 b) 0.8576 1.0000
Absolute Latitude -0.0782 c) -0.0185 c) 0.1928 c) 0.3396 b)
Non-Islands (N=87)
Political Institutions 1.0000
Economic Institutions 0.5371 1.0000
Log Population 0.0695 c) -0.0853 c) 1.0000
Log Area 0.1825 b) 0.0434 c) 0.7030 1.0000
Absolute Latitude 0.1127 c) 0.4975 0.2032 b) 0.2812
Note: All correlation coefficients are significant at <1% except: a) significant at <5%, b) significant at
<10% and c) not significant.
Table 2: Regression results for Political Rights in 2004 Dependent Variable: Political Rights
(1) (2) (3) (4) (5)
Island 1.11*** 1.01* 1.04*
(0.38) (0.54) (0.46)
LArea -0.14*** -0.02
[0.05] (0.09)
LPop -0.15* -0.03
[0.08] (0.10)
Latitude -0.01 0.00 -0.00 -0.01 -0.01
(0.02) [0.02] [0.02] (0.02) (0.02)
N 120 120 120 120 120
R-squared 0.4089 0.3910 0.3825 0.4093 0.4093
Note: Standard errors are given in (), robust standard errors are given in []. Estimated intercepts are
omitted from the table. The superscripts ***/**/* indicate a p-value less than 0.01/0.05/0.10,
respectively. Included continent dummies are Africa, Latin America (including Mexico), Middle
East, Oceania and Neo-Europe (Australia, Canada, New Zealand and the United States of America).

(including Mexico) are included, as well as a separate category for Neo-Europe
(Australia, Canada, New Zealand and the Untied States of America). Neo-
European countries are given their own category because they tend to be
outliers, both in terms of country size and in terms of colonial experience.9
In column (1) we present the regression results for the full sample, with
Island as the variable of interest. The results indicate that island countries
have significantly better political institutions, and that Latitude does not have
a significant effect on political institutions. Replacing Island with LArea in
column (2) and LPop in column (3), the results are virtually unchanged. In
both cases, country size is significantly and negatively related to political
institutions, with the relationship between LArea and Political Rights being
more significant than the relationship between LPop and Political Rights. The
effects of the different continents and Latitude are the same as in column (1).
Therefore, island status has a positive effect on political institutions, while
country size has the opposite effect. It is possible, however, that the positive
effect of islands on political institutions is due to their generally small size (see
Table 1), or that the negative effect of country size is driven by the islands in
the sample. Therefore, we include both Island and LArea in column (4), and
Island and LPop in column (5). In both cases, Island remains significantly
and positively related to political institutions (although at a lower level of
significance than in column (1)) while country size becomes insignificant.
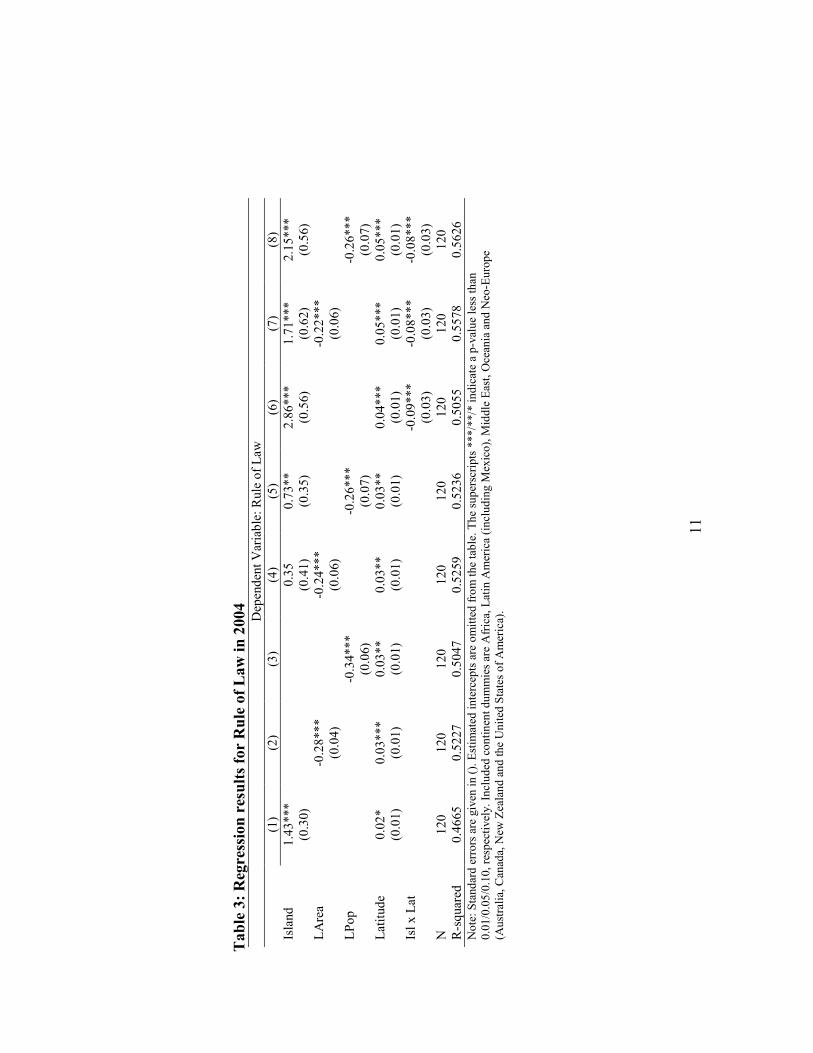
Table 3 presents the regression results when the dependent variable is
Rule of Law. Columns (1)-(3) show the results when Island, LArea and LPop
are tested individually (including the control variables for continent and Lat-
itude). As in Table 2, these three variables are all highly significant in their
respective regressions, with Island exhibiting a positive relationship with Rule
of Law and the size variables exhibiting a negative relationship. Further, Lati-
tude is significantly and positively related to economic institutions in all three
cases. In columns (4) and (5), Island and the respective size variables are in-
cluded in the same regression. The results in column (4) show that Island
becomes insignificant when LArea is included in the regression, while LArea
remains highly significant and negative. In contrast, both Island and LPop
remain significant when included in the same regression. In both (4) and
(5), Latitude is significant and positive. The results in (4) seem to indicate
that much of the significant relationship between Island and Rule of Law can
9Due to their outlier status, the Neo-European countries are sometimes dropped fromempirical analysis (Bertocchi and Canova, 2002).
10
11
Table 3: Regression results for Rule of Law in 2004
Dep
enden
t Var
iable: Rule of Law
(1
) (2
) (3
) (4
) (5
) (6
) (7
) (8
)
Island
1.43***
0.35
0.73**
2.86***
1.71***
2.15***
(0
.30)
(0.41)
(0.35)
(0.56)
(0.62)
(0.56)
LAre
a
-0.28***
-0
.24***
-0.22***
(0.04)
(0
.06)
(0.06)
LPop
-0.34***
-0
.26***
-0.26***
(0
.06)
(0
.07)
(0.07)
Latitude
0.02*
0.03***
0.03**
0.03**
0.03**
0.04***
0.05***
0.05***
(0
.01)
(0.01)
(0.01)
(0.01)
(0.01)
(0.01)
(0.01)
(0.01)
Isl x L
at
-0
.09***
-0.08***
-0.08***
(0.03)
(0.03)
(0.03)
N
120
120
120
120
120
120
120
120
R-squar
ed
0.4665
0.5227
0.5047
0.5259
0.5236
0.5055
0.5578
0.5626
Note: Standard errors are given
in (). E
stim
ated
intercep
ts are omitted fro
m the table. The su
persc
ripts ***/*
*/* indicate a p-v
alue less than
0.01/0.05/0.10, resp
ectively. In
cluded
continen
t dummies ar
e Africa, L
atin
America (includin
g M
exico), M
iddle E
ast, O
cean
ia and N
eo-E
uro
pe
(Australia, C
anad
a, N
ew Z
ealand and the United
States of America)
.

be explained by the fact the islands in the sample are geographically smaller
than the non-islands. However, there are other factors that may come into
play. In column (1), for example, Latitude is much less significant than in
column (2). It is plausible that Latitude is not as relevant for islands as it
is for non-islands if islands are less dependent on agriculture or if islands ex-
perience more moderate temperatures than their continental counterparts on
the same latitude, for example. Further, there are relatively fewer islands in
Africa, the continent where absolute latitude plays the most significant role in
Rule of Law. Therefore, an interaction term between Island and Latitude (Isl
x Lat) is included the regressions run in columns (1), (4) and (5). The results
are presented in columns (6)-(8). In all three cases, Isl x Lat is significant and
negative while Latitude is positive and significant, indicating that Latitude
does not have the same effect on Rule of Law in islands as in non-islands. Fur-
ther, comparing the results in column (4) with column (7), Island becomes
highly significant and positive when Isl x Lat is included in the regression.
It is possible that the effect of size on Rule of Law also differs signifi-
cantly between islands and non-islands. Therefore, regressions including the
respective size variables are run on the island and non-island sub-samples.
The results of these regressions are reported in table 4. Columns (1) and (2)
present the regression results for the island sub-sample. In both cases, the
size variable (LArea and LPop, respectively) is negative and significant, while
Latitude is insignificant. In columns (3) and (4), the regression results for the
non-island sample are reported. Again, both size variables are negative and
significant, with LPop somewhat more significant than LArea. Further, Lati-
tude is positive and significant in both cases. Therefore, the major difference
between the islands and the non-islands in the sample lies in the fact that
Latitude does not significantly effect Rule of Law in the case of islands.
12

Table 4: Regression results for Rule of Law in 2004, island and
non-island samples
Dependent Variable: Rule of Law
(1) (2) (3) (4)Island Islands Islands Non-I Non-I
LArea -0.28** -0.18**(0.10) (0.08)
LPop -0.33** -0.23***(0.15) (0.08)
Latitude -0.03 -0.04 0.05*** 0.05***(0.03) (0.03) (0.01) (0.01)
N 33 33 87 87R-squared 0.4802 0.4415 0.4768 0.4956
Note: Standard errors are given in (). Estimated intercepts are omitted
from the table. The superscripts ***/**/* indicate a p-value less than
0.01/0.05/0.10, respectively. Included continent dummies are Africa,
Latin America (including Mexico), Middle East, Oceania and Neo-Europe
(Australia, Canada, New Zealand and the United States of America).
4.2 Institutions and economic performance
In this subsection, we test the hypothesis that the relatively better economic
performance of islands and small countries can be explained by institutional
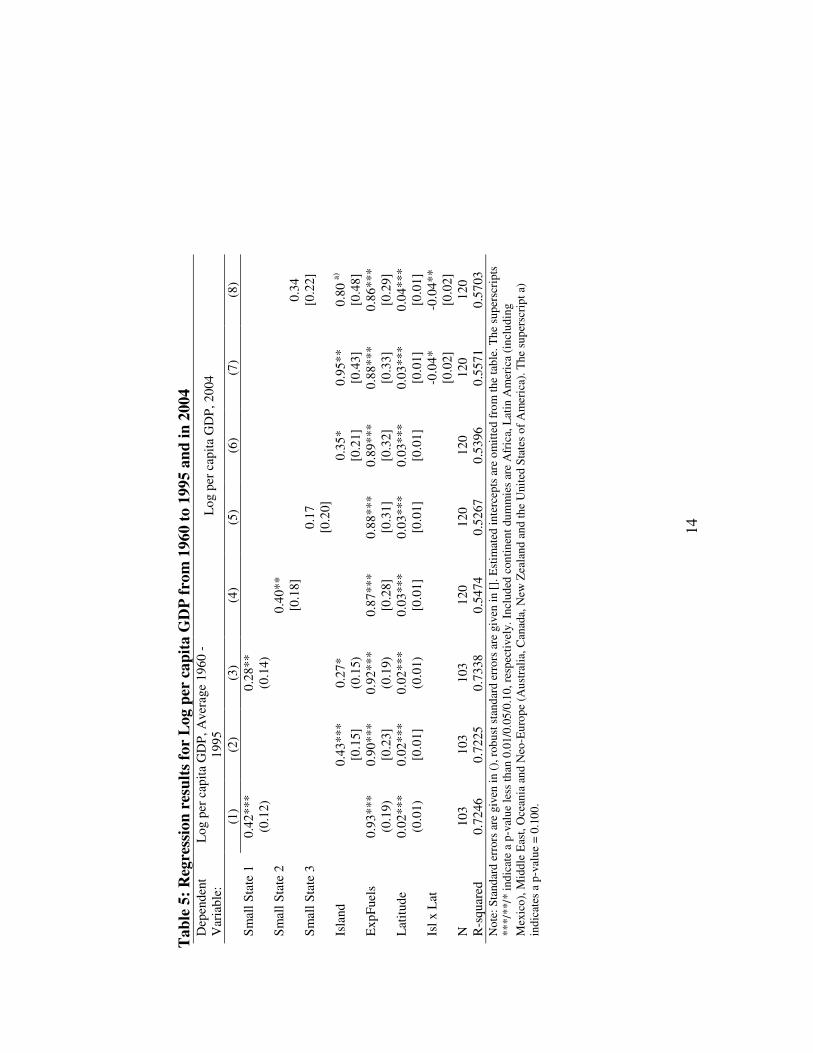
quality. Table 5 presents the regression results for per capita GDP without
controlling for institutions. In columns (1) - (3), the dependent variable is
the natural logarithm of per capita GDP averaged over the years 1960 to
1995. In column (1), a dummy variable is included that takes the value
one if a country is a small state (Small State 1 ). In order to qualify as a
small state, a country must have had an average population of less than one
million between the years 1960 and 1995.10 The data for average GDP and
small state status are taken from Easterly and Kraay (2000) and are available
for 103 of the countries in our sample. In column (2), Island is included
as an independent variable. Further, a dummy variable indicating whether a
country’s major exports are fuels (ExpFuels) is included in both regressions.11
The results show that both Small State 1 and Island are quite significant and
10 In the case of countries that became independent after 1960, the first available year ofdata is used in the averages.
11 This is in keeping with the regressions presented in Easterly and Kraay (2000) where adummy variable indicating that a country was an oil producer was included.
13
14
Tab
le 5
: R
egre
ssio
n r
esu
lts
for
Log p
er c
ap
ita G
DP
fro
m 1
960 t
o 1
995
an
d i
n 2
004
Dep
end
ent
Var
iab
le:
Lo
g p
er c
apit
a G
DP
, A
vera
ge 1
96
0 -
19
95
L
og
per
cap
ita
GD
P,
20
04
(1
) (2
) (3
) (4
) (5
) (6
) (7
) (8
) S
mal
l S
tate
1
0.4
2**
*
0.2
8**
(0
.12)
(0.1
4)
S
mal
l S
tate
2
0
.40
**
[0.1
8]
0
.34
S
mal
l S
tate
3
0.1
7
[0.2
2]
[0
.20]
Isla
nd
0
.43
***
0.2
7*
0.3
5*
0.9
5**
0
.80
a)
[0.1
5]
(0.1
5)
[0.2
1]
[0.4
3]
[0.4
8]
Exp
Fue
ls
0.9
3**
* 0
.90
***
0.9
2**
* 0
.87
***
0.8
8**
* 0
.89
***
0.8
8**
* 0
.86
***
(0
.19)
[0
.23]
(0
.19)
[0
.28]
[0
.31]
[0
.32]
[0
.33]
[0
.29]
L
atit
ude
0.0
2**
* 0
.02
***
0.0
2**
* 0
.03
***
0.0
3**
* 0
.03
***
0.0
3**
* 0
.04
***
(0
.01)
[0
.01]
(0
.01)
[0
.01]
[0
.01]
[0
.01]
[0
.01]
[0
.01]
Is
l x
Lat
-0
.04
* -0
.04
**
[0
.02]
[0
.02]
N
1
03
1
03
1
03
1
20
1
20
1
20
1
20
1
20
R
-sq
uare
d
0.7
246
0
.72
25
0.7
338
0
.54
74
0.5
267
0
.53
96
0.5
571
0
.57
03
No
te:
Sta
ndar
d e
rror
s ar
e gi
ven
in
(),
rob
ust
sta
nd
ard
erro
rs a
re g
iven
in
[].
Est
imat
ed i
nte
rcep
ts a
re o
mit
ted
fro
m t
he
tab
le.
Th
e su
per
scri
pts
**
*/**
/* i
nd
icat
e a
p-v
alu
e le
ss t
han
0.0
1/0
.05
/0.1
0, r
esp
ecti
vely
. In
clu
ded
con
tin
ent
dum
mie
s ar
e A
fric
a, L
atin
Am
eric
a (i
ncl
ud
ing
Mex
ico
), M
idd
le E
ast,
Oce
ania
an
d N
eo-E
uro
pe
(Au
stra
lia,
Can
ada,
New
Zea
lan
d a
nd
th
e U
nite
d S
tate
s o
f A
mer
ica)
. T
he
sup
ersc
rip
t a)
in
dic
ates
a p
-val
ue
= 0
.10
0.

positively related to average per capita GDP. In column (3), Small State 1
and Island are included in the same regression, and both variables are positive
and significant.
In columns (4) - (8), the dependent variable is the natural logarithm of
per capita GDP in 2004. This data is taken from the CIA World Fact Book
and is available for all 120 countries in our sample. Two different measures
of small state status are tested. The first includes all countries that were
considered as small states according to Small State 1 as well as countries not
available in the Easterly and Kraay data with a population in 2004 of 1.5
million or less (Small State 2 ). The main reason that the upper population
limit is extended to 1.5 million is that, due to population growth, many of
the countries considered to be small states according to Small State 1 had
populations of well over 1 million in 2004. The second measure of small state
status includes only countries with a population of one million or less as of
2004 (Small State 3 ). The results in columns (4) and (5) show that Small
State 2 is positively and significantly related to the level of per capita GDP
in 2004, while Small State 3 is insignificant. In columns (6) and (7), Island is
included as an independent variable, with the additional independent variable
Isl x Lat included in (7). In both cases, Island is positively and significantly
related to the level of per capita GDP in 2004, while Isl x Lat is negative
and significant in (7). In column (8), both Small State 2 and Island are
included as independent variables. While both variables are positive neither
is significant, although Island has a p-value of 0.100. Finally, ExpFuels is very
significantly and positively related to the level of per capita GDP in 2004 in
all regressions.
Table 6 presents the two-stage least squares regression results for log per
capita GDP where Rule of Law is included in the regression. The variables
used to instrument for Rule of Law are Island, Latitude, ExpFuels and the
various measures of country size (LArea or one of the small state dummies,
depending on the particular regression), as well as Isl x Lat in columns (4)
- (6). The dependent variable in columns (1) - (3) is log per capita GDP
averaged over the years 1960 to 1995, whereas it is log per capita GDP in
2004 in columns (4) - (6).
In all columns except (3), Rule of Law is significantly and positively related
to log per capita GDP, while the measures of island status and country size
become insignificant. These results lend strong support to our hypothesis that
the positive effects of country size and island status on levels of per capita
15

16
Table 6: Two-stage least squares regression results for Log per capita GDP from 1960
to 1995 and in 2004 controlling for Rule of Law in 2004 Second Stage: Dependent Variable:
Log per capita GDP, Average 1960 -1995
Log per capita GDP, 2004
(1) (2) (3) (4) (5) (6) Rule of Law 0.21** 0.24* 0.11 0.31** 0.27** 0.26* (0.09) [0.14] (0.21) [0.15] [0.13] [0.16] Small State 1 0.16 0.22 (0.16) (0.18) Small State 2 0.01 0.10 [0.24] [0.23] Island 0.04 0.13 -0.03 -0.08 [0.24] (0.30) [0.22] [0.21] ExpFuels 1.00*** 1.00*** 0.96*** 0.87*** 0.87*** 0.86*** (0.16) [0.18] (0.18) [0.20] [0.22] [0.21] Latitude 0.01* 0.01 0.02 0.02*** 0.02*** 0.02*** (0.01) [0.01] (0.01) [0.01] [0.01] [0.01] N 103 103 103 120 120 120 R-squared 0.8177 0.8155 0.7947 0.7086 0.7025 0.7018 First Stage: Dependent Variable: Rule of Law Small State 1 0.62* 0.27 (0.36) (0.41) Small State 2 0.86*** 0.38 (0.30) (0.38) ExpFuels -0.38 -0.23 -0.25 0.02 0.13 0.10 (0.47) (0.47) (0.47) (0.41) (0.40) (0.40) LArea -0.19** -0.16 -0.22*** -0.18** (0.08) (0.09) (0.06) (0.07) Island 1.32*** 0.82* 0.80* 2.48*** 1.70*** 1.76*** (0.38) (0.48) (0.48) (0.57) (0.63) (0.63) Latitude 0.04** 0.05*** 0.04*** 0.04*** 0.05*** 0.05*** (0.01) (0.01) (0.01) (0.01) (0.01) (0.01) Isl x Lat -0.09*** -0.08*** -0.08*** (0.03) (0.03) (0.03) N 103 103 103 120 120 120 R-squared 0.5392 0.5513 0.5535 0.4958 0.5582 0.5629 Note: Standard errors are given in (), robust standard errors are given in []. Estimated intercepts are omitted from the table. The superscripts ***/**/* indicate a p-value less than 0.01/0.05/0.10, respectively. Included continent dummies are Africa, Latin America (including Mexico), Middle East, Oceania and Neo-Europe (Australia, Canada, New Zealand and the United States of America).

GDP are due to the relatively stronger institutional quality in these countries.
4.3 Robustness checks
In this subsection, the robustness of the relationship between island status,
country size and institutional quality is investigated.
4.3.1 Trade openness
The correlation between country size and trade openness in our sample (where
trade openness is measured as imports plus exports as a percentage of GDP)
is between -0.50 and -0.54 (when country size is measured by LArea and
LPop, respectively). This is hardly surprising, as small countries do not have
access to large internal markets. As a result, many small developing coun-
tries have followed markedly different development strategies than their larger
counterparts. During the late 1950s to mid-1980s, developing countries were
encouraged to limit both international trade and the establishment of multi-
national companies within their borders, based in part on the infant industry
argument. These strategies were not feasible for small developing countries,
as their size often necessitated extensive participation in international trade
(Lingle and Wickman, 1999).12
It is plausible, then, that some of the effect of country size on institutional
quality is a result of trade openness. Lingle and Wickman (1999) argue, for
example, that increasing trade liberalization and the free movement of cap-
ital are forcing countries to compete with one another on the basis of their
economic institutions. One empirical study of the relationship between trade
openness and institutions (measured in terms of corruption) is found in Wei
(2000). Wei argues that trade openness can be divided into "natural open-
ness" and "residual openness". A country’s level of natural openness depends
on population size, remoteness, the language spoken by the majority, and geo-
graphical factors, such as the length of the coast and whether the country is an
island or landlocked. He finds that natural openness is significantly negatively
related to corruption, while the effect of residual openness is insignificant.
One shortcoming of Wei’s analysis is that the data on corruption for small
countries (and particularly, small islands) is often missing. Knack and Azfar
(2003) argue that this results in a sample selection bias in favor of small
12Lingle and Wickman (1999) argue that the small open economies (particularly city-states, such as Hong Kong and Singapore) have performed better economically than coun-tries that followed the UN development strategies, due to the former’s integration in worldmarkets. Further, the establishment of multinational corporations in city-states is thoughtto have greatly facilitated the transfer of technology from developed countries.
17

countries, as corruption data has typically been available only for relatively
well-governed small countries. Using an expanded data set, they argue that
the relationship between trade openness and corruption all but disappears.
Despite the findings of Knack and Azfar, the arguments presented by Lin-
gle and Wickman (1999) suggest that there may be a positive relationship
between trade openness and institutional quality, especially in the case of
small countries. Congdon Fors and Olsson (2005) develop a model of endoge-
nous institutional investment where a thriving modern sector provides the
ruling elite with the incentive to invest in property rights institutions. While
this model assumes a closed economy, one could extend the analysis to include
the export sector. If countries that are more open have a greater share of their
economic activity in the modern sector, they would face a greater incentive to
invest in their institutions. However, the model also predicts that abundant
natural resource rents have a potentially detrimental effect on institutional
quality. Therefore, if a country’s trade is dominated by natural resources,
then openness could have a negative effect on institutional quality. Finally,
the preceding arguments suggest that trade openness may be more relevant
for economic institutions than political institutions.
Table 7 presents the regression results for Political Rights when the natural
logarithm of trade openness (LOpen) is included as an independent variable,
along with dummy variables indicating whether a country’s major exports are
non-fuel primary products (ExpNonF ) or fuels (ExpFuels).13 The data for
ExpNonF and ExpFuels is available for all 120 countries in the sample, while
LOpen is only available for 101 countries. The results indicate that LOpen
does not have a significant effect on political institutions, while ExpNonF
and ExpFuels are significantly and negatively related to political institutions.
However, when trade openness and major export categories are included in the
same regression, only ExpFuels remains significant. Further, Island remains
positive and significant in all cases. These results are not altered by the
inclusion of the size variables.
13As mentioned above, openness is measured as exports plus imports as a percentage ofGDP. This measure is employed because the effect of trade volume relative to total GDPon institutional quality is the relationship of interest.
18

Table 7: Regression results for Political Rights in 2004, control-
ling for trade openness and major export category
Dependent Variable: Political Rights
(1) (2) (3) (4) (5)LOpen 0.11 0.17 0.42 0.39
[0.35] [0.34] [0.36] [0.38]ExpNonF -0.84** -0.46 -0.59* -0.46
(0.33) [0.36] [0.35] [0.36]ExpFuels -1.34** -1.29*** -1.56*** -1.36***
(0.54) [0.42] [0.48] [0.43]Island 1.28*** 0.92** 1.18*** 2.01*** 1.50***
[0.36] (0.37) [0.35] [0.51] [0.43]LArea 0.21**
[0.10]LPop 0.14
[0.11]Latitude -0.00 -0.01 -0.00 -0.01 -0.00
[0.02] (0.02) [0.02] [0.02] [0.02]N 101 120 101 101 101R-squared 0.4198 0.4572 0.4533 0.4764 0.4616
Note: Standard errors are given in (), robust standard errors are given in [].
Estimated intercepts are omitted from the table. The superscripts ***/**/*
indicate a p-value less than 0.01/0.05/0.10, respectively. Included continent
dummies are Africa, Latin America (including Mexico), Middle East, Oceania
and Neo-Europe (Australia, Canada, New Zealand and the United States of
America).
The results in table 7 indicate that trade openness does not have a sig-
nificant effect on political institutions. Exports of non-fuel primary products
and fuels, on the other hand, have a negative effect on Political Rights, with
the latter category exhibiting the greatest effect. Further, Island remains
positive significant in all 5 of the regressions. Perhaps the most surprising
result is that LArea becomes positive and significant in (4), although this
may be related to the fact that the 19 countries with missing observations
for LOpen are geographically much smaller on average than the countries for
which LOpen is available.14
Table 8 presents the regression results for Rule of Law when LOpen, Exp-
NonF and ExpFuels are included as independent variables. LOpen and Island
14The average value of LArea for the countries missing LOpen is 1.94 (with a standarddeviation of 3.09). For countries where LOpen is available, the corresponding figure is 4.74(with a standard deviation of 2.67).
19

20
Table 8: Regression results for Rule of Law in 2004, controlling for trade openness and major export category
Dependent Variable: Rule of Law
(1)
(2)
(3)
(4)
(5)
(6)
(7)
(8)
LOpen
0.59**
0.51*
0.65**
0.55**
(0.25)
(0.27)
(0.25)
(0.27)
ExpNonF
-0.45*
-0.57**
-0.42
-0.45*
(0.26)
(0.26)
(0.26)
(0.25)
ExpFuels
-0.07
-0.24
-0.63
-0.64
(0.41)
(0.40)
(0.41)
(0.40)
Island
1.53**
1.62***
1.51**
1.80***
1.43**
1.37**
1.48**
1.58**
(0.64)
(0.61)
(0.63)
(0.58)
(0.65)
(0.62)
(0.66)
(0.62)
LArea
-0.09
-0.20***
-0.05
-0.15**
(0.07)
(0.06)
(0.07)
(0.07)
LPop
-0.12
-0.25***
-0.11
-0.20**
(0.08)
(0.07)
(0.08)
(0.08)
Latitude
0.05***
0.05***
0.04***
0.04***
0.04***
0.04***
0.05***
0.05***
(0.01)
(0.01)
(0.01)
(0.01)
(0.01)
(0.01)
(0.01)
(0.01)
Isl x Lat
-0.05*
-0.05*
-0.06**
-0.07**
-0.04
-0.04
-0.05
-0.05
(0.03)
(0.03)
(0.03)
(0.03)
(0.03)
(0.03)
(0.03)
(0.03)
N
101
101
120
120
101
101
101
101
R-squared
0.5932
0.5951
0.5700
0.5816
0.6101
0.6152
0.5686
0.5790
Note: Standard errors are given in (). Estimated intercepts are omitted from the table. The superscripts ***/**/* indicate a p-value less than
0.01/0.05/0.10, respectively. Included continent dummies are Africa, Latin America (including Mexico), Middle East, Oceania and Neo-
Europe (Australia, Canada, New Zealand and the United States of America).

are both positive and significant in columns (1) and (2), while the size mea-
sures (LArea and LPop, respectively) become insignificant. ExpNonF and
ExpFuels replace LOpen in columns (3) and (4). In both cases, ExpNonF is
negative and significant while ExpFuels is negative and insignificant. Island
remains positive and significant in both cases, while LArea and LPop are sig-
nificant and negative in (3) and (4), respectively. When LOpen is included
together with ExpNonF and ExpFuels, LOpen and Island remain positive
and significant, while the size measures (LArea and LPop, respectively) are
insignificant. ExpNonF is insignificant in (5) and negative and significant in
(6), while ExpFuels is insignificant in both cases.
In contrast to table 7, the results in table 8 indicate that trade open-
ness has a significant and positive effect on economic institutions. This is in
keeping with the fact that the arguments for a positive effect of openness on
institutions listed above were more relevant for economic institutions than
political institutions. Further, the inclusion of LOpen in the regressions ren-
ders country size insignificant, while Island remains significant in all cases.
The results in columns (7) and (8) indicate, however, that this is not due
to missing variables as country size remains significant in the smaller sample
when LOpen is not included in the regression.
Exports of non-fuel primary products has a significantly negative effect on
Rule of Law (except in (5)), whereas exports of fuels do not have a significant
effect on economic institutions. The latter result is somewhat surprising,
given the significance of fuel exports in political institutions. Part of the
explanation may have to do with the fact that fuel exporting countries tend
to have higher GDP per capita than the other countries in the sample, as can
be seen in table 9. Therefore, the positive income effect of fuels may offset
the potentially negative effect on economic institutions. Similarly, the positive
effect of LOpen on Rule of Law may be due in part to the positive effect of
openness on per capita GDP. Exports of non-fuel primary products, on the
other hand, are negatively related to per capita GDP, which may account for
some of the negative effect of ExpNonF on Rule of Law.
Rigobon and Rodrik (2005) use a method known as identification through
heteroskedasticity to control for the endogeneity of trade openness in per
capita GDP. Their results show that trade openness has a negative effect on
per capita GDP, while it has a significant positive effect of Rule of Law and
negative effect on democracy. These results lends some support to our results
that trade openness has a positive effect on economic institutions.
21

22
Table 9: Regression results for Log per capita GDP in 2004 Dependent Variable: Log per capita GDP, 2004 (1) (2) (3) LOpen 0.53*** 0.49*** [0.13] (0.13) ExpNonF -0.29** -0.27* [0.14] (0.14) ExpFuels 0.75** 0.45* [0.35] (0.24) Latitude 0.03*** 0.03*** 0.03*** [0.01] [0.01] (0.01) N 101 120 101 R-squared 0.6062 0.5376 0.6449 Note: Standard errors are given in (), robust standard errors are given in []. Estimated intercepts are omitted from the table. The superscripts ***/**/* indicate a p-value less than 0.01/0.05/0.10, respectively. Included continent dummies are Africa, Latin America (including Mexico), Middle East, Oceania and Neo-Europe (Australia, Canada, New Zealand and the United States of America).
Table 10: Regression results for Rule of Law and Political Rights
in 2004 controlling for vulnerability Dependent Variable:
Rule of Law Political Rights
(1) (2) (3) (4) Vuln 3.02** 2.45 1.49 -0.35 (1.24) (1.56) (1.67) [1.52] Island 2.03*** 1.76** 1.67** 1.04** (0.68) (0.82) (0.73) [0.49] LArea -0.06 (0.10) LPop -0.17 (0.12) Latitude 0.04*** 0.04*** 0.04** -0.02 (0.02) (0.02) (0.02) [0.02] Isl x Lat -0.06 -0.05 -0.05 (0.04) (0.04) (0.04) N 80 80 80 80 R-squared 0.6081 0.6102 0.6183 0.4270 Note: Standard errors are given in (), robust standard errors are given in []. Estimated intercepts are omitted from the table. The superscripts ***/**/* indicate a p-value less than 0.01/0.05/0.10, respectively. Included continent dummies are Africa, Latin America (including Mexico), Middle East, Oceania and Neo-Europe (Australia, Canada, New Zealand and the United States of America).

4.3.2 Vulnerability
Small countries are often considered to be more vulnerable than large coun-
tries due to their greater exposure to exogenous shocks (Briguglio, 1995). Such
exogenous shocks are generally thought to be economic in nature, although
political and environmental shocks also play a role. Easterly and Kraay (2000)
show, for example, that small countries have greater output volatility and a
greater volatility of terms of trade shocks than the large countries in their
sample. They explain this based on the fact that trade accounts for a larger
proportion of GDP in small countries, and that small countries are less able
to diversify their output and their export markets. In terms of politics, small
countries are thought to be vulnerable to external political pressures from
large countries, and hence constrained in their ability to formulate and imple-
ment independent foreign policy. This is in turn is partially due to the fact
that small countries face difficulty in maintaining credible domestic defence,
limiting their strategic options (Armstrong and Read, 2003). Finally, small
countries tend to be more vulnerable to environmental shocks in the form of
natural disasters, due in part to the fact that many small countries are located
in geographic areas where hurricanes and typhoons are common. Indeed, low-
lying islands are especially vulnerable to storms and rising sea-levels resulting
from climate change (Armstrong and Read, 2003).15
An early attempt to measure vulnerability was made by Briguglio (1995).
His Vulnerability Index uses economic measures of vulnerability that take
into account trade openness, transport costs as a share of trade, and the cost
of natural disasters. In table 10, Briguglio’s Vulnerability Index (Vuln) is
included as an independent variable in the Rule of Law and Political Rights
regressions. In columns (1) - (3), Vuln is included as an explanatory variable
for Rule of Law. Vuln is only significant in (1), whereas Island and Latitude
are positive and significant in all cases. In column (4), Vuln is included as
an independent variable in the Political Rights regression, and is found to
be insignificant. Therefore, the effect of vulnerability on Rule of Law and
Political Rights is nearly identical to the effect of trade openness on these
institutions. This is perhaps unsurprising, given the high correlation between
Vuln and LOpen (0.642 for 75 observations).
15An extreme example is the tiny island nation Tuvalu, located in the South Pacific. Thetides have been 1.5 meters higher than average this year, and there are growing fears thatthe islands of the archipelago will become uninhabitable in the near future. The country’sPrime Minister, Maatia Toafa, has suggested that a possible solution is the resettlement ofthe entire population in Australia and New Zealand (Nature, 2006).
23

While the Vulnerability Index is an interesting concept, it is quite sensitive
to specification, as the reliance on economic indicators and the large role that
trade plays in the index may mean that it is mis-specified. Indeed, Armstrong
and Read (2002) find that the Vulnerability Index actually has a significant
and positive effect on the long-run economic growth performance of small
states, which runs counter to the intuition behind the index. Therefore, it is
difficult to ascertain whether the effect of vulnerability on institutions stems
from the fact that vulnerability forces countries to adapt stronger institutions
to help offset shocks, or whether it stems from the positive effects of trade
openness captured by the Vulnerability Index.16
4.3.3 Colonial history
Much of the previous research into the determinants of institutional quality
in former colonies has focused on the extent to which Europeans were able
to establish settlements in the colonies. Acemoglu, Johnson and Robinson
(henceforth AJR) (2001) focus on the effect of settler mortality on institu-
tions, and argue that in former colonies where settler mortality was high,
Europeans did not settle but rather implemented extractive institutions. In
a subsequent paper (AJR, 2002), they use the log of population density in
1500 as an instrument for institutional quality, arguing that countries with a
high population density were less conducive to European settlement and were
likely to have certain institutions in place already that could be used for ex-
tractive purposes. Countries with low population density, on the other hand,
were more conducive to European settlement. Further, it was not as straight-
forward to extract resources from countries with a low population density, as
the requisite infrastructure was often weak or nonexistent.
Another factor that may influence institutional quality is the identity
of the last colonizing power. The empirical evidence indicates that for-
mer British colonies exhibit better economic development after independence
(Grier, 1999) and are generally more democratic than other former colonies
(Clague et al, 2001).
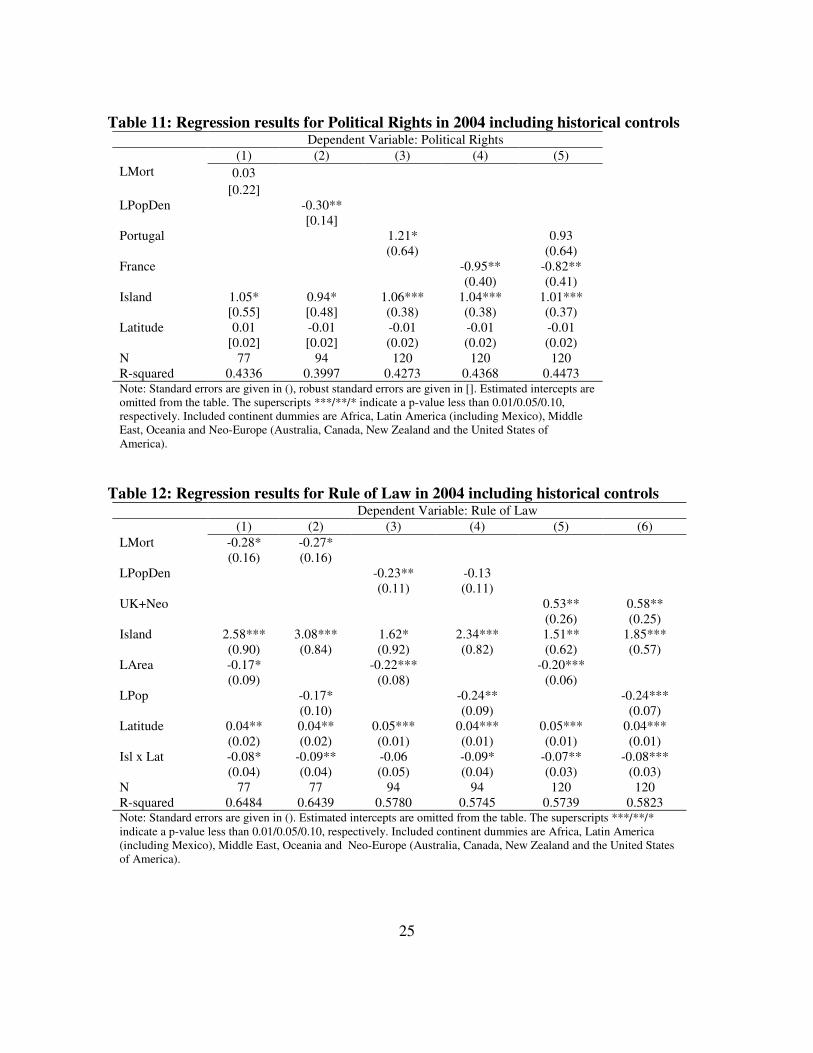
Table 11 presents the regression results for Political Rights when historical
controls are included as independent variables. The log of settler mortality
(LMort) is included in column (1) and is insignificant. In column (2), log
population density in 1500 (LPopDen) is included as an independent vari-
able and is found to be negative and significant. Turning to the identity of
16A regression including both Vuln and LOpen as independent variables renders bothvariables insignificant for both measure of institutions.
24
25
Table 11: Regression results for Political Rights in 2004 including historical controls Dependent Variable: Political Rights (1) (2) (3) (4) (5) LMort 0.03 [0.22] LPopDen -0.30** [0.14] Portugal 1.21* 0.93 (0.64) (0.64) France -0.95** -0.82** (0.40) (0.41) Island 1.05* 0.94* 1.06*** 1.04*** 1.01*** [0.55] [0.48] (0.38) (0.38) (0.37) Latitude 0.01 -0.01 -0.01 -0.01 -0.01 [0.02] [0.02] (0.02) (0.02) (0.02) N 77 94 120 120 120 R-squared 0.4336 0.3997 0.4273 0.4368 0.4473 Note: Standard errors are given in (), robust standard errors are given in []. Estimated intercepts are omitted from the table. The superscripts ***/**/* indicate a p-value less than 0.01/0.05/0.10, respectively. Included continent dummies are Africa, Latin America (including Mexico), Middle East, Oceania and Neo-Europe (Australia, Canada, New Zealand and the United States of America).
Table 12: Regression results for Rule of Law in 2004 including historical controls Dependent Variable: Rule of Law (1) (2) (3) (4) (5) (6) LMort -0.28* -0.27* (0.16) (0.16) LPopDen -0.23** -0.13 (0.11) (0.11) UK+Neo 0.53** 0.58** (0.26) (0.25) Island 2.58*** 3.08*** 1.62* 2.34*** 1.51** 1.85*** (0.90) (0.84) (0.92) (0.82) (0.62) (0.57) LArea -0.17* -0.22*** -0.20*** (0.09) (0.08) (0.06) LPop -0.17* -0.24** -0.24*** (0.10) (0.09) (0.07) Latitude 0.04** 0.04** 0.05*** 0.04*** 0.05*** 0.04*** (0.02) (0.02) (0.01) (0.01) (0.01) (0.01) Isl x Lat -0.08* -0.09** -0.06 -0.09* -0.07** -0.08*** (0.04) (0.04) (0.05) (0.04) (0.03) (0.03) N 77 77 94 94 120 120 R-squared 0.6484 0.6439 0.5780 0.5745 0.5739 0.5823 Note: Standard errors are given in (). Estimated intercepts are omitted from the table. The superscripts ***/**/* indicate a p-value less than 0.01/0.05/0.10, respectively. Included continent dummies are Africa, Latin America (including Mexico), Middle East, Oceania and Neo-Europe (Australia, Canada, New Zealand and the United States of America).
the last colonizing power, five dummy variables were constructed: Portugal,
Spain, France, Belgium, UK or Neo-Europe (UK+Neo), and Other. Only
Portugal and France were significantly related to Political Rights when the
colonial dummies were included separately in the regression. Regardless of
the historical controls included in the regressions, Island remains positive and
significant in all cases, indicating that LMort, LPopDen and the identity of
the last colonizing power do not explain the significance of Island in Political
Rights.
The effects of the various historical control variables on Rule of Law are
reported in table 12. LMort is significantly and negatively related to Rule
of Law, while LPopDen is negative and significant in (3) and insignificant in
(4). UK+Neo is the only colonial variable to exert a significant effect on Rule
of Law when the identity of the last colonizing power is taken into account,
with the relationship being a positive one. In all of the above cases, both
the size variables and Island remain significant, the former negatively so and
the latter positively so. Again, the various historical controls do not explain
the significant positive effect of Island on Rule of Law. Further, while both
LMort and LPopDen are popular instrumental variables in the institutions
literature, they are somewhat restrictive when the variable of interest is Is-
land. The data for LMort is only available for 10 of the islands in the sample,
for example, while the LPopDen data is available for 17 (compared to 33 for
the full sample). In the case of LPopDen, many of the small Caribbean is-
lands have been assigned the same population density as Dominican Republic,
making the data availability for islands somewhat inflated.
While the historical variables listed above are no doubt important fac-
tors in explaining institutional quality, they may be somewhat too broad to
capture important differences between countries with similar mortality rates,
population densities, or former colonizing power. Rather, the manner in which
the former colony was administered by the colonial powers may prove to be
a significant factor in institutional quality. For example, Lange (2004) has
demonstrated that the extent of indirect rule in 1955 is significantly and neg-
atively related to Rule of Law and an average of Political Rights in 33 former
British colonies.17 It is plausible that smaller countries were easier to adminis-
ter from a bureaucratic point of view and that as a result, the transplantation
of institutions from the colonizer to the colony was much more effective in
17Lange uses Rule of Law data from 1998. The average democracy scores are calculatedfor the years 1972 to 2000.
26

smaller countries than in larger countries. In the case of islands, adminis-
tration may have been further facilitated by the fact that borders were often
pre-determined by geography, and as such were not a point of contention.
Table 13 reports the regression results for Rule of Law and Political Rights
when Indirect is included as an independent variable. In column (1), Island
is also included as an independent variable, but neither of the size variables
are included. Indirect is negatively and significantly related to Rule of Law,
while Island becomes insignificant. In column (2), the size variable LArea is
included in the regression. In this case, the relationship between Indirect and
Rule of Law is negative and nearly significant (p-value=0.1000), while both
Island and LArea are insignificant. In column (3), LArea is replaced with
LPop. The relationship between Indirect and Rule of Law is insignificant in
this case, as is the relationship between LPop and Rule of Law. Island, on
the other hand, becomes positive and significant. In all three of the previ-
ous regressions, Latitude was insignificant. Finally, column (4) presents the
regression results for Political Rights when Indirect and Island are included
as independent variables. The results show that neither Indirect nor Island
are significantly related to Political Rights. In fact, the only significant vari-
ables in this regression are the unreported control for Latin America and the
constant term.
The results in table 13 indicate that the extent of indirect rule may par-
tially explain the better performance of island countries, at least in terms of
Rule of Law. As table A3 in the data appendix shows, all islands in the sample
were ruled directly except Fiji and Solomon Islands, both of which are located
on the opposite side of the globe in relation to Britain. African countries tend
to exhibit a greater extent of indirect rule, while all Latin American countries
were ruled directly, island or not. Indeed, several factors seem to play a role
in determining the extent of indirect rule. While the results in table 13 are
interesting, it is difficult to draw definite conclusions based on such as small
sample. Further, the sample is restricted to former British colonies that were
still under British rule in 1955. Therefore, more research into the extent of
indirect rule in a broader range of colonies may be a fruitful line of future
research.
4.3.4 Dependent versus independent states
So far, the analysis has been restricted to former colonies that were inde-
pendent as of 2004. There is, however, Rule of Law data available for a
number of politically dependent territories. Therefore, it may be of inter-
27

28
Table 13: Regression results for Rule of Law and Political Rights in 2004 controlling
for the extent of indirect rule in 1955 Dependent Variable:
Rule of Law Political Rights
(1) (2) (3) (4) Indirect -0.03** -0.02a) -0.01 -0.01 (0.01) (0.01) (0.02) (0.02) Island 1.16 0.55 1.50* 0.78 (0.80) (0.87) (0.81) (1.02) LArea -0.26 (0.16) LPop -0.35 (0.23) Latitude -0.01 -0.00 -0.01 -0.01 (0.03) (0.03) (0.03) (0.04) N 31 31 31 31 R-squared 0.5398 0.5853 0.5828 0.3574 Note: Standard errors are given in (). Estimated intercepts are omitted from the table. The superscripts ***/**/* indicate a p-value less than 0.01/0.05/0.10, respectively and a) indicates p-value=0.100. Included continent dummies are Africa, Latin America (including Mexico), Middle East, Oceania and Neo-Europe (Australia, Canada, New Zealand and the United States of America).
Table 14: Regression results for Rule of Law and Political Rights in 2004 controlling
for dependent status and years of independence Dependent Variable:
Rule of Law Political Rights
(1) (2) (3) (4) (5) (6) (7) Dependent 2.25*** 1.48*** 1.77*** (0.51) (0.51) (0.49) Years Indep -0.01** -0.01** -0.01** -0.003 [0.003] (0.003) (0.003) [0.004] Island 2.72*** 1.62*** 2.07*** 2.23*** 1.24** 1.78*** 0.96** (0.55) (0.57) (0.53) [0.59] (0.57) (0.55) [0.45] LArea -0.23*** -0.25*** (0.06) (0.06) LPop -0.27*** -0.27*** (0.06) (0.07) Latitude 0.04*** 0.05*** 0.05*** 0.05*** 0.05*** 0.05*** -0.00 (0.01) (0.01) (0.01) [0.01] (0.01) (0.01) [0.02] Isl x Lat -0.09*** -0.08*** -0.09*** -0.08*** -0.07*** -0.08*** (0.03) (0.03) (0.03) [0.02] (0.03) (0.03) N 127 127 127 127 127 127 120 R-squared 0.5501 0.6099 0.6089 0.5297 0.5998 0.5796 0.4120 Note: Standard errors are given in (), robust standard errors are given in []. Estimated intercepts are omitted from the table. The superscripts ***/**/* indicate a p-value less than 0.01/0.05/0.10, respectively. Included continent dummies are Africa, Latin America (including Mexico), Middle East, Oceania and Neo-Europe (Australia, Canada, New Zealand and the United States of America).

est to test whether dependent territories have stronger or weaker economic
institutions than independent countries. For example, it might be the case
that territories with strong institutions are more likely to successfully gain
their independence, while territories with weak institutions are more likely to
remain dependents of the colonial ruler. On the other hand, colonial powers
may have a greater incentive to hold on to colonies that score highly on Rule
of Law if these territories perform well economically as a result. Further,
dependent territories may exhibit stronger economic institutions as a direct
result of their dependent status, i.e. the close connection with the colonial
power may lead to better economic institutions. Indeed, Armstrong and Read
(2000) find that dependent territories perform better economically than sov-
ereign microstates. Focusing exclusively on islands, Bertram (2004) also finds
that dependent islands perform better economically than independent islands.
Table 14 presents the regression results for Rule of Law when seven de-
pendent territories (Bermuda, Cayman Islands, French Guiana, Macao, Mar-
tinique, Hong Kong and Puerto Rico) are included and controlled for in the
sample. In columns (1) - (3), a dummy variable indicating dependency status
(Dependent) is included in the analysis. In all three regressions, Dependent
is positively and significantly related to Rule of Law, indicating that the de-
pended territories in the sample have significantly better economic institutions
than the independent countries. In columns (4) - (6), a variable measuring the
number of years a country has been independent (Years Indep) is included as
an independent variable. The results show that Years Indep is negatively and
significantly related to Rule of Law, i.e. countries that have been indepen-
dent for a shorter period of time have significantly better economic institutions
than countries that have been independent for a long period of time. Col-
umn (7) reports the regression results for Political Rights when Years Indep
is included as an independent variable, and show that Years Indep has no
significant effect on political institutions. Taken together, the results in table
14 indicate that late colonial rule is good for economic institutions, while it
has no effect on political institutions. One hypothesis is that late colonial rule
brought with it closer trade ties, which in turn was beneficial for economic
institutions (see 4.3.1, for example).
4.3.5 Social capital and identity
A concept that has become increasingly popular in the social sciences litera-
ture is social capital and its effect on economic development and institutions.
A seminal contribution to this field is Putnam (1993), where it is argued that
29

social capital is positively related to economic growth and government per-
formance in Italy. Using cross-country data, Knack and Keefer (1997) find
that social capital is positively related to economic performance, and that
there is a significant positive relationship between social capital and formal
institutions. Djankov et al (2003) argue that countries with greater amounts
of civic capital (which in addition to social capital includes culture, ethnic
heterogeneity and other historical factors) are able to better minimize the ag-
gregate social costs of disorder and dictatorship, and therefore have a greater
freedom in choosing and implementing optimal formal institutions.
The definition and measurement of social capital differs between Putnam
(1993) and Knack and Keefer (1997); Putnam’s measure of social capital is
membership in formal groups (also referred to as associational activity), while
Knack and Keefer measure social capital in terms of the level of trust and the
strength of norms of civic cooperation in a society. Perhaps the most impor-
tant difference between these two definitions is that Putnam’s definition tends
to conceptualize social capital as a horizontal measure where social capital can
be strong within specific groups in a society, whereas Knack and Keefer con-
ceptualize social capital as a broader term, measuring trust and civic norms
at the national level rather than group level. Indeed, Knack and Keefer argue
that associational activity can have ambiguous effects on economic perfor-
mance, trust and civic cooperation. The risk is that associational activity
can facilitate rent-seeking, as well as weaken trust between groups in society.
They find, in contrast to Putnam, that associational activity does not have
a significant effect on economic performance. Therefore, social capital that
manifests itself at the national level may be more relevant for institutions and
economic performance than social capital measured at the group level.
Baldicchino (2005) argues that social capital is a key factor in explaining
the favorable economic and institutional results that often develop on island
jurisdictions. Like Knack and Keefer, he acknowledges that social capital can
be detrimental if it is strongest within distinct groups rather than at the na-
tional level, and argues that islands may be better able to foster a sense of
national identity that is stronger than group identity (such as ethnicity, for
example) than non-islands. Perhaps the greatest advantage of island jurisdic-
tions is that their "geographical precision" may give islanders a distinct sense
of place, which in turn may lead to a sense of unitarism (Baldicchino, 2005).
Therefore, if islands face an advantage in terms of accumulating society level
social capital as opposed to group level social capital, then this may help to
30

explain their relatively better economic and institutional performance. This
suggests that identity may play an important role, as island jurisdictions that
fail to foster a national identity that is stronger than group identity may not
benefit from social capital at all or, even worse, may suffer the adverse effects
of group level social capital (such has been the case in Fiji and Haiti, for
example).
As mentioned above, the "geographical precision" of islands may help
foster a sense of national identity. So far, our measure of island status has
only included islands with no land borders, which would fit with the above
hypothesis. However, may studies include countries that occupy parts of
islands in the island category. Therefore, we run regressions for Political
Rights and Rule of Law where we introduce a second measure of island status
(Island2 ) that includes partial islands, increasing the total number of islands
by six.18 The results are presented in table 15. Columns (1) shows the
results for Political Rights when Island2 is included instead of Island. While
Island2 is positive and significant, it is less significant than Island (column
(1) in table 2). In column (2), a dummy variable is included that indicates
an island has land borders (Isl LB). While this variable is negatively related
to Political Rights, it is also insignificant. Therefore, we cannot conclude
that islands with land borders have significantly worse political rights than
islands with no land borders. In columns (3) - (6), the dependent variable
is Rule of Law. In all cases, Island2 is significantly and positively related to
economic institutions. Further, Isl LB is negative and significant, indicating
that islands with land borders have significantly worse economic institutions
than islands without land borders. Therefore, while the evidence indicates
that geographical precision (i.e. no land borders) is positively related to
institutional quality, the results are only significant in the case of economic
institutions.18The countries now considered islands are Brunei, Dominican Republic, Haiti, Indonesia,
Papua New Guinea and East Timor.
31

Table 15: Regression results for Political Rights and Rule of Law
in 2004, including islands with land borders as islands.
DependentVariable:
Political Rights Rule of Law
(1) (2) (3) (4) (5) (6)
Island2 0.92** 1.10*** 1.38** 1.81*** 1.94*** 2.36***
(0.38) (0.39) (0.58) (0.56) (0.63) (0.58)
Isl LB -1.18 -1.22** -1.51***
(0.75) (0.58) (0.56)
LArea -0.28*** -0.23***
(0.06) (0.06)
LPop -0.30*** -0.26***
(0.07) (0.07)
Latitude 0.00 -0.01 0.05*** 0.05*** 0.05*** 0.05***
(0.02) (0.02) (0.01) (0.01) (0.01) (0.01)
Isl2 x Lat -0.08*** -0.09*** -0.09*** -0.10***
(0.03) (0.03) (0.03) (0.03)
N 120 120 120 120 120 120
R-squared 0.3956 0.4089 0.5616 0.5503 0.5787 0.5787
Note: Standard errors are given in (). Estimated intercepts are omitted
from the table. The superscripts ***/**/* indicate a p-value less than
0.01/0.05/0.10, respectively. Included continent dummies are Africa,
Latin America (including Mexico), Middle East, Oceania and Neo-Europe
(Australia, Canada, New Zealand and the United States of America).
5 Conclusions
The purpose of this paper has been to explore the effects of island status and
country size on institutional quality (measured in terms of Political Rights
and Rule of Law), and to determine if these institutional effects can explain
the relatively strong economic performance of islands and small countries.
Previous theoretical and empirical research indicates that small country size
and island status are positively related to political institutional quality, while
there is little research into the effect of country size and island status on
economic institutional quality. This is particularly so in the case of islands.
Therefore, one contribution of this paper has been to establish that small
countries and islands have relatively strong economic institutions. Further,
to our knowledge there is no other study that has linked institutional quality
to the relatively strong economic performance of islands and small countries.
Our results indicate that island status and small country size are positively
and significantly related to institutional quality, and that these results are ro-
bust to the inclusion of an array of control variables. We also demonstrate
32
that island status and small country size are positively related to levels of per
capita GDP, using average data from 1960 to 1995, as well as data from 2004.
This is in keeping with the results found in much of the previous empirical
literature on the subject. When Rule of Law is included in these regressions
by means of two-stage least squares, however, the positive island and small
country size effects disappear, indicating that the strength of economic in-
stitutions in these countries accounts for their relatively stronger economic
performance.
The results in this paper do not, however, provide any conclusive expla-
nations as to why islands and small countries exhibit relatively stronger insti-
tutional quality. Rather, the evidence indicates possible avenues for further
research. One such avenue is to explore the nature of colonial rule in greater
detail, as direct rule and closer political connections between the former col-
onizing country and the former colony seem to be beneficial for economic
institutions. Another possible explanation for the relatively stronger perfor-
mance of islands in terms of institutional quality may lie in the accumulation
of social capital. This in turn may be facilitated by the geographical precision
of islands, which is thought to be an advantage in the formation of a strong
national identity.
33

References
[1] Acemoglu, D., S. Johnson and J.A. Robinson (2001) "The Colonial Origins ofComparative Development: An Empirical Investigation" American Economic
Review 91(5): 1369-1401.
[2] Acemoglu, D., S. Johnson and J.A. Robinson (2002) "Reversal of Fortune: Ge-ography and Institutions in the Making of the Modern World Income Distribu-
tion", Quarterly Journal of Economics 117(4): 1231-1294.[3] Acemoglu, D., S. Johnson and J.A. Robinson (2005) "The Rise of Europe: At-
lantic Trade, Institutional Change, and Economic Growth" American EconomicReview 95(3): 546-579.
[4] Alesina, A. and E. Spolaore (1997) "On the Number and Size of Nations" Quar-terly Journal of Economics 112: 1027-1056.
[5] Alesina, A. and E. Spolaore (2003) The Size of Nations. MIT Press.[6] Anckar, D. (2002) "Why are small island states democracies?" Round Table,
365, 375—390.
[7] Armstrong, H. and R. Read (2000) "Comparing the economic performance ofdependent territories and sovereign micro-states" Economic Development and
Cultural Change, 48(2), 285—306.
[8] Armstrong, H. and R. Read (2002) "The Phantom of Liberty?: Economic
Growth and the Vulnerability of Small States" Journal of International De-
velopment 14: 435-458.
[9] Armstrong, H. and R. Read (2003) "The Determinants of Economic Growth inSmall States" The Round Table 368: 99—124.
[10] Baldacchino, G. (2005) "The Contribution of ‘Social Capital’ to Economic
Growth: Lessons from Island Jurisdictions" Round Table 94(1): 31-46.
[11] Bertocchi, G. and F. Canova (2002) "Did Colonization Matter for Growth?An Empirical Exploration Into the Historical Causes of Africa’s Underdevelop-
ment", European Economic Review 46, 1851-1871.
[12] Bertram, G. (2004) "On the Convergence of Small Island Economies with TheirMetropolitan Patrons" World Development 32(2): 343—364.
[13] Briguglio, L. (1995) "Small Island Developing States and Their Economic Vul-nerabilities" World Development 23 (10), 1615—1632.
[14] CIA (2005) The World Factbook 2005. <http://www.cia.gov/cia/publications/
factbook/index.html>, accessed 15 August, 2005.
[15] Clague, C., S. Gleason and S. Knack (2001) "Determinants of lasting democ-racy in poor countries: culture, development, and institutions" Annals of the
American Academy of Political and Social Science, 573, 16—41.
[16] Congdon Fors, H. and O. Olsson (2005) "Endogenous Institutional Change Af-ter Independence" Working Papers in Economics No 163, Dept of Economics,
Göteborg University.
[17] Diamond, L. and S. Tsalik (1999) "Size and democracy: the case for decen-tralization" in L. Diamond (Ed.) Developing democracy: Toward consolidation.
Johns Hopkins University Press.
[18] Djankov, S., E. Glaeser, R. La Porta, F. Lopez-de-Silanes and A. Shleifer (2003)
34

"The New Comparative Economics" Journal of Comparative Economics 31:596-619.
[19] Easterly, W. and R. Levine (2003) "Tropics, Germs, and Crops: How Endow-
ments Influence Economic Development" Journal of Monetary Economics 50:3-39.
[20] Easterly, W. and A. Kraay (2000) “Small States, Small Problems? Income,
Growth, and Volatility in Small States”World Development 28(11): 2013—2027.
[21] Engelbert, P., S. Tarango and M. Carter (2002) "Dismemberment and Suf-focation: A Contribution to the Debate on African Boundaries" Comparative
Political Studies 35(10): 1093-1118.
[22] Freedom House (2005) Freedom in the World Country Rankings 2005.
<www.freedomhouse.org/research/survey2005.htm>, accessed 27 October,
2005.
[23] Glaeser, E., R. La Porta, F. Lopez-de-Silanes, and A. Shleifer (2004) "Do Insti-tutions Cause Growth?" Journal of Economic Growth 9 : 271-303.
[24] Hadenius, A. (1992) Democracy and development. Cambridge University Press.[25] Hall, R. and C. Jones (1999) "Why Do Some Countries Produce So Much More
Output Than Others?" Quarterly Journal of Economics 114(1): 83-116.[26] Hansson, G. and O. Olsson (2006) “Country Size and the Rule of Law: Resusci-
tating Montesquieu”Working Papers in Economics No 200, Dept of Economics,
Göteborg University.
[27] Herbst, J. (2000) States and Power in Africa. Princeton University Press.[28] Kaufmann, D., A. Kraay, and M. Mastruzzi (2005) "Governance Matters III:
Governance Indicators for 1996-2004" World Bank Research Working Paper,
Washington D.C.
[29] Knack, S. (2000) "Aid Dependence and the Quality of Governance", World
Bank, Policy Research Working Paper #2396, Washington D.C.
[30] Knack, S. and O. Azfar (2003) "Trade Intensity, Country Size, and Corruption"Economics of Governance 4(1): 1-18.
[31] Knack, S. and P. Keefer (1997) "Does Social Capital Have an Economic Payoff?A Cross-Country Investigation" Quarterly Journal of Economics 112: 1251-88
[32] Lange, M. K. (2004) "British Colonial Legacies and Political Development",World Development 32(6): 905-922.
[33] La Porta, R., F. Lopez-de-Silanes, A. Shleifer, and R. Vishny (1999) "Thequality of government" Journal of Law Economics and Organization 15: 222—
279.
[34] Lewis, W. (1954) "Economic Development with Unlimited Supplies of Labor."The Manchester School 22, 139-191.
[35] Lingle, C. and K. Wickman (1999) "Political Economy" in M. Haas (ed.) Sin-gapore Puzzle Westport: Greenwood Publishing Group.
[36] North, D. (1990) Institutions, Institutional Change and Economic Performance.Cambridge University Press.
[37] Ott, D. (2000) Small is democratic: An examination of state size and democraticdevelopment. Garland.
[38] Patel, S. (2006) "A Sinking Feeling" Nature 440(6): 734-736.
35
[39] Putnam, Robert (with Robert Leonardi and Raffaella Y. Nanetti) (1993)MakingDemocracy Work. Princeton University Press.
[40] Rodrik, D., A. Subramanian and F. Trebbi (2004) "Institutions Rule: ThePrimacy of Institutions Over Geography and Integration in Economic Develop-
ment" Journal of Economic Growth 9(2): 131-165.
[41] Sokoloff, K.L. and S.T. Engerman (2000) "History Lessons: Institutions, Fac-tor Endowments, and Paths of Development in the New World" Journal ofEconomic Perspectives 14(3): 217-232.
[42] Srebrnik, H. (2004) "Small Island Nations and Democratic Values" World De-
velopment 32(2):329—341.
[43] Stepan, A. and C. Skach (1993) "Constitutional frameworks and democraticconsolidation: parliamentarism versus presidentialism" World Politics, 46(1):
1—22.
[44] Wei, S. (2000) "Natural Openness and Good Government" NBER Working
Paper 7765, NBER.
[45] World Bank (2005) Global Development Network Growth Database: Social in-dicators and fixed factors. <http://econ.worldbank.org>, accessed 27 October
2005.
[46] World Bank (2006a) Development Data & Statistics: Country Classification.
<http://www.worldbank.org>, accessed 5 March 2006.
[47] World Bank (2006b) World Development Indicators 2005.
<http://devdata.worldbank.org/data-query/>, accessed 20 January 2006.
36

37
Data Appendix
Table A1: Definitions of the variables.
Variable Definition
Political Rights Political rights. Source: Freedom House (2005)
Rule of Law Rule of law. Source: Kaufmann et al (2005)
Island Dummy variable=1 if country is an island with no land borders. Source: CIA
(2005) and own assessment.
Population Total population (‘000) in 2004. Source: World Development Indicators 2005.
LPop Natural logarithm of Population.
Area Total land area (in’000 km). Source: CIA (2005).
LArea Natural logarithm of Area.
Latitude Absolute value of latitude degree. Source: World Bank (2005) and CIA (2005)
Open Open=(exports + imports)/GDP in current prices local currency units, 2002.
Source: World Development Indicators 2005.
LOpen Natural logarithm of Open.
ExpNonF Country’s major export category (i.e. 50% of total exports or more) is non-
fuels. Source: World Bank (2005) and CIA (2005).
ExpFuels Country’s major export category (i.e. 50% of total exports or more) is fuels.
Source: World Bank (2005) and CIA (2005).
Vuln Country’s score on the Vulnerability Index (from 0 to 1). Source: Briguglio
(1995).
Settler Mortality Estimated settler mortality. Source: Acemoglu et al (2001).
LMort Natural logarithm of Settler Mortality.
Pop. Density 1500 Population density in 1500. Source: Acemoglu et al (2002).
LPopDen Natural logarithm of Pop. Density 1500.
Portugal Dummy variable=1 if the last colonizing power was Portugal. Source: CIA
(2005) and own assessment.
France Dummy variable=1 if the last colonizing power was France. Source: CIA
(2005) and own assessment.
UK+Neo Dummy variable=1 if the last colonizing power was the UK or a Neo-European
country. Source: CIA (2005) and own assessment.
Indirect The extent of indirect rule by the UK in 1955. Source: Lange (2004).
Dependent Dummy variable=1 if the country is a dependent territory. Own assessment.
Years Indep Number of years the country has been independent from most recent colonial
period. Source: CIA (2005) and own assessment.
Island2 Dummy variable=1 if country occupies all or part of an island. Source: CIA
(2005) and own assessment.
Isl LB Dummy variable=1 if country is an island with a land border. Source: CIA
(2005) and own assessment.
Av GDP 1960-1995 The average per capita real GDP for the period 1960-1995. Source: Easterly
and Kraay (2000).
Log Av GDP 1960-1995 Natural logarithm of Av GDP 1960-1995.
GDP 2004 PPP per capita GDP for 2004. Source: CIA (2005)
Log GDP 2004 Natural logarithm of GDP 2004.
Small State 1 Dummy variable=1 if the country’s average population over the period 1960-
1995 was less than one million. Source: Easterly and Kraay (2000).
Small State 2 Dummy variable=1 if Small State 1=1 or the country’s average population in
2004 was less than 1.5 million. Own assessment.
Small State 3 Dummy variable=1 if the country’s average population in 2004 was less than
one million. Own assessment.

38
Table A
2: Sum
mary
sta
tistics of th
e variables.
Full S
am
ple
Is
lands
Non-Islands
Variable
Mea
n
St. D
ev.
N
Mea
n
St. D
ev.
N
Mea
n
St. D
ev.
N
Political Rights
4.39
2.04
120
5.61
1.68
33
3.93
1.99
87
Rule of Law
4.56
1.78
127
5.69
1.52
37
4.10
1.67
90
Island
0.29
0.46
127
1.00
0.00
37
0.00
0.00
90
Population
28420.65
103430.20
127
4184.85
14053.94
37
38384.26
121329.10
90
LPop
8.20
2.29
127
5.97
2.06
37
9.12
1.68
90
Area
659.51
1570.60
127
38.83
113.16
37
914.67
1805.85
90
LArea
4.05
3.07
127
0.67
2.50
37
5.44
2.04
90
Latitude
15.55
9.98
127
15.91
9.04
37
15.41
10.38
90
Open
82.20
45.16
103
102.84
32.24
23
76.26
46.73
80
LOpen
4.27
0.52
103
4.58
0.37
23
4.19
0.53
80
ExpNonF
0.34
0.48
127
0.16
0.37
37
0.41
0.49
90
ExpFuels
0.10
0.30
127
0.05
0.23
37
0.12
0.33
90
Vuln
0.47
0.15
80
0.60
0.12
25
0.42
0.12
55
Settler Mortality
235.32
430.29
78
105.90
156.38
10
254.36
454.56
68
LMort
4.70
1.20
78
3.96
1.25
10
4.81
1.17
68
Pop. Density 1500
4.69
11.46
95
2.38
3.59
17
5.20
12.50
78
LPopDen
0.45
1.52
95
0.27
1.13
17
0.49
1.59
78
Portugal
0.06
0.24
127
0.05
0.23
37
0.07
0.25
90
France
0.20
0.41
127
0.08
0.28
37
0.26
0.44
90
UK+Neo
0.52
0.50
127
0.81
0.40
37
0.40
0.49
90
Indirect
38.64
32.27
32
11.84
23.52
9
49.13
29.27
23
Dependent
0.06
0.23
127
0.11
0.31
37
0.03
0.18
90
Years Indep
63.88
58.00
127
33.92
24.01
37
76.20
63.27
90
Island2
0.35
0.48
127
1.00
0.00
37
0.09
0.29
90
Isl LB
0.06
0.24
127
0.00
0.00
37
0.09
0.29
90
Av GDP 1960-1995
3188.52
3910.98
105
4432.30
3845.98
25
2799.83
3872.98
80
Log Av GDP 1960-1995
7.57
0.95
105
8.05
0.86
25
7.41
0.93
80
GDP 2004
6874.02
8509.56
127
8894.60
9175.12
37
6043.33
8128.35
90
Log GDP 2004
8.21
1.12
127
8.57
1.09
37
8.06
1.11
90
Small State 1
0.28
0.45
110
0.74
0.45
27
0.13
0.34
83
Small State 2
0.34
0.48
127
0.76
0.43
37
0.17
0.37
90
Small State 3
0.30
0.46
127
0.73
0.45
37
0.12
0.33
90

39
Table A3: Descriptive statistics for extent of indirect rule 1955 and country size.
Non-Islands
Islands
Country
Extent of
Indirect Rule
1955 (%)
Log Area Country
Extent of
Indirect Rule
1955 (%)
Log Area
Bangladesh 60 4.87 Bahamas 0 2.30
Belize 0 3.13 Barbados 0 -0.84
Botswana 42.5 6.34 Fiji 55 2.91
Brunei 0 1.66 Jamaica 0 2.38
Gambia 37.3 2.30 Mauritius 0 0.71
Ghana 64.8 5.43 Singapore 0 -0.49
Guyana 0 5.28 Solomon Islands 51.6 3.33
India 60 8.00 Sri Lanka 0 4.17
Kenya 58.8 6.34 Trinidad 0 1.64
Lesotho 49.5 3.41
Malawi 81.8 4.54
Malaysia 6.1 5.79
Myanmar 60 6.49
Nigeria 93.4 6.81
Pakistan 60 6.65
Sierra Leone 80.8 4.27
Sudan 72.6 7.77
Swaziland 49 2.84
Tanzania 74.5 6.78
Uganda 79.6 5.28
Zambia 59.6 6.61
Zimbabwe 39.7 5.96
Average 51.36 5.30 11.84 1.79
- Africa 63.14 5.34 0 0.71
- Asia 40.02 5.58 0 1.84
- Latin America 0 4.20 0 1.37
- Oceania N/A N/A 53.3 3.12
Source: Lange (2004), CIA World Factbook (2005) and author’s own calculations.

40
Table A4: List of countries included in the analysis.
Non-Islands
Islands
ALGERIA GUYANA TUNISIA ANTIGUA
ANGOLA HAITI UGANDA BAHAMAS
ARGENTINA HONDURAS UNITED ARAB
EMIRATES BAHRAIN
AUSTRALIA HONG KONG* UNITED STATES BARBADOS*
BANGLADESH INDIA URUGUAY BERMUDA
BELIZE INDONESIA VENEZUELA CAPE VERDE
BENIN KENYA VIETNAM CAYMAN ISLANDS*
BHUTAN KUWAIT YEMEN COMOROS
BOLIVIA LAOS ZAMBIA CUBA
BOTSWANA LESOTHO ZIMBABWE DOMINICA
BRAZIL LIBYA FIJI
BRUNEI MACAO* GRENADA
BURKINA FASO MALAWI JAMAICA
BURUNDI MALAYSIA KIRIBATI
CAMBODIA MALI MADAGASCAR
CAMEROON MAURITANIA MALDIVES
CANADA MEXICO MARSHALL ISLANDS
CENTRAL AFRICAN
REPUBLIC MOROCCO MARTINIQUE*
CHAD MOZAMBIQUE MAURITIUS
CHILE MYANMAR MICRONESIA
COLOMBIA NAMIBIA NAURU
CONGO NICARAGUA NEW ZEALAND
COSTARICA NIGER PHILIPPINES
COTE D’IVOIRE NIGERIA PUERTO RICO*
DR CONGO PAKISTAN SAMOA
DJIBOUTI PANAMA SAO TOME
DOMINICAN REPUBLIC PAPUA NEW GUINEA SEYCHELLES
EAST TIMOR PARAGUAY SINGAPORE
ECUADOR PERU SOLOMON ISLANDS
EGYPT QATAR SRI LANKA
EL SALVADOR RWANDA ST KITTS
EQGUINEA SENEGAL ST LUCIA
ERITREA SIERRA LEONE ST VINCENT
FRENCH GUIANA* SOMALIA TONGA
GABON SOUTH AFRICA TRINIDAD
GAMBIA SUDAN TUVALU
GHANA SURINAME VANUATU
GUATEMALA SWAZILAND
GUINEA TANZANIA
GUINEA BISSAU TOGO
Note: Countries with an asterisk beside their names were not politically independent as of 2004.


