
FOR OFFICIAL USE
Total forSections B and C
Fill in these boxes and read what is printed below.
Day Month Year Number of seat Scottish candidate number
LI X007 /12 /02 6 /13160
X007/12/02
*X007/12/02* ©
BIOLOGYHIGHER
SECTION A—Questions 1—30 (30 Marks)Instructions for completion of Section A are given on Page two.For this section of the examination you must use an HB pencil.SECTIONS B AND C (100 Marks)1 (a) All questions should be attempted. (b) It should be noted that in Section C questions 1 and 2 each contain a choice.2 The questions may be answered in any order but all answers are to be written in the
spaces provided in this answer book, and must be written clearly and legibly in ink.3 Additional space for answers will be found at the end of the book. If further space is
required, supplementary sheets may be obtained from the Invigilator and should be inserted inside the front cover of this book.
4 The numbers of questions must be clearly inserted with any answers written in the additional space.
5 Rough work, if any should be necessary, should be written in this book and then scored through when the fair copy has been written. If further space is required, a supplementary sheet for rough work may be obtained from the Invigilator.
6 Before leaving the examination room you must give this book to the Invigilator. If you do not, you may lose all the marks for this paper.
Full name of centre Town
Forename(s) Surname
Date of birth
N A T I O N A LQ U A L I F I C A T I O N S2 0 1 2
w E d N E S d A Y , 2 3 m A Y1 . 0 0 P m – 3 . 3 0 P m
Read carefully
1 Check that the answer sheet provided is for Biology Higher (Section A).
2 For this section of the examination you must use an HB pencil, and where necessary, an eraser.
3 Check that the answer sheet you have been given has your name, date of birth, SCN (Scottish Candidate Number) and Centre Name printed on it.
Do not change any of these details.
4 If any of this information is wrong, tell the Invigilator immediately.
5 If this information is correct, print your name and seat number in the boxes provided.
6 The answer to each question is either A, B, C or D. Decide what your answer is, then, using your pencil, put a horizontal line in the space provided (see sample question below).
7 There is only one correct answer to each question.
8 Any rough working should be done on the question paper or the rough working sheet, not on your answer sheet.
9 At the end of the examination, put the answer sheet for Section A inside the front cover of this answer book.
Sample Question
The apparatus used to determine the energy stored in a foodstuff is a
A calorimeter
B respirometer
C klinostat
D gas burette.
The correct answer is A—calorimeter. The answer A has been clearly marked in pencil with a horizontal line (see below).
Changing an answer
If you decide to change your answer, carefully erase your first answer and using your pencil fill in the answer you want. The answer below has been changed to D.
A B C D
A B C D
Page two[X007/12/02]
SECTION A
All questions in this section should be attempted.
Answers should be given on the separate answer sheet provided.
Page three[X007/12/02]
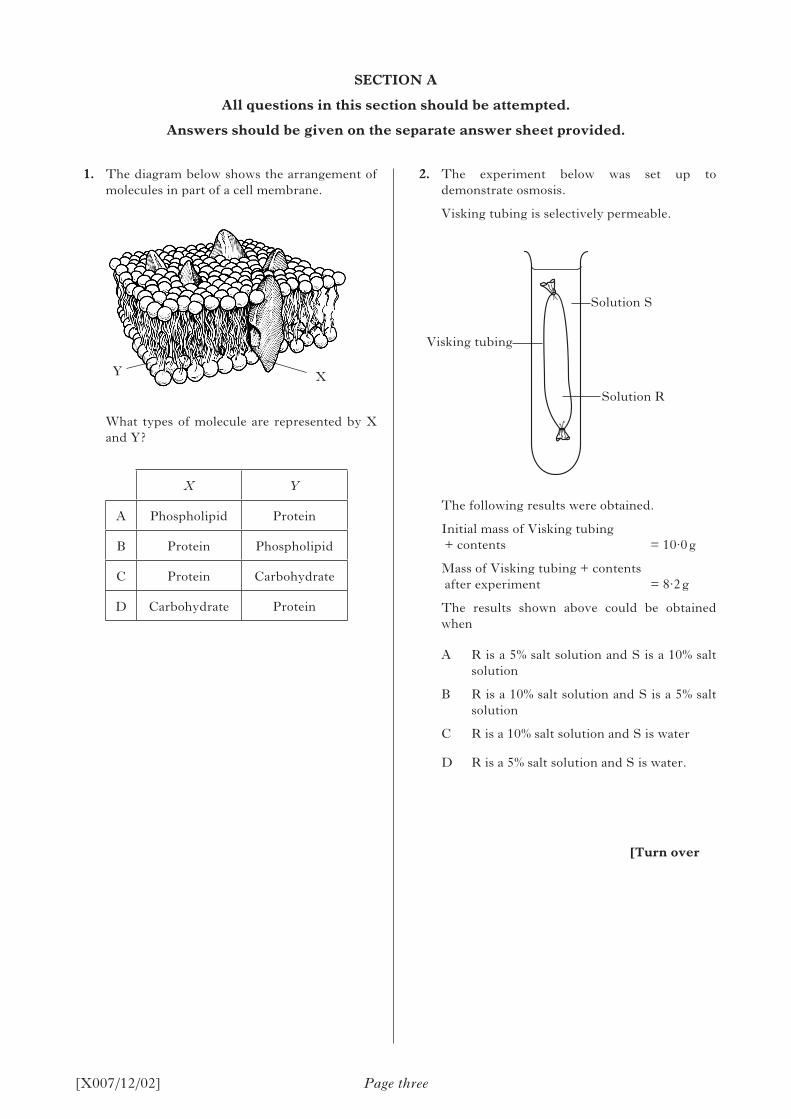
1. The diagram below shows the arrangement of molecules in part of a cell membrane.
What types of molecule are represented by X and Y?
X Y
A Phospholipid Protein
B Protein Phospholipid
C Protein Carbohydrate
D Carbohydrate Protein
2. The experiment below was set up to demonstrate osmosis.
Visking tubing is selectively permeable.
The following results were obtained.
Initial mass of Visking tubing + contents = 10·0 g
Mass of Visking tubing + contents after experiment = 8·2 g
The results shown above could be obtained when
A R is a 5% salt solution and S is a 10% salt solution
B R is a 10% salt solution and S is a 5% salt solution
C R is a 10% salt solution and S is water
D R is a 5% salt solution and S is water.
[Turn over
XY
Visking tubing
Solution S
Solution R
Page four[X007/12/02]
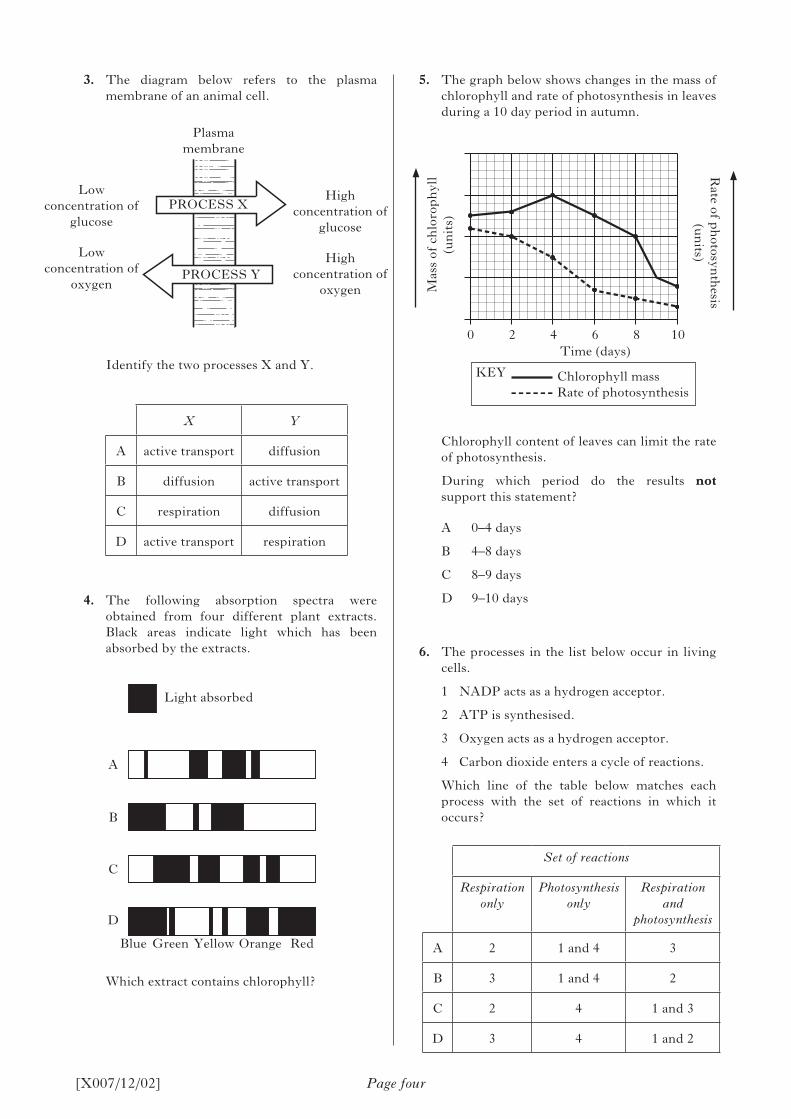
3. The diagram below refers to the plasma membrane of an animal cell.
Identify the two processes X and Y.
X Y
A active transport diffusion
B diffusion active transport
C respiration diffusion
D active transport respiration
4. The following absorption spectra were obtained from four different plant extracts. Black areas indicate light which has been absorbed by the extracts.
Which extract contains chlorophyll?
5. The graph below shows changes in the mass of chlorophyll and rate of photosynthesis in leaves during a 10 day period in autumn.
Chlorophyll content of leaves can limit the rate of photosynthesis.
During which period do the results not support this statement?
A 0–4 days
B 4–8 days
C 8–9 days
D 9–10 days
6. The processes in the list below occur in living cells.
1 NADP acts as a hydrogen acceptor.
2 ATP is synthesised.
3 Oxygen acts as a hydrogen acceptor.
4 Carbon dioxide enters a cycle of reactions.
Which line of the table below matches each process with the set of reactions in which it occurs?
Set of reactions
Respiration only
Photosynthesis only
Respiration and
photosynthesis
A 2 1 and 4 3
B 3 1 and 4 2
C 2 4 1 and 3
D 3 4 1 and 2
Plasma membrane
High concentration of
glucose
High concentration of
oxygen
Low concentration of
glucose
Low concentration of
oxygen
PROCESS X
PROCESS Y
Blue Green Yellow Orange Red
Light absorbed
A
B
C
D
KEY
Mas
s of
ch
loro
ph
yll
(un
its)
Rate of p
hotosyn
thesis
(un
its)
0 2 4 6 8 10
Chlorophyll massRate of photosynthesis
Time (days)
[X007/12/02] Page five
9. A fragment of DNA was found to consist of 72 nucleotide base pairs. What is the total number of deoxyribose sugars in this fragment?
A 24
B 36
C 72
D 144
10. Insulin synthesised in a pancreatic cell is secreted. Its route from synthesis to secretion includes
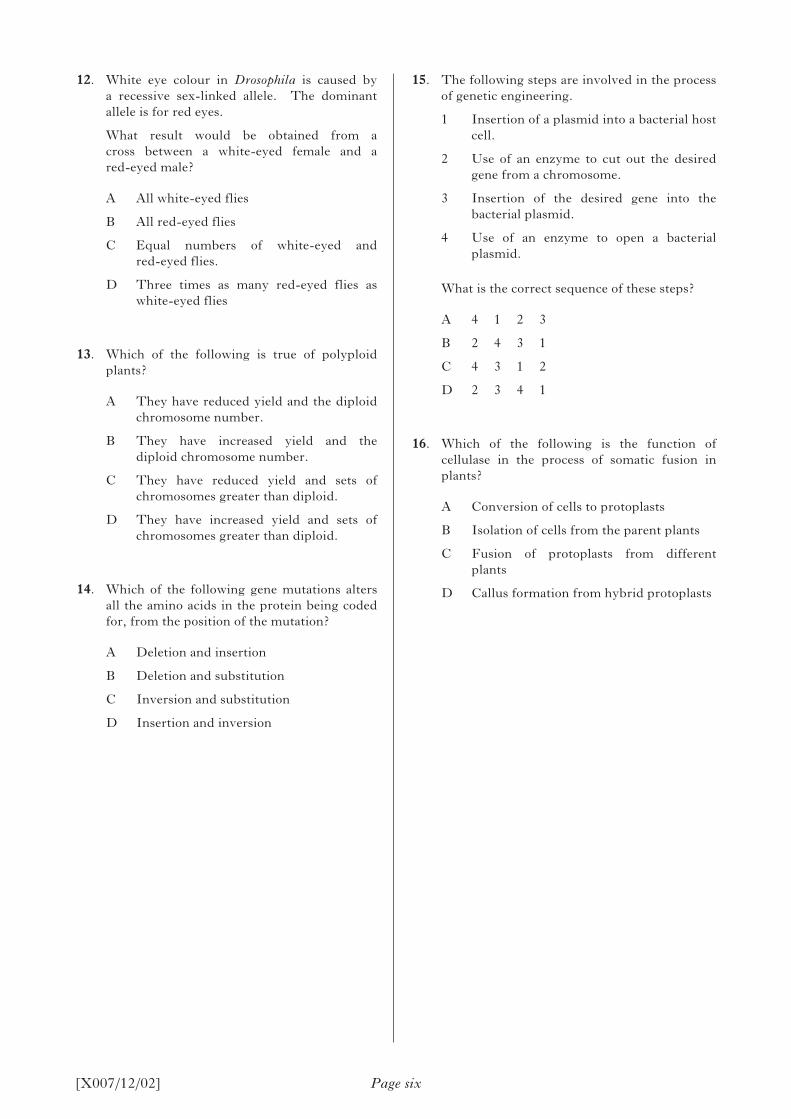
11. The following diagram shows a pair of homologous chromosomes and the positions of 4 genes.
Between which of the following alleles would chiasma formation occur least often?
A r and t
B r and U
C r and s
D s and u
7. The statements in the list below refer to respiration.
1 Carbon dioxide is released.
2 Occurs during aerobic respiration.
3 The end product is pyruvic acid.
4 The end product is lactic acid.
Which statements describe glycolysis?
A 1 and 4
B 1 and 3
C 2 and 3
D 2 and 4
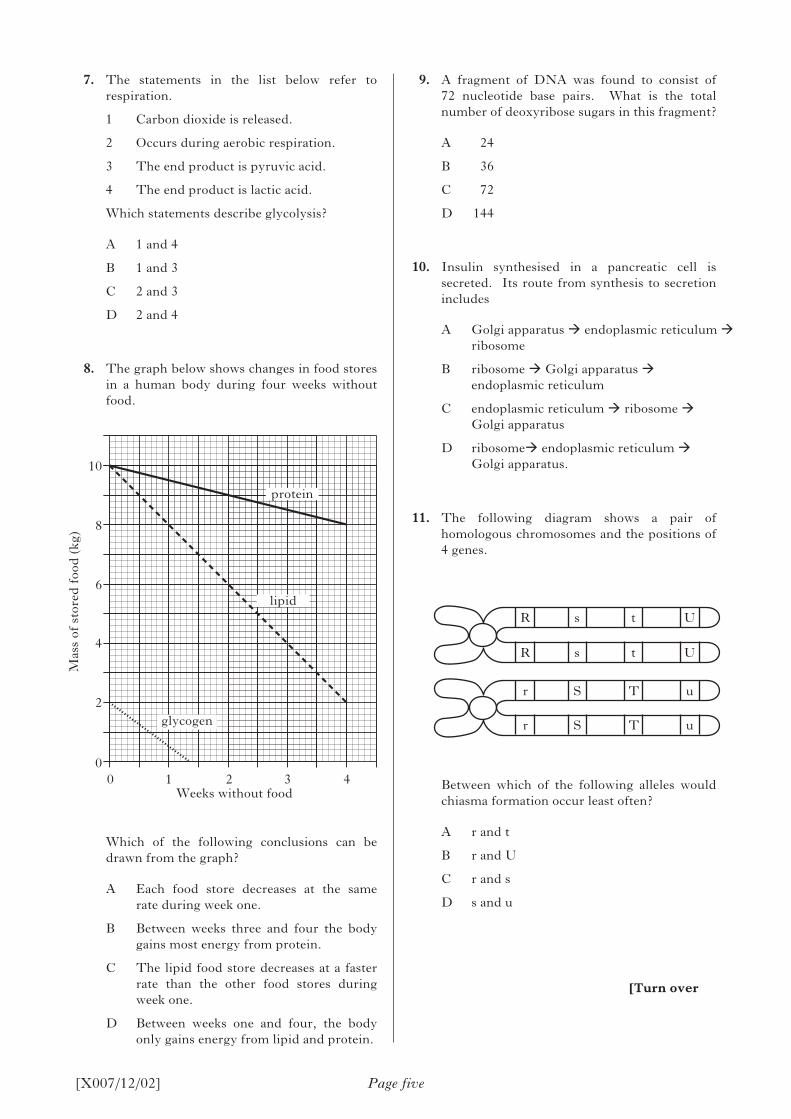
8. The graph below shows changes in food stores in a human body during four weeks without food.
Which of the following conclusions can be drawn from the graph?
A Each food store decreases at the same rate during week one.
B Between weeks three and four the body gains most energy from protein.
C The lipid food store decreases at a faster rate than the other food stores during week one.
D Between weeks one and four, the body only gains energy from lipid and protein.
Mas
s of
sto
red
foo
d (
kg)
10
8
6
4
2
00 1 2 3 4
protein
lipid
glycogen
Weeks without food
R s t U
R s t U
r S T u
r S T u
[Turn over
A Golgi apparatus endoplasmic reticulum ribosome
B ribosome Golgi apparatus endoplasmic reticulum
C endoplasmic reticulum ribosome Golgi apparatus
D ribosome endoplasmic reticulum Golgi apparatus.
[X007/12/02] Page six
15. The following steps are involved in the process of genetic engineering.
1 Insertion of a plasmid into a bacterial host cell.
2 Use of an enzyme to cut out the desired gene from a chromosome.
3 Insertion of the desired gene into the bacterial plasmid.
4 Use of an enzyme to open a bacterial plasmid.
What is the correct sequence of these steps?
A 4 1 2 3
B 2 4 3 1
C 4 3 1 2
D 2 3 4 1
16. Which of the following is the function of cellulase in the process of somatic fusion in plants?
A Conversion of cells to protoplasts
B Isolation of cells from the parent plants
C Fusion of protoplasts from different plants
D Callus formation from hybrid protoplasts
12. White eye colour in Drosophila is caused by a recessive sex-linked allele. The dominant allele is for red eyes.
What result would be obtained from a cross between a white-eyed female and a red-eyed male?
A All white-eyed flies
B All red-eyed flies
C Equal numbers of white-eyed and red-eyed flies.
D Three times as many red-eyed flies as white-eyed flies
13. Which of the following is true of polyploid plants?
A They have reduced yield and the diploid chromosome number.
B They have increased yield and the diploid chromosome number.
C They have reduced yield and sets of chromosomes greater than diploid.
D They have increased yield and sets of chromosomes greater than diploid.
14. Which of the following gene mutations alters all the amino acids in the protein being coded for, from the position of the mutation?
A Deletion and insertion
B Deletion and substitution
C Inversion and substitution
D Insertion and inversion
[X007/12/02] Page seven
19. Which line in the table below shows features likely to be found in a plant and in a small mammal both adapted to life in hot desert conditions?
Plant Small mammal
A reduced root systemlarge number of sweat glands
B rolled leaveslarge number of glomeruli
Csmall number of stomata
nocturnal habit
D succulent tissuesshort kidney tubules
20. An investigation was set up to demonstrate the response of flatworms to the presence of food. A piece of liver and a glass bead were placed in a dish. 15 flatworms were then scattered randomly into the dish as shown in the diagram below.
The purpose of the glass bead is to show that flatworms
A use cooperative foraging behaviour
B respond differently to food compared to other objects
C move randomly in search of food
D move towards any large object in the search for food.
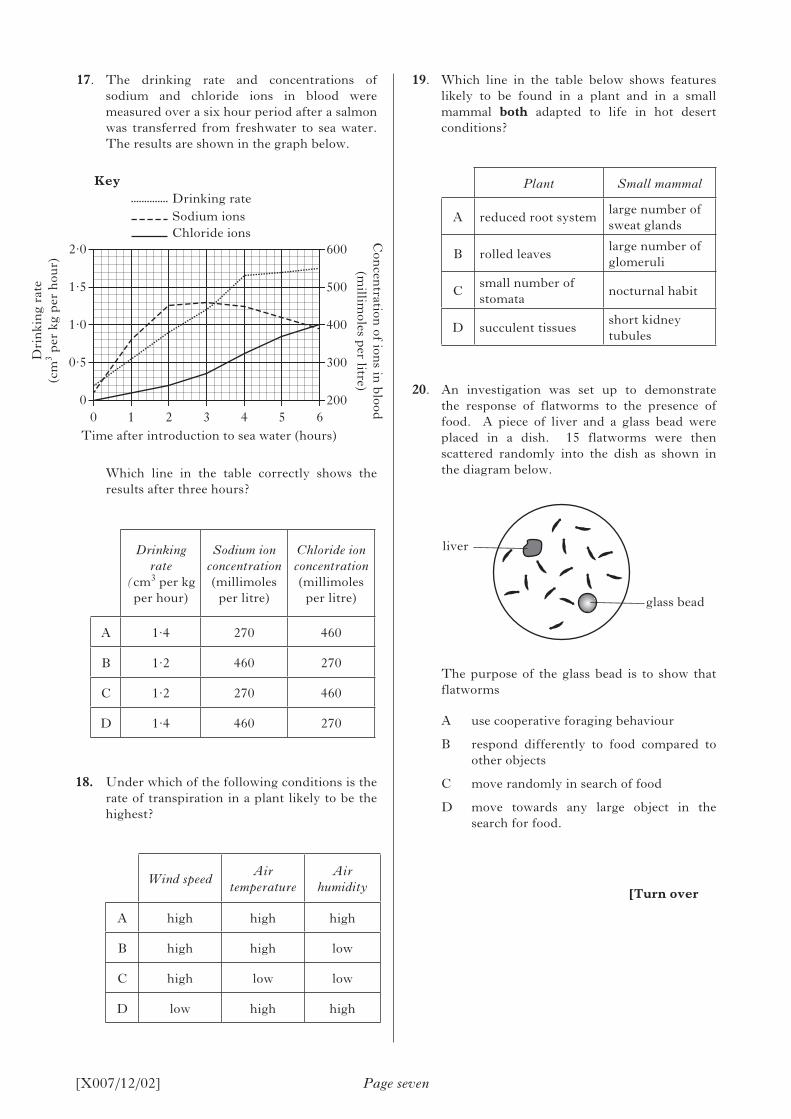
17. The drinking rate and concentrations of sodium and chloride ions in blood were measured over a six hour period after a salmon was transferred from freshwater to sea water. The results are shown in the graph below.
Which line in the table correctly shows the results after three hours?
Drinking rate
(cm3 per kg per hour)
Sodium ion concentration (millimoles
per litre)
Chloride ion concentration (millimoles
per litre)
A 1·4 270 460
B 1·2 460 270
C 1·2 270 460
D 1·4 460 270
18. Under which of the following conditions is the rate of transpiration in a plant likely to be the highest?
Wind speedAir
temperatureAir
humidity
A high high high
B high high low
C high low low
D low high high
Dri
nki
ng
rate
(c
m3 p
er k
g p
er h
our)
Con
centration
of ions in
blood
(m
illimoles p
er litre)Time after introduction to sea water (hours)
Drinking rateSodium ionsChloride ions
Key
2·0
1·5
1·0
0·5
0
600
500
400
300
2000 1 2 3 4 5 6
liver
glass bead
[Turn over
[X007/12/02] Page eight
22. The diagram below shows a section of a woody twig.
Identify the position of a meristem.
23. In which of the following processes does gibberellic acid (GA) have a role during the growth and development of plants?
A Breaking dormancy
B Root formation in cuttings
C Leaf abscission
D Apical dominance
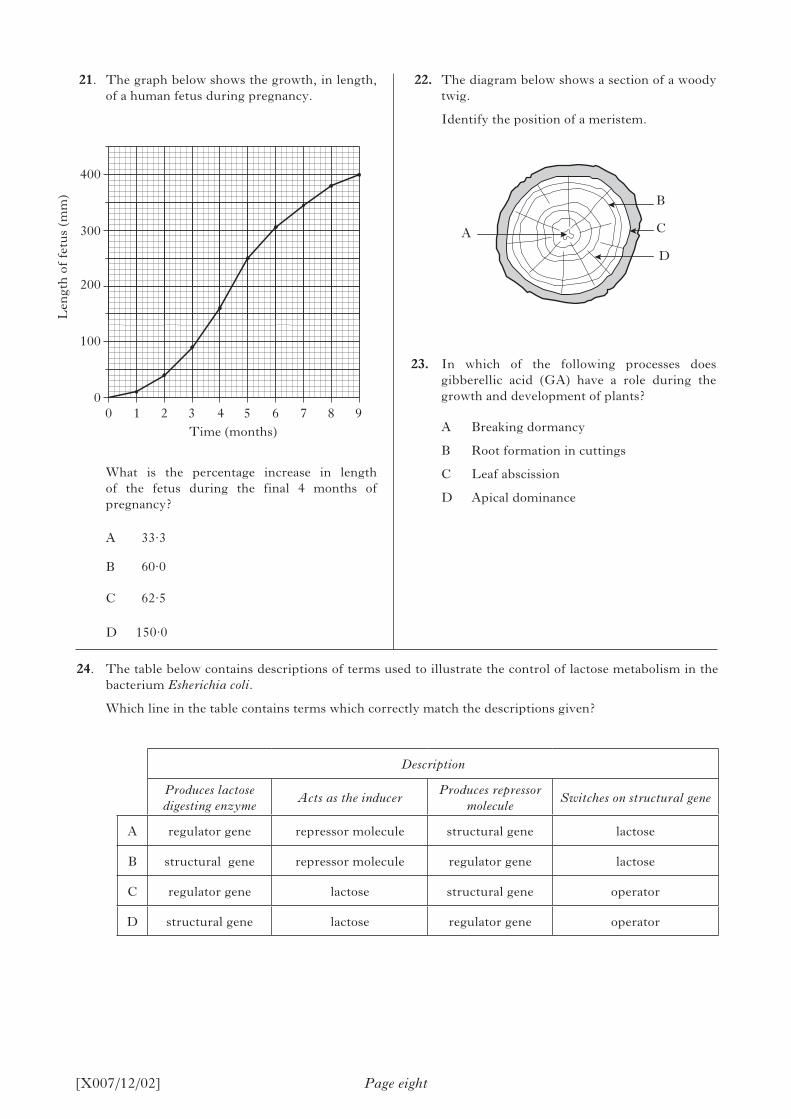
21. The graph below shows the growth, in length, of a human fetus during pregnancy.
What is the percentage increase in length of the fetus during the final 4 months of pregnancy?
A 33·3
B 60·0
C 62·5
D 150·0
Len
gth
of
fetu
s (m
m)
Time (months)
400
300
200
100
00 1 2 3 4 5 6 7 8 9
A
B
C
D
24. The table below contains descriptions of terms used to illustrate the control of lactose metabolism in the bacterium Esherichia coli.
Which line in the table contains terms which correctly match the descriptions given?
Description
Produces lactose digesting enzyme
Acts as the inducerProduces repressor
moleculeSwitches on structural gene
A regulator gene repressor molecule structural gene lactose
B structural gene repressor molecule regulator gene lactose
C regulator gene lactose structural gene operator
D structural gene lactose regulator gene operator
[X007/12/02] Page nine
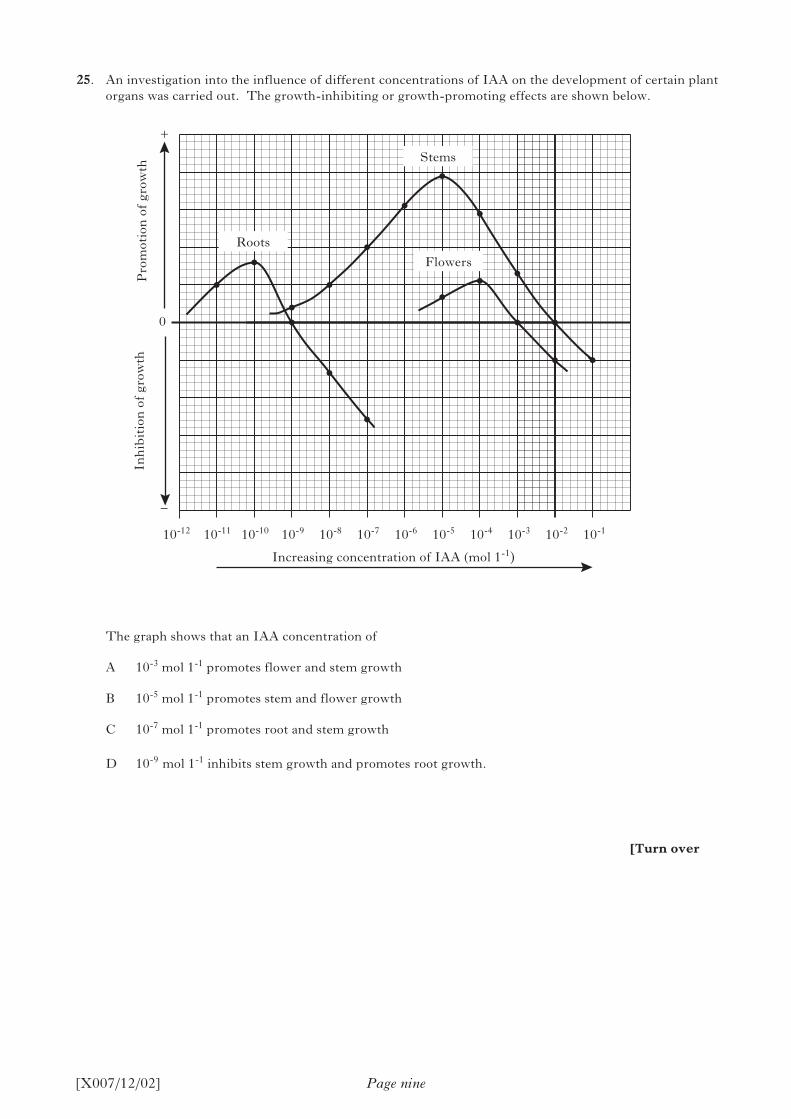
25. An investigation into the influence of different concentrations of IAA on the development of certain plant organs was carried out. The growth-inhibiting or growth-promoting effects are shown below.
The graph shows that an IAA concentration of
A 10-3 mol 1-1 promotes flower and stem growth
B 10-5 mol 1-1 promotes stem and flower growth
C 10-7 mol 1-1 promotes root and stem growth
D 10-9 mol 1-1 inhibits stem growth and promotes root growth.
10-11 10-10 10-9 10-8 10-7 10-6 10-5 10-4 10-3 10-2 10-1
Inh
ibit
ion
of
grow
thP
rom
otio
n o
f gr
owth
0
Stems
Roots
Flowers
Increasing concentration of IAA (mol 1-1)
[Turn over
+
–
10-12
[X007/12/02] Page ten
28. Which of the following best defines etiolation?
A The inhibition of development of lateral buds
B The result of a magnesium deficiency in seedlings
C The growth of a stem towards directional light
D The effect on seedlings of being grown in the dark
29. An effect of a high concentration of antidiuretic hormone (ADH) on the kidney is to
A increase tubule permeability which increases water reabsorption
B decrease tubule permeability which prevents excessive water loss
C increase glomerular filtration rate which increases urine production
D decrease glomerular filtration rate which reduces urine production.
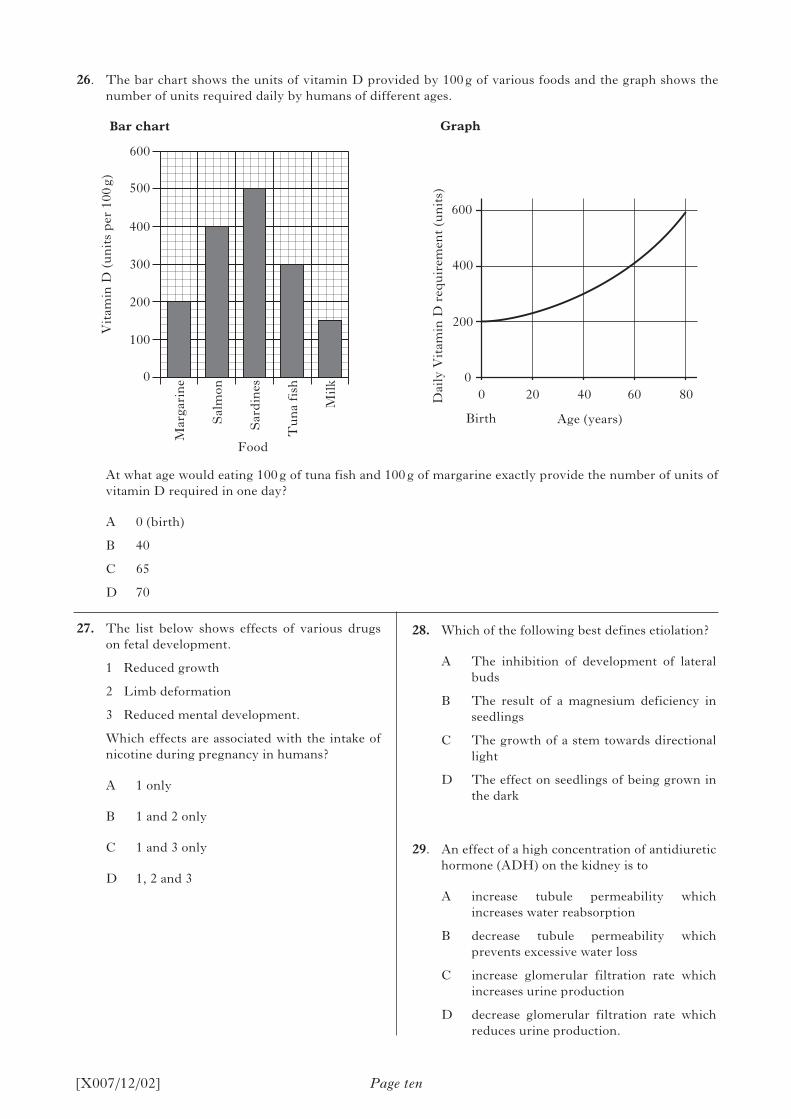
26. The bar chart shows the units of vitamin D provided by 100 g of various foods and the graph shows the number of units required daily by humans of different ages.
At what age would eating 100 g of tuna fish and 100 g of margarine exactly provide the number of units of vitamin D required in one day?
A 0 (birth)
B 40
C 65
D 70
27. The list below shows effects of various drugs on fetal development.
1 Reduced growth
2 Limb deformation
3 Reduced mental development.
Which effects are associated with the intake of nicotine during pregnancy in humans?
A 1 only
B 1 and 2 only
C 1 and 3 only
D 1, 2 and 3
Food
600
500
400
300
200
100
0
Mar
gari
ne
Sal
mon
Sar
din
es
Tu
na
fish
Mil
k
Vit
amin
D (
un
its
per
100
g)
600
400
200
00 20 40 60 80
Age (years)BirthD
aily
Vit
amin
D r
equ
irem
ent
(un
its)
Bar chart Graph

Page eleven[X007/12/02]
30. The graph below shows the changes in the populations of red and grey squirrels in an area of woodland over a 10 year period.
From the graph the following conclusions were suggested.
1 The grey squirrel population increases by 150% over the ten year period.
2 The red squirrel numbers decreased from 150 to 20 over the ten year period.
3 After eight years the grey squirrel population was five times greater than the red.
Which of the conclusions are correct?
A 1 and 2 only
B 1 and 3 only
C 2 and 3 only
D 1, 2 and 3
[Turn over
Candidates are reminded that the answer sheet MUST be returned INSIDE the front cover of this answer book.
0 2 4 6 8 10
0
100
200
300N
um
ber
s of
sq
uir
rels
Time (years)
grey
red
[X007/12/02]
Marks
1
1
2
DO NOT WRITE
IN THIS MARGIN
Page twelve
SECTION B
All questions in this section should be attempted.
All answers must be written clearly and legibly in ink.
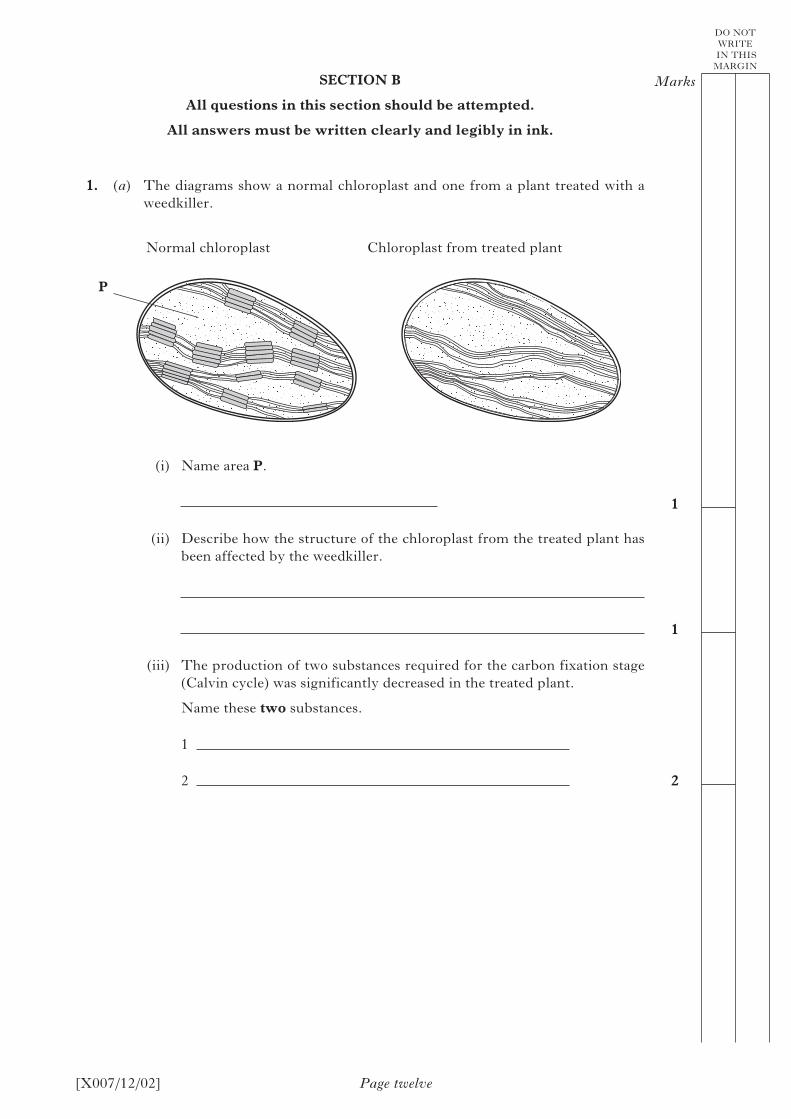
1. (a) The diagrams show a normal chloroplast and one from a plant treated with a weedkiller.
Normal chloroplast Chloroplast from treated plant
P
(i) Name area P.
(ii) Describe how the structure of the chloroplast from the treated plant has been affected by the weedkiller.
(iii) The production of two substances required for the carbon fixation stage (Calvin cycle) was significantly decreased in the treated plant.
Name these two substances.
1
2
[X007/12/02]
Marks
2
DO NOT WRITE
IN THIS MARGIN
Page thirteen
1. (continued)
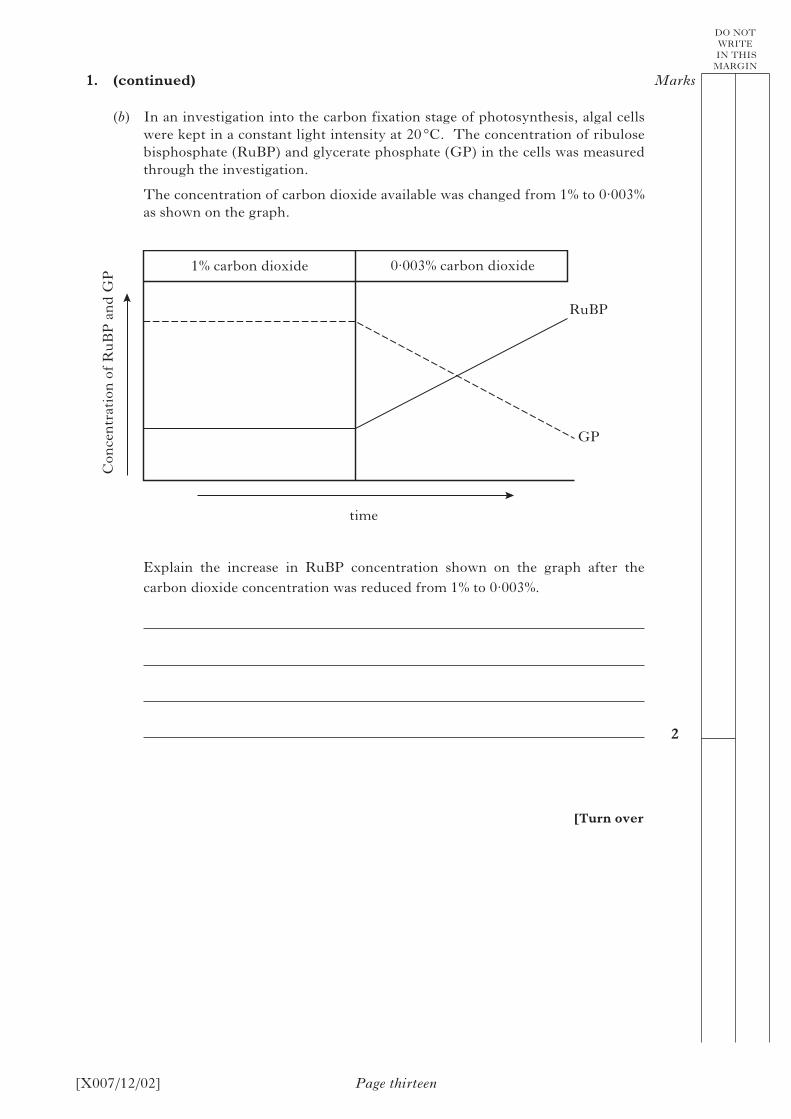
(b) In an investigation into the carbon fixation stage of photosynthesis, algal cells were kept in a constant light intensity at 20 °C. The concentration of ribulose bisphosphate (RuBP) and glycerate phosphate (GP) in the cells was measured through the investigation.
The concentration of carbon dioxide available was changed from 1% to 0·003% as shown on the graph.
1% carbon dioxide 0·003% carbon dioxide
RuBP
GP
Con
cen
trat
ion
of
Ru
BP
an
d G
P
time
Explain the increase in RuBP concentration shown on the graph after the carbon dioxide concentration was reduced from 1% to 0·003%.
[Turn over
[X007/12/02] Page fourteen
Marks
1
1
1
1
DO NOT WRITE
IN THIS MARGIN
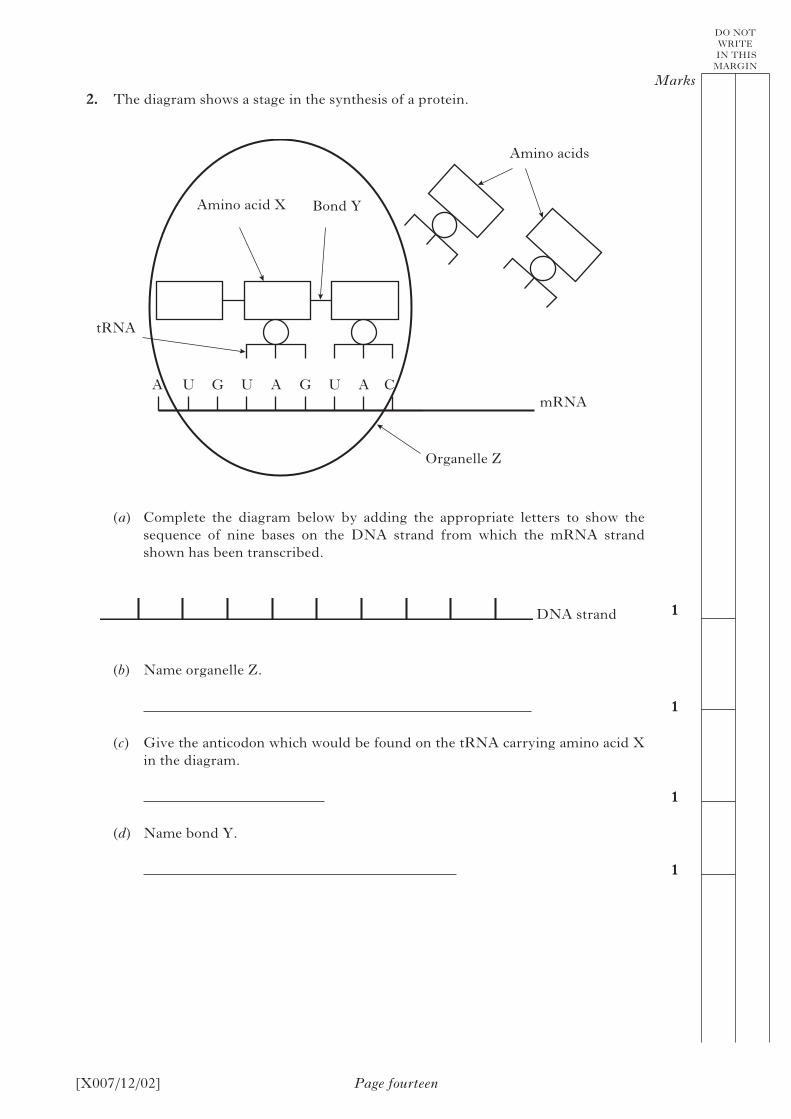
2. The diagram shows a stage in the synthesis of a protein.
(a) Complete the diagram below by adding the appropriate letters to show the sequence of nine bases on the DNA strand from which the mRNA strand shown has been transcribed.
DNA strand
(b) Name organelle Z.
(c) Give the anticodon which would be found on the tRNA carrying amino acid X in the diagram.
(d) Name bond Y.
Amino acids
Amino acid X Bond Y
mRNA
tRNA
Organelle Z
A U G U A G U A C
[X007/12/02] Page fifteen
Marks
1
1
1
DO NOT WRITE
IN THIS MARGIN
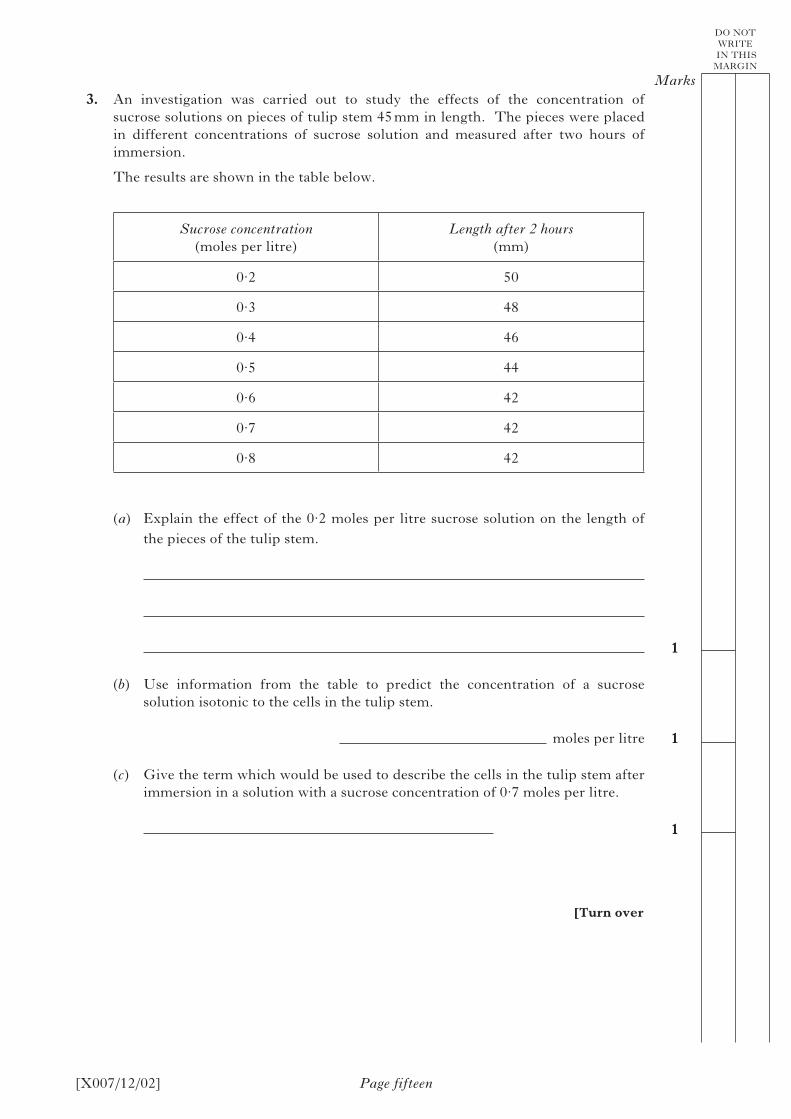
3. An investigation was carried out to study the effects of the concentration of sucrose solutions on pieces of tulip stem 45 mm in length. The pieces were placed in different concentrations of sucrose solution and measured after two hours of immersion.
The results are shown in the table below.
Sucrose concentration(moles per litre)
Length after 2 hours(mm)
0·2 50
0·3 48
0·4 46
0·5 44
0·6 42
0·7 42
0·8 42
(a) Explain the effect of the 0·2 moles per litre sucrose solution on the length of the pieces of the tulip stem.
(b) Use information from the table to predict the concentration of a sucrose solution isotonic to the cells in the tulip stem.
moles per litre
(c) Give the term which would be used to describe the cells in the tulip stem after immersion in a solution with a sucrose concentration of 0·7 moles per litre.
[Turn over
[X007/12/02] Page sixteen
Marks
1
1
DO NOT WRITE
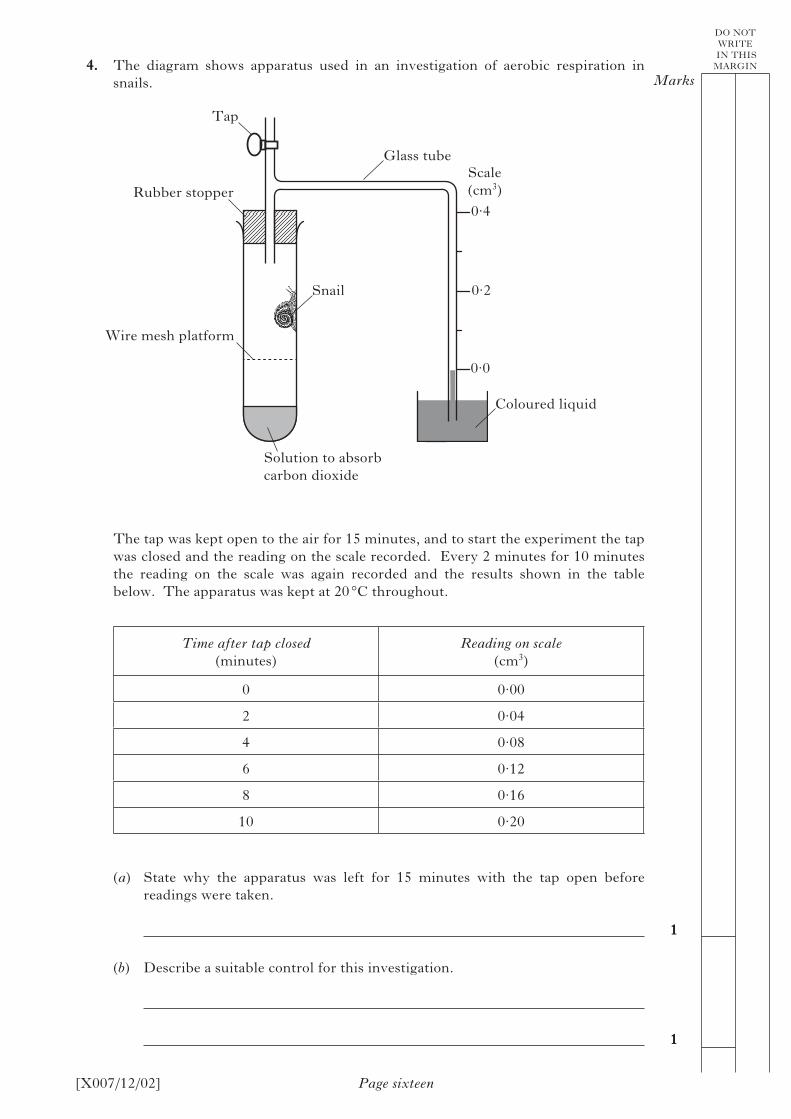
IN THIS MARGIN 4. The diagram shows apparatus used in an investigation of aerobic respiration in
snails.
Tap
Glass tube
Rubber stopper
Snail
Wire mesh platform
Coloured liquid
Solution to absorb carbon dioxide
0·0
0·2
0·4
Scale(cm3)
The tap was kept open to the air for 15 minutes, and to start the experiment the tap was closed and the reading on the scale recorded. Every 2 minutes for 10 minutes the reading on the scale was again recorded and the results shown in the table below. The apparatus was kept at 20 °C throughout.
Time after tap closed (minutes)
Reading on scale(cm3)
0 0·00
2 0·04
4 0·08
6 0·12
8 0·16
10 0·20
(a) State why the apparatus was left for 15 minutes with the tap open before readings were taken.
(b) Describe a suitable control for this investigation.
[X007/12/02] Page seventeen
Marks
1
2
1
2
DO NOT WRITE
IN THIS MARGIN
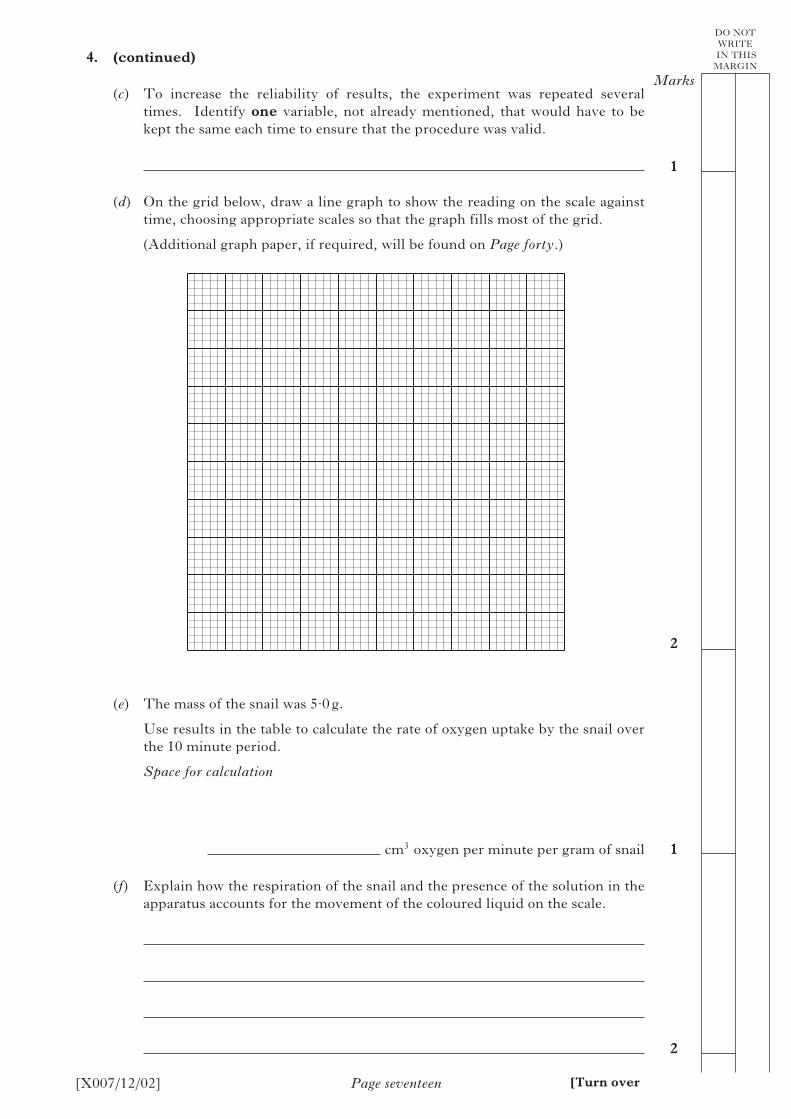
4. (continued)
(c) To increase the reliability of results, the experiment was repeated several times. Identify one variable, not already mentioned, that would have to be kept the same each time to ensure that the procedure was valid.
(d) On the grid below, draw a line graph to show the reading on the scale against time, choosing appropriate scales so that the graph fills most of the grid.
(Additional graph paper, if required, will be found on Page forty.)
(e) The mass of the snail was 5·0 g.
Use results in the table to calculate the rate of oxygen uptake by the snail over the 10 minute period.
Space for calculation
cm3 oxygen per minute per gram of snail
(f) Explain how the respiration of the snail and the presence of the solution in the apparatus accounts for the movement of the coloured liquid on the scale.
[Turn over
[X007/12/02]
Marks
1
1
DO NOT WRITE
IN THIS MARGIN
Page eighteen
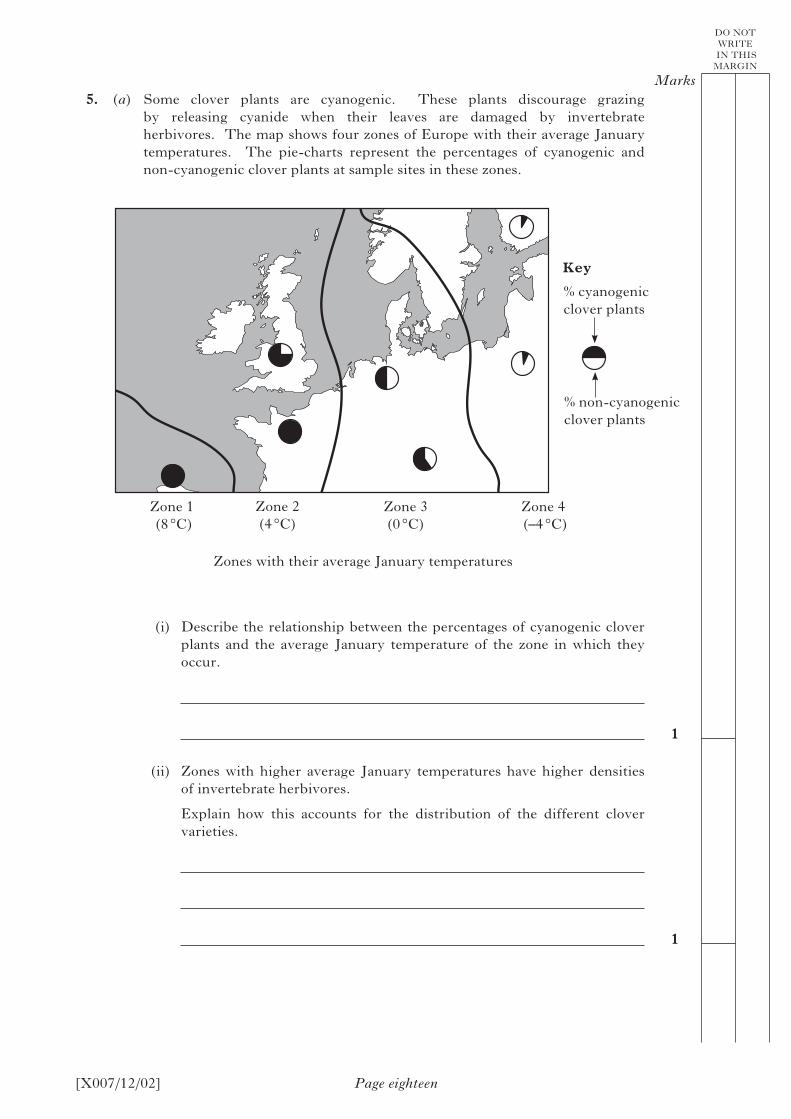
5. (a) Some clover plants are cyanogenic. These plants discourage grazing by releasing cyanide when their leaves are damaged by invertebrate herbivores. The map shows four zones of Europe with their average January temperatures. The pie-charts represent the percentages of cyanogenic and non-cyanogenic clover plants at sample sites in these zones.
(i) Describe the relationship between the percentages of cyanogenic clover plants and the average January temperature of the zone in which they occur.
(ii) Zones with higher average January temperatures have higher densities of invertebrate herbivores.
Explain how this accounts for the distribution of the different clover varieties.
% cyanogenic clover plants
% non-cyanogenic clover plants
Key
Zones with their average January temperatures
Zone 1 (8 °C)
Zone 2 (4 °C)
Zone 3 (0 °C)
Zone 4 (–4 °C)
[X007/12/02] Page nineteen
Marks
1
1
1
DO NOT WRITE
IN THIS MARGIN
5. (a) (continued)
(iii) Apart from cyanide, name one other toxic compound produced by plants to discourage grazing by herbivores.
(iv) State one feature of some plant species which allows them to tolerate grazing by herbivores.
(b) Name a substance produced by some plants which acts as a barrier to prevent the spread of infection from a wound site.
[Turn over
[X007/12/02] Page twenty
Marks
1
1
1
1
DO NOT WRITE
IN THIS MARGIN
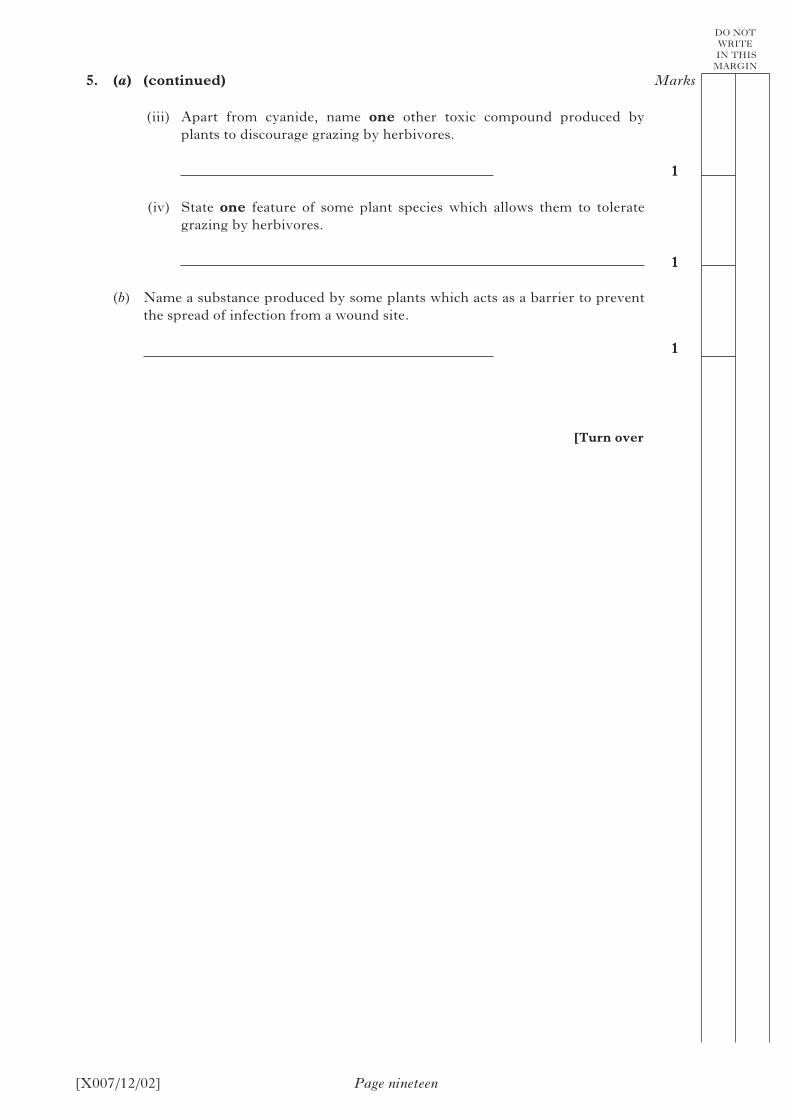
6. (a) Peregrine falcons are predators which hunt wading birds such as redshank. In an investigation, the hunting success of peregrines and the sizes and distances of the feeding flocks of redshank from cover were recorded. The results are shown on the graph below.
Key to redshank flock size
less than 10 birds
10–50 birds
more than 50 birds
Increasing distance of redshank from cover
Incr
easi
ng
hu
nti
ng
succ
ess
of p
ereg
rin
es
Give two conclusions which can be drawn from the results.
1
2
(b) Hermit crabs withdraw into their shells if disturbed by small stones dropped into the water. If this harmless stimulus is repeated, the number of crabs responding decreases.
Name the type of behaviour shown by the crabs when they:
(i) withdraw into their shells;
(ii) no longer respond to the repeated harmless stimulus.
[X007/12/02] Page twenty-one
Marks
1
1
1
1
1
DO NOT WRITE
IN THIS MARGIN
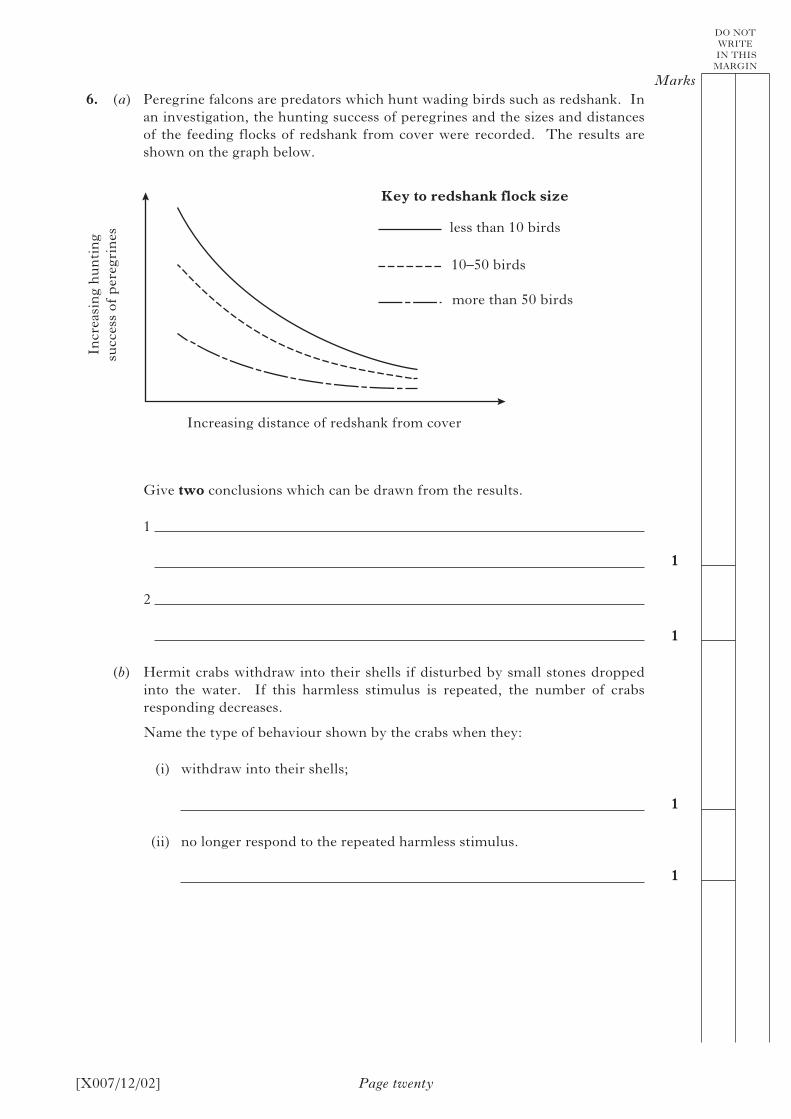
7. (a) The diagram shows a stage in meiosis in a cell from a Hawkweed plant.
(i) Name a structure in a Hawkweed flower in which meiosis occurs.
(ii) In the following sentence, underline the word in the choice brackets which identifies the stage of meiosis shown and give a reason for your choice.
This cell is from the meiotic divison.
Reason
(iii) State the number of chromosomes which would be found in a gamete and in a gamete mother cell from this plant.
gamete
gamete mother cell
(b) Mutation during meiosis can lead to new phenotypes.
(i) Other than mutation, state one feature of meiosis which can lead to the production of new phenotypes.
(ii) Name the process which could result in the presence of an extra chromosome in a gamete.
{ }first
second
[Turn over
[X007/12/02] Page twenty-two
Marks
2
1
1
DO NOT WRITE
IN THIS MARGIN
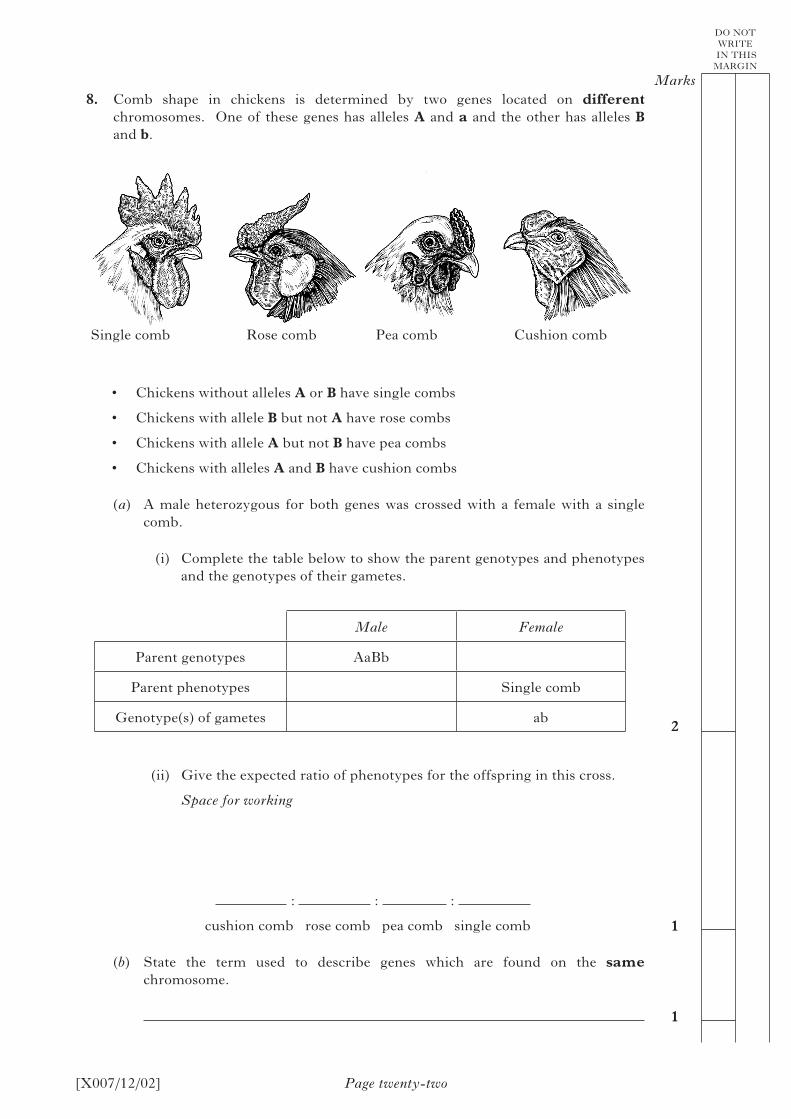
8. Comb shape in chickens is determined by two genes located on different chromosomes. One of these genes has alleles A and a and the other has alleles B and b.
Single comb Rose comb Pea comb Cushion comb
• Chickens without alleles A or B have single combs
• Chickens with allele B but not A have rose combs
• Chickens with allele A but not B have pea combs
• Chickens with alleles A and B have cushion combs
(a) A male heterozygous for both genes was crossed with a female with a single comb.
(i) Complete the table below to show the parent genotypes and phenotypes and the genotypes of their gametes.
Male Female
Parent genotypes AaBb
Parent phenotypes Single comb
Genotype(s) of gametes ab
(ii) Give the expected ratio of phenotypes for the offspring in this cross.
Space for working
: : :
cushion comb rose comb pea comb single comb
(b) State the term used to describe genes which are found on the same chromosome.
[X007/12/02] Page twenty-three
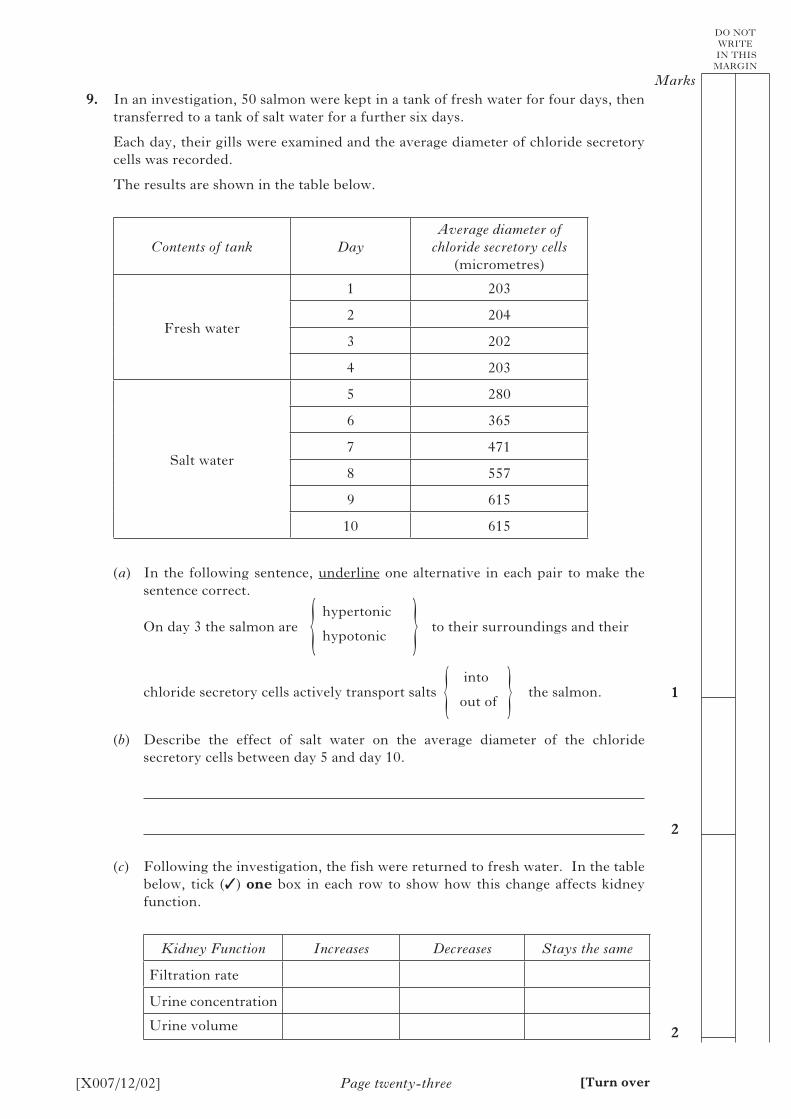
9. In an investigation, 50 salmon were kept in a tank of fresh water for four days, then transferred to a tank of salt water for a further six days.
Each day, their gills were examined and the average diameter of chloride secretory cells was recorded.
The results are shown in the table below.
Contents of tank DayAverage diameter of
chloride secretory cells (micrometres)
Fresh water
1 203
2 204
3 202
4 203
Salt water
5 280
6 365
7 471
8 557
9 615
10 615
(a) In the following sentence, underline one alternative in each pair to make the sentence correct.
On day 3 the salmon are to their surroundings and their
chloride secretory cells actively transport salts the salmon.
(b) Describe the effect of salt water on the average diameter of the chloride secretory cells between day 5 and day 10.
(c) Following the investigation, the fish were returned to fresh water. In the table below, tick (3) one box in each row to show how this change affects kidney function.
Kidney Function Increases Decreases Stays the same
Filtration rate
Urine concentration
Urine volume
Marks
1
2
2
DO NOT WRITE
IN THIS MARGIN
{ }hypertonic
hypotonic
{ }into
out of
[Turn over
[X007/12/02] Page twenty-four
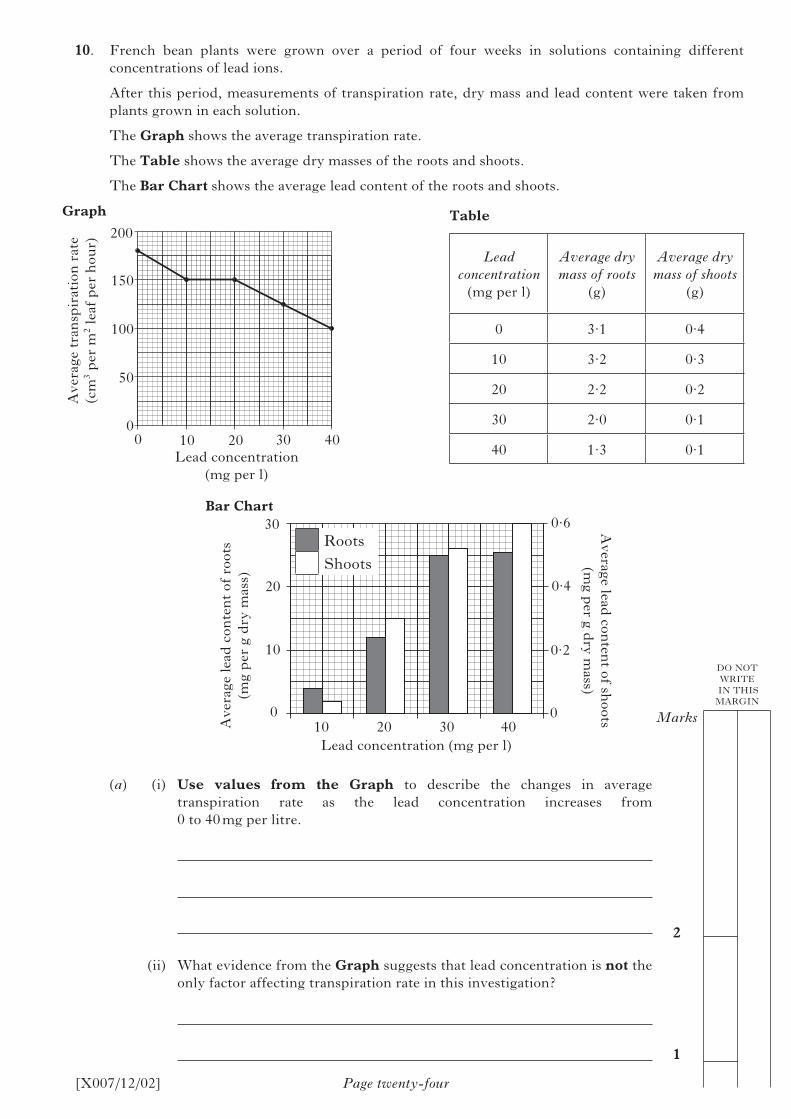
10. French bean plants were grown over a period of four weeks in solutions containing different concentrations of lead ions.
After this period, measurements of transpiration rate, dry mass and lead content were taken from plants grown in each solution.
The Graph shows the average transpiration rate.
The Table shows the average dry masses of the roots and shoots.
The Bar Chart shows the average lead content of the roots and shoots.
200
150
100
50
00 10 20 30 40
Ave
rage
tra
nsp
irat
ion
rat
e(c
m3
per
m2
leaf
per
hou
r)
Lead concentration(mg per l)
Graph Table
Lead concentration
(mg per l)
Average dry mass of roots
(g)
Average dry mass of shoots
(g)
0 3·1 0·4
10 3·2 0·3
20 2·2 0·2
30 2·0 0·1
40 1·3 0·1
30
20
10
010 20 30 40Lead concentration (mg per l)
Ave
rage
lead
con
ten
t of
roo
ts
(mg
per
g d
ry m
ass)
Average lead
conten
t of shoots
(mg p
er g dry m
ass)
0·6
0·4
0·2
0
Roots
Shoots
Bar Chart
Marks
2
1
DO NOT WRITE
IN THIS MARGIN
(a) (i) Use values from the Graph to describe the changes in average transpiration rate as the lead concentration increases from 0 to 40 mg per litre.
(ii) What evidence from the Graph suggests that lead concentration is not the only factor affecting transpiration rate in this investigation?
[X007/12/02] Page twenty-five
Marks
1
1
1
1
1
2
DO NOT WRITE
IN THIS MARGIN
10. (continued)
(b) Use information from the Table, to calculate the percentage decrease in combined average dry mass of shoots and roots when the lead concentration in the solution was increased from 0 to 40 mg per litre.
Space for calculation
% decrease
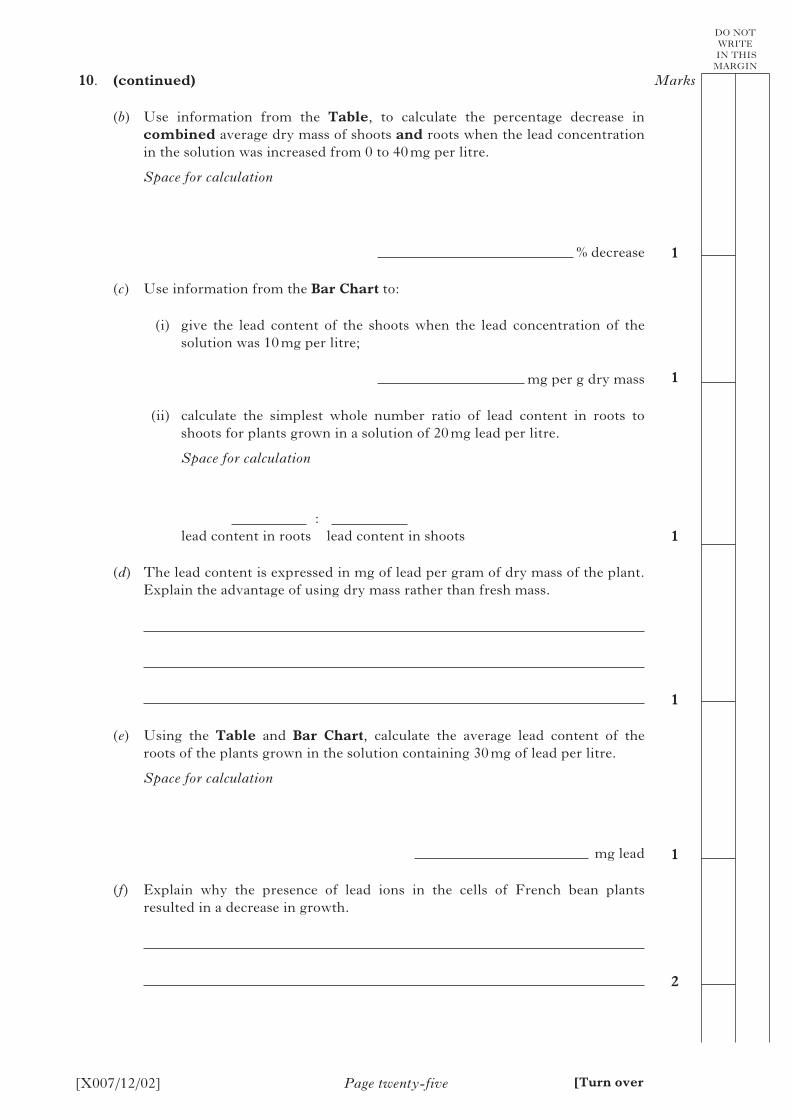
(c) Use information from the Bar Chart to:
(i) give the lead content of the shoots when the lead concentration of the solution was 10 mg per litre;
mg per g dry mass
(ii) calculate the simplest whole number ratio of lead content in roots to shoots for plants grown in a solution of 20 mg lead per litre.
Space for calculation
: lead content in roots lead content in shoots
(d) The lead content is expressed in mg of lead per gram of dry mass of the plant. Explain the advantage of using dry mass rather than fresh mass.
(e) Using the Table and Bar Chart, calculate the average lead content of the roots of the plants grown in the solution containing 30 mg of lead per litre.
Space for calculation
mg lead
(f) Explain why the presence of lead ions in the cells of French bean plants resulted in a decrease in growth.
[Turn over
[X007/12/02]
Marks
1
1
DO NOT WRITE
IN THIS MARGIN
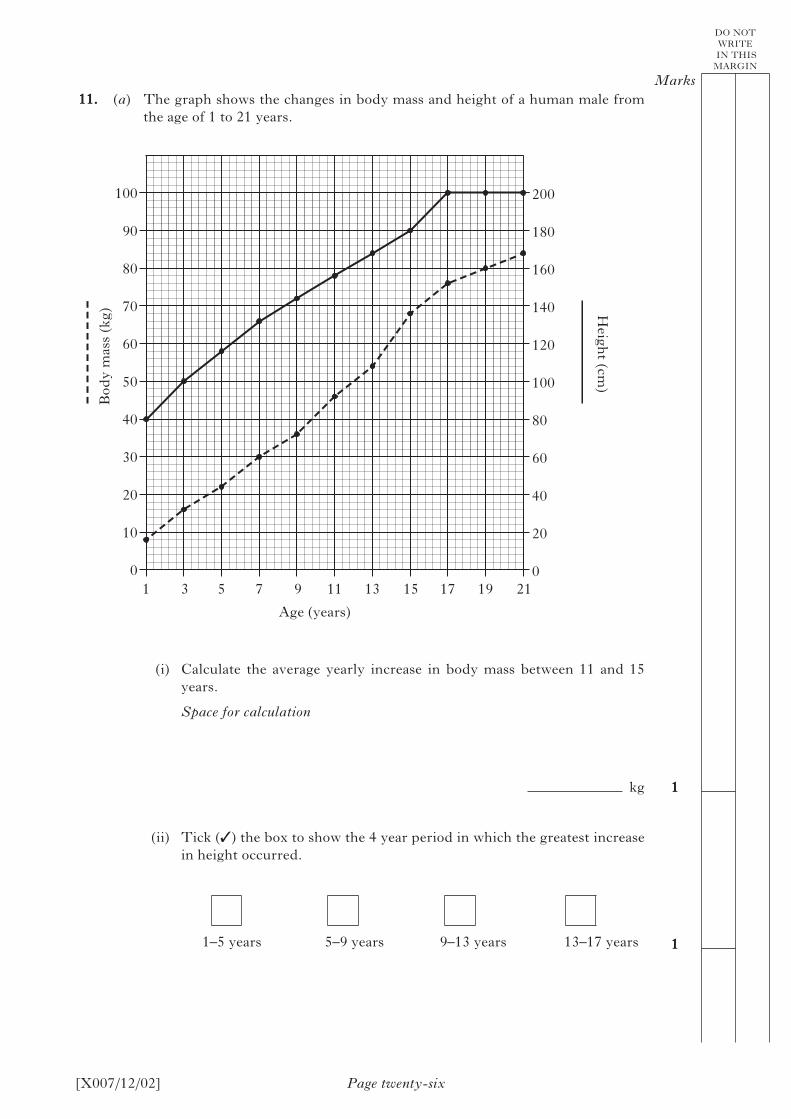
11. (a) The graph shows the changes in body mass and height of a human male from the age of 1 to 21 years.
100
90
80
70
60
50
40
30
20
10
01 3 5 7 9 11 13 15 17 19 21
200
180
160
140
120
100
80
60
40
20
0
Bod
y m
ass
(kg) H
eight (cm
)
Age (years)
(i) Calculate the average yearly increase in body mass between 11 and 15 years.
Space for calculation
kg
(ii) Tick (3) the box to show the 4 year period in which the greatest increase in height occurred.
1–5 years 5–9 years 9–13 years 13–17 years
Page twenty-six
[X007/12/02]
Marks
2
1
DO NOT WRITE
IN THIS MARGIN
11. (continued)
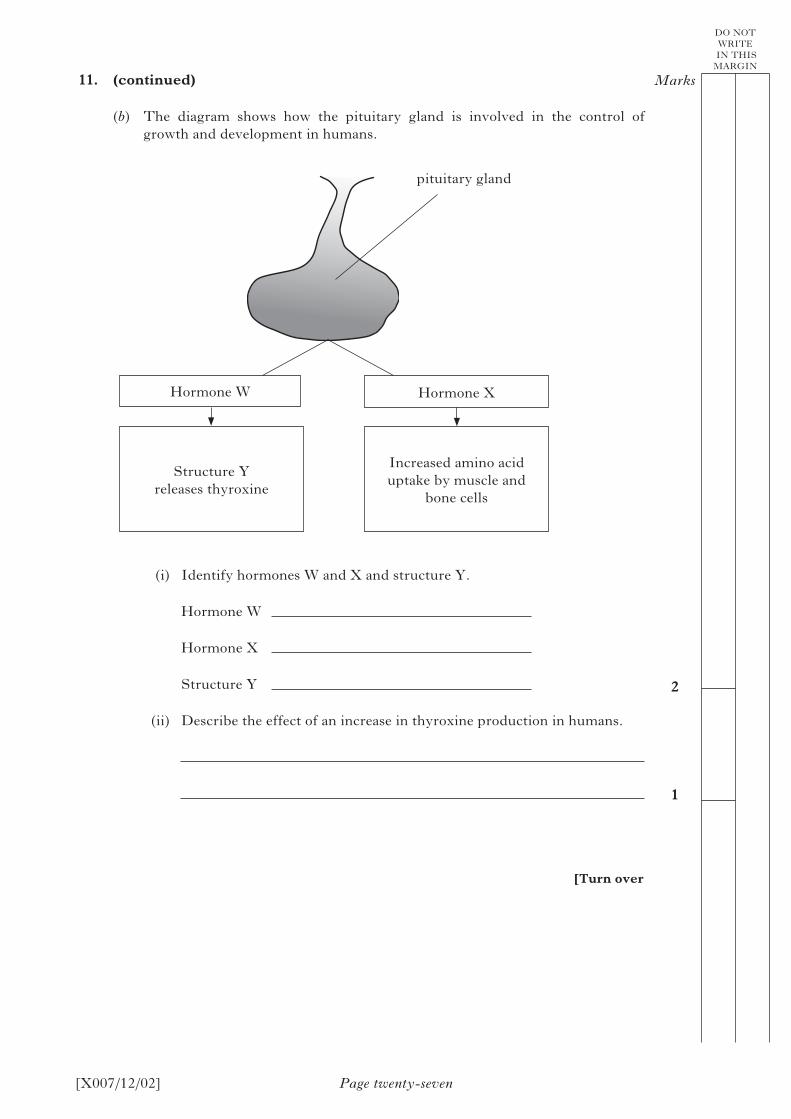
(b) The diagram shows how the pituitary gland is involved in the control of growth and development in humans.
pituitary gland
Hormone W Hormone X
Structure Y releases thyroxine
Increased amino acid uptake by muscle and
bone cells
(i) Identify hormones W and X and structure Y.
Hormone W
Hormone X
Structure Y
(ii) Describe the effect of an increase in thyroxine production in humans.
Page twenty-seven
[Turn over
[X007/12/02]
Marks
1
1
1
1
1
DO NOT WRITE
IN THIS MARGIN
Page twenty-eight
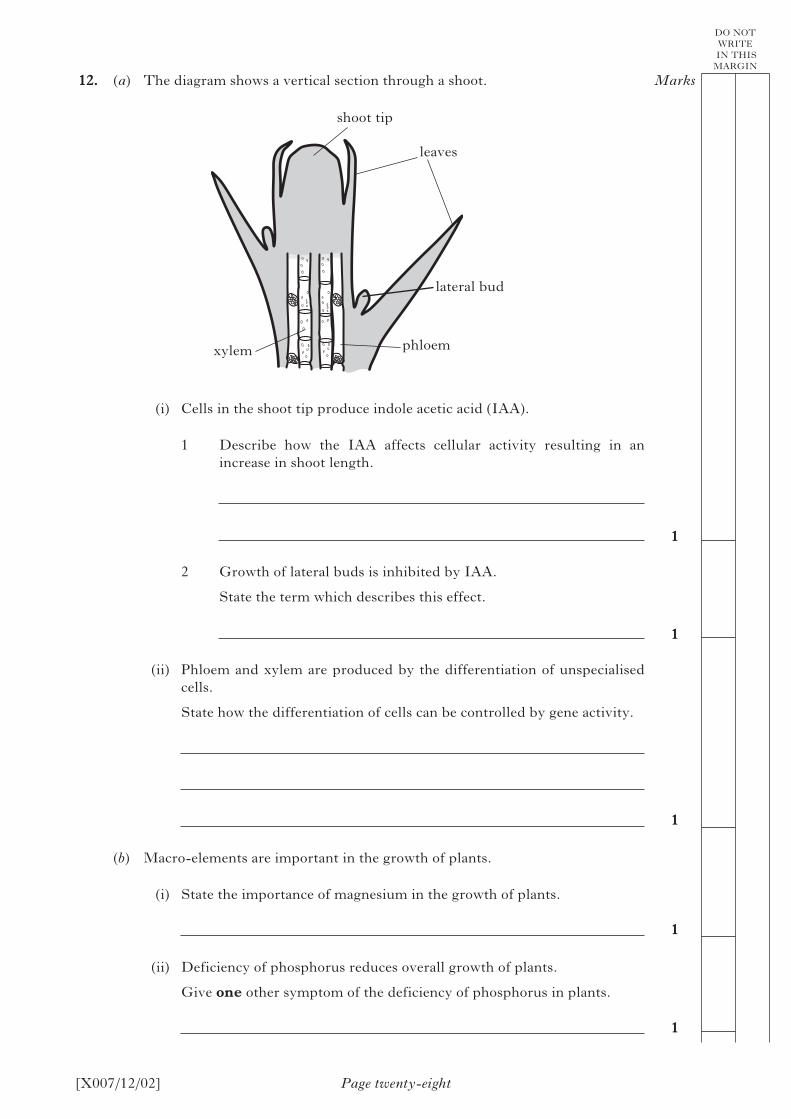
12. (a) The diagram shows a vertical section through a shoot.
xylem phloem
shoot tip
leaves
lateral bud
(i) Cells in the shoot tip produce indole acetic acid (IAA).
1 Describe how the IAA affects cellular activity resulting in an increase in shoot length.
2 Growth of lateral buds is inhibited by IAA.
State the term which describes this effect.
(ii) Phloem and xylem are produced by the differentiation of unspecialised cells.
State how the differentiation of cells can be controlled by gene activity.
(b) Macro-elements are important in the growth of plants.
(i) State the importance of magnesium in the growth of plants.
(ii) Deficiency of phosphorus reduces overall growth of plants.
Give one other symptom of the deficiency of phosphorus in plants.
[X007/12/02] Page twenty-nine
Marks
1
1
1
1
1
1
DO NOT WRITE
IN THIS MARGIN
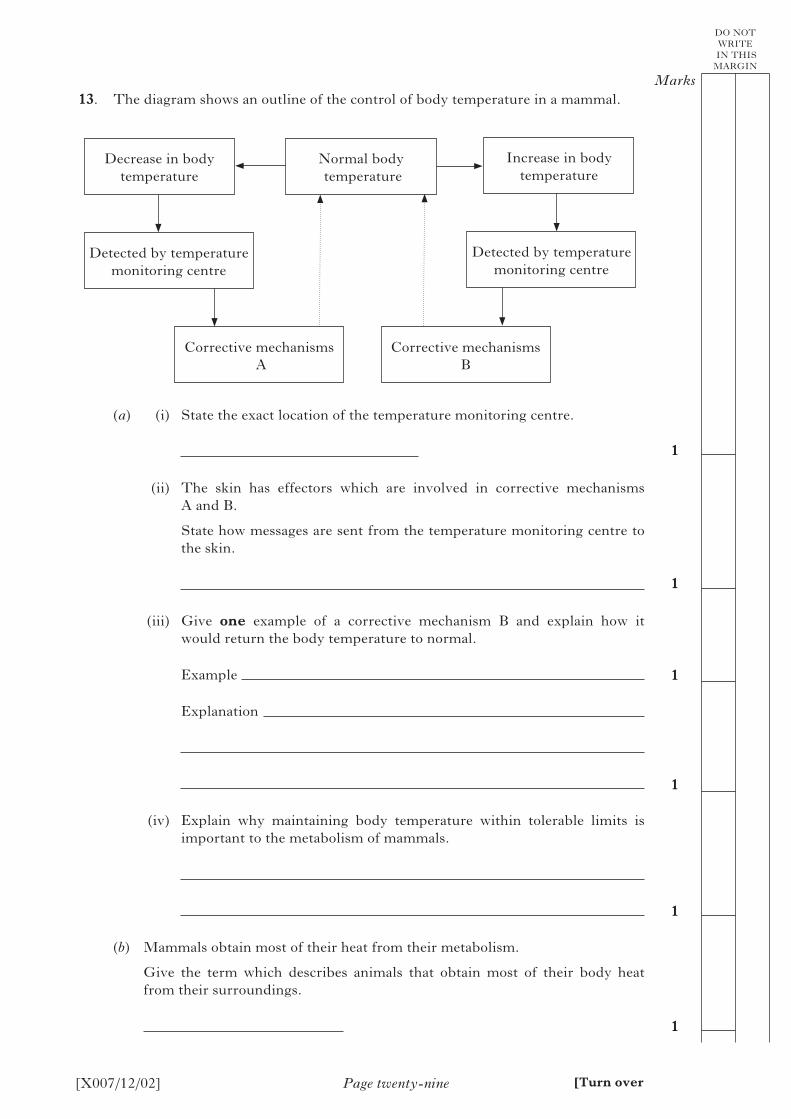
13. The diagram shows an outline of the control of body temperature in a mammal.
Decrease in body temperature
Normal body temperature
Increase in body temperature
Detected by temperature monitoring centre
Detected by temperature monitoring centre
Corrective mechanisms A
Corrective mechanisms B
(a) (i) State the exact location of the temperature monitoring centre.
(ii) The skin has effectors which are involved in corrective mechanisms A and B.
State how messages are sent from the temperature monitoring centre to the skin.
(iii) Give one example of a corrective mechanism B and explain how it would return the body temperature to normal.
Example
Explanation
(iv) Explain why maintaining body temperature within tolerable limits is important to the metabolism of mammals.
(b) Mammals obtain most of their heat from their metabolism.
Give the term which describes animals that obtain most of their body heat from their surroundings.
[Turn over
[X007/12/02]
Marks
2
1
2
DO NOT WRITE
IN THIS MARGIN
Page thirty
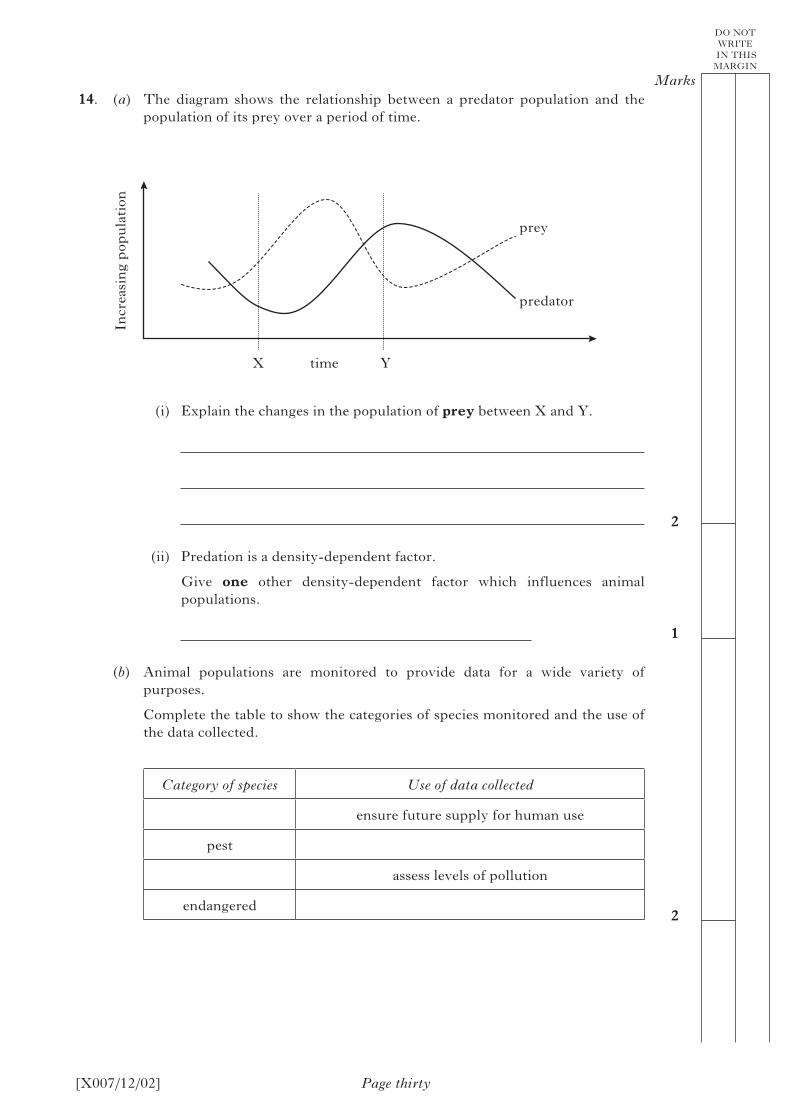
14. (a) The diagram shows the relationship between a predator population and the population of its prey over a period of time.
prey
predator
Incr
easi
ng
pop
ula
tion
timeX Y
(i) Explain the changes in the population of prey between X and Y.
(ii) Predation is a density-dependent factor.
Give one other density-dependent factor which influences animal populations.
(b) Animal populations are monitored to provide data for a wide variety of purposes.
Complete the table to show the categories of species monitored and the use of the data collected.
Category of species Use of data collected
ensure future supply for human use
pest
assess levels of pollution
endangered
[X007/12/02]
Marks
1
1
1
DO NOT WRITE
IN THIS MARGIN
Page thirty-one
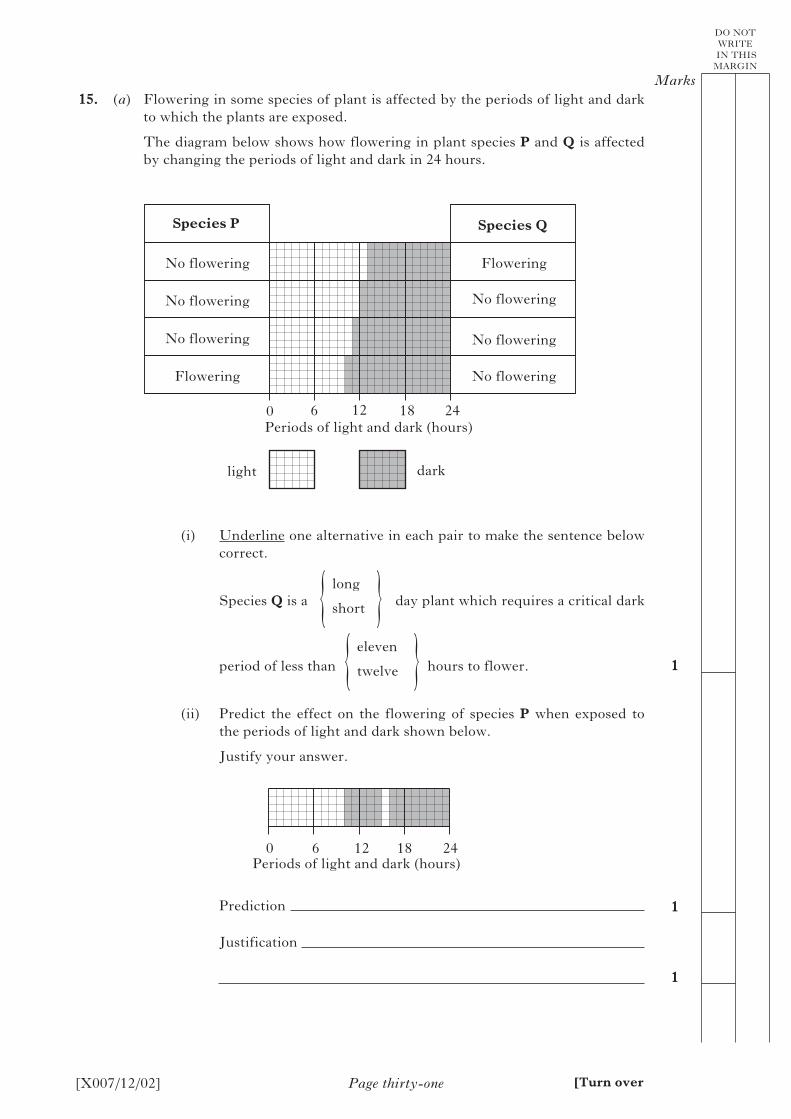
15. (a) Flowering in some species of plant is affected by the periods of light and dark to which the plants are exposed.
The diagram below shows how flowering in plant species P and Q is affected by changing the periods of light and dark in 24 hours.
Species P Species Q
No flowering
No flowering
No flowering
No flowering
No flowering
Flowering
Flowering
No flowering
light dark
0 6 12 18 24Periods of light and dark (hours)
(i) Underline one alternative in each pair to make the sentence below correct.
Species Q is a day plant which requires a critical dark
period of less than hours to flower.
(ii) Predict the effect on the flowering of species P when exposed to the periods of light and dark shown below.
Justify your answer.
0 6 12 18 24
Prediction
Justification
{ }long
short
{ }eleven
twelve
[Turn over
Periods of light and dark (hours)
[X007/12/02] Page thirty-two
Marks
1
1
DO NOT WRITE
IN THIS MARGIN
15. (continued)
(b) (i) Ferrets are long day breeders and give birth six weeks after mating. Tick (3) the box to show the season in which ferrets mate and explain how the timing of their breeding gives their offspring the best chance of survival.
Mating season Spring Autumn
Explanation
(ii) What general term is used to describe the effect of light on the timing of breeding in mammals such as ferrets?
[X007/12/02] Page thirty-three
Marks
6
4
(10)
2
8
(10)
(10)
(10)
DO NOT WRITE
IN THIS MARGIN
SECTION C
Both questions in this section should be attempted.
Note that each question contains a choice.
Questions 1 and 2 should be attempted on the blank pages which follow.
Supplementary sheets, if required, may be obtained from the Invigilator.
All answers must be written clearly and legibly in ink.
Labelled diagrams may be used where appropriate.
1. Answer either A or B.
A. Write notes on the evolution of new species under the following headings:
(i) the role of isolation and mutation;
(ii) natural selection.
OR
B. Write notes on adaptations for obtaining food in animals under the following headings:
(i) the economics of foraging behaviour;
(ii) cooperative hunting, dominance hierarchy and territorial behaviour.
In question 2, ONE mark is available for coherence and ONE mark is available for relevance.
2. Answer either A or B.
A. Give an account of the structure of a mitochondrion and the role of the cytochrome system in respiration.
OR
B. Give an account of phagocytosis and the role of lymphocytes in cellular defence.
[END OF QUESTION PAPER]

[X007/12/02] Page thirty-four
SPACE FOR ANSWERS
DO NOT WRITE
IN THIS MARGIN

[X007/12/02] Page thirty-five
SPACE FOR ANSWERS
DO NOT WRITE
IN THIS MARGIN
[Turn over

[X007/12/02] Page thirty-six
DO NOT WRITE
IN THIS MARGIN
SPACE FOR ANSWERS
[X007/12/02] Page thirty-seven
DO NOT WRITE
IN THIS MARGIN
SPACE FOR ANSWERS
[Turn over
[X007/12/02] Page thirty-eight
DO NOT WRITE
IN THIS MARGIN
SPACE FOR ANSWERS
[X007/12/02] Page thirty-nine
DO NOT WRITE
IN THIS MARGIN
SPACE FOR ANSWERS
[Turn over
[X007/12/02] Page forty
DO NOT WRITE
IN THIS MARGIN
SPACE FOR ANSWERS
ADDITIONAL GRAPH PAPER FOR QUESTION 4(d)


