
lable at ScienceDirect
ARTICLE IN PRESS
Journal of Structural Geology xxx (2010) 1–16
Contents lists avai
Journal of Structural Geology
journal homepage: www.elsevier .com/locate/ jsg
Faulting and fissuring in active oceanic rift: Surface expression, distributionand tectonic–volcanic interaction in the Thingvellir Fissure Swarm, Iceland
L. Sonnette a,*, J. Angelier a, T. Villemin b, F. Bergerat c
a GEOAZUR (UMR 6526 CNRS-UNS-UPMC-IRD), Observatoire Oceanographique, la Darse, B.P. 48, 06235 Villefranche-sur-Mer Cedex, Franceb EDYTEM (UMR 5204 CNRS-Universite de Savoie), Campus scientifique, 73376 Le Bourget du lac Cedex, Francec ISTeP (UMR 7193 CNRS-UPMC), Universite Paris VI, Case 117, 4, Place Jussieu, F-75252 Paris Cedex 05, France
a r t i c l e i n f o
Article history:Received 4 July 2009Received in revised form18 December 2009Accepted 2 January 2010Available online xxx
Keywords:Icelandic riftThingvellir Fissure SwarmGeomorphologyPhotogrammetryNormal fault growthRock fracture mechanics
* Corresponding author.E-mail address: [email protected] (L. So
0191-8141/$ – see front matter � 2010 Elsevier Ltd. Adoi:10.1016/j.jsg.2010.01.003
Please cite this article in press as: Sonnette,Geol. (2010), doi:10.1016/j.jsg.2010.01.003
a b s t r a c t
Iceland brings exceptional opportunity for analysing extension related to rifting of the Mid-Atlantic ridge,especially revealing fresh structural patterns in active fissure swarms. Post-glacial fracture systems of theThingvellir rift segment of the West Volcanic Zone (WVZ) and interaction with holocene lava flowoverlapping are analysed in detail in this paper. We mapped 5390 fractures at metric to kilometric scalesin order to realise a precise structural map, a representative fault length distribution analysis and somestatistical calculations in terms of fault length/number growth rates from Holocene to recent time.Mapping and 3-D geometrical analysis of faults and fissures are based on use of photogrammetrictechniques, GPS positioning at ground control points and validation from geological field work. Thisapproach allowed us to measure the vertical throw distribution along 52 faults with a precision around0.5–1 m. Most of these faults have symmetric serrated fault-displacement profiles; however some ofthem have profiles offset to the north or south. Fault vertical offset as a function of the age of the hostinglava flows are presented too. Finally, from the study of 70 transverse topographic profiles and the faultoffset analysis, we propose a propagation model for Holocene fissure development, partly controlled byPleistocene tectonic inheritance. Our model takes into special account alternating volcanic events andfaulting. Simple fissure zones with small hangingwall monocline or more complex scarp zones withgraben and larger hangingwall monocline developed. Because of lava flow accumulation during the riftextension, estimating the amount of extension based on the present-day morphology would have led tosevere under-evaluation.
� 2010 Elsevier Ltd. All rights reserved.
1. Introduction
The ongoing oceanic rifting in Iceland mainly consists of so-called fissure swarms containing fissures and faults that affectrecent lava flows accumulated in the axial zones of the riftsegments in the west, east and north volcanic zones (Fig. 1). In thevolcanic zones, close relationships exist between major centralvolcanoes and fissure swarms (Johannesson and Saemundsson,1998a,b). The recent and present-day fracture patterns can bestudied at the surface over a wide range of investigation scales,from minor fissures to large faulted-tilted blocks. When analysed indetail, the topography reveals the mechanical consistency of theunderlying extensional structure (Angelier et al., 1997; Dauteuilet al., 2001).
nnette).
ll rights reserved.
L., et al., Faulting and fissurin
The Thingvellir Fissure Swarm (TFS), which belongs to the WestVolcanic Zone (WVZ) (Fig. 1a), provides excellent illustration offracture patterns and magmatic activity in the bottom of an oceanicrift segment. The TFS and other Icelandic fissure swarms have beenactively studied (Nielsen, 1930; Benauer, 1943; Kjartansson, 1964;Walker,1964,1965b; Thorarinsson,1965; Saemundsson,1978,1992).Specific analyses have been done regarding the determination of therate of horizontal deformation (Gerke, 1974; Brander et al., 1976;Decker et al., 1976), vertical deformation (Tryggvason, 1974, 1982),fracture geometry (Gudmundsson, 1987a,b, 2000; Villemin et al.,1994; Grant and Kattenhorn, 2004), fault growth (Gudmundsson,1992) and relay zones (Acocella et al., 2000). However, the interac-tion between the volcanic activity and the development of fracturesand faults in the West Volcanic Zone has not been analysed in detail.We attempt at filling this gap, taking advantage of the currentprecision and quality of GPS ground control points and photo-grammetric information and processing to analyse large numbers offissures and faults. In addition to observations in the field, not onlydo these modern analyses provide accurate maps of fissure swarms,
g in active oceanic rift: Surface expression, distribution and..., Struct.

Fig. 1. (a) The Thingvellir Fissure Swarm in the structural context of Iceland (adapted from Angelier et al., 1997). The plate velocities relative to the Iceland Mantle Plume areindicated according to the NUVEL1 kinematic model (DeMets et al., 1990, 1994). RR¼ Reykjanes Ridge; KR¼ Kolbeinsey Ridge; WVZ¼West Volcanic Zone; EVZ¼ East VolcanicZone; NVZ¼North Volcanic Zone; SISZ¼ South Icelandic Seismic Zone; TFZ¼ Tjornes Fracture Zone. (b) Perspective view of the photographic mosaic of the Thingvellir FissureSwarm projected on a Digital Elevation Model. The lava flows (dashed arrows) come from the Skjaldbreiður volcano (black triangle) and fissure eruptive centres between Tindaskagiand Kalfstindar (white triangles), following a general topographic slope towards the Thingvellir depression to the SSW. Gja in Icelandic means gaping or open fracture, so the namesending by ‘‘gja’’ refer to open fractures which correspond here to main fault scarps. Three normal fault scarps (Mjoafellagja, Almannagja and Sledaasgja) cut through the Armansfell-Lagafell Mountain and bound tilted blocks that dip towards the rift axis.
L. Sonnette et al. / Journal of Structural Geology xxx (2010) 1–162
ARTICLE IN PRESS
they also allow 3-D analysis, including determination of verticaloffsets (for vertical throw more than 0.5 m).
The central segment of the TFS is limited to the north and to thesouth by large central volcanoes, Kjolur, Prestahnukur and Hengillrespectively, where dykes provided access of the magma to thesurface, giving large lava flows (Thordarson and Hoskuldsson,2002; Sinton et al., 2005). Although the relationships betweendykes and faults at depth have already been analysed in southwest(Forslund and Gudmundsson, 1991), in northeast Iceland (Dauteuilet al., 2001) and more precisely for Thingvellir area by Gud-mundsson (2005), the problem of how lava flow generation mayinteract with fault growth has not yet been addressed in detail. Inthe axial zone of the TFS, where major lava flows of Holocene agehave already been mapped and dated (Saemundsson, 1992; Sintonet al., 2005), not only does the brittle structure need to be quanti-tatively analysed in detail but also some important questionsremain. For instance, typical fault scarps with large fissures, such asat the historical parliament site of Thingvellir, exhibit an along-faultmonocline in the footwall. Did this particular structure originatefrom tectonic events exclusively, or from tectonic–volcanic inter-action? Did a fault scarp already exist before the formation of the
Please cite this article in press as: Sonnette, L., et al., Faulting and fissurinGeol. (2010), doi:10.1016/j.jsg.2010.01.003
most recent lava flow? Knowing that erosion is negligible, how fardoes the scarp height reflect the vertical offset of the fault? Theanswers to these questions are crucial for estimating the rates ofbrittle deformation, because many fault scarps are buried by morerecent lava flows. Such problems have important inferences for thedetermination of vertical and horizontal relative displacements,and hence the extension rates across the rift segment.
In this paper, we aim at analysing the fault characteristics, usingthe combination of (i) an innovative remote method, based onsystematic coverage of the TFS involving geo-referencing, orthor-ectification and 3-D photogrammetric restitution, and (ii) fieldobservation and geodetic (GPS) measurements of fractures. Wecould thus determine the number, density and length of 5390individual fractures at metric to kilometric scales, characterise theshape of fault scarps in 70 across-strike profiles, and measure thealong-strike evolution of vertical throw along 52 faults. Using thesedata as a basis for analysing the fracture geometry, we intend todefine differences – if any – in fault types and characterise somemajor aspects of fracturing behaviour inside the TFS rift segment.We further aim at examining the relationships between fracturepattern development and volcanic activity within the TFS.
g in active oceanic rift: Surface expression, distribution and..., Struct.
L. Sonnette et al. / Journal of Structural Geology xxx (2010) 1–16 3
ARTICLE IN PRESS
2. Geological setting of the Thingvellir Fissure Swarm
2.1. Rift segment and volcanic formations
The WVZ is a N35�E–N40�E trending rift about 150 km long and10–30 km wide (Fig.1). This rift segment developed as a consequenceof an eastward rift jump of the oceanic ridge, previously located nearthe present-day Snaefells peninsula, 6–7 My ago (Mc Dougall et al.,1977; Saemundsson,1979; Johannesson,1980). A further eastward riftjump, approximately 1.5–3 My ago, resulted in the creation of a newrift branch: the East Volcanic Zone (EVZ) and in a possible progressivedecline of the WVZ activity from north to south (Saemundsson andJohannesson, 1994). However, Sinton et al. (2005) consider an equalactivity of the whole WVZ during the post-glacial period.
In the Thingvellir area, the rifting extension is mainly accom-modated by faults and open fractures at the surface. The lakeThingvallavatn (Fig. 2) developed in a graben with remarkablesubsidence (Saemundsson, 1992), a common feature of the Icelandrift valleys (Jakobsson et al., 1978; Bjornsson, 1985; Gudmundsson,1987a,b; Gudmundsson and Backstrom, 1991). From the chrono-logical point of view, one distinguishes Plio-Pleistocene formations(3.1–0.8 Ma), Pleistocene glacial and interglacial formations (320–20 ka) and Late Pleistocene–Holocene post-glacial formations(10.2–1.8 ka). The Holocene graben of the Thingvellir area isbounded by Plio-Pleistocene lava fields over a width of about 30 kmon both sides of the graben. The thickness of the Plio-Pleistocenelava pile reaches 6 km (Saemundsson, 1992). This pile is composedby a succession of basaltic lavas and hyaloclastites or glacialdeposits with a uniform dip of around 10�, towards the SE on theWest side of the rift. Near the major faults that bound the Thing-vellir graben, the dip of the lava pile increases (Saemundsson,1992). The K/Ar datations (Mc Dougall et al., 1977) of the lava flowssouth-west of Botnssulur (west to Armannsfell, Fig. 1) and paleo-magnetic analyses (LaBrecque et al., 1977) yielded an age of 1.8 Ma.
The Pleistocene formations, which crop out as small rangesinside the rift, (Figs. 1 and 2) developed during glacial and inter-glacial periods with two characteristic morphological types. Theoldest formations, which belong to the third and second glacialstages (Saemundsson, 1992), now form table mountains(Armannsfell, Figs. 1 and 2) west of our investigation area. Theyoungest formations, which represent the last interglacial (Eemian)and glacial (Weichselian) stages, form shield lavas east of the
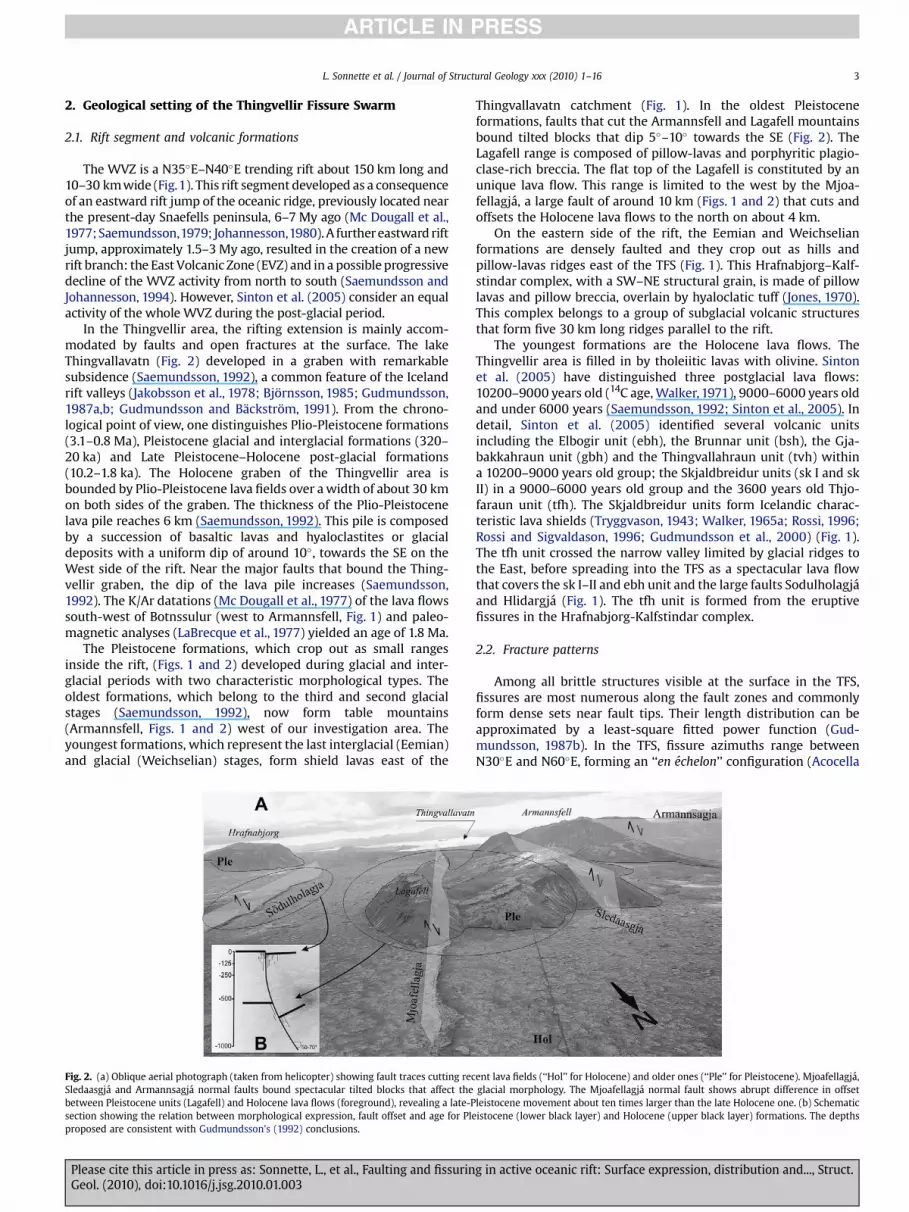
Fig. 2. (a) Oblique aerial photograph (taken from helicopter) showing fault traces cutting recSledaasgja and Armannsagja normal faults bound spectacular tilted blocks that affect thebetween Pleistocene units (Lagafell) and Holocene lava flows (foreground), revealing a late-Psection showing the relation between morphological expression, fault offset and age for Pleproposed are consistent with Gudmundsson’s (1992) conclusions.
Please cite this article in press as: Sonnette, L., et al., Faulting and fissurinGeol. (2010), doi:10.1016/j.jsg.2010.01.003
Thingvallavatn catchment (Fig. 1). In the oldest Pleistoceneformations, faults that cut the Armannsfell and Lagafell mountainsbound tilted blocks that dip 5�–10� towards the SE (Fig. 2). TheLagafell range is composed of pillow-lavas and porphyritic plagio-clase-rich breccia. The flat top of the Lagafell is constituted by anunique lava flow. This range is limited to the west by the Mjoa-fellagja, a large fault of around 10 km (Figs. 1 and 2) that cuts andoffsets the Holocene lava flows to the north on about 4 km.
On the eastern side of the rift, the Eemian and Weichselianformations are densely faulted and they crop out as hills andpillow-lavas ridges east of the TFS (Fig. 1). This Hrafnabjorg–Kalf-stindar complex, with a SW–NE structural grain, is made of pillowlavas and pillow breccia, overlain by hyaloclatic tuff (Jones, 1970).This complex belongs to a group of subglacial volcanic structuresthat form five 30 km long ridges parallel to the rift.
The youngest formations are the Holocene lava flows. TheThingvellir area is filled in by tholeiitic lavas with olivine. Sintonet al. (2005) have distinguished three postglacial lava flows:10200–9000 years old (14C age, Walker, 1971), 9000–6000 years oldand under 6000 years (Saemundsson, 1992; Sinton et al., 2005). Indetail, Sinton et al. (2005) identified several volcanic unitsincluding the Elbogir unit (ebh), the Brunnar unit (bsh), the Gja-bakkahraun unit (gbh) and the Thingvallahraun unit (tvh) withina 10200–9000 years old group; the Skjaldbreidur units (sk I and skII) in a 9000–6000 years old group and the 3600 years old Thjo-faraun unit (tfh). The Skjaldbreidur units form Icelandic charac-teristic lava shields (Tryggvason, 1943; Walker, 1965a; Rossi, 1996;Rossi and Sigvaldason, 1996; Gudmundsson et al., 2000) (Fig. 1).The tfh unit crossed the narrow valley limited by glacial ridges tothe East, before spreading into the TFS as a spectacular lava flowthat covers the sk I–II and ebh unit and the large faults Sodulholagjaand Hlidargja (Fig. 1). The tfh unit is formed from the eruptivefissures in the Hrafnabjorg-Kalfstindar complex.
2.2. Fracture patterns
Among all brittle structures visible at the surface in the TFS,fissures are most numerous along the fault zones and commonlyform dense sets near fault tips. Their length distribution can beapproximated by a least-square fitted power function (Gud-mundsson, 1987b). In the TFS, fissure azimuths range betweenN30�E and N60�E, forming an ‘‘en echelon’’ configuration (Acocella
ent lava fields (‘‘Hol’’ for Holocene) and older ones (‘‘Ple’’ for Pleistocene). Mjoafellagja,glacial morphology. The Mjoafellagja normal fault shows abrupt difference in offsetleistocene movement about ten times larger than the late Holocene one. (b) Schematicistocene (lower black layer) and Holocene (upper black layer) formations. The depths
g in active oceanic rift: Surface expression, distribution and..., Struct.

L. Sonnette et al. / Journal of Structural Geology xxx (2010) 1–164
ARTICLE IN PRESS
et al., 2000; Grant and Kattenhorn, 2004) already observed in someother fissure swarms (Gudmundsson, 1992; Angelier et al., 1997;Dauteuil et al., 2001). This ‘‘en echelon’’ configuration is highlightedby the 15�–45� clockwise deviation of fissure trend with respect tothe N15�E average direction perpendicular to N105�E plate relativemotion, (Dauteuil et al., 2001).
The Thingvellir rift shows two contrasting types of fault scarps,Pleistocene and Holocene in age. The Pleistocene normal faults showvertical throws of several tens of metres or more and bound tiltedblocks. The corresponding fault scarps partly result from differentialerosion and the crest of the faulted blocks form eroded mountains(Saemundsson,1992; Sinton et al., 2005). These faults dip 55�–60� onaverage, as calculated from the topographic shape of the fault traces.Outside the rift zone, in Pleistocene areas, outcrops in deeply erodedlava pile clearly reveal 60�–70� dipping normal faults (Gudmundsson,1992). In the non-eroded domains of the North Iceland rift, this 60�–70� dip value has been confirmed by the analysis of geometricalrelationships between vertical offsets and horizontal, fault-perpen-dicular dilation (Angelier et al.,1997). The Holocene faults are smallerwith steeper dips (Gudmundsson, 1992), and pluri-metric verticalthrows (Fig. 2). Their scarps directly result from fault movements inthe absence of significant erosion. However, the height of the scarpmay be smaller than the tectonic offset where lava flows accumulatein the hangingwall. Usually the tilted blocks bounded by normal faultsform an asymmetrical graben structure with a single major fault andsmaller antithetic faults (Gudmundsson, 1987b; Angelier et al., 1997;Dauteuil et al., 2001). Thus, Almannagja is a major fault with a throwof 28 m as suggested by the vertical offset between the easternhangingwall and the western footwall. Sledaasgja, Gildrulholtsagja,Hrafnagja and Heidargja deserve consideration as smaller antitheticfaults (Gudmundsson, 1987b).
Many Holocene faults show a particular geometry, with a talus-like slope along the fault in the hangingwall. This structure isa monocline (Fig. 3), as shown by the slope-parallel dip in the lavaflow. In the Thingvellir Fissure Swarm, almost all Holocene faultsshow such a monocline, except for Gildrulholtsagjaa, Heidargja andSledaasgja (Fig. 1 and Gudmundsson, 2005). Saemundsson (1965)and Tryggvason (1974) measured the vertical throw from the baseof monocline to the top of the hangingwall. At first sight, thesemonoclines resemble to blocks collapsed and tilted along the fault.Grant and Kattenhorn (2004) have proposed a mechanical model toexplain the monocline and the ‘‘en echelon’’ fractures. Theyconsidered an upward growth model and a right-lateral obliquemotion on the subsurface fault. In this paper we propose anotherinterpretation of such monocline considering the repeated over-lapping of the fissure swarm by Holocene lava flows.
In the TFS, normal faults are nearly vertical within a section offew tens of metres below the surface. Out of the present-day rift,
Fig. 3. Oblique aerial photograph (taken from helicopter) showing a typical fault scarp withroad indicates the scale.
Please cite this article in press as: Sonnette, L., et al., Faulting and fissurinGeol. (2010), doi:10.1016/j.jsg.2010.01.003
many outcrops provide access to levels that were buried at severalhundred metres when faults were active: the geological observa-tion takes advantage of the incision of the lava pile by glacialvalleys. In these outcrops, the ancient normal faults of the riftexhibit dips between 60� and 70� (Gudmundsson, 1992). Thiscomparison shows that the dip angle of a typical normal faultincreases near the surface, a difference accommodated by blocktilting and near-surface fissure opening. Angelier et al. (1997)calculated the fault dip at depth from throw and aperturemeasurements of the faults at the surface. On average, the uppertensile fissure level represents the uppermost, 500 m thick sectionof the crust, whereas the level dominated by normal faults isbelieved to develop down to depths of about 3 km (Gudmundssonand Backstrom, 1991; Gudmundsson, 1992).
In terms of fracture nucleation, different fault developmenttypes can be considered. Using the Griffith criterion (Griffith, 1924;Jaegger and Cook, 1969), Gudmundsson (1992) proposed twomodels for normal fault formation: (a) development from a tensionfracture that reaches a critical depth; or (b) origin at depth of atleast 1.5 km or more on sets of inclined joints that link together. Inthis latter mechanism the fault may propagate in all directions fromits point of origin. In contrast, regarding the succession of volcanicand tectonic events, the fissure swarm is regularly overlapped bylava flows and the development of a new fissure swarm would becontrolled by pre-existing fractures; therefore faults would prop-agate from the depth towards the surface, as proposed on theKilauea Island (Mc Donald, 1957; Duffield, 1975; Peacock and Par-fitt, 2002; Martel and Langley, 2006). Whether faults are newlyformed or inherited is thus a crucial aspect, which will be consid-ered in the next sections.
3. Fault characteristics
3.1. Detailed mapping of faults
To analyse the faults in terms of number, length, density andposition in the Thingvellir Fissure Swarm, we combined aerialphotographs and GPS mapping. We used 15 aerial photographs ata scale of about 1:25,000 obtained from and digitized by Land-mælingar Islands (the Iceland Geodetic Survey), covering an area ofapproximately 20 km2. The main two mapping stages involvebuilding of (i) a mosaic of aerial photographs, and (ii) a stereoscopicanalysis of photographic pairs.
Regarding the mosaic, the ErMapper� software was used tospatially register and rectify the photographs using both GroundControl Points (GCP) and a Digital Elevation Model (DEM) of thearea at a resolution of one point each 90 m. The coordinates of GCPhave been measured using GPS dual frequency receivers and a rapid
its characteristic monocline slab: northern part of the Almannagja fault. The 5 m wide
g in active oceanic rift: Surface expression, distribution and..., Struct.
L. Sonnette et al. / Journal of Structural Geology xxx (2010) 1–16 5
ARTICLE IN PRESS
static technique. GPS data were analysed using the Ashtech OfficeSuite Software. The calculated errors averaged 3 cm (horizontal)and 8 cm (vertical). Following the ortho-rectification of eachphotograph, a mosaic was built for the whole study area (Fig. 1). Theresulting mosaic served as a support to map the fractures traces,which was done using Autocad Map�.
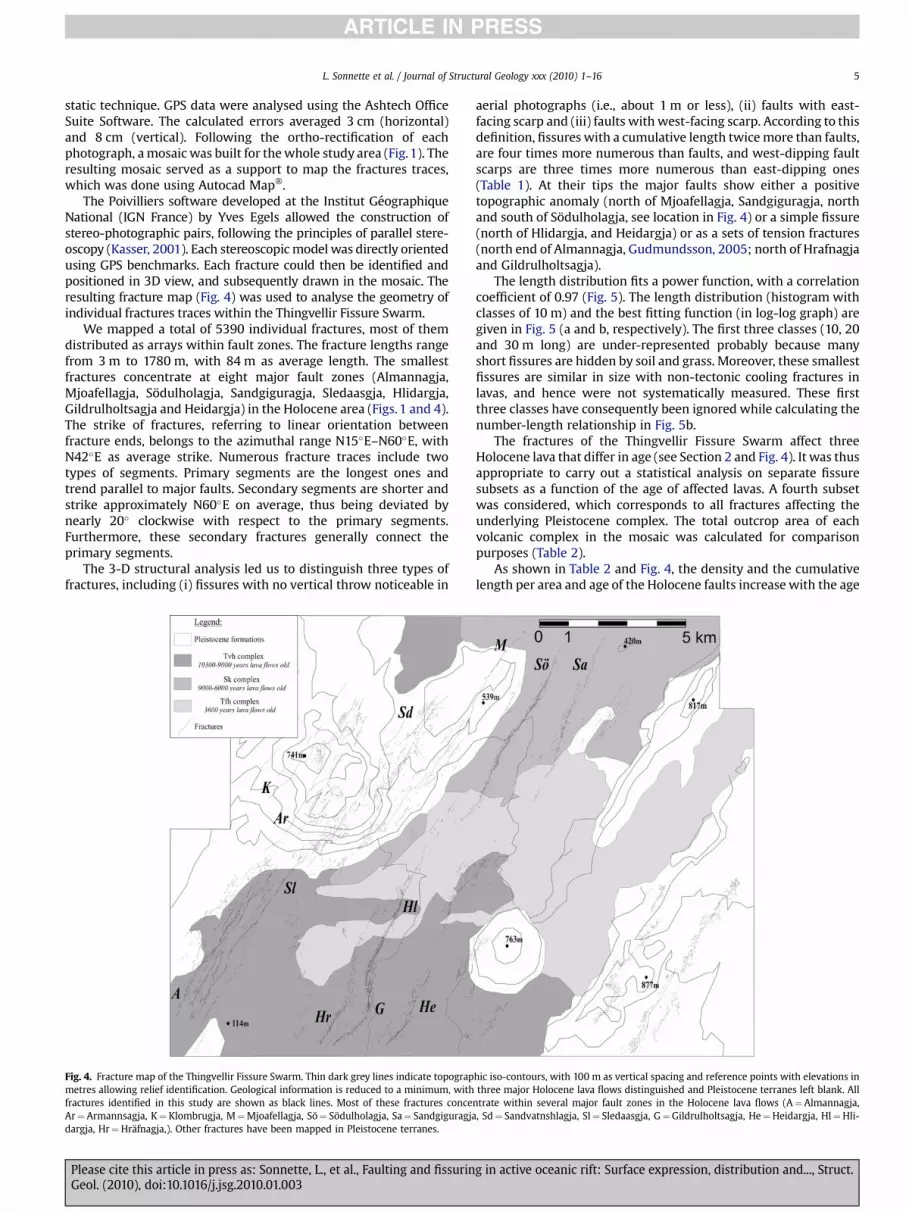
The Poivilliers software developed at the Institut GeographiqueNational (IGN France) by Yves Egels allowed the construction ofstereo-photographic pairs, following the principles of parallel stere-oscopy (Kasser, 2001). Each stereoscopic model was directly orientedusing GPS benchmarks. Each fracture could then be identified andpositioned in 3D view, and subsequently drawn in the mosaic. Theresulting fracture map (Fig. 4) was used to analyse the geometry ofindividual fractures traces within the Thingvellir Fissure Swarm.
We mapped a total of 5390 individual fractures, most of themdistributed as arrays within fault zones. The fracture lengths rangefrom 3 m to 1780 m, with 84 m as average length. The smallestfractures concentrate at eight major fault zones (Almannagja,Mjoafellagja, Sodulholagja, Sandgiguragja, Sledaasgja, Hlidargja,Gildrulholtsagja and Heidargja) in the Holocene area (Figs. 1 and 4).The strike of fractures, referring to linear orientation betweenfracture ends, belongs to the azimuthal range N15�E–N60�E, withN42�E as average strike. Numerous fracture traces include twotypes of segments. Primary segments are the longest ones andtrend parallel to major faults. Secondary segments are shorter andstrike approximately N60�E on average, thus being deviated bynearly 20� clockwise with respect to the primary segments.Furthermore, these secondary fractures generally connect theprimary segments.
The 3-D structural analysis led us to distinguish three types offractures, including (i) fissures with no vertical throw noticeable in
Fig. 4. Fracture map of the Thingvellir Fissure Swarm. Thin dark grey lines indicate topograpmetres allowing relief identification. Geological information is reduced to a minimum, withfractures identified in this study are shown as black lines. Most of these fractures conceAr¼ Armannsagja, K¼ Klombrugja, M¼Mjoafellagja, So¼ Sodulholagja, Sa¼ Sandgiguragjadargja, Hr¼Hrafnagja,). Other fractures have been mapped in Pleistocene terranes.
Please cite this article in press as: Sonnette, L., et al., Faulting and fissurinGeol. (2010), doi:10.1016/j.jsg.2010.01.003
aerial photographs (i.e., about 1 m or less), (ii) faults with east-facing scarp and (iii) faults with west-facing scarp. According to thisdefinition, fissures with a cumulative length twice more than faults,are four times more numerous than faults, and west-dipping faultscarps are three times more numerous than east-dipping ones(Table 1). At their tips the major faults show either a positivetopographic anomaly (north of Mjoafellagja, Sandgiguragja, northand south of Sodulholagja, see location in Fig. 4) or a simple fissure(north of Hlidargja, and Heidargja) or as a sets of tension fractures(north end of Almannagja, Gudmundsson, 2005; north of Hrafnagjaand Gildrulholtsagja).
The length distribution fits a power function, with a correlationcoefficient of 0.97 (Fig. 5). The length distribution (histogram withclasses of 10 m) and the best fitting function (in log-log graph) aregiven in Fig. 5 (a and b, respectively). The first three classes (10, 20and 30 m long) are under-represented probably because manyshort fissures are hidden by soil and grass. Moreover, these smallestfissures are similar in size with non-tectonic cooling fractures inlavas, and hence were not systematically measured. These firstthree classes have consequently been ignored while calculating thenumber-length relationship in Fig. 5b.
The fractures of the Thingvellir Fissure Swarm affect threeHolocene lava that differ in age (see Section 2 and Fig. 4). It was thusappropriate to carry out a statistical analysis on separate fissuresubsets as a function of the age of affected lavas. A fourth subsetwas considered, which corresponds to all fractures affecting theunderlying Pleistocene complex. The total outcrop area of eachvolcanic complex in the mosaic was calculated for comparisonpurposes (Table 2).
As shown in Table 2 and Fig. 4, the density and the cumulativelength per area and age of the Holocene faults increase with the age
hic iso-contours, with 100 m as vertical spacing and reference points with elevations inthree major Holocene lava flows distinguished and Pleistocene terranes left blank. All
ntrate within several major fault zones in the Holocene lava flows (A¼ Almannagja,, Sd¼ Sandvatnshlagja, Sl¼ Sledaasgja, G¼Gildrulholtsagja, He¼Heidargja, Hl¼Hli-
g in active oceanic rift: Surface expression, distribution and..., Struct.
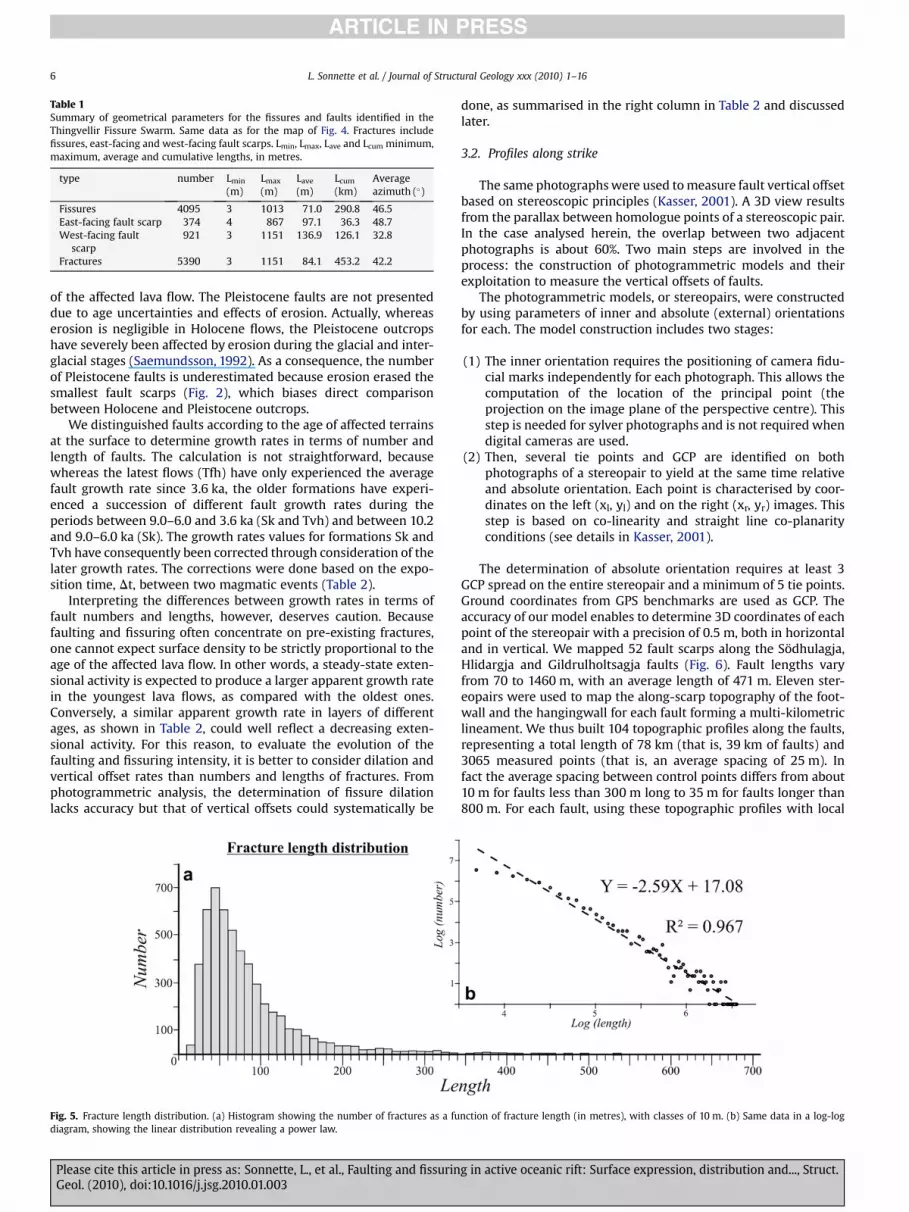
Table 1Summary of geometrical parameters for the fissures and faults identified in theThingvellir Fissure Swarm. Same data as for the map of Fig. 4. Fractures includefissures, east-facing and west-facing fault scarps. Lmin, Lmax, Lave and Lcum minimum,maximum, average and cumulative lengths, in metres.
type number Lmin
(m)Lmax
(m)Lave
(m)Lcum
(km)Averageazimuth (�)
Fissures 4095 3 1013 71.0 290.8 46.5East-facing fault scarp 374 4 867 97.1 36.3 48.7West-facing fault
scarp921 3 1151 136.9 126.1 32.8
Fractures 5390 3 1151 84.1 453.2 42.2
L. Sonnette et al. / Journal of Structural Geology xxx (2010) 1–166
ARTICLE IN PRESS
of the affected lava flow. The Pleistocene faults are not presenteddue to age uncertainties and effects of erosion. Actually, whereaserosion is negligible in Holocene flows, the Pleistocene outcropshave severely been affected by erosion during the glacial and inter-glacial stages (Saemundsson, 1992). As a consequence, the numberof Pleistocene faults is underestimated because erosion erased thesmallest fault scarps (Fig. 2), which biases direct comparisonbetween Holocene and Pleistocene outcrops.
We distinguished faults according to the age of affected terrainsat the surface to determine growth rates in terms of number andlength of faults. The calculation is not straightforward, becausewhereas the latest flows (Tfh) have only experienced the averagefault growth rate since 3.6 ka, the older formations have experi-enced a succession of different fault growth rates during theperiods between 9.0–6.0 and 3.6 ka (Sk and Tvh) and between 10.2and 9.0–6.0 ka (Sk). The growth rates values for formations Sk andTvh have consequently been corrected through consideration of thelater growth rates. The corrections were done based on the expo-sition time, Dt, between two magmatic events (Table 2).
Interpreting the differences between growth rates in terms offault numbers and lengths, however, deserves caution. Becausefaulting and fissuring often concentrate on pre-existing fractures,one cannot expect surface density to be strictly proportional to theage of the affected lava flow. In other words, a steady-state exten-sional activity is expected to produce a larger apparent growth ratein the youngest lava flows, as compared with the oldest ones.Conversely, a similar apparent growth rate in layers of differentages, as shown in Table 2, could well reflect a decreasing exten-sional activity. For this reason, to evaluate the evolution of thefaulting and fissuring intensity, it is better to consider dilation andvertical offset rates than numbers and lengths of fractures. Fromphotogrammetric analysis, the determination of fissure dilationlacks accuracy but that of vertical offsets could systematically be
Fig. 5. Fracture length distribution. (a) Histogram showing the number of fractures as a fudiagram, showing the linear distribution revealing a power law.
Please cite this article in press as: Sonnette, L., et al., Faulting and fissurinGeol. (2010), doi:10.1016/j.jsg.2010.01.003
done, as summarised in the right column in Table 2 and discussedlater.
3.2. Profiles along strike
The same photographs were used to measure fault vertical offsetbased on stereoscopic principles (Kasser, 2001). A 3D view resultsfrom the parallax between homologue points of a stereoscopic pair.In the case analysed herein, the overlap between two adjacentphotographs is about 60%. Two main steps are involved in theprocess: the construction of photogrammetric models and theirexploitation to measure the vertical offsets of faults.
The photogrammetric models, or stereopairs, were constructedby using parameters of inner and absolute (external) orientationsfor each. The model construction includes two stages:
(1) The inner orientation requires the positioning of camera fidu-cial marks independently for each photograph. This allows thecomputation of the location of the principal point (theprojection on the image plane of the perspective centre). Thisstep is needed for sylver photographs and is not required whendigital cameras are used.
(2) Then, several tie points and GCP are identified on bothphotographs of a stereopair to yield at the same time relativeand absolute orientation. Each point is characterised by coor-dinates on the left (xl, yl) and on the right (xr, yr) images. Thisstep is based on co-linearity and straight line co-planarityconditions (see details in Kasser, 2001).
The determination of absolute orientation requires at least 3GCP spread on the entire stereopair and a minimum of 5 tie points.Ground coordinates from GPS benchmarks are used as GCP. Theaccuracy of our model enables to determine 3D coordinates of eachpoint of the stereopair with a precision of 0.5 m, both in horizontaland in vertical. We mapped 52 fault scarps along the Sodhulagja,Hlidargja and Gildrulholtsagja faults (Fig. 6). Fault lengths varyfrom 70 to 1460 m, with an average length of 471 m. Eleven ster-eopairs were used to map the along-scarp topography of the foot-wall and the hangingwall for each fault forming a multi-kilometriclineament. We thus built 104 topographic profiles along the faults,representing a total length of 78 km (that is, 39 km of faults) and3065 measured points (that is, an average spacing of 25 m). Infact the average spacing between control points differs from about10 m for faults less than 300 m long to 35 m for faults longer than800 m. For each fault, using these topographic profiles with local
nction of fracture length (in metres), with classes of 10 m. (b) Same data in a log-log
g in active oceanic rift: Surface expression, distribution and..., Struct.
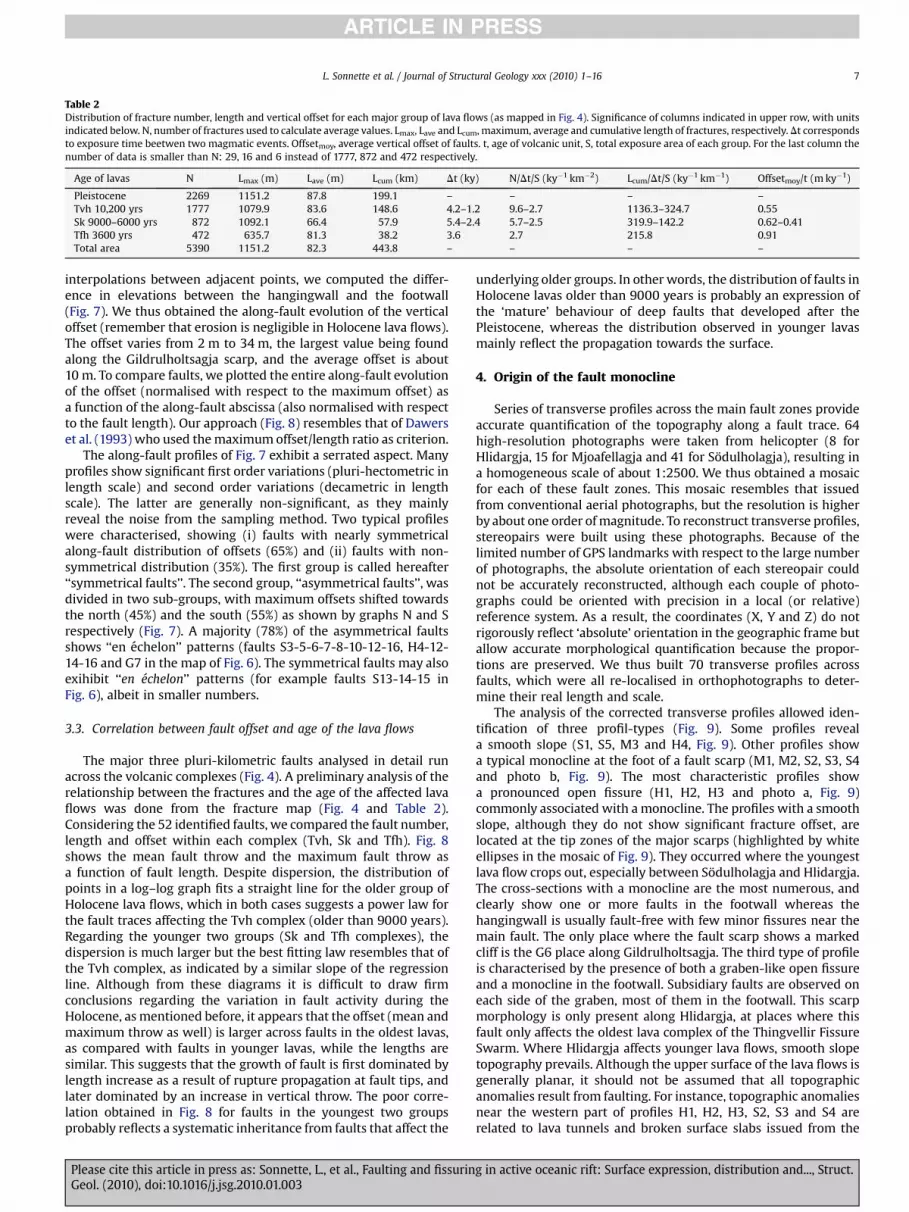
Table 2Distribution of fracture number, length and vertical offset for each major group of lava flows (as mapped in Fig. 4). Significance of columns indicated in upper row, with unitsindicated below. N, number of fractures used to calculate average values. Lmax, Lave and Lcum, maximum, average and cumulative length of fractures, respectively. Dt correspondsto exposure time beetwen two magmatic events. Offsetmoy, average vertical offset of faults. t, age of volcanic unit, S, total exposure area of each group. For the last column thenumber of data is smaller than N: 29, 16 and 6 instead of 1777, 872 and 472 respectively.
Age of lavas N Lmax (m) Lave (m) Lcum (km) Dt (ky) N/Dt/S (ky�1 km�2) Lcum/Dt/S (ky�1 km�1) Offsetmoy/t (m ky�1)
Pleistocene 2269 1151.2 87.8 199.1 – – – –Tvh 10,200 yrs 1777 1079.9 83.6 148.6 4.2–1.2 9.6–2.7 1136.3–324.7 0.55Sk 9000–6000 yrs 872 1092.1 66.4 57.9 5.4–2.4 5.7–2.5 319.9–142.2 0.62–0.41Tfh 3600 yrs 472 635.7 81.3 38.2 3.6 2.7 215.8 0.91Total area 5390 1151.2 82.3 443.8 – – – –
L. Sonnette et al. / Journal of Structural Geology xxx (2010) 1–16 7
ARTICLE IN PRESS
interpolations between adjacent points, we computed the differ-ence in elevations between the hangingwall and the footwall(Fig. 7). We thus obtained the along-fault evolution of the verticaloffset (remember that erosion is negligible in Holocene lava flows).The offset varies from 2 m to 34 m, the largest value being foundalong the Gildrulholtsagja scarp, and the average offset is about10 m. To compare faults, we plotted the entire along-fault evolutionof the offset (normalised with respect to the maximum offset) asa function of the along-fault abscissa (also normalised with respectto the fault length). Our approach (Fig. 8) resembles that of Dawerset al. (1993) who used the maximum offset/length ratio as criterion.
The along-fault profiles of Fig. 7 exhibit a serrated aspect. Manyprofiles show significant first order variations (pluri-hectometric inlength scale) and second order variations (decametric in lengthscale). The latter are generally non-significant, as they mainlyreveal the noise from the sampling method. Two typical profileswere characterised, showing (i) faults with nearly symmetricalalong-fault distribution of offsets (65%) and (ii) faults with non-symmetrical distribution (35%). The first group is called hereafter‘‘symmetrical faults’’. The second group, ‘‘asymmetrical faults’’, wasdivided in two sub-groups, with maximum offsets shifted towardsthe north (45%) and the south (55%) as shown by graphs N and Srespectively (Fig. 7). A majority (78%) of the asymmetrical faultsshows ‘‘en echelon’’ patterns (faults S3-5-6-7-8-10-12-16, H4-12-14-16 and G7 in the map of Fig. 6). The symmetrical faults may alsoexihibit ‘‘en echelon’’ patterns (for example faults S13-14-15 inFig. 6), albeit in smaller numbers.
3.3. Correlation between fault offset and age of the lava flows
The major three pluri-kilometric faults analysed in detail runacross the volcanic complexes (Fig. 4). A preliminary analysis of therelationship between the fractures and the age of the affected lavaflows was done from the fracture map (Fig. 4 and Table 2).Considering the 52 identified faults, we compared the fault number,length and offset within each complex (Tvh, Sk and Tfh). Fig. 8shows the mean fault throw and the maximum fault throw asa function of fault length. Despite dispersion, the distribution ofpoints in a log–log graph fits a straight line for the older group ofHolocene lava flows, which in both cases suggests a power law forthe fault traces affecting the Tvh complex (older than 9000 years).Regarding the younger two groups (Sk and Tfh complexes), thedispersion is much larger but the best fitting law resembles that ofthe Tvh complex, as indicated by a similar slope of the regressionline. Although from these diagrams it is difficult to draw firmconclusions regarding the variation in fault activity during theHolocene, as mentioned before, it appears that the offset (mean andmaximum throw as well) is larger across faults in the oldest lavas,as compared with faults in younger lavas, while the lengths aresimilar. This suggests that the growth of fault is first dominated bylength increase as a result of rupture propagation at fault tips, andlater dominated by an increase in vertical throw. The poor corre-lation obtained in Fig. 8 for faults in the youngest two groupsprobably reflects a systematic inheritance from faults that affect the
Please cite this article in press as: Sonnette, L., et al., Faulting and fissurinGeol. (2010), doi:10.1016/j.jsg.2010.01.003
underlying older groups. In other words, the distribution of faults inHolocene lavas older than 9000 years is probably an expression ofthe ‘mature’ behaviour of deep faults that developed after thePleistocene, whereas the distribution observed in younger lavasmainly reflect the propagation towards the surface.
4. Origin of the fault monocline
Series of transverse profiles across the main fault zones provideaccurate quantification of the topography along a fault trace. 64high-resolution photographs were taken from helicopter (8 forHlidargja, 15 for Mjoafellagja and 41 for Sodulholagja), resulting ina homogeneous scale of about 1:2500. We thus obtained a mosaicfor each of these fault zones. This mosaic resembles that issuedfrom conventional aerial photographs, but the resolution is higherby about one order of magnitude. To reconstruct transverse profiles,stereopairs were built using these photographs. Because of thelimited number of GPS landmarks with respect to the large numberof photographs, the absolute orientation of each stereopair couldnot be accurately reconstructed, although each couple of photo-graphs could be oriented with precision in a local (or relative)reference system. As a result, the coordinates (X, Y and Z) do notrigorously reflect ‘absolute’ orientation in the geographic frame butallow accurate morphological quantification because the propor-tions are preserved. We thus built 70 transverse profiles acrossfaults, which were all re-localised in orthophotographs to deter-mine their real length and scale.
The analysis of the corrected transverse profiles allowed iden-tification of three profil-types (Fig. 9). Some profiles reveala smooth slope (S1, S5, M3 and H4, Fig. 9). Other profiles showa typical monocline at the foot of a fault scarp (M1, M2, S2, S3, S4and photo b, Fig. 9). The most characteristic profiles showa pronounced open fissure (H1, H2, H3 and photo a, Fig. 9)commonly associated with a monocline. The profiles with a smoothslope, although they do not show significant fracture offset, arelocated at the tip zones of the major scarps (highlighted by whiteellipses in the mosaic of Fig. 9). They occurred where the youngestlava flow crops out, especially between Sodulholagja and Hlidargja.The cross-sections with a monocline are the most numerous, andclearly show one or more faults in the footwall whereas thehangingwall is usually fault-free with few minor fissures near themain fault. The only place where the fault scarp shows a markedcliff is the G6 place along Gildrulholtsagja. The third type of profileis characterised by the presence of both a graben-like open fissureand a monocline in the footwall. Subsidiary faults are observed oneach side of the graben, most of them in the footwall. This scarpmorphology is only present along Hlidargja, at places where thisfault only affects the oldest lava complex of the Thingvellir FissureSwarm. Where Hlidargja affects younger lava flows, smooth slopetopography prevails. Although the upper surface of the lava flows isgenerally planar, it should not be assumed that all topographicanomalies result from faulting. For instance, topographic anomaliesnear the western part of profiles H1, H2, H3, S2, S3 and S4 arerelated to lava tunnels and broken surface slabs issued from the
g in active oceanic rift: Surface expression, distribution and..., Struct.

Fig. 6. Location of the faults analysed in detail. In the map, the names in white letters refer to the main fault zones. The symbols such as S3 or G14 are also used in next figures. Threesets of superimposed along-fault profiles are shown in normalised graphs of vertical offset as a function of abscissa: symmetrical faults (graph C), and asymmetrical faults withmaximum offset shifted towards the north and the south (graphs N and S respectively). Thick solid lines refer to average vertical offset, thick dashed lines refer to average verticaloffset� standard deviation. Details in text.
L. Sonnette et al. / Journal of Structural Geology xxx (2010) 1–168
ARTICLE IN PRESS
flowing process itself. Such volcanic asperities can be as high assome fault scarps.
5. Discussion
5.1. Distribution and physical properties of faults and fissures
Analysing swarm of fissures and faults according to size-frequency distribution is a well-known procedure. In a wide rangeof tectonic settings where faults cover a large range of dimensionsthe size-frequency distribution follows a power law distribution
Please cite this article in press as: Sonnette, L., et al., Faulting and fissurinGeol. (2010), doi:10.1016/j.jsg.2010.01.003
(Shaw and Gartner, 1986; Gudmundsson, 1987a,b; Villemin andSunwoo, 1987; Main et al., 1990; Scholz and Cowie, 1990; Scholtzet al., 1993; Davy, 1993; Villemin et al., 1995; Hardacre and Cowie,2003). The value of the exponent decreases with increasing strain(Sornette et al., 1993). Our analysis of fracture patterns in theThingvellir rift segment reveals similar physical property-relatedtrends (Section 3), as the distribution of fractures well fits a powerlaw (Fig. 5). This behaviour suggests that fracture nucleation andlinkage (Filbrandt et al., 1994; Cladouhos and Marret, 1996; Mans-field and Cartwright, 2001) control the evolution of the fissureswarm.
g in active oceanic rift: Surface expression, distribution and..., Struct.
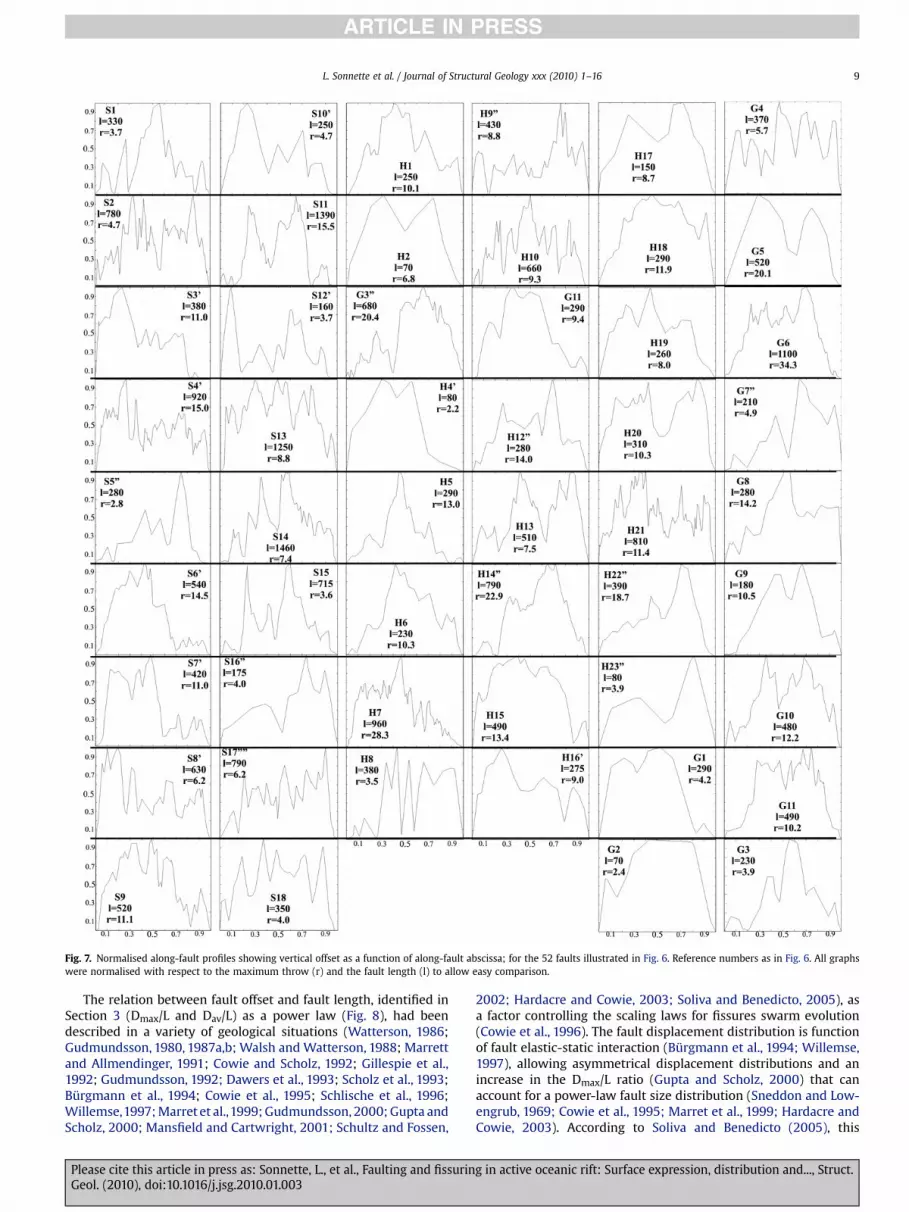
Fig. 7. Normalised along-fault profiles showing vertical offset as a function of along-fault abscissa; for the 52 faults illustrated in Fig. 6. Reference numbers as in Fig. 6. All graphswere normalised with respect to the maximum throw (r) and the fault length (l) to allow easy comparison.
L. Sonnette et al. / Journal of Structural Geology xxx (2010) 1–16 9
ARTICLE IN PRESS
The relation between fault offset and fault length, identified inSection 3 (Dmax/L and Dav/L) as a power law (Fig. 8), had beendescribed in a variety of geological situations (Watterson, 1986;Gudmundsson, 1980, 1987a,b; Walsh and Watterson, 1988; Marrettand Allmendinger, 1991; Cowie and Scholz, 1992; Gillespie et al.,1992; Gudmundsson, 1992; Dawers et al., 1993; Scholz et al., 1993;Burgmann et al., 1994; Cowie et al., 1995; Schlische et al., 1996;Willemse,1997; Marret et al.,1999; Gudmundsson, 2000; Gupta andScholz, 2000; Mansfield and Cartwright, 2001; Schultz and Fossen,
Please cite this article in press as: Sonnette, L., et al., Faulting and fissurinGeol. (2010), doi:10.1016/j.jsg.2010.01.003
2002; Hardacre and Cowie, 2003; Soliva and Benedicto, 2005), asa factor controlling the scaling laws for fissures swarm evolution(Cowie et al., 1996). The fault displacement distribution is functionof fault elastic-static interaction (Burgmann et al., 1994; Willemse,1997), allowing asymmetrical displacement distributions and anincrease in the Dmax/L ratio (Gupta and Scholz, 2000) that canaccount for a power-law fault size distribution (Sneddon and Low-engrub, 1969; Cowie et al., 1995; Marret et al., 1999; Hardacre andCowie, 2003). According to Soliva and Benedicto (2005), this
g in active oceanic rift: Surface expression, distribution and..., Struct.
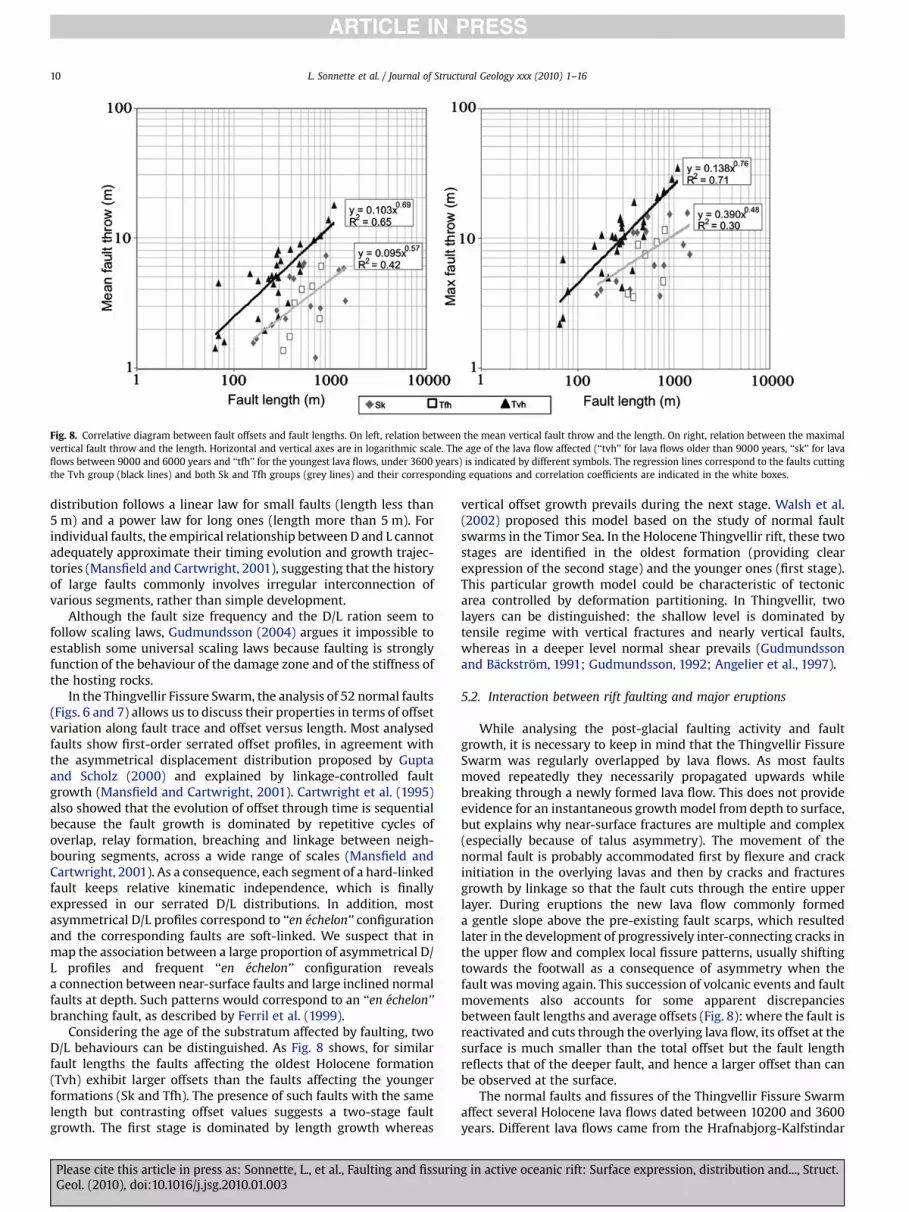
Fig. 8. Correlative diagram between fault offsets and fault lengths. On left, relation between the mean vertical fault throw and the length. On right, relation between the maximalvertical fault throw and the length. Horizontal and vertical axes are in logarithmic scale. The age of the lava flow affected (‘‘tvh’’ for lava flows older than 9000 years, ‘‘sk’’ for lavaflows between 9000 and 6000 years and ‘‘tfh’’ for the youngest lava flows, under 3600 years) is indicated by different symbols. The regression lines correspond to the faults cuttingthe Tvh group (black lines) and both Sk and Tfh groups (grey lines) and their corresponding equations and correlation coefficients are indicated in the white boxes.
L. Sonnette et al. / Journal of Structural Geology xxx (2010) 1–1610
ARTICLE IN PRESS
distribution follows a linear law for small faults (length less than5 m) and a power law for long ones (length more than 5 m). Forindividual faults, the empirical relationship between D and L cannotadequately approximate their timing evolution and growth trajec-tories (Mansfield and Cartwright, 2001), suggesting that the historyof large faults commonly involves irregular interconnection ofvarious segments, rather than simple development.
Although the fault size frequency and the D/L ration seem tofollow scaling laws, Gudmundsson (2004) argues it impossible toestablish some universal scaling laws because faulting is stronglyfunction of the behaviour of the damage zone and of the stiffness ofthe hosting rocks.
In the Thingvellir Fissure Swarm, the analysis of 52 normal faults(Figs. 6 and 7) allows us to discuss their properties in terms of offsetvariation along fault trace and offset versus length. Most analysedfaults show first-order serrated offset profiles, in agreement withthe asymmetrical displacement distribution proposed by Guptaand Scholz (2000) and explained by linkage-controlled faultgrowth (Mansfield and Cartwright, 2001). Cartwright et al. (1995)also showed that the evolution of offset through time is sequentialbecause the fault growth is dominated by repetitive cycles ofoverlap, relay formation, breaching and linkage between neigh-bouring segments, across a wide range of scales (Mansfield andCartwright, 2001). As a consequence, each segment of a hard-linkedfault keeps relative kinematic independence, which is finallyexpressed in our serrated D/L distributions. In addition, mostasymmetrical D/L profiles correspond to ‘‘en echelon’’ configurationand the corresponding faults are soft-linked. We suspect that inmap the association between a large proportion of asymmetrical D/L profiles and frequent ‘‘en echelon’’ configuration revealsa connection between near-surface faults and large inclined normalfaults at depth. Such patterns would correspond to an ‘‘en echelon’’branching fault, as described by Ferril et al. (1999).
Considering the age of the substratum affected by faulting, twoD/L behaviours can be distinguished. As Fig. 8 shows, for similarfault lengths the faults affecting the oldest Holocene formation(Tvh) exhibit larger offsets than the faults affecting the youngerformations (Sk and Tfh). The presence of such faults with the samelength but contrasting offset values suggests a two-stage faultgrowth. The first stage is dominated by length growth whereas
Please cite this article in press as: Sonnette, L., et al., Faulting and fissurinGeol. (2010), doi:10.1016/j.jsg.2010.01.003
vertical offset growth prevails during the next stage. Walsh et al.(2002) proposed this model based on the study of normal faultswarms in the Timor Sea. In the Holocene Thingvellir rift, these twostages are identified in the oldest formation (providing clearexpression of the second stage) and the younger ones (first stage).This particular growth model could be characteristic of tectonicarea controlled by deformation partitioning. In Thingvellir, twolayers can be distinguished: the shallow level is dominated bytensile regime with vertical fractures and nearly vertical faults,whereas in a deeper level normal shear prevails (Gudmundssonand Backstrom, 1991; Gudmundsson, 1992; Angelier et al., 1997).
5.2. Interaction between rift faulting and major eruptions
While analysing the post-glacial faulting activity and faultgrowth, it is necessary to keep in mind that the Thingvellir FissureSwarm was regularly overlapped by lava flows. As most faultsmoved repeatedly they necessarily propagated upwards whilebreaking through a newly formed lava flow. This does not provideevidence for an instantaneous growth model from depth to surface,but explains why near-surface fractures are multiple and complex(especially because of talus asymmetry). The movement of thenormal fault is probably accommodated first by flexure and crackinitiation in the overlying lavas and then by cracks and fracturesgrowth by linkage so that the fault cuts through the entire upperlayer. During eruptions the new lava flow commonly formeda gentle slope above the pre-existing fault scarps, which resultedlater in the development of progressively inter-connecting cracks inthe upper flow and complex local fissure patterns, usually shiftingtowards the footwall as a consequence of asymmetry when thefault was moving again. This succession of volcanic events and faultmovements also accounts for some apparent discrepanciesbetween fault lengths and average offsets (Fig. 8): where the fault isreactivated and cuts through the overlying lava flow, its offset at thesurface is much smaller than the total offset but the fault lengthreflects that of the deeper fault, and hence a larger offset than canbe observed at the surface.
The normal faults and fissures of the Thingvellir Fissure Swarmaffect several Holocene lava flows dated between 10200 and 3600years. Different lava flows came from the Hrafnabjorg-Kalfstindar
g in active oceanic rift: Surface expression, distribution and..., Struct.
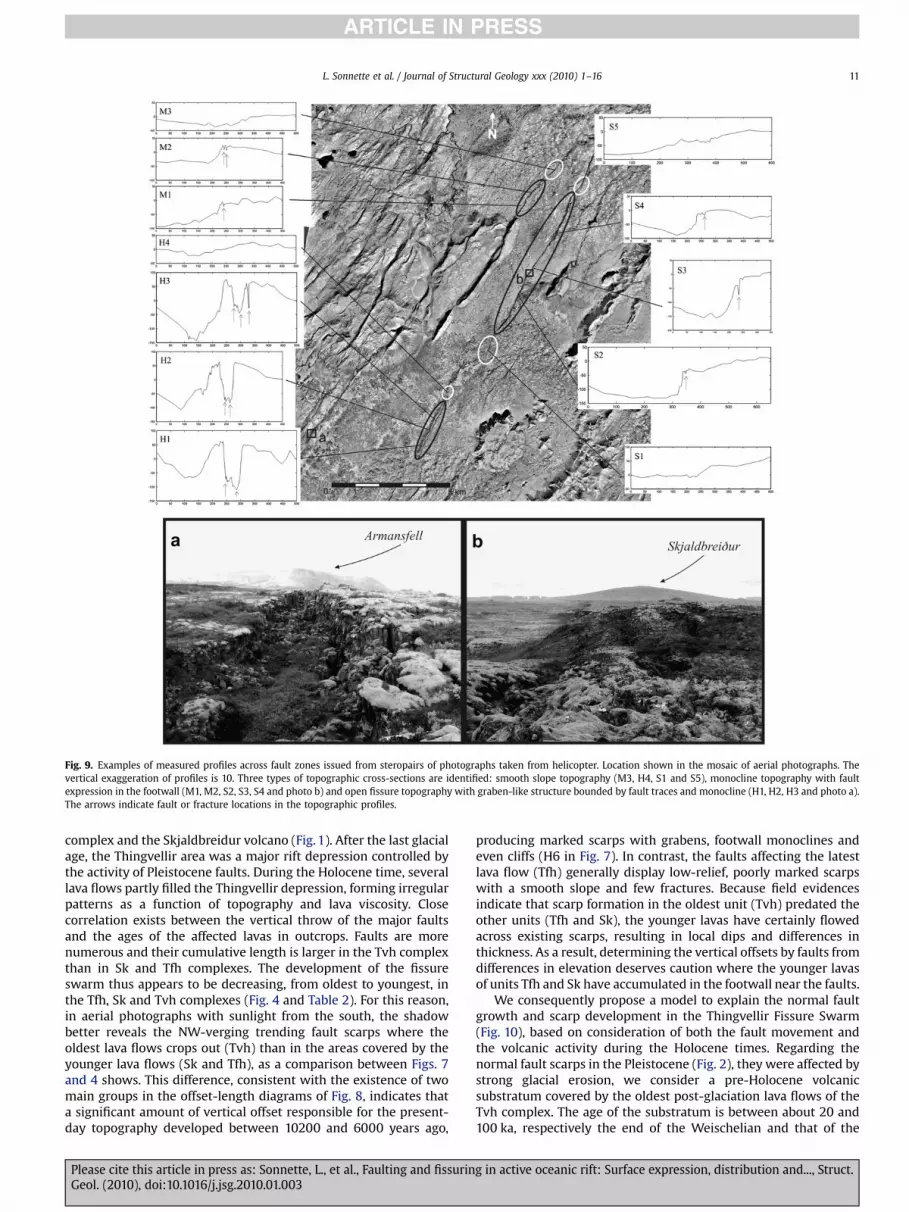
Fig. 9. Examples of measured profiles across fault zones issued from steropairs of photographs taken from helicopter. Location shown in the mosaic of aerial photographs. Thevertical exaggeration of profiles is 10. Three types of topographic cross-sections are identified: smooth slope topography (M3, H4, S1 and S5), monocline topography with faultexpression in the footwall (M1, M2, S2, S3, S4 and photo b) and open fissure topography with graben-like structure bounded by fault traces and monocline (H1, H2, H3 and photo a).The arrows indicate fault or fracture locations in the topographic profiles.
L. Sonnette et al. / Journal of Structural Geology xxx (2010) 1–16 11
ARTICLE IN PRESS
complex and the Skjaldbreidur volcano (Fig. 1). After the last glacialage, the Thingvellir area was a major rift depression controlled bythe activity of Pleistocene faults. During the Holocene time, severallava flows partly filled the Thingvellir depression, forming irregularpatterns as a function of topography and lava viscosity. Closecorrelation exists between the vertical throw of the major faultsand the ages of the affected lavas in outcrops. Faults are morenumerous and their cumulative length is larger in the Tvh complexthan in Sk and Tfh complexes. The development of the fissureswarm thus appears to be decreasing, from oldest to youngest, inthe Tfh, Sk and Tvh complexes (Fig. 4 and Table 2). For this reason,in aerial photographs with sunlight from the south, the shadowbetter reveals the NW-verging trending fault scarps where theoldest lava flows crops out (Tvh) than in the areas covered by theyounger lava flows (Sk and Tfh), as a comparison between Figs. 7and 4 shows. This difference, consistent with the existence of twomain groups in the offset-length diagrams of Fig. 8, indicates thata significant amount of vertical offset responsible for the present-day topography developed between 10200 and 6000 years ago,
Please cite this article in press as: Sonnette, L., et al., Faulting and fissurinGeol. (2010), doi:10.1016/j.jsg.2010.01.003
producing marked scarps with grabens, footwall monoclines andeven cliffs (H6 in Fig. 7). In contrast, the faults affecting the latestlava flow (Tfh) generally display low-relief, poorly marked scarpswith a smooth slope and few fractures. Because field evidencesindicate that scarp formation in the oldest unit (Tvh) predated theother units (Tfh and Sk), the younger lavas have certainly flowedacross existing scarps, resulting in local dips and differences inthickness. As a result, determining the vertical offsets by faults fromdifferences in elevation deserves caution where the younger lavasof units Tfh and Sk have accumulated in the footwall near the faults.
We consequently propose a model to explain the normal faultgrowth and scarp development in the Thingvellir Fissure Swarm(Fig. 10), based on consideration of both the fault movement andthe volcanic activity during the Holocene times. Regarding thenormal fault scarps in the Pleistocene (Fig. 2), they were affected bystrong glacial erosion, we consider a pre-Holocene volcanicsubstratum covered by the oldest post-glaciation lava flows of theTvh complex. The age of the substratum is between about 20 and100 ka, respectively the end of the Weischelian and that of the
g in active oceanic rift: Surface expression, distribution and..., Struct.

L. Sonnette et al. / Journal of Structural Geology xxx (2010) 1–1612
ARTICLE IN PRESS
second glacial stage (Saemundsson, 1992). Then the lava flows ofthe Tvh complex covered the Thingvellir valley (Fig. 4) until theyreached the surrounding reliefs that often correspond to erodedscarps in the Pleistocene. The lava production was large enough tocover minor horsts and grabens and the main eruptive centre waslocated to the northeast. Whether or not the lavas of the oldestHolocene complex (Tvh) have flown above post-glacial fault scarpsthat possibly developed just after glacier retreat is poorly docu-mented from our study. However, normal faulting probably affectedthe Pleistocene basement before, during and after the volcanicactivity of the early Holocene. It has consequently been assumed inFig. 10a that the lava flows at the base of the Tvh complex overlaintopography with fault scarps, and hence probably filled some openfissures and graben-like structures along the major faults. In lavaflows fissures generally propagate along cooling joints.
The next lavas flooded from the Skajaldbreidur volcano (Skcomplex) or came through the valley between the Tinðaskagi andKalfstinðaar mountains (Tfh), into the Thingvellir depression(Fig. 1). These lava flows covered the fault scarps that had devel-oped within the Tvh complex, consistent with the strongerexpression of faults in early Holocene outcrops than in later ones.The lavas also flowed into the largest fissures or grabens (Fig. 10b).As the faults were probably permanently active, fissuring of theselavas soon followed the volcanic activity (Fig. 10b).
Two contrasting situations are illustrated where the lava flowsof the Sk and Tfh units respectively overlie the Tvh complex alongMjoafellagja (Fig. 10c0–d0) and Hlidargja (Fig. 10c–d). In the firstcase, the lava flowing across the fault from the footwall to thehangingwall formed a smooth slope, which was later affected byfissuring and continuing faulting. The monocline in the hanging-wall thus results from both the initial slope of lavas in the pre-existing scarp and the further increase in dip induced by the laterfault movements. The configuration of the monocline thus dependson pre-existing vertical fault offset, volume and viscosity of lavaflows and later fault activity (Fig. 10c0–d0). In the second case, therecent lavas flowed across the fault, also forming a gentle slope, butno or very little fault displacement occurred afterwards, so thatlimited fissure reactivation being left apart the fault was almostsealed by the younger complex (Fig. 10c–d). These two situationshighlight limitations in the analysis of fault offsets based ontopography: the vertical movement that affected the last lava unit issmaller than the topographic offset (Fig. 10c0), and may even benegligible despite significant difference in elevation (Fig. 10d0). Twoproperties of lava flows have implications while determiningoffsets: first, significant contrast in thickness of the same lava flowmay occur across a pre-existing fault scarp and second, the positionof the feeding eruptive centre controls the distribution of lavas withrespect to the scarp orientation. In our case, the lavas of the Skcomplex came from the Skajaldbreidur volcano located northeast ofthe west-verging scarps of Mjoafellagja, Sodulholagja and Sandgi-guragja (Fig. 1), so that the lava flow could cover both the footwalland the hangingwall. Had the lava source been located on theopposite side of these faults, these scarps would have acted asbarriers, as several faults in the Pleistocene had done concerningthe oldest post-glacial lava flows (Tvh).
5.3. Morphology, structure and evolution of rift faults
The chronology of faulting with respect to that of the recordingvolcanic terranes deserves special attention. For instance, thedifference in age between the Tvh complex (10200 yrs to 9000 yrsago) and the Sk lava flows (9000 yrs to 6000 yrs ago) is very small,whereas the 3600 yrs old Tfh lavas formed much later. If a constantaverage velocity of fault movements is assumed, this contrast wellaccounts for the different aspects of fault scarps in Fig. 10 (d’ and d).
Please cite this article in press as: Sonnette, L., et al., Faulting and fissurinGeol. (2010), doi:10.1016/j.jsg.2010.01.003
To summarise, the different fault morphologies observed withinthe Thingvellir Fissure Swarm can be explained by the competitionbetween tectonic and volcanic activities. Monocline topographyand important fault burial are generally observed when themagmatic contribution is more important than the increasing faultoffset. In contrast, cliff topography often prevails where recent lavaflows are absent, thin or restricted to the hangingwall. In theThingvellir Fissure Swarm, monoclines are common along thehangingwall of normal fault scarps and may result from blockcollapse and tilting along the fault, similar to drag fold effect, orfrom lavas flowing from footwall towards hangingwall on the slopeacross the fault. Most monoclines in the upper lava flows of theoldest Holocene complex (Tvh) results from the first, tectonicorigin. In contrast, the second origin plays a significant roleregarding the monoclines in youngest lava flows (Tfh).
Grant and Kattenhorn (2004) explained the tectonic develop-ment of monoclines in terms of the upward growth of faults andtheir ‘‘en echelon‘‘ configuration, based on field observation andnumerical modelling. Our model is compatible with their propa-gation fault model, although the episodic overlapping by Holocenelava flows also needs to be taken into account to explain themonocline morphology. Grant and Kattenhorn (2004) also invokedoblique displacement to explain the presence of monoclines and‘‘en echelon’’ fault segments, but our observations rather suggestthat, in the TFS, pure normal slip prevails across the normal faults.The monoclines are generally regular and continuous along faults.Had these monoclines resulted from oblique movements andchanges in fault strike, more discontinuities would be present inthe pattern of tilted blocks.
Our model (Fig. 10) suggests that large voids are present alongthe fault beneath the surface of the lava flows. The geometry ofthese holes depends on the size of the collapsed blocks generatedby the fault activity before or after the filling of open fissures bythe lava flows. Voids are expected to be few and narrow at greatdepths where simple shear dominates along the inclined fault,but numerous and wide in the shallowest portion of the faultzone where tension prevails across nearly vertical fissures. As thebasalt is compact and rigid, partial filling may exist at depths ofseveral tens (possibly hundreds) of metres. The proportion ofvoids decreases as the size of available blocks increases, so thatwhere hexagonal prisms formed by cooling fractures dominate inbasalts the fill ratio is high whereas it is low in presence of moremassive lava flows. For most faults, these voids are filled by water,even at shallow depths near Thingvallatvan (Thingvellir lake), andhence form excellent conduits for fluid transport. Whether or notthe fluid pressure in these specific voids exerts a non-negligibleeffect on the fault aperture, as suggested in a more generalcontext by Gudmundsson (2000), depends on the depth of thetransition from upper, nearly vertical fissures dominated bytension to inclined normal faults with typical dips of 60�–70�
(Angelier et al., 1997).
5.4. Is the rift of the West Volcanic Zone dying out?
The distribution of the Icelandic rifts or volcanic zones isdependent on the spatial relation between the Mid-AtlanticRidge and the Icelandic Mantle Plume. The plate divergencevelocity averages w18 mm/yr. Based on the kinematics of theEurasian and North American plates (DeMets et al., 1990, 1994;Muller et al., 1998; Gripp and Gordon, 1990), and assumingsymmetrical spreading in Iceland, the plate boundaries moveswestward at a velocity of about 11 mm/yr with respect to theplume, which accounts for eastward rift jumps (Angelier et al.,2003). These rifts jumps (Hey et al., 1989) are a consequence ofthe plate boundary relocation above the plume. In northern
g in active oceanic rift: Surface expression, distribution and..., Struct.
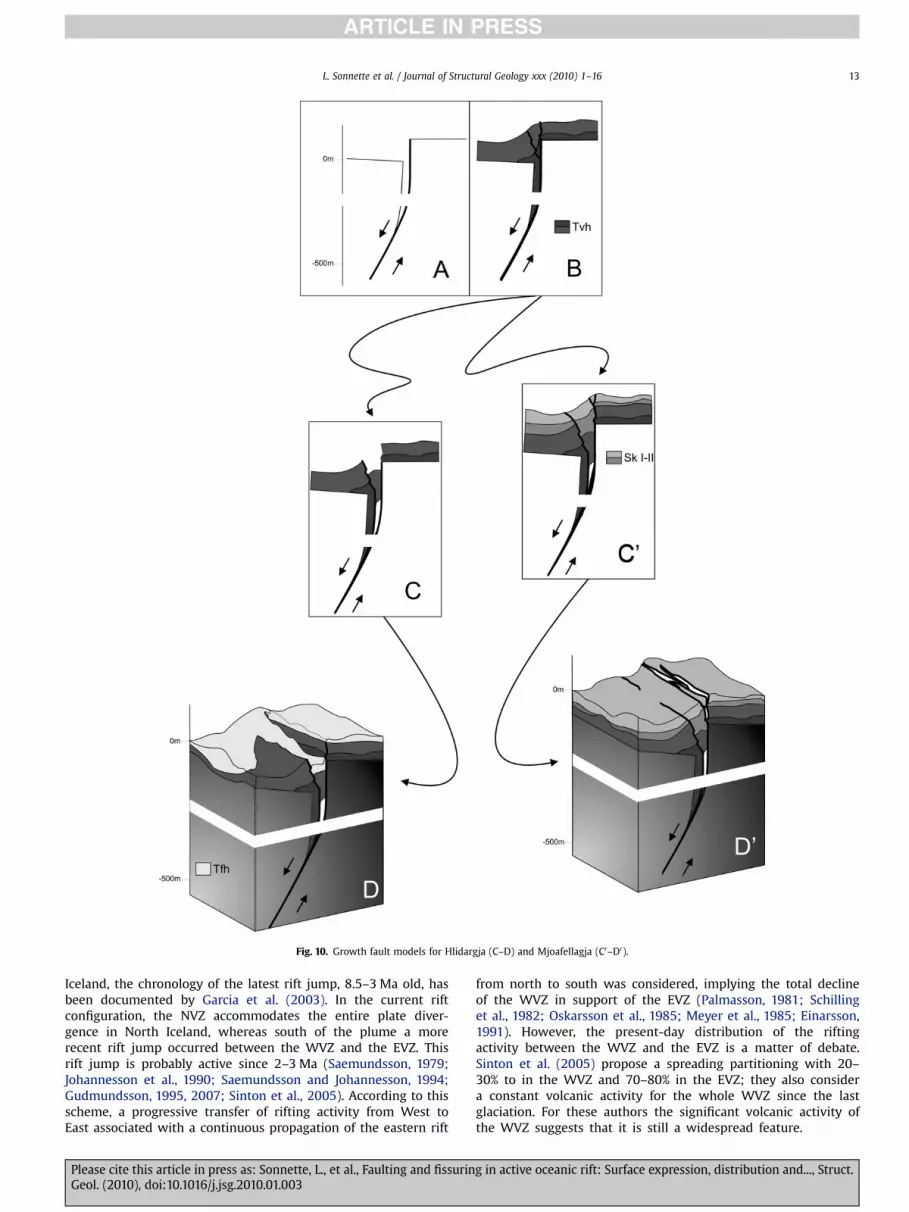
Fig. 10. Growth fault models for Hlidargja (C–D) and Mjoafellagja (C0–D0).
L. Sonnette et al. / Journal of Structural Geology xxx (2010) 1–16 13
ARTICLE IN PRESS
Iceland, the chronology of the latest rift jump, 8.5–3 Ma old, hasbeen documented by Garcia et al. (2003). In the current riftconfiguration, the NVZ accommodates the entire plate diver-gence in North Iceland, whereas south of the plume a morerecent rift jump occurred between the WVZ and the EVZ. Thisrift jump is probably active since 2–3 Ma (Saemundsson, 1979;Johannesson et al., 1990; Saemundsson and Johannesson, 1994;Gudmundsson, 1995, 2007; Sinton et al., 2005). According to thisscheme, a progressive transfer of rifting activity from West toEast associated with a continuous propagation of the eastern rift
Please cite this article in press as: Sonnette, L., et al., Faulting and fissurinGeol. (2010), doi:10.1016/j.jsg.2010.01.003
from north to south was considered, implying the total declineof the WVZ in support of the EVZ (Palmasson, 1981; Schillinget al., 1982; Oskarsson et al., 1985; Meyer et al., 1985; Einarsson,1991). However, the present-day distribution of the riftingactivity between the WVZ and the EVZ is a matter of debate.Sinton et al. (2005) propose a spreading partitioning with 20–30% to in the WVZ and 70–80% in the EVZ; they also considera constant volcanic activity for the whole WVZ since the lastglaciation. For these authors the significant volcanic activity ofthe WVZ suggests that it is still a widespread feature.
g in active oceanic rift: Surface expression, distribution and..., Struct.
L. Sonnette et al. / Journal of Structural Geology xxx (2010) 1–1614
ARTICLE IN PRESS
Our analysis of the fracture distribution in the Thingvellir FissureSwarm based onvertical fault offset and fault length, indicates a ratherregular decrease in tectonic activity during the last 10000 years, asshown by fracture numbers and lengths (Table 2). Considering thenumbers of faults for a given time and area (Table 2) that we haveobtained for the three periods separating the main volcanic events,each value represents two thirds of that of the preceding period. Thevalue since 3600 years comes down to only 44% of that of the value ofthe first post-glacial period. In terms of average cumulative length fora given time and area (Table 2) the proportion is still smaller, 30% ofthat of the first period. In contrast, the average offset rates that wedetermined are larger since 3600 years than during the preceding6600 years. This comparison is however subject to some bias, becausein the Tfh complex the data are provided by only 6 faults, the largestobservable ones in these youngest lava flows. This bias is a conse-quence of the stereoscopic model resolution, which makes the iden-tification of fault offsets below 1 m difficult. Could we haveincorporated other faults affecting the Tfh complex, the average offset,and hence the offset rate, would have been smaller. For this reason, theoffset rates given inTable 2 do not reflect the behaviourof faults acrossa complete range of sizes. Considering the large number of fracturestaken in account regarding numbers and lengths (more than 5000),the corresponding rates are by far more significant. These ratessuggest declining activity, in terms of fault numbers and cumulativelength. Note however that the error bars remain large, as a conse-quence of age uncertainties up to �1500 years that result from boththe individual dating uncertainties and the grouping of lava flows. Theshort timescale of our observations (about 10000 years) precludesdefinite conclusions regarding the longer-term evolution of theIcelandic rift, particularly we didn’t take into account the deglaciationeffects. Gudmundsson (2007) discussed the importance of the dila-tion and faulting induced by significant uplift and magma accumu-lation in deep reservoirs as consequences of the deglaciation. So thedecrease in tectonic activity could only reflect the Pleistocene degla-ciation uplift and the youngest calculated rate would correspond tothe current tectonic activity wich is still persistent as revealed by Insarstudies indicating a 0.7–0.3 cm/year opening in the Hengill-Langjo-kull area (Sturkell et al., 2006; Perlt et al., 2008)
Through kinematic considerations it is possible to reconcile ourresults, which suggest decline in tectonic activity, and those ofSinton et al. (2005), which suggest steady-state volcanic activity.The late Cenozoic westward motion of the mid-oceanic ridge withrespect to the Icelandic mantle plume has induced rift jumps, sothat the present-day configuration includes two 100–110 km longactive transform zones in North and South Iceland (Fig. 1). Theregion between these transform zones is about 300 km wide (in theN–S direction). The continuing westward motion of the oceanicridge would require future rift jumps and the development oflonger transform zones. Because of the limited size of the hotspot inthe N–S direction (parallel to the Mid-Atlantic Ridge), one cannotexpect that future jumps would result in very long transform faultzones north and south of Iceland. It is likely that after reachinga critical distance between offshore axis of the Mid-Atlantic Ridgeand the hotspot, the active ridge will finally become non-affectedby the plume activity. The decrease in tectonic activity withpersistence of volcanic activity in the WVZ, if correct, may thus beinterpreted as a step towards the future separation between theridge and the hotspot.
6. Conclusion
Short range remote sensing techniques allowed us to accuratelymap a large set of fault and fractures (5390) in the TFS and estimatethe vertical offsets of 52 large faults and their along-strike variation.
Please cite this article in press as: Sonnette, L., et al., Faulting and fissurinGeol. (2010), doi:10.1016/j.jsg.2010.01.003
- Fault populations display a typical power-law length distribu-tion underlining fracture nucleation and linkage phenomena inthe evolution of the Thingvellir Fissure Swarm.
- During fault development the length of each large faultincreases by linkage of many small fractures and small faults.
- Several volcanic formations cut by numerous faults allowcomparisons between fissure zones and evaluation of growingrates, giving average values of 6.2, 4.1 and 2.7 ky�1 km�2
respectively for the Tvh, Sk and Tfh lava complexes. Thesevalues support the hypothesis of decreasing tectonic activitysince 10200 years.
- The correlation between mean-maximum vertical throws andnormal fault lengths in the oldest Holocene formations well fitsa power law. For the faults that developed later the distributionshows larger dispersion, revealing a more immature stage ofnear-surface structural development.
- A typical monocline morphology and vertical fissure develop-ment affects the hangingwall of the normal faults, as a conse-quence of repeated lava flows interacting with fault activityand implies fault propagation across each new basalt layers.
- The overall structure and morphology of the normal faultsresults from competition between faulting and volcanicactivity, the normal faults being often buried beneath new lavaflows so that the surface scarps do not provide image of deeperoffsets.
- This study shows that in a Holocene oceanic rift segmentwhere erosion is negligible surface analysis of fault and fissuresystems related to ongoing extensional processes may result inaccurate quantification of brittle tectonic processes, the faultscarp burial effect resulting from lava accumulation beinghowever taken into careful account.
Acknowledgements
Financial support was provided by the French Polar Institute(IPEV) (Arctic Program 316). The Poivilliers software of Yves Egelswas used for stereoscopic analysis. We thank Halldor Geirsson,Icelandic Meteorological Office, for providing data from ContinuousGPS sites; Kristjan Saemundsson, Isor, for fruitful discussions andAugust Gudmundsson and Tamao Sato for helpful reviewcomments.
References
Acocella, V., Gudmundsson, A., Funiciello, R., 2000. Interaction and linkage ofextension fractures and normal faults: examples from the rift zone of Iceland.Journal of Structural Geology 22, 1233–1246.
Angelier, J., Bergerat, F., Dauteuil, O., Villemin, T., 1997. Effective tension–shearrelationships in extensional fissure swarms, axial rift zone of northeasternIceland. Journal of Structural Geology 19, 673–685.
Angelier, J., Slunga, R., Bergerat, F., Stefansson, R., Homberg, C., 2003. Perturbation ofstress and oceanic rift extension across transform faults shown by earthquakefocal mechanisms in Iceland. Earth and Planetary Science Letters 6967, 1–14.
Benauer, F., 1943. Junge Tektonik auf Island und ihre Ursachen. In: Niemczyk, O.,Wittwer, K. (Eds.), Spalten auf Island, pp. 14–64. Stuttgart, Germany.
Bjornsson, A., 1985. Dynamics of crustal rifting in NE Iceland. Journal of GeophysicalResearch 90, 10151–10162.
Brander, J.L., Mason, R.G., Calvert, R.W., 1976. Precise distance measurements inIceland. Tectonophysics 31, 193–206.
Burgmann, R., Pollard, D.D., Martel, S.J., 1994. Slip distributions on faults: effects ofstress gradients, inelastic deformation, heterogenous host-rock stiffness, andfault interaction. Journal of Structural Geology 16, 1678–1690.
Cartwright, J.A., Trudgill, B.D., Mansfield, C.S., 1995. Fault growth by segmentlinkage: an explanation for scatter in maximum displacement and trace lengthdata from the Canyonlands Grabens of SE Utah. Journal of Structural Geology 17,1319–1326.
Cladouhos, T.T., Marret, R., 1996. Are fault growth and linkage models consistentwith power-law distributions of fault lengths? Journal of Structural Geology 18,281–293.
g in active oceanic rift: Surface expression, distribution and..., Struct.
L. Sonnette et al. / Journal of Structural Geology xxx (2010) 1–16 15
ARTICLE IN PRESS
Cowie, P., Scholz, C.H., 1992. Physical explanation for the displacement–lengthrelationship of fault using a post-yield fracture mechanic model. Journal ofStructural Geology 14, 1,133–1,148.
Cowie, P.A., Sornette, D., Vanneste, C., 1995. Multifractal scaling properties ofa growing fault population. Geophysical Journal International 122, 457–469.
Cowie, P.A., Knipe, R.J., Main, I.G. (Eds.), 1996. Scaling Laws for Fault and FracturePopulations Analyses and Applications. Journal of Structural Geology 18 (2/3).
Dauteuil, O., Angelier, J., Bergerat, F., Verrier, S., Villemin, T., 2001. Deformationpartitioning inside a fissure swarm of the northern Icelandic rift. Journal ofStructural Geology 23, 1359–1372.
Davy, P., 1993. On the frequency-length distribution of the San Andreas fault system.Journal of Geophysical Research 98 (B7), 12141–12151.
Dawers, N.H., Mark, H., Scholz, C., 1993. Growth of normal faults, displacement–length scalings. Geology 21 (12), 1107–1110.
Decker, R.W., Einarsson, P., Plumb, R., 1976. Rifting in Iceland: measuring horizontalmovements. Science, 67–71.
DeMets, C., Gordon, R.G., Argus, F., Stein, S., 1990. Current plate motions.Geophysical Journal International 101, 425–478.
DeMets, C., Gordon, R.G., Argus, F., Stein, S., 1994. Effect of recent revisions to thegeomagnetic reversal time scale on estimates of current plate motions.Geophysical Research Letters 21 (11), 2191–2194.
Duffield, W.A., 1975. Structure and origin of the Koae fault system, Kilauea Volcano,Haiwaii. United States Geological Survey, Professional Paper 856.
Einarsson, P., 1991. Earthquakes and present-day tectonism in Iceland. Tectono-physics 189, 261–279.
Ferril, D.A., Stamatakos, J.A., Sims, D., 1999. Normal fault corrugation: implicationsfor growth and seismicity of active normal faults. Journal of Structural Geology21, 1,027–1,038.
Filbrandt, J.B., Richard, P.D., Franssen, R.C.M.W., 1994. Growth and coalescence offaults: numerical simulations and sandbox experiments. Extended Abstracts ofProceedings, Fault Population Conference, University of Edinburgh, pp. 57–59.
Forslund, T., Gudmundsson, A., 1991. Crustal spreading due to dikes and faults insouthwest Iceland. Journal of Structural Geology 13, 443–457.
Garcia, S., Arnaud, N.O., Angelier, J., Bergerat, F., Homberg, C., 2003. Rift jumpprocess in Northern Iceland since 10 Ma from 40Ar/39Ar geochronology. Earthand Planetary Sciences Letters 214, 529–544.
Gerke, K., 1974. Crustal movements in the Myvatn- and in the Thingvallavatn-area,both horizontal and vertical. In: Kristjansson, L. (Ed.), Geodynamics of Icelandand the North-Atlantic Area. Reidel, Dordrecht, pp. 263–275.
Gillespie, P.A., Walsh, J.J., Watterson, J., 1992. Limitations of dimension anddisplacement data from single faults and the consequences for data analysisand interpretation. Journal of Structural Geology 14, 1157–1172.
Grant, J.V., Kattenhorn, S.A., 2004. Evolution of vertical faults at an extensional plateboundary, Southwest Iceland. Journal of Structural Geology 26, 537–557.
Griffith, A.A., 1924. Theory of rupture. In: Biezeno, C.B., Burgers, J.M. (Eds.),Proceeding of the First International Congress on Applied Mechanics, pp. 55–63.
Gripp, A.E., Gordon, R.G., 1990. Current plate velocities relative to the hotspotsincorporating the NUVEL-1 global plate motion model. Geophysical ResearchLetters 17, 1109–1112.
Gudmundsson, A., 1980. The Vogar fissure swarm, Reykjanes peninsula, SW Iceland.Jokull 30, 43–64.
Gudmundsson, A.,1987a. Geometry, formation and development of tectonic fractureson the Reykjanes Peninsula, Southwest Iceland. Tectonophysics 139, 295–308.
Gudmundsson, A., 1987b. Tectonics of the Thingvellir Fissure Swarm, SW Iceland.Journal of Structural Geology 9, 61–69.
Gudmundsson, A., 1992. Formation and growth of normal faults at the divergentplate boundary in Iceland. Terra Nova 4, 464–471.
Gudmundsson, A., 1995. Ocean-ridge discontinuities in Iceland. Journal of Geolog-ical Society of London 152, 1011–1015.
Gudmundsson, A., 2000. Fracture dimensions, displacements and fluid transport.Journal of Structural Geology 22, 1221–1231.
Gudmundsson, A., 2004. Effects of Young’s modulus on fault displacement. ComptesRendus Geosciences 336.
Gudmundsson, A., 2005. Effects of mechanical layering on the development ofdykes and faults sin Iceland. Geodynamica Acta 18, 11–30.
Gudmundsson, A., 2007. Infrastructure and evolution of ocean-ridge discontinuitiesin Iceland. Journal of Geodynamics 43, 6–29.
Gudmundsson, A., Backstrom, K., 1991. Structure and development of the Sveinagjagraben, Northeast Iceland. Tectonophysics 200, 111–125.
Gudmundsson, M.T., Hognadottir, Th., Jakobsson, S.P., 2000. Hraun og mobergs-myndanir sunnan Langjokuls nidurstodur Thyngdarmaelinga. RH-28-2000.Raunvisindastofnun Haskolans, Reykjavik.
Gupta, A., Scholz, C.H., 2000. A model of normal fault interaction based on obser-vation and theory. Journal of Structural Geology 22, 865–879.
Hardacre, K.M., Cowie, P.A., 2003. Variability in fault size scaling due to rockstrength heterogeneity: a finite element investigation. Journal of StructuralGeology 25, 1735–1750.
Hey, R.N., Duennebier, F.K., Morgan, W.J., 1989. Propagating rifts on mid-oceanridges. Journal of Geological Research 85, 2647–2658.
Jaegger, J.C., Cook, N.G.W., 1969. Fundamentals of Rock Mechanics. Chapman andHall, London.
Jakobsson, S.P., Johnson, G.L., Shido, F., 1978. Petrology of the western ReykjanesPeninsula. Journal of Petrology 19, 669–705.
Johannesson, H., 1980. Evolution of the rift zones in western Iceland. Natturu-fraedingurinn 50, 13–31.
Please cite this article in press as: Sonnette, L., et al., Faulting and fissurinGeol. (2010), doi:10.1016/j.jsg.2010.01.003
Johannesson, H.,, Saemundsson, K., 1998a. Geological Map of Iceland, second ed.Icelandic Mus. Nat. Hist. and Iceland Geodetic Survey, Reykjavik. scale1:500,000.
Johannesson, H., Saemundsson, K., 1998b. Tectonic Map of Iceland. Institute ofNatural History, Reykjavik. scale 1:500,000.
Johannesson, H., Jakobsson, S.P., Saemundsson, K., 1990. Geological Map of Iceland,Shette 6, South Iceland, 1:250000, third ed. Icelandic Mus. Nat. Hist. and IcelandGeodetic Survey, Reykjavik.
Jones, J.G., 1970. Intraglacial volcanoes of the Langarvatn region, SW Iceland. Journalof Geology 78, 127–140.
Kasser, 2001. Photogrammetrie numerique. Collection ENSG-IGN. Hermes SciencesPublication.
Kjartansson, G., 1964. Aldur nokkurra hrauna a Sudurlandi. Natturufraedingurinn34, 101–113.
LaBrecque, I.L., Dennis, K.V., Cande, S.C., 1977. Revised magnetic polarity time scalefor late Cretaceous and Cenozoıc time. Geology 5, 330–335.
Main, I.G., Meredith, P.G., Sammonds, P.R., Jones, C., 1990. Influence of fractal flawdistributions on rock deformation in the brittle field. In: Knipe, R.J., Rutter, E.H.(Eds.), Deformation Mechanisms, Rheology and Tectonics. Special Publication ofthe Geological Society of London, vol. 54.
Mansfield, C., Cartwright, J., 2001. Fault growth by linkage: observations andimplications from analogue models. Journal of Structural Geology 23, 745–763.
Marrett, R., Allmendinnger, R.W., 1991. Estimates of strain due to brittle faulting:sampling of fault populations. Journal of Structural Geology 13 (6), 735–738.
Marret, R., Ortega, O.J., Kelsey, C.M., 1999. Extent of power-law scaling for naturalfractures in rock. Geology 27, 799–802.
Martel, S.J., Langley;, J.S., 2006. Propagation of normal faults to the surface in basalt,Koe fault system, Hawaii. Journal of Structural Geology 28, 2123–2143.
Mc Donald, G.A., 1957. Faults and monoclines on Kilauea Volcano, Hawaii.Geological Society of American Bulletin 68, 269–271.
Mc Dougall, I., Saemundsson, K., Johannesson, H., Watkins, N.D., Kristjansson, L.,1977. Extension of the geomagnetic polarity time scale to 6.5 Ma: K–Ar dating,geological and paleomagnetic study of a 3.500 m lava succession in westernIceland. Geolocial Society of American Bulletin 26, 1215–1218.
Meyer, P.S., Sigurdsson, H., Schilling, J.-G., 1985. Petrological and geochemicalvariations along Iceland’s neovolcanic zones. Journal of Geophysical Research90, 10,043–10,072.
Muller, R.D., Roest, W.R., Royer, J.Y., 1998. Asymmetric sea-floor spreading caused byridge–plume interactions. Nature 396, 455–459.
Nielsen, N., 1930. Tektonik und Vulkanismus Islands unter Berucksichtigraung derWergener-Hypothese. Geologische Rundschau 21, 347–349.
Oskarsson, N., Steinthorsson, S., Sigvaldason, G.E., 1985. Iceland geochemicalanomaly: origin, volcanotectonics, chemical fractionation and isotope evolutionof the crust. Journal of Geophysical Research 90, 10,011–10,025.
Palmasson, G., 1981. Crustal rifting, and related thermo-mechanical processes in thelithosphere beneath Iceland. Geologische Rundschau 7, 244–260.
Peacock, D.C.P., Parfitt, E.A., 2002. Active relay ramps and normal fault propagationon Kilauea Volcano, Hawaii. Journal of Structural Geology 24, 729–742.
Perlt, J., Heinert, M., Niemeier, W., 2008. The continental margin in Iceland –a snapshot derived from combined GPS networks. Tectonophysics 447, 155–166.
Rossi, M.J., 1996. Morphology and mechanism of eruption of postglacial shieldvolcanoes in Iceland. Bulletin of Volcanology 57, 530–540.
Rossi, M.J., Sigvaldason, G.E., 1996. The morphology and formation of flow-lobetumuli on Icelandic shield volcanoes. Journal of Volcanology and GeothermalResearch 72, 291–308.
Saemundsson, K., 1965. Ur sogu Thingvallavatns. Natturufraedingurinn 35, 103–144.Saemundsson, K., 1978. Fissure swarms and central volcanoes of the neovolcanic zones
in Iceland. In: Bowes, D.R., Leake, B.E. (Eds.), Crustal Evolution in NorthwesternBritain and Adjacent Regions. Geological Journal Special Issue 10, 415–432.
Saemundsson, K., 1979. Outline of the geology of Iceland. Jokull 29, 7–28.Saemundsson, K., 1992. Geology of the Thingvallavatn area. Oikos 64, 40–68.Saemundsson, K., Johannesson, H., 1994. Jadog upp af Sidu og Fljotshverti, aldur og
myndunarsaga [Build up and age of the rock sequence of the Sida-Fljotshverfihighland]. Paper Presented at Geoscience Society of Iceland Spring Meeting,Reykjavik.
Schilling, J.-G., Meyer, P.S., Kingsley, R.H., 1982. Evolution of the Iceland hotspot.Nature 296, 313–320.
Schlische, R.W., Young, S.S., Ackermann, R.V., Gupta, A., 1996. Geometry and scalingrelations of a population of very small rift-related normal faults. Geology 24,683–686.
Scholz, C.H., Cowie, P.A., 1990. Determination of total strain from faulting using slipmeasurements. Nature 346, 837–839.
Scholz, C.H., Dawers, N.H., Yu, J.-Z., Anders, M.H., Cowie, P.A., 1993. Fault growth andfault scaling laws: preliminary results. Journal of Geophysical Research 98,21951–21961.
Schultz, R.A., Fossen, H., 2002. Displacement–length scaling in three dimensions:the importance of aspect ration and application to deformation bands. Journalof Structural Geology 24, 1,389–1,411.
Shaw, H.R., Gartner, A.E., 1986. On the graphical interpretation of paleoseismic data.U.S. Open-File Rep 86-394.
Sinton, J., Gronvold, K., Saemundsson, K., 2005. Postglacial eruptive history of thewestern Volcanic Zone, Iceland. Geochemistry Geophysics Geosystems 6,Q12009. doi:10.1029/2005GC001021. http://www.agu.org/journals/gc.
Soliva, R., Benedicto, A., 2005. Geometry, scaling relations and spacing of verticallyrestricted normal faults. Journal of Structural Geology 27, 317–325.
g in active oceanic rift: Surface expression, distribution and..., Struct.
L. Sonnette et al. / Journal of Structural Geology xxx (2010) 1–1616
ARTICLE IN PRESS
Sornette, A., Davy, P., Sornette, D., 1993. Fault growth in brittle–ductile experimentsand the mechanics of continental collisions. Journal of Geophysical Research 98,12,111–12,139.
Sneddon, I.N., Lowengrub, M., 1969. Crack Problems in the Classical Theory ofElasticity. Wiley, London.
Sturkell, E., Einarsson, P., Sigmundsson, F., Geirsson, H., Olafsson, H., Pedersen, R., deZeeuw-van Dalfsen, E., Linde, A.T., Sacks, S.I., Stefansson, R., 2006. Volcanogeodesy and magma dynamics in Iceland. Journal of Volcanology andGeothermal Research 150, 14–34.
Thorarinsson, S., 1965. The median zone of Iceland. The World Rift System.Geological Survey of Canada 66, 187–211.
Thordarson, T., Hoskuldsson, A., 2002. Iceland, Classic Geology in Europe, vol. 3.Terra Publishing, Harpenden, Hertforshire, UK.
Tryggvason, T., 1943. Das Skjaldbreid-gebeit auf Island, Eine petrogaphische Studie.Bulletin of the Geological Institution of the University of Uppsala 30, 270–320.
Tryggvason, E., 1974. Vertical crustal movement in Iceland. In: Kristjanson, L. (Ed.),Geodynamics of Iceland and the North Atlantic Area. Reidel, Dordrecht, pp.241–262.
Tryggvason, E., 1982. Recent ground deformation in continental and oceanic riftzones. In: Palmason, G. (Ed.), Continental and Oceanic Rifts. Geodynamic Series,vol. 8. AGU, Washington, pp. 17–29.
Villemin, T., Sunwoo, C., 1987. Distribution logarithmique self-similaire des rejets etlongueurs de failles: exemple du Bassin Houiller Lorrain. Comptes Rendus del’Academie des Sciences 305, 1,309–1,312.
Please cite this article in press as: Sonnette, L., et al., Faulting and fissurinGeol. (2010), doi:10.1016/j.jsg.2010.01.003
Villemin, T., Angelier, J., Sunwoo, C., 1995. Fractal distribution of fault length andoffsets: implications of brittle deformation evaluation: the Lorraine Coal Basin(SE France). In: Barton, C.C., La Pointe, P.R. (Eds.), Fractals in the Earth Sciences.Plenum Press, New York, pp. 205–226.
Villemin, T., Bergerat, F., Angelier, J., Lacasse, C., 1994. Brittle deformation andfracture patterns on oceanic rift shoulders: the Esia peninsula, SW Iceland.Journal of Structural Geology 16 (12), 1641–1654.
Walker, G.P.L., 1964. Geological investigations in eastern Iceland. Bulletin ofVolcanology 27, 351–363.
Walker, G.P.L., 1965a. Some aspects of Quaternary volcanism in Iceland. Trans-actions of the Leicester Literary and Philosophical Society 59, 25–40.
Walker, G.P.L., 1965b. Evidence of crustal drift from Icelandic geology. PhilosophicalTransactions of the Royal Society 258, 199–204.
Walker, G.P.L., 1971. Compound and simple lava flows and flood basalts. Bulletin ofVolcanology 35, 579–590.
Walsh, J.J., Watterson, J., 1988. Analysis of the relationship between displacementsand dimension of faults. Journal of Structural Geology 103, 239–247.
Walsh, J.J., Nicol, A., Childs, C., 2002. An alternative model for the growth of faults.Journal of Structural Geology 24, 1669–1675.
Watterson, J., 1986. Fault dimensions, displacements and growth. Pure AppliedGeophysics 124, 365–373.
Willemse, E.J.M., 1997. Segmented normal faults: correspondence between three-dimensional mechanical models and field data. Journal of Geophysical Research102, 675–692.
g in active oceanic rift: Surface expression, distribution and..., Struct.


