
Natural Hazards 15: 183–197, 1997. 183c 1997 Kluwer Academic Publishers. Printed in the Netherlands.
Seismic Ground Motion Expected for the EasternDistrict of Naples
C NUNZIATA1, F. VACCARI2;4, D. FAH5, G. LUONGO1 and G. F. PANZA2;31Dipartimento di Geofisica e Vulcanologia, Universita’ Federico II di Napoli, Italy;2Dipartimento di Scienze della Terra, Universita’ di Trieste, Italy;3International Center for Theoretical Physics, Miramar, Trieste, Italy;4Gruppo Nazionale per la Difesa dai Terremoti-CNR;5Institut fur Geophysik, ETH-Hoenggerberg, CH-8093 Zurich
(Received: 26 June 1996; in final form: 2 October 1996)
Abstract. The seismic ground motion of a test area in the eastern district of Naples is computed witha hybrid technique based on the mode summation and the finite difference methods. This techniqueallows us the realistic modelling of source and propagation effects, including local soil conditions.In the modelling, we consider the 1980 Irpinia earthquake, a good example of strong shaking for thearea of Naples, which is located about 90 km from the epicenter.
The detailed geological setting is reconstructed from a large number of drillings. The sub-soil ismainly formed by alluvial (ash, stratified sand and peat) and pyroclastic materials overlying a pyro-clastic rock (yellow neapolitan tuff), representing the neapolitan bedrock. The detailed informationavailable on mechanical properties of the sub-soil and its geometry warrants the application of thesophisticated hybrid technique.
As expected, the sedimentary cover causes an increase of the signal’s amplitudes and duration. Ifthin peat layers are present, the amplification effects are reduced, and the peak ground accelerationsare similar to those observed for the bedrock model. This can be explained by the backscattering ofwave energy at such layers, that tend to seismically decouple the upper from the lower part of thestructure.
For SH-waves, the influence of the variations of the S-wave velocities on the spectral amplificationis studied, by considering locally measured velocities and values determined from near-by down-holemeasurements. The comparison between the computed spectral amplifications confirms the key roleof an accurate determination of the seismic velocities of the different layers.
The comparison performed between a realistic 2-D seismic response and a standard 1-D response,based on the vertical propagation of waves in a plane layered structure, shows considerable difference,from which it is evident that serious caution must be taken in the modelling of expected ground motionat a specific site.
Key words: seismic ground motion, Naples, numerical modelling, finite difference methods
1. Introduction
Naples has often been severely damaged by earthquakes from distant seismogeneticareas. The analysis of the strongest historical earthquakes, X and XI degree on theMercalli Cancani Sieberg (MCS) scale in the epicentral area, indicates that themaximum expected intensity in Naples is VII–VIII. The last strong event, the23 November 1980 (MS = 6.9, ML = 6.5), Irpinia earthquake, produced seriousdamage in Naples, mostly in the historical centre and in the eastern area (Rippa and
184 C. NUNZIATA ET AL.
Vinale, 1983). Only moderate ground shaking had been expected for such an event.In fact, peak ground accelerations of 0.06g and 0.04 g, with dominant frequenciesat 2.5 and 3 Hz, were recorded along the N–S and E–W directions at the seismicstation Torre del Greco. This station is located on a lava deposit on the Vesuviusflanks, about 20 km from Naples, on a similar azimuth from the epicenter. For thehistorical buildings, the damage may be explained by their degraded condition.For the most damaged buildings in the eastern district, which are tall and made ofreinforced concrete, it is necessary to consider the combined effects of the incidentwavefield, the local soil conditions and the properties of the buildings.
The 1980 earthquake is the first strong event that occurred in the SouthernApennines, which has been recorded by many instruments at different epicentraldistances and in a wide range of frequencies (Annali di Geofisica, 1993). The sourceprocess is complex, consisting of a main rupture episode (0s subevent) followedby two smaller ones at about 18s and 40s from the origin time of the main episode.A general agreement exists about the geometry of the main rupture consisting ofa fault dipping 60� towards the NE and having a strike of about 315�. The largestmoment release took place at a depth not exceeding 10 km, underneath the easternflank of the Mt. Marzano ridge, close to the town of Laviano. This instrumentaldepth determination agrees quite well with the macroseismic depth estimate madeby Panza et al. (1991).
At present, the only possibility for a detailed zoning for the town of Naples,that according to historical records, may experience a shaking of intensity VIII onthe MCS scale, is given by using numerical simulations of earthquakes. Startingfrom the 1980 earthquake which corresponds to VII degrees on the MCS scale, wecan assign a peak ground acceleration to the intensity, and go back to simulate pastrupture mechanisms. This is the only chance to weight the possible shaking and toselect the most dangerous event to be taken into account for the building code.
The aim of this paper is to estimate the seismic ground motion of a sample area,in the eastern district of Naples, which is a newly developed area with skyscrapersof important social use, like the Law Courts and administrative offices. It covers aflat area of about 3 km2. The computation of the local seismic response needs (1)to perform the numerical modelling of the propagation of the wavefield, generatedby the main rupture event of the 1980 earthquake, up to the test area and (2) tomake an accurate and realistic evaluation of the seismic ground motion, taking intoaccount the significant lateral variations which are present in the subsoil of thisurban area.
For the computation of the local seismic response, we use the hybrid methoddeveloped by Fah (1992) and Fah et al. (1993a,b), that accounts for the sourceand the propagation path, including anelasticity and local soil effects. A sensitivitystudy is performed for the shear wave velocities, due to the fact that differentvelocities were measured inside the test area (Vinale, 1988) and in surroundingareas (Comune di Napoli, 1994). The results are compared with those obtainedwith the standard one-dimensional method (computer program Shake), developed

SEISMIC GROUND MOTION FOR THE EASTERN DISTRICT OF NAPLES 185
by Schnabel et al. (1972), that applies vertically incident SH-waves to a structurecomposed of plane parallel layers. This allows an evaluation of the applicability ofthe commonly used 1-D computational techniques for our microzonation study.
2. Numerical Modelling of Seismic Ground Motion for 2-D Structures
Many Italian towns have been often damaged by earthquakes from far seismogenet-ic areas. Generally, instrumental records are not available and the seismic responseis requested for new urban settlements, and for the protection of historical build-ings. Numerical 1-D techniques for seismic zonation studies treat plane-parallelstructural models and/or the incidence of plane polarized body waves. These tech-niques are often not adequate for laterally heterogeneous structures and for sourcesthat are not located beneath the site of interest (Fah and Suhadolc, 1994). In suchcases a more rigorous treatment of the combined effects of source, path and siteresponse is needed.
The numerical hybrid approach recently proposed by Fah (1992) and Fah etal. (1993a,b) can account for the source and the propagation effects, includinganelasticity and local soil effects. The propagation of the waves from the source upto the complex two-dimensional structure is computed with the mode summationtechnique (Panza, 1985; Florsch et al., 1991), and in the complex, laterally het-erogeneous structure it is computed with the finite difference method. This hybridapproach combines the advantages of both mode summation and finite differencetechnique. With the mode summation method it is possible to simulate a realisticrupture process on the extended fault, as a sum of point sources, properly dis-tributed in space and time. The path from the source up to the region containingthe 2-D heterogeneities is represented by a 1-D layered anelastic structure. Theresulting wavefield is then used to define the boundary conditions to be applied tothe 2-D anelastic region, where the finite difference technique is used. The hybridapproach has been developed for both SH- and P-SV-waves (Fah, 1992; Fah etal., 1993a,b), and it has been tested in Mexico City where a good fit was obtainedbetween observed and computed seismic response (Fah et al.,1994). Herein onlySH-waves are considered.
3. Geological Setting of the Studied Area
Naples is located on volcaniclastic soils and rocks (various types of tuffs) eruptedby the Campi Flegrei volcanoes (Figure 1). The original material that forms thetuffs and the volcanic soils is in general the same, with the volcaniclastic rocksbeing the result of the hardening of the volcaniclastic soils by post depositionalhydrothermal alteration. Such hardening is not homogeneous so that welded faciesmay vanish and the tufaceous formation becomes incoherent, especially at theborders or where such bodies taper. The tuff formation is either outcropping, or islocated some tens of metres below the ground surface.
186 C. NUNZIATA ET AL.
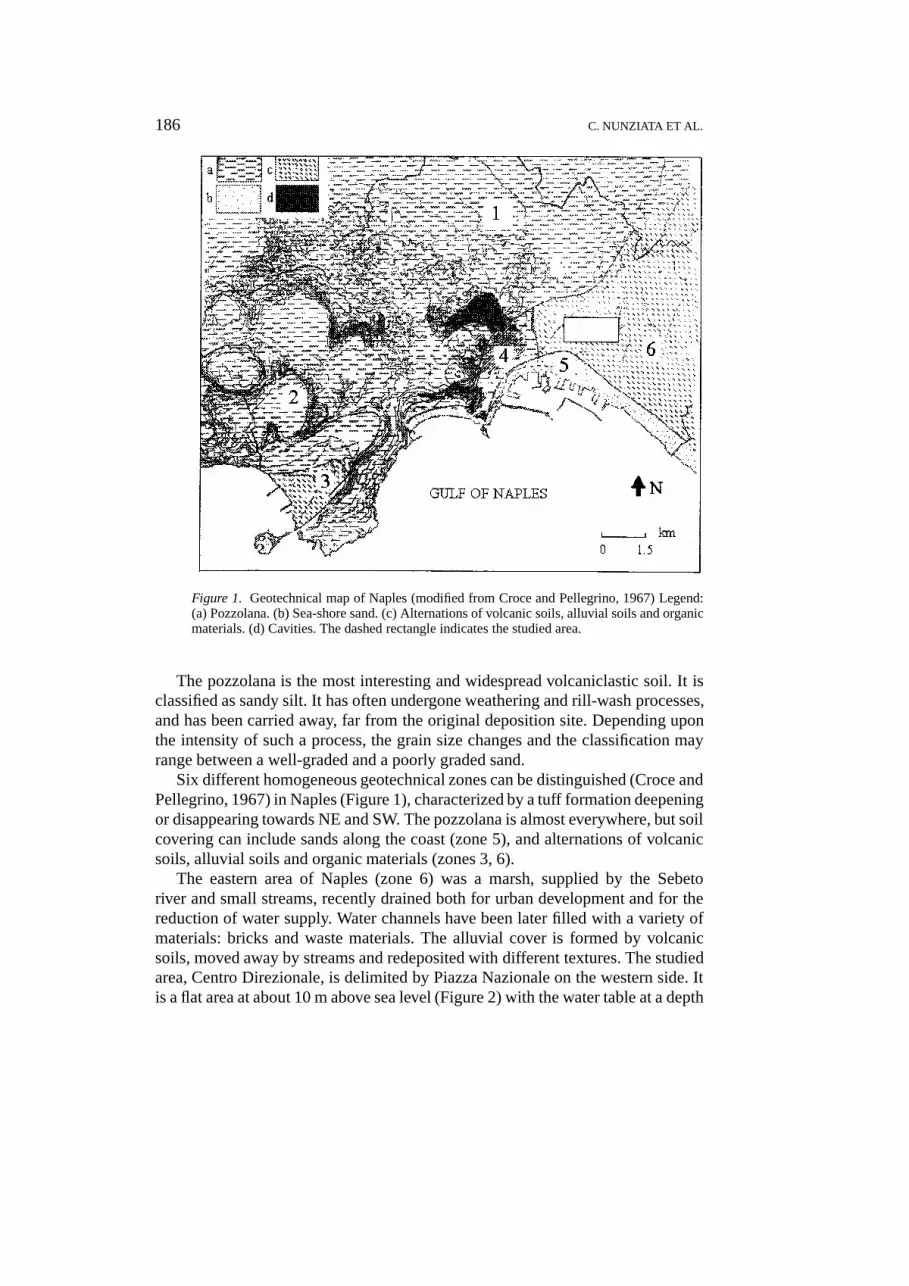
Figure 1. Geotechnical map of Naples (modified from Croce and Pellegrino, 1967) Legend:(a) Pozzolana. (b) Sea-shore sand. (c) Alternations of volcanic soils, alluvial soils and organicmaterials. (d) Cavities. The dashed rectangle indicates the studied area.
The pozzolana is the most interesting and widespread volcaniclastic soil. It isclassified as sandy silt. It has often undergone weathering and rill-wash processes,and has been carried away, far from the original deposition site. Depending uponthe intensity of such a process, the grain size changes and the classification mayrange between a well-graded and a poorly graded sand.
Six different homogeneous geotechnical zones can be distinguished (Croce andPellegrino, 1967) in Naples (Figure 1), characterized by a tuff formation deepeningor disappearing towards NE and SW. The pozzolana is almost everywhere, but soilcovering can include sands along the coast (zone 5), and alternations of volcanicsoils, alluvial soils and organic materials (zones 3, 6).
The eastern area of Naples (zone 6) was a marsh, supplied by the Sebetoriver and small streams, recently drained both for urban development and for thereduction of water supply. Water channels have been later filled with a variety ofmaterials: bricks and waste materials. The alluvial cover is formed by volcanicsoils, moved away by streams and redeposited with different textures. The studiedarea, Centro Direzionale, is delimited by Piazza Nazionale on the western side. Itis a flat area at about 10 m above sea level (Figure 2) with the water table at a depth

SEISMIC GROUND MOTION FOR THE EASTERN DISTRICT OF NAPLES 187
Figure 2. Detailed map of the studied area with the location of drillings (dots) and cross-sections (thick lines). Topographic curves in metres are shown (solid and dashed thin lines).
of a few meters. The reconstruction of the main geological pattern is made alongcross-sections through many drillings requested for the construction of skyscrapers(Figure 2), and is shown along the S1–S6 profile, representative of the whole area(Figure 3a). The sub-soil is mainly formed by man-made ground, alluvial soils(ashes, stratified sands, peat), loose and slightly cemented pozzolanas, yellow tuffand marine sands. As can be observed, significant lateral variations are present inthe subsoil, mostly peat levels with changeable thickness at different depths in afew metres. The shallowest peat level lies around 10 m from ground surface (Figure4), it is thicker towards the north-east, and it is absent in the south-western cornerof the area. The tuff isopachs range from about 20 m to more than 50 m, but thisformation disappears in the south- and north-eastern sectors of the area (Figure 5).
Several laboratory and field measurements were conducted in the area (Vinale,1988), to define the physical (density, porosity, grain size, water content, etc.) anddynamic (S-wave velocities and damping ratios) properties of the materials. Themeasured shear wave velocities were lower than those measured in the surroundings(Comune di Napoli, 1994) and at the site 63 (Figure 2). For checking the influence ofVs on the seismic response of the considered area we have associated the velocityprofiles 1 (low velocities) and 2 (high velocities) to the stratigraphic sequenceshown in Figure 3b, keeping all other parameters fixed. The Vs velocities of the

188 C. NUNZIATA ET AL.
Figure 3a. Geological cross-section along the profile S1S6 shown in Figure 1.
deep peat levels have not been measured, and we have taken the velocity gradientmeasured in similar peats in the Fucino plain (Mancuso et al., 1991).
4. Seismic Response
The causative fault of the 1980 earthquake is located about 90 km from the cross-section that we have taken as representative for the sample area of the easternpart of Naples (Figure 3a). The choice of the mechanism of the seismic source ismade accordingly with the mechanism of the main shock (0s subevent) of the 1980Irpinia earthquake: dip 65� , rake 270� , strike 315� and depth 7.0 km. The anglebetween the strike of the fault and the epicenter-cross section line is 38�.
The source is located in the laterally homogeneous part, and the propagation ofthe waves from the source up to the 2-D anelastic structure (Figure 3a) is computedwith the mode summation technique for the layered, anelastic, one-dimensionalmodel representative of the path to the town of Naples (Nunziata et al., 1995).Acceleration time series for SH-waves (Figure 6) are computed at an array of

SEISMIC GROUND MOTION FOR THE EASTERN DISTRICT OF NAPLES 189
Figure 3b. Velocity profiles 1 (solid line, Vinale, 1988) and 2 (dashed line, Commune diNapoli, 1994), associated with the stratigraphic sequence shown in the left part of the figure.
receivers over three different cross-sections: (1) the one-dimensional referencemodel for the bedrock, which represents the structural model for the region betweenthe source position and Naples, (2) the anelastic two-dimensional model obtainedusing the stratigraphyc sequence corresponding to the velocity profile 2, and (3) thesame as (2) but corresponding to the velocity profile 1. All values are first relatedto a source seismic moment of 10�7 nm. By scaling SH accelerations after Gusev(1983) for a magnitudeMs = 6.9, peak ground accelerations of 0.045–0.06 g areobtained. These values are in agreement with the attenuation law for the Italianterritory (Sabetta and Pugliese, 1987). In Figure 6, the time scale is shifted by 15swith respect to the origin time, and the distance between two receivers is 100 m. Ifwe assume a maximum ground acceleration (amax) of SH waves of 0.06 g in the1-D reference model, equal to that measured at the seismic station Torre del Greco,

190 C. NUNZIATA ET AL.
Figure 4. Depth (m) of the shallow peat level from ground surface. Dashed lines indicateabsence of peat.
Figure 5. Depth (m) of the tuff horizon from ground surface. Dashed lines indicate absenceof tuff.
it turns out that amax does not change in the 2-D model containing the peat layers,but it is doubled where the peat is absent.

SEISMIC GROUND MOTION FOR THE EASTERN DISTRICT OF NAPLES 191
Fig
ure
6.A
ccel
erat
ion
time
seri
esfo
rS
H-w
aves
com
pute
dfo
rth
ere
fere
nce
mod
el(1
-Dbe
droc
k),
the
2-D
stru
ctur
alm
odel
with
the
velo
city
profi
le2,
and
the
2-D
stru
ctur
alm
odel
wit
hth
eve
loci
typr
ofile
1.
192 C. NUNZIATA ET AL.
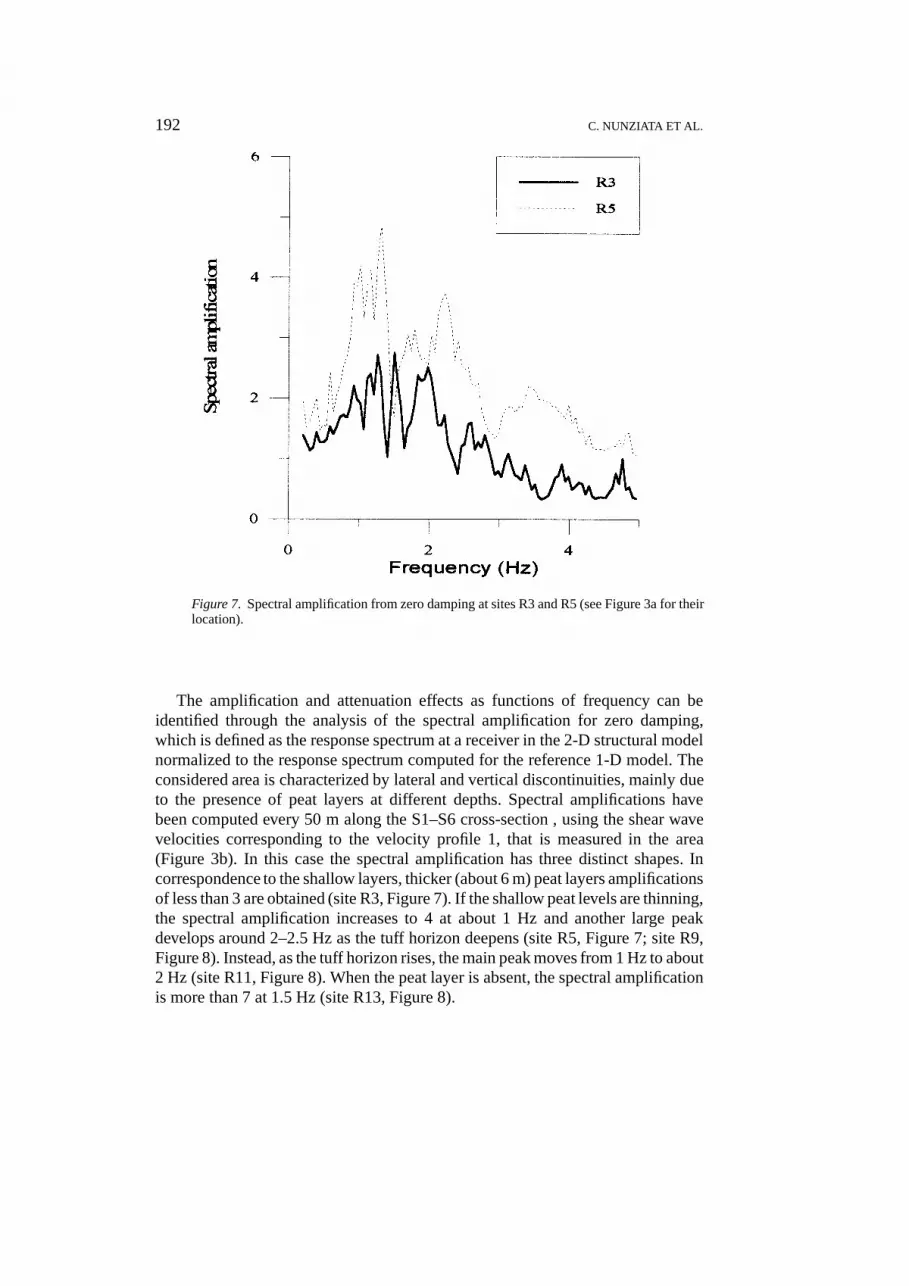
Figure 7. Spectral amplification from zero damping at sites R3 and R5 (see Figure 3a for theirlocation).
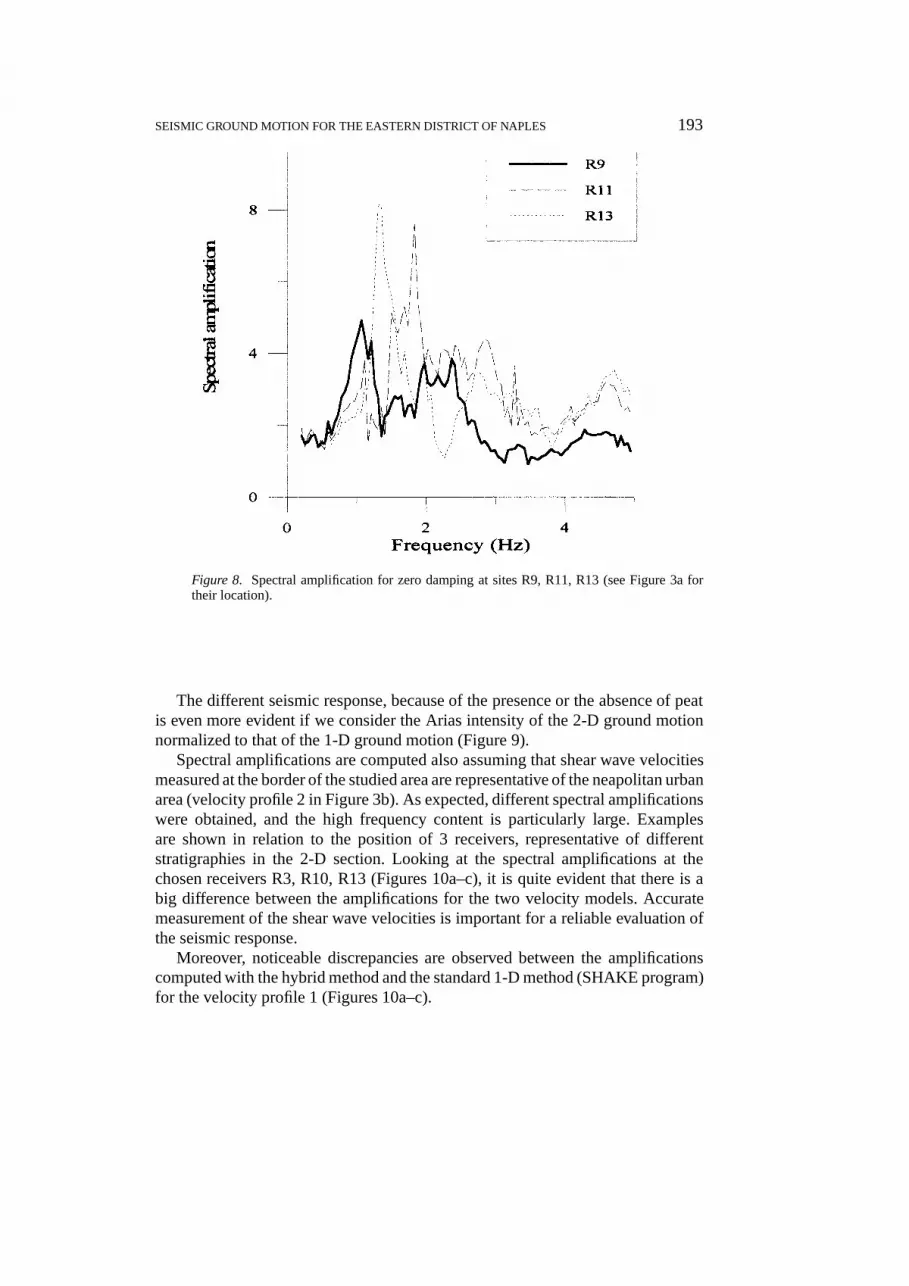
The amplification and attenuation effects as functions of frequency can beidentified through the analysis of the spectral amplification for zero damping,which is defined as the response spectrum at a receiver in the 2-D structural modelnormalized to the response spectrum computed for the reference 1-D model. Theconsidered area is characterized by lateral and vertical discontinuities, mainly dueto the presence of peat layers at different depths. Spectral amplifications havebeen computed every 50 m along the S1–S6 cross-section , using the shear wavevelocities corresponding to the velocity profile 1, that is measured in the area(Figure 3b). In this case the spectral amplification has three distinct shapes. Incorrespondence to the shallow layers, thicker (about 6 m) peat layers amplificationsof less than 3 are obtained (site R3, Figure 7). If the shallow peat levels are thinning,the spectral amplification increases to 4 at about 1 Hz and another large peakdevelops around 2–2.5 Hz as the tuff horizon deepens (site R5, Figure 7; site R9,Figure 8). Instead, as the tuff horizon rises, the main peak moves from 1 Hz to about2 Hz (site R11, Figure 8). When the peat layer is absent, the spectral amplificationis more than 7 at 1.5 Hz (site R13, Figure 8).
SEISMIC GROUND MOTION FOR THE EASTERN DISTRICT OF NAPLES 193
Figure 8. Spectral amplification for zero damping at sites R9, R11, R13 (see Figure 3a fortheir location).
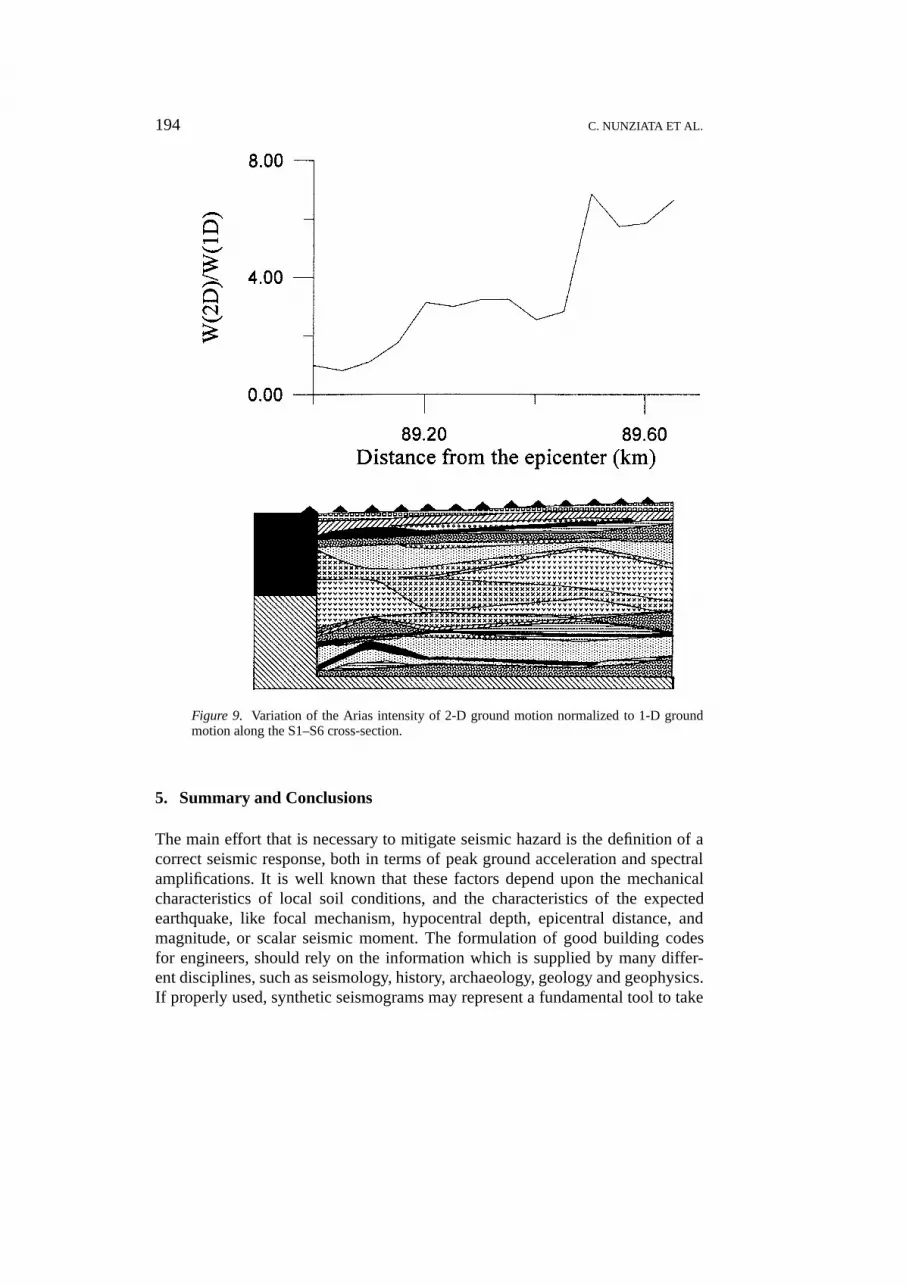
The different seismic response, because of the presence or the absence of peatis even more evident if we consider the Arias intensity of the 2-D ground motionnormalized to that of the 1-D ground motion (Figure 9).
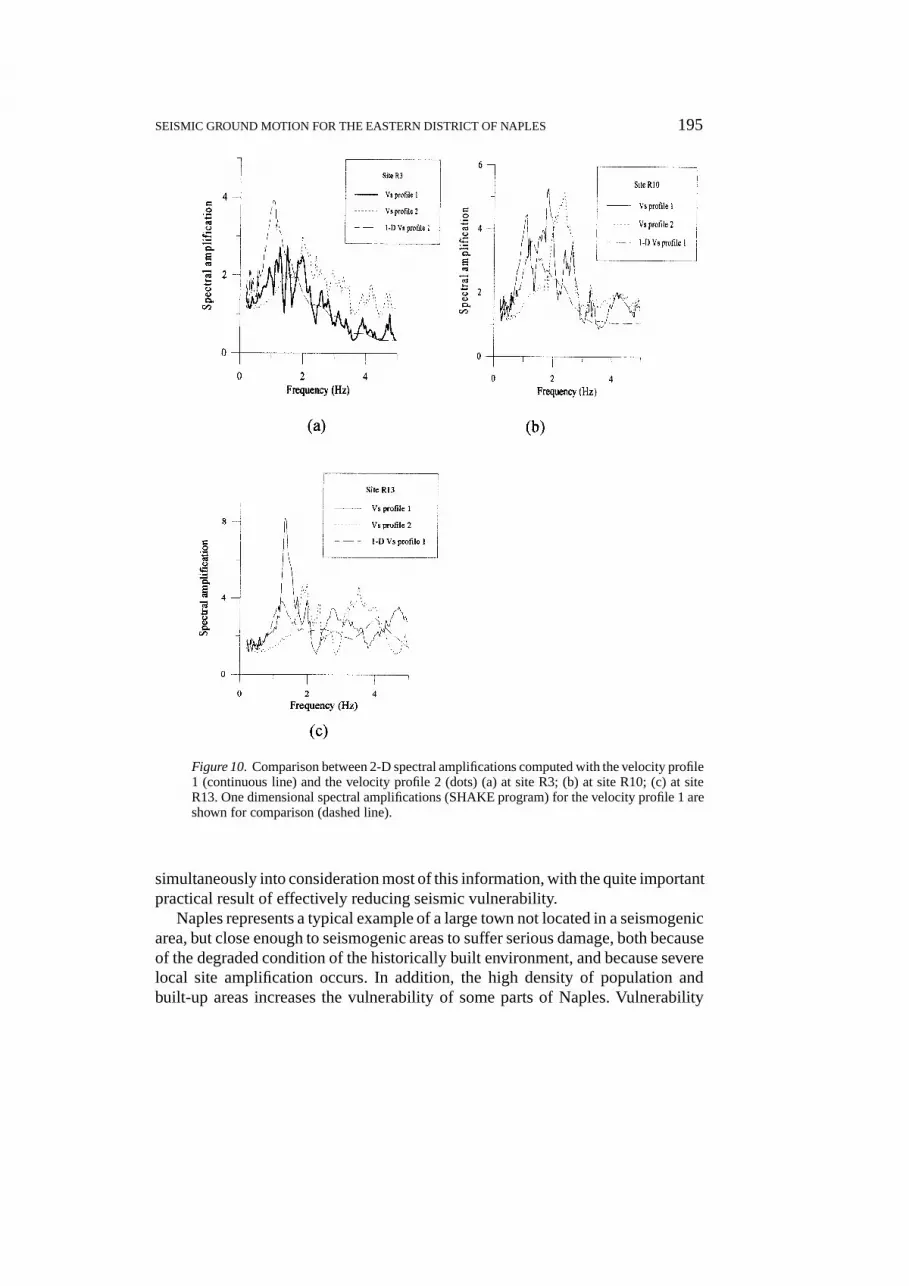
Spectral amplifications are computed also assuming that shear wave velocitiesmeasured at the border of the studied area are representative of the neapolitan urbanarea (velocity profile 2 in Figure 3b). As expected, different spectral amplificationswere obtained, and the high frequency content is particularly large. Examplesare shown in relation to the position of 3 receivers, representative of differentstratigraphies in the 2-D section. Looking at the spectral amplifications at thechosen receivers R3, R10, R13 (Figures 10a–c), it is quite evident that there is abig difference between the amplifications for the two velocity models. Accuratemeasurement of the shear wave velocities is important for a reliable evaluation ofthe seismic response.
Moreover, noticeable discrepancies are observed between the amplificationscomputed with the hybrid method and the standard 1-D method (SHAKE program)for the velocity profile 1 (Figures 10a–c).
194 C. NUNZIATA ET AL.
Figure 9. Variation of the Arias intensity of 2-D ground motion normalized to 1-D groundmotion along the S1–S6 cross-section.
5. Summary and Conclusions
The main effort that is necessary to mitigate seismic hazard is the definition of acorrect seismic response, both in terms of peak ground acceleration and spectralamplifications. It is well known that these factors depend upon the mechanicalcharacteristics of local soil conditions, and the characteristics of the expectedearthquake, like focal mechanism, hypocentral depth, epicentral distance, andmagnitude, or scalar seismic moment. The formulation of good building codesfor engineers, should rely on the information which is supplied by many differ-ent disciplines, such as seismology, history, archaeology, geology and geophysics.If properly used, synthetic seismograms may represent a fundamental tool to take
SEISMIC GROUND MOTION FOR THE EASTERN DISTRICT OF NAPLES 195
Figure 10. Comparison between 2-D spectral amplifications computed with the velocity profile1 (continuous line) and the velocity profile 2 (dots) (a) at site R3; (b) at site R10; (c) at siteR13. One dimensional spectral amplifications (SHAKE program) for the velocity profile 1 areshown for comparison (dashed line).
simultaneously into consideration most of this information, with the quite importantpractical result of effectively reducing seismic vulnerability.
Naples represents a typical example of a large town not located in a seismogenicarea, but close enough to seismogenic areas to suffer serious damage, both becauseof the degraded condition of the historically built environment, and because severelocal site amplification occurs. In addition, the high density of population andbuilt-up areas increases the vulnerability of some parts of Naples. Vulnerability

196 C. NUNZIATA ET AL.
may be reduced through the retrofitting of ancient buildings and monuments, andthrough the design of reinforced-concrete structures able to resist the seismicinput. Serious regulations are requested since monuments must not be damaged byrandom injections of concrete, without properly considering the expected seismicinput. Sound anti-seismic criteria can be reliably based only on the knowledge ofsite seismic response, both in terms of peak ground acceleration and frequencycontent.
Ground motion modelling made with complete SH-wave seismograms showsthat the surficial soil deposits composed of pyroclastic and alluvial materials, withlateral discontinuities, are responsible for an increase in amplitude and duration ofthe signal relative to the bedrock. Such an effect is reduced when a thin, laterallyheterogeneous peat layer is present. Peak ground accelerations on rock sites andon surficial soil deposits with peat are similar, and they are about half of thoseobserved on soil deposits without peat. Relevant differences are observed in thetime series computed along the 2-D structure, and they are even more clear whenthe seismic ground motion is considered in the frequency domain (Figures 7–8).The unconsolidated sediments amplify some of the frequencies contained in theincoming wavetrain, and the use of 1-D methods may give unreliable spectralamplifications. In addition, since the test area represents an anomaly with respectto the surrounding areas in terms of shear wave velocities, a sensitivity study isperformed. It turns out that spectral amplifications are significantly different andthis stresses the fundamental role of the velocity model.
As a first step for the mitigation of seismic hazard, the seismic ground motionof a flat test area in the eastern sector of Naples has been modelled along aprofile trending N88� W, considering as source the main shock of the 1980 Irpiniaearthquake. Discrepancies are found between the amplifications computed withthe 1-D standard method and the more realistic 2-D hybrid method. Moreover, thesensitivity of the site amplification on shear wave velocities requires a detailedknowledge of velocities or, for safety reasons, computation of response spectrafor different compatible velocities and the assumption of the most conservativeresponse spectrum or an average, dependant upon the vulnerability of the site. Bytaking into account parametric studies, regarding focal mechanisms of the sourceand the velocity model, it is possible to adopt serious seismic regulations.
References
Annali di Geofisica: 1993, Special issue on the meeting ‘Irpinia dieci anni dopo’, Sorrento 19–24November 1990, Vol. XXXVI, N.1, April 1993.
Comune di Napoli: 1994, Indagini geologiche per l’adeguamento del P.R.G. alla legge regionale7–1–1983 n. 9 in difesa del territorio dal rischio sismico.
Croce, A. and Pellegrino, A.: 1967, Il sottosuolo della citta’ di Napoli. Caratterizzazione geotecnicadel territorio urbano, Ass. Geotecnica Italiana, Atti VIII Convegno di Geotecnica, pp. 233–253.
Fah, D.: 1992, A Hybrid Technique for the Estimation of Strong Ground Motion in SedimentaryBasins, Ph.D. thesis Nr. 9767, Swiss Federal Institute of Technology, Zurich.

SEISMIC GROUND MOTION FOR THE EASTERN DISTRICT OF NAPLES 197
Fah, D., Suhadolc, P., and Panza, G. F.: 1993a, Variability of seismic ground motion in complexmedia: the case of a sedimentary basin in the Friuli (Italy) area, Journal of Applied Geophysics30, 131–148.
Fah, D., Iodice, C., Suhadolc, P., and Panza, G. F.: 1993b, A new method for the realistic estimationof seismic ground motion in megacities: the case of Rome, Earthquake Spectra 9(4), 643–668.
Fah, D. and Suhadolc, P.: 1994, Application of numerical wave-propagation techniques to study localsoil effects: the case of Benevento (Italy), Pageoph 143(4), 513–536.
Fah, D., Suhadolc, P., Mueller, St., and Panza, G. F.: 1994, A hybrid method for the estimation ofground motion in sedimentary basins; quantative modeling for Mexico City, Bull. Seismol. Soc.Am. 84, 383–399.
Florsch, N., Fah, D., Suhadolc, P., and Panza, G. F.: 1991, Complete synthetic seismograms forhigh-frequency multimode SH-waves, Pageoph 136, 529–560.
Gusev, A. A.: 1983, Descriptive statistical model of earthquake source radiation and its applicationto an estimation of short period strong motion, Geophys. J. R. Astron. Soc. 74, 787–800.
Mancuso, C., Silvestri, F., and Vinale, F.: 1991, Geotechnical characterization of Fucino clay, Proc.X Eur.Conf. Soil Mech. Found. Eng. 9122–9136.
Nunziata, C., Fah, D., and Panza, G. F.: 1995, Mitigation of seismic hazard of a megacity: the caseof Naples, Ann. Geofis. XXXVIII(5–6), 649–661.
Panza, G. F.: 1985, Synthetic seismograms: The Rayleigh waves modal summation, J. Geophysics58, 125–145.
Panza, G. F.: 1991, The theory and some appplications of synthetic seismograms to strong motion dataand macroseismic informations, in R. Fantechi and M. E. Almeida-Teixeira (eds.), EarthquakeHazard Assessment, Proc. European School, Athens May 1988, Commission of the EuropeanCommunities, pp. 65–78.
Rippa, F. and Vinale, F.: 1983, Effetti del terremoto del 23 Novembre 1980 sul patrimonio edilizio diNapoli, Ass. Geotecnica Italiana, Atti XV Convegno Nazionale di Geotecnica, pp. 193–206.
Sabetta, F. and Pugliese, A.: 1987, Attenuation of peak horizontal acceleration and velocity fromItalian strong-motion records, Bull. Seism. Soc. Am. 77, 1491–1513.
Schnabel, B., Lysmer, J., and Seed, H.: 1972, Shake: a Computer Program for Earthquake ResponseAnalysis of Horizontally Layered Sites, Rep. E.E.R.C. 70-10, Earthq. Eng. Research Center, Univ.California, Berkeley.
Vaccari, F., Suhadolc, P., and Panza, G. F.: 1990, Irpinia, Italy, 1980 earthquake; waveform modellingof strong motion data, Geophys. J. Int. 101, 631–647.
Vinale, F.: 1988, Caratterizzazione del sottosuolo di un’area campione di Napoli ai fini d’una micro-zonazione sismica, Rivista Italiana di Geotecnica 22, 77–100.


