
March 10, 2012 11:35 WSPC/S0218-1274 1250028
International Journal of Bifurcation and Chaos, Vol. 22, No. 2 (2012) 1250028 (23 pages)c© World Scientific Publishing CompanyDOI: 10.1142/S0218127412500289
ZERO-DIFFUSION DOMAINS INREACTION–DIFFUSION MORPHOGENETIC
AND EPIDEMIOLOGIC PROCESSES
JACQUES DEMONGEOT∗AGIM, FRE UJF-CNRS 3405,
University J. Fourier of Grenoble, Faculty of Medicine,38 700 La Tronche, [email protected]
JEAN GAUDARTLERTIM, EA 3283, Aix-Marseille University, Faculty of Medicine,
27 Bd Jean Moulin, 13385 Marseille Cedex 5, [email protected]
ATHANASIOS LONTOS†, JULIE MINTSA‡,EMMANUEL PROMAYON§ and MUSTAPHA RACHDI¶
TIMC-IMAG, UMR UPMF-CNRS 5525, AGIM,University P. Mendes-France of Grenoble, Faculty of Medicine,
38 700 La Tronche, France†[email protected]
‡[email protected]§[email protected]
Received December 15, 2011
Classical models of morphogenesis by Murray and Meinhardt and of epidemics by Ross andMcKendrick can be revisited in order to consider the colocalizations favoring interaction betweenmorphogens and cells or between pathogens and hosts. The classical epidemic models suppose, forexample, that the populations in interaction have a constant size and are spatially fixed duringthe epidemic waves, but the presently observed pandemics show that the long duration of theirspread during months or years imposes to take into account the pathogens, hosts and vectorsmigration in epidemics, as well as the morphogens and cells diffusion in morphogenesis. Thatleads naturally to study the occurrence of complex spatio-temporal behaviors in dynamics ofpopulation sizes and also to consider preferential zones of interaction, i.e. the zero-diffusion sets,for respectively building anatomic frontiers and confining contagion domains. Three examplesof application will be presented, the first proposing a model of Black Death spread in Europe(1348–1350), and the last ones related to two morphogenetic processes, feather morphogenesisin chicken and gastrulation in Drosophila.
Keywords : Morphogenesis modeling; epidemics modeling; zero-diffusion set; periodic solutions;population size dynamics; gastrulation; feather morphogenesis; Black-Death spread.
∗Author for correspondence
1250028-1
March 10, 2012 11:35 WSPC/S0218-1274 1250028
J. Demongeot et al.
1. Introduction
Recent advances in morphogenesis and epidemicsmodeling have been obtained by introducing demo-graphic aspects, i.e. by considering morphogen, cell,pathogen, host and vector populations whose globalsize changes during morphogenetic, epidemic andendemic histories, as well as spatial aspects abouttheir diffusion, spread or genetic changes [Gaudartet al., 2007, 2009, 2010a, 2010b; Glade et al., 2007;Abbas et al., 2009; Horie et al., 2010; Demongeotet al., to appear].
In epidemic studies, for example, the math-ematical toolbox allowing these improvementshas been introduced making classical models[Bernoulli, 1760; d’Alembert, 1761; Murray, 1763;L’Epine, 1764; de Baux, 1766; May, 1770; Lambert,1972; Trembley, 1796; Sprengel, 1815; Ross, 1916;McKendrick, 1925; Kermack & McKendrick, 1932,1933; Mac Donald, 1957; Barry & Gualde, 2006]more realistic, hence more convenient for predictingand anticipating the spread, and also testing scenar-ios (like vaccination or any health policy limitingthe contagion). As applications, infectious diseasedynamics, the Black Death spread during the mid-dle age in Europe, and the dynamics of two impor-tant processes, feather morphogenesis in chickenand gastrulation in Drosophila, will be studied inthe present paper.
Despite their simplicity, the models presentedaccount qualitatively for the global shape of theendemic spatial distributions and of the morpho-genetic patterns. Some perspectives will be drawnconcerning the present epidemic risks: a modellike that used for the Black Death spread retro-prediction would be, “mutatis mutandis”, usefulto predict the dynamical behavior of the futureepidemics, by considering the population fluxesalong the modern aerial routes, responsible of therapid dissemination of the pathogenic agents andinfectives in the present pandemics [Khan et al.,2009].
2. Introduction to ClassicalEpidemiology: TheRoss–McKendrick Model
In the seminal work by Bernoulli [Bernoulli, 1760;Dietz & Heesterbeek, 2000, 2002; Zeeman, 1993]proposed for explaining the small pox dynamics,the population was divided into susceptibles (notyet been infected) and immunes (immunized for
the rest of their life after one infection). In [Ross,1916; McKendrick, 1925; Kermack & McKendrick,1932, 1933] is proposed a more sophisticatedmodel called Susceptible/Infective/Recovered withimmunity (SIR) model, with Eqs. (1):
dS
dt= δS + δI + (δ + γ)R − βSI − δS,
dI
dt= βSI − (ν + δ)I, (1)
dR
dt= νI − (δ + γ)R,
Or equivalently:
dS
dt= −βSI + δ(S + I + R) − δS + γR
dI
dt= +βSI − (δ + ν)I (2)
dR
dt= νI − (δ + γ)R
where S (resp. I, R) denotes the size of Suscepti-ble (Infective, Recovered) population with S + I +R = N , β (resp. δ, γ, ν) being the contagion (resp.death/birth, loss of resistance, immunization) rate.The epidemic parameter R0 = βN/(ν + δ) is themean number of secondary infecteds by one pri-mary infective and predicts, if it is greater than 1,the occurrence of an epidemic wave. By defining ageclasses Si, Ii and Ri (i = 1, . . . , n) in each subpop-ulation S, I and R, we have at any stationary state(S∗, I∗, R∗) the following relationships:
u∗(i) =S∗
i
S∗1
, ν∗(i) =I∗iI∗1
, w∗(i) =R∗
i
R∗1
(3)
where the probabilities for a newborn being aliveand either susceptible u∗(i), infected ν∗(i) orimmune w∗(i) at age i make the link between theBernoulli and the Ross–McKendrick models, butthe weakness of the latter still resides in many insuf-ficiencies and approximations:
• when the population size of either susceptibles orinfectives tends to be very large, the quadraticterm SI has to be replaced by a saturation term(e.g. Michaelian) SI /[(k + S)(j + I)]
• the immunized infectives or healthy carriers areneglected
• the total population size is supposed to be con-stant, the fecondity just equalling the naturalmortality. The Bernoulli model is taken implicitly
1250028-2
March 10, 2012 11:35 WSPC/S0218-1274 1250028
Zero-Diffusion Domains in Reaction–Diffusion Morphogenetic and Epidemiologic Processes
into account the fecundity, and explicitly thenatural mortality. The model by d’Alembert[1761] improved that of Bernoulli’s by distin-guishing the specific mortality due to the infec-tious disease from the natural one, being morewidely applicable than the model by Bernoulliwhich was restricted to immunizing infections.d’Alembert’s method requires the knowledgeabout the survival function after eliminatingthe specific cause of death due to the infec-tious disease, but Bernoulli’s approach providesmore insight for a mechanistic interpretation ofinfection
• variables and parameters do not depend on space(no migration)
• parameters do not depend on time (no geneticadaptation of infectious agent or human popula-tion, even very slow compared to the fast dynam-ics of epidemics).
We will improve in the following the Ross–McKendrick model by trying to partially com-pensate these defects. We will first introduce theage classes into the host population in order toaccount for its growth, the space dependence inorder to account for the host and vector popula-tion migration and their possible coexistence, beforepresenting an example of application and drawingperspectives. The genetic changes resulting from theadaptation of the concerned populations will be nottreated in this paper.
3. Epidemics Modeling withDemography and Diffusion
By exploiting the remarks formulated in the previ-ous section about the classical models of epidemicmodeling, we now consider the possibility to mergethe demographic dynamics introduced in [Demon-geot, 2009] and the reaction–diffusion, by simpli-fying the von Foerster dynamics: we suppose thatthe biological age is identical to the chronologicalone and we choose for the host or vector popula-tions dynamics the classic Fisher’s equation [Fisher,1937] with a logistic demographic term. We provein the following that the asymptotic behavior ofthe spatial spread of the population size n(s, t)over the spatial coordinates has a Gaussian shape.For the sake of simplicity, we consider the prob-lem as isotropic and the space coordinate s asunidimensional.
Proposition 1. Let us consider the Fisher equationdefined by :
∂n
∂t= ∆n + n(K − n)
with the initial conditions: n(·, 0) = δ0, where δ0 isthe Dirac’s distribution in 0. Its asymptotic solution(t tending to infinity) is given by :
n(s, t) = Kexp(−s2
4t− exp(−Kt)
K
)(4πt)−1/2
Proof. Let us suppose that ∂n∂t = ∆n + n(K − n).
For nK � 1 (resp. n
K � 0), we have:
n(K − n) � −nK ln( n
K
)(resp. � nK).
Then, if we consider the solution n1 of the heatoperator, with n1(·, 0) = δ0, and the solution n2 ofthe logistic equation
∂n2
∂t= −n2K ln
(n2
K
),
with n2(·, 0) = δ0, we have:
(1) If n1(s, t) = exp(− s2
4t )(4πt)−1/2, then ∂n1∂s =
−sn12t , hence
∆n1 =∂2n1
∂s2= −n1
2t+ s2 n1
4t2and
∂n1
∂t=(
s2
4t2− 1
2t
)n1 = ∆n1
(2) If n2K � 1 (resp. n2
K � 0), n2(s, t) =K exp(−exp(−Kt)/K) (resp. n′
2(s, t) =exp(Kt)) is a solution of
∂n2
∂t= −n2K ln
(n2
K
) (resp.
∂n′2
∂t= n′
2K
).
Let us consider now n = n1n2; we have:
∂n
∂t=
n2∂n1
∂t+ n1
∂n2
∂t
= n2∆n1 −n1n2K ln(
n2
K
), if
n2
K� 1
n′2∆n1 − n1n
′2K, if
n2
K� 0
1250028-3
March 10, 2012 11:35 WSPC/S0218-1274 1250028
J. Demongeot et al.
Because n2 (resp. n′2) is independent of s, then
n2∆n1 = ∆n (resp. n′2∆n1 = ∆n) and we have:
n1n2K ln(
n1
K
)
= K exp(−exp(−Kt)
K− s2
4t
)
×[−s2
4t− ln(4πt)
2− ln(K)
](4πt)−1/2
tends to 0 when t tends to infinity, for every s.Then
n = n1n2
= K exp(−s2
4t− exp(−Kt)
K
)(4πt)−1/2
is the approximate asymptotical solution of theFisher equation.It is the same for
n1n′2K ln
(n1
K
)
= K exp(
Kt − s2
4t
)
×[−s2
4t− ln(4πt)
2− ln(K)
](4πt)−1/2
tends to 0, when t tends to 0. Then
n = n1n2
= K exp(−s2
4t− exp(−Kt)
K
)(4πt)−1/2
is asymptotically in t the solution of the Fisherequation ∂n
∂t = ∆n + n(K − n), n = n1n′2 being
the approximate solution when t is small. �
If we consider that the diffusion and the demo-graphic growth are slow compared to the fast epi-demic dynamics, then the initial condition of theFisher equations is the stable steady state of thereaction part of the system of Eqs. (4), defined by:
∂S
∂t= ∆S + S(K1 − S) − bSI + k1S − k3I
ε
∂I
∂t= ∆I + I(K2 − I) +
bSI − k2I
ε
(4)
Proposition 2. If we denote the fast endemicsteady state of (4), supposed to be stable, by (S∗, I∗),then we have as asymptotic (in t) solution of (4) theGaussian functions:
S(s, t) = S∗η
exp(−s2
4t− exp(−K1t)
K1
)(4πt)−1/2
exp(− s2
4t∗− exp(−K1t
∗)K1
)(4πt∗)−1/2
I(s, t) = I∗η
exp(−s2
4t− exp(−K2t)
K2
)(4πt)−1/2
exp(− s2
4t∗− exp(−K2t
∗)K2
)(4πt∗)−1/2
for t ≥ t∗, where t∗ denotes the first time where(S(s, t∗), I(s, t∗)) approximates (S∗, I∗) with a pre-cision equal to ε in Euclidean norm:
((S(s, t∗) − S∗)2 + (I(s, t∗) − I∗)2)1/2 = ε
Proof. The result is the direct consequence ofProposition 1 and of the fastness of the epidemicdynamics. �
There is an asymptotic identity between thezero-diffusion lines of the susceptibles and of theinfecteds, if the asymptotic mode and variance oftheir Gaussian diffusion functions are the same.When the contagion coefficient b is considered asdepending on space, we choose b(s) as maximal,equal to b∗, on zero-diffusion lines, i.e. where sus-ceptibles and infecteds have the maximum chanceto coexist and we denote the steady state values ofthe fast epidemic dynamics (for b∗) as S∗∗ and I∗∗.If there is no asymptotic identity, we can define b(s)as inversely proportional to the distance between sand the zero-diffusion set located around the con-centration peaks.
Let us suppose now that the fast dynamics arethe demographic and epidemic ones and that theyare driven by the following differential equations:
dx
dt= kx(N − x) − C
xy
(K + y)− kk1x
dy
dt= fy + C
xy
(K + y)− k2y,
(5)
where the host population growth (its size beingrepresented by the variable x) is logistic, the fecun-dity being limited by a Malthusian term dependingon the maximal population size N . The contagion
1250028-4

March 10, 2012 11:35 WSPC/S0218-1274 1250028
Zero-Diffusion Domains in Reaction–Diffusion Morphogenetic and Epidemiologic Processes
interaction is supposed to have a Michaelian sat-uration term [Crauste et al., 2008] for controllinga possible excess of infective vectors (whose popu-lation size is y), and the mortality is assumed tobe different between host and vector. By denotinga = k(N − k1) and b = −f + k2, the system (5)becomes:
dx
dt= −kx2 − C
xy
(K + y)+ ax
dy
dt= C
xy
(K + y)− by
(6)
Proposition 3. The steady states of the system (6)are of three types:
• a stable node (resp. focus) (x∗, y∗), in case ofsmall mortality of infecteds (b � 1), if
a > 1 and (C − a)(a − 1) > 2kb
(resp. a < 1, 4(1 − a)C > ab)
• a stable node, in case of fast epidemics (C � Kand a = b = C), if k ≤ 1.
• a neutral steady state (x∗∗, y∗∗) = (0, 0).
Proof. The Jacobian matrix B∗ of the system (6)at the steady state (x∗, y∗) is equal to:
B∗ =
−2kx∗ − b
y∗
x∗ + a −bK
(K + y∗)
by∗
x∗ bK
(K + y∗)− b
The nonzero stationary state is defined by:
x∗ =b
C(K + y∗) and
kx∗2 + (C − a)x∗ − bK = 0,
therefore the only positive solution, distinct fromthe saddle, is given by:
x∗ =a − C + ((a − C)2 + 4bkK)1/2
2k,
y∗ =C
bx∗ − K.
Therefore, the characteristic polynomial of thematrix B∗ − λI, denoted PB∗ , is equal to:
PB∗(λ) = λ2 +[2kx∗ + b
y∗
x∗ + b − a − bK
(K + y∗)
]λ
+ abK
(K + y∗)− ab − 2kx∗
×[b
K
(K + y∗)− b
]+ b2 y∗
x∗ = 0
and, because
b2 K
C− (2kx∗2 + (b − a)x∗ + by∗)
= bK
(b
C− 1)− (a + b − C)x∗,
we have:
2x∗λ = bK
(b
C− 1)− (a + b − C)x∗
±[(
bK
(b
C− 1)− (a + b + C)x∗
)2
+ 8kx∗2
(b2 K
C− bx∗
)
− 4b2y∗x∗ − 4abx∗(
bK
C− x∗
)]1/2
.
We also have
8kx∗2
(b2 K
C− bx∗
)− 4b2y∗x∗ − 4abx∗
(bK
C− x∗
)
= 4bx∗[− 2kx∗2 + x∗
(2bk
K
C− C + a
)
− bK
(a
C− 1)]
and
2Cx∗λ = bK(b − C) − C(a + b − C)x∗
± [[bK(b − C) − C(a + b − C)x∗]2
+ 4bCx∗[−2Ckx∗2 + (2bkK
+ C(a − C))x∗ − bK(a − C)]]1/2.
Hence, we have:
(1) if b � 1 such as bK/(C − a) � 1, then we have:
1250028-5

March 10, 2012 11:35 WSPC/S0218-1274 1250028
J. Demongeot et al.
x∗ � bK
C − a> 0, y∗ � a
K
C − a> 0, bK
(b
C− 1)− (a + b − C)x∗ � −ab2 K
C(C − a) < 0 and
8kx∗2
(b2 K
C− bx∗
)− 4b2y∗x∗ − 4abx∗
(bK
C− x∗
)� −4ab
K2
C(C − a)2
(2bk
C − a+ 1 − a
)
(x∗, y∗) is a stable node (a > 1 and (C−a)(a−1) > 2kb) or focus (a < 1 and 4a(1−a)b3K2 > akb4K2/C,i.e. 4(1−a)C > ab). For example, if we choose a = b = C/3 = 4K = 1/3 and k = 1, then: x∗ = 0.236/6,y∗ = 0.035 and the B∗ eigenvalues are given by:
λ =−0.0054 ± [(0.0054)2 + 0.052(−0.0031 − 0.0238 + 0.0093)]1/2
0.472
and (x∗, y∗) is a stable focus.(2) if a = b = C � K and k ≤ 1, then x∗ =
(CK /k)1/2, y∗ = (CK/k)1/2 − K and the B∗eigenvalues are:
λ =
[−C
2± C
2
(1 − 8
(Kk
C
)1/2)
×(
1 −(
Kk
C
)1/2)]1/2
.
Then (x∗, y∗) is a stable node.
The Jacobian matrix B∗∗ of the system (6) at thesteady state (x∗∗, y∗∗) is equal to:
B∗∗ =(
a −b
0 0
)
Then (x∗∗, y∗∗) is a neutral steady state. �
Suppose that the contagion interaction has a dou-ble Michaelian saturation term for controlling botha possible excess of susceptibles (whose populationsize is x) and of infective vectors (whose populationsize is y), then system (6) becomes:
dx
dt= −kx2 − C
xy
(J + x)(K + y)+ ax
dy
dt= C
xy
(J + x)(K + y)− by
(7)
Proposition 4. The steady states of the system (7)are of three types:
• a stable node (resp. focus) (x∗, y∗), in case of largesaturation of susceptibles (J � 1) and of smallmortality of infecteds (b � 1), if
a > 1 and(
C
J− a
)(a − 1) > 2kb
(resp. a < 1 and 4(1 − a)
C
J> ab
)
• an unstable focus, in case of slow demographicdynamics (k � 1), compared to the reaction(C > 3), with a = b < 1/2K and K > JC > 1.
• a neutral steady state (x∗∗, y∗∗) = (0, 0).
Proof. Let us prove the second assertion. If k � 1,the x2 term is neglectible, and (x∗, y∗) verifies:
Cx∗y∗
a(J + x∗)(K + y∗)� x∗ � y∗
hence
Cx∗ � a(J + x∗)(K + Cx∗)
= aJK + a(JC + K)x∗ + aCx∗2 and
aCx∗2 + (aJC + aK − C)x∗ + aJK = 0.
Then, if we denote −D = C − aJC − aK > 0, wehave:
D2 − 4a2CJK = (C + aJC − aK)2 − 4aC2J
> (C − aK)2 − 4aCK
> (C − 0.5)2 − 2C
> 0
and
2aJK > x∗ =−D − (D2 − 4a2CJK )1/2
2aC> 0.
Then the eigenvalues λ of the Jacobian matrixB∗ of system (7) at the stationary point (x∗, y∗)
1250028-6

March 10, 2012 11:35 WSPC/S0218-1274 1250028
Zero-Diffusion Domains in Reaction–Diffusion Morphogenetic and Epidemiologic Processes
are given by det(B∗ − λI) = PB∗(λ) = 0, where:
B∗ − λI =
−CJ
y∗
(J + x∗)2(K + y∗)+ a − λ −CK
x∗
(K + y∗)2(J + x∗)
CJy∗
(J + x∗)2(K + y∗)CK
x∗
(K + y∗)2(J + x∗)− b − λ
=
ax∗
J + x∗ − λ −Kb
K + y∗
Ja
J + x∗ −by∗
K + y∗− λ
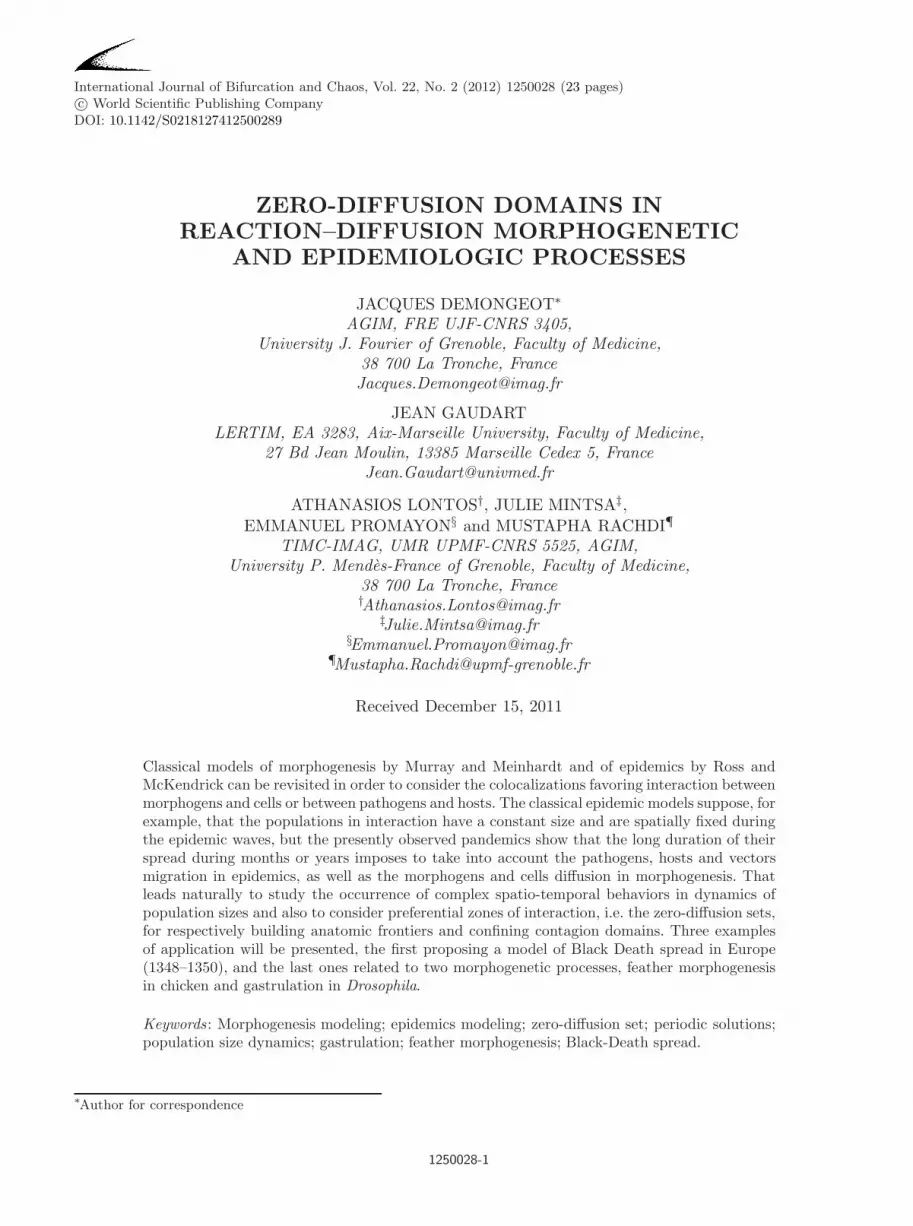
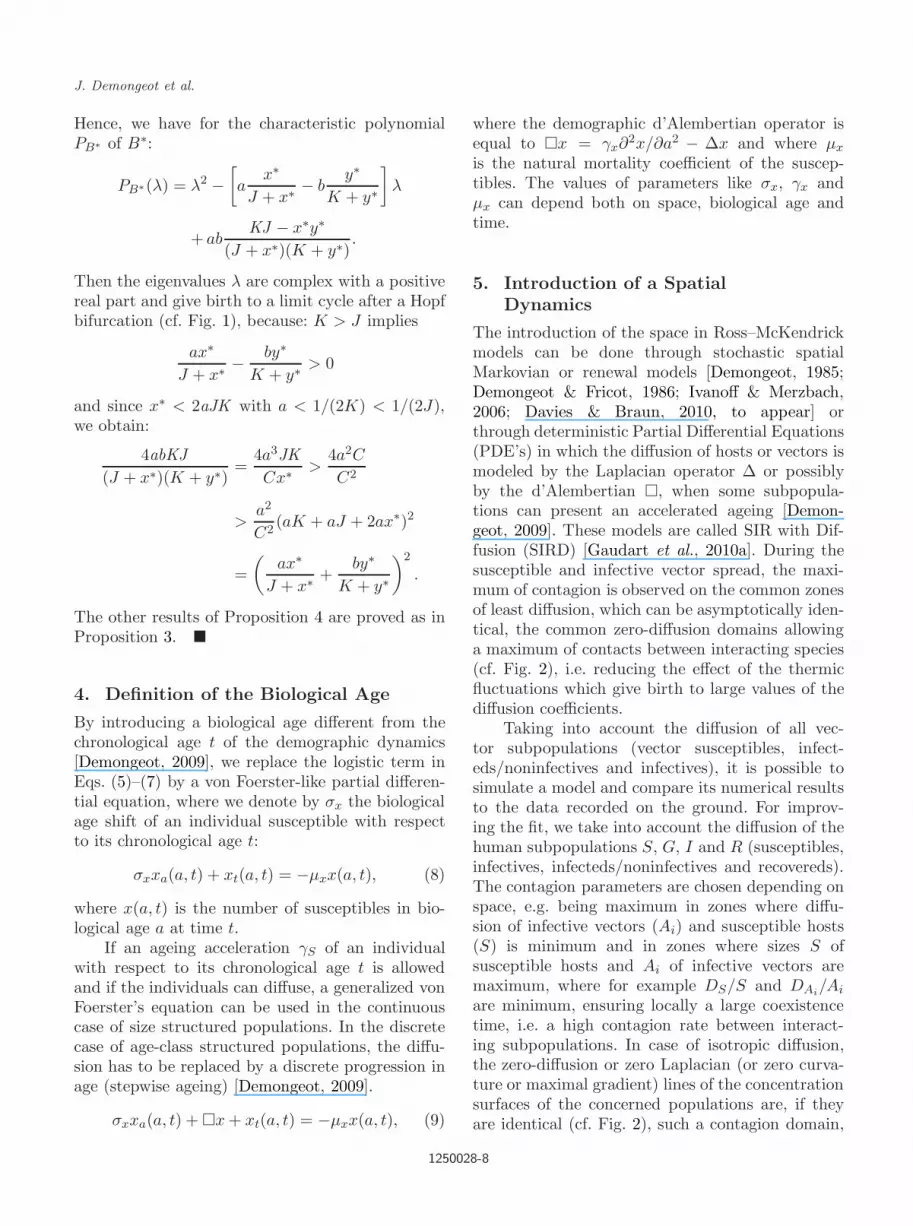
Fig. 1. Attractor of the system with double saturation (7) showing (top) a limit cycle and attractor of the system with aunique saturation term (6) showing (bottom) a stable focus for different initial conditions and for the same set of values ofparameters in cases (6) and (7) except for the affinity coefficient J (cf. for the numerical simulations the web site: http://www.zweigmedia.com/RealWorld/deSystemGrapher/func.html).
1250028-7
March 10, 2012 11:35 WSPC/S0218-1274 1250028
J. Demongeot et al.
Hence, we have for the characteristic polynomialPB∗ of B∗:
PB∗(λ) = λ2 −[a
x∗
J + x∗ − by∗
K + y∗
]λ
+ abKJ − x∗y∗
(J + x∗)(K + y∗).
Then the eigenvalues λ are complex with a positivereal part and give birth to a limit cycle after a Hopfbifurcation (cf. Fig. 1), because: K > J implies
ax∗
J + x∗ − by∗
K + y∗> 0
and since x∗ < 2aJK with a < 1/(2K) < 1/(2J),we obtain:
4abKJ(J + x∗)(K + y∗)
=4a3JKCx∗ >
4a2C
C2
>a2
C2(aK + aJ + 2ax∗)2
=(
ax∗
J + x∗ +by∗
K + y∗
)2
.
The other results of Proposition 4 are proved as inProposition 3. �
4. Definition of the Biological Age
By introducing a biological age different from thechronological age t of the demographic dynamics[Demongeot, 2009], we replace the logistic term inEqs. (5)–(7) by a von Foerster-like partial differen-tial equation, where we denote by σx the biologicalage shift of an individual susceptible with respectto its chronological age t:
σxxa(a, t) + xt(a, t) = −µxx(a, t), (8)
where x(a, t) is the number of susceptibles in bio-logical age a at time t.
If an ageing acceleration γS of an individualwith respect to its chronological age t is allowedand if the individuals can diffuse, a generalized vonFoerster’s equation can be used in the continuouscase of size structured populations. In the discretecase of age-class structured populations, the diffu-sion has to be replaced by a discrete progression inage (stepwise ageing) [Demongeot, 2009].
σxxa(a, t) + �x + xt(a, t) = −µxx(a, t), (9)
where the demographic d’Alembertian operator isequal to �x = γx∂2x/∂a2 − ∆x and where µx
is the natural mortality coefficient of the suscep-tibles. The values of parameters like σx, γx andµx can depend both on space, biological age andtime.
5. Introduction of a SpatialDynamics
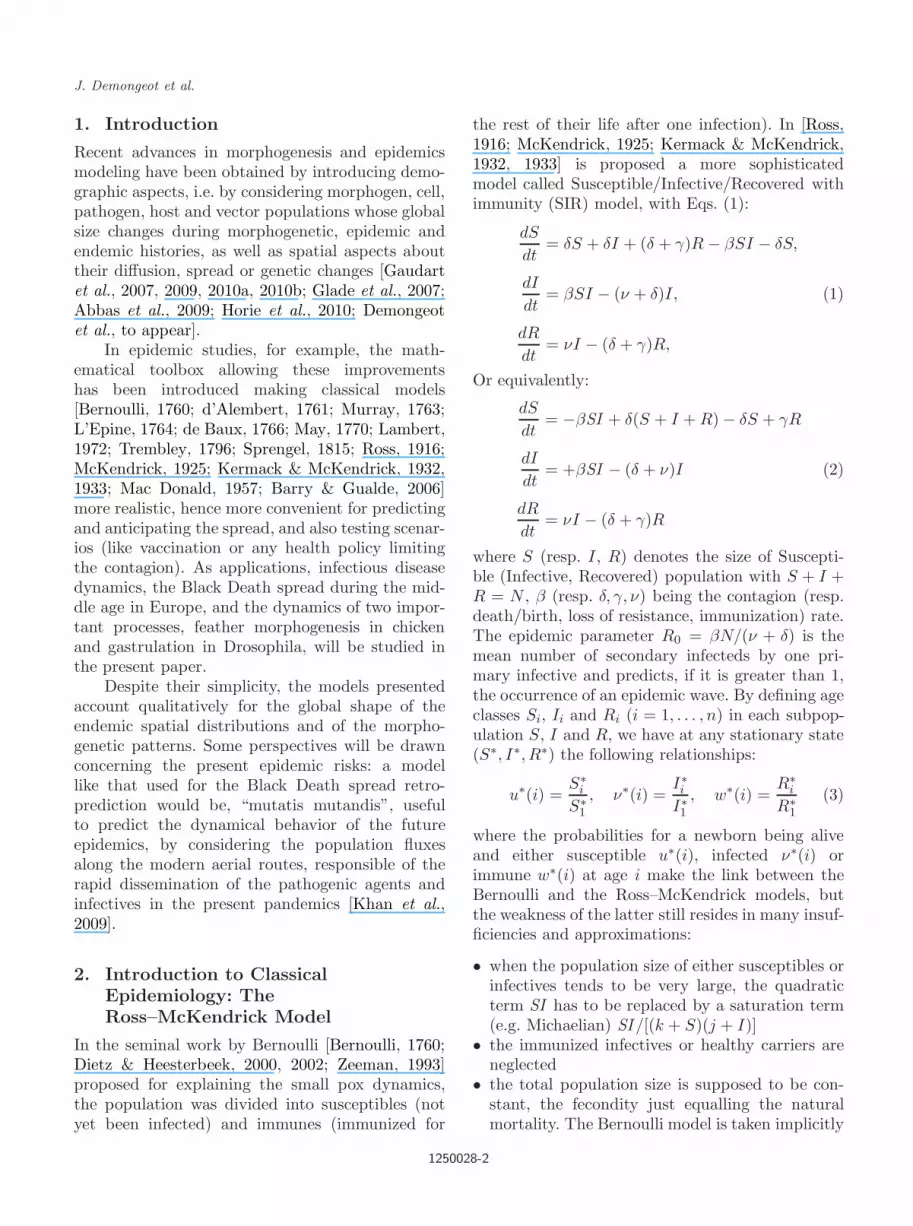
The introduction of the space in Ross–McKendrickmodels can be done through stochastic spatialMarkovian or renewal models [Demongeot, 1985;Demongeot & Fricot, 1986; Ivanoff & Merzbach,2006; Davies & Braun, 2010, to appear] orthrough deterministic Partial Differential Equations(PDE’s) in which the diffusion of hosts or vectors ismodeled by the Laplacian operator ∆ or possiblyby the d’Alembertian �, when some subpopula-tions can present an accelerated ageing [Demon-geot, 2009]. These models are called SIR with Dif-fusion (SIRD) [Gaudart et al., 2010a]. During thesusceptible and infective vector spread, the maxi-mum of contagion is observed on the common zonesof least diffusion, which can be asymptotically iden-tical, the common zero-diffusion domains allowinga maximum of contacts between interacting species(cf. Fig. 2), i.e. reducing the effect of the thermicfluctuations which give birth to large values of thediffusion coefficients.
Taking into account the diffusion of all vec-tor subpopulations (vector susceptibles, infect-eds/noninfectives and infectives), it is possible tosimulate a model and compare its numerical resultsto the data recorded on the ground. For improv-ing the fit, we take into account the diffusion of thehuman subpopulations S, G, I and R (susceptibles,infectives, infecteds/noninfectives and recovereds).The contagion parameters are chosen depending onspace, e.g. being maximum in zones where diffu-sion of infective vectors (Ai) and susceptible hosts(S) is minimum and in zones where sizes S ofsusceptible hosts and Ai of infective vectors aremaximum, where for example DS/S and DAi/Ai
are minimum, ensuring locally a large coexistencetime, i.e. a high contagion rate between interact-ing subpopulations. In case of isotropic diffusion,the zero-diffusion or zero Laplacian (or zero curva-ture or maximal gradient) lines of the concentrationsurfaces of the concerned populations are, if theyare identical (cf. Fig. 2), such a contagion domain,
1250028-8

March 10, 2012 11:35 WSPC/S0218-1274 1250028
Zero-Diffusion Domains in Reaction–Diffusion Morphogenetic and Epidemiologic Processes
Fig. 2. Coexistence of zero-diffusion zones for both susceptibles x and infecteds y, where the contagion is maximum, in thecase of an isotropic diffusion of these two populations.
where hosts, vectors and infectious agents interact.These lines correspond to regions where the meanGaussian curvature of the concentration surfaces Sand Ai vanishes, these line regions being definedrespectively by
∂2S
∂x2
∂2S
∂y2−(
∂2S
∂x∂y
)2
= 0, and by
∂2Ai
∂x2
∂2Ai
∂y2−(
∂2Ai
∂x∂y
)2
= 0.
We can show the possibility of intersection of theselines on one tangency point or on two points (cf.Fig. 2) or on whole zero-diffusion sets if they areasymptotically identical (cf. Fig. 6, bottom) forsome values of the ratio between diffusion coeffi-cients DS/DAi [Michon et al., 2008].
6. An Example of Application: TheBlack Death in Europe Between1348 and 1350
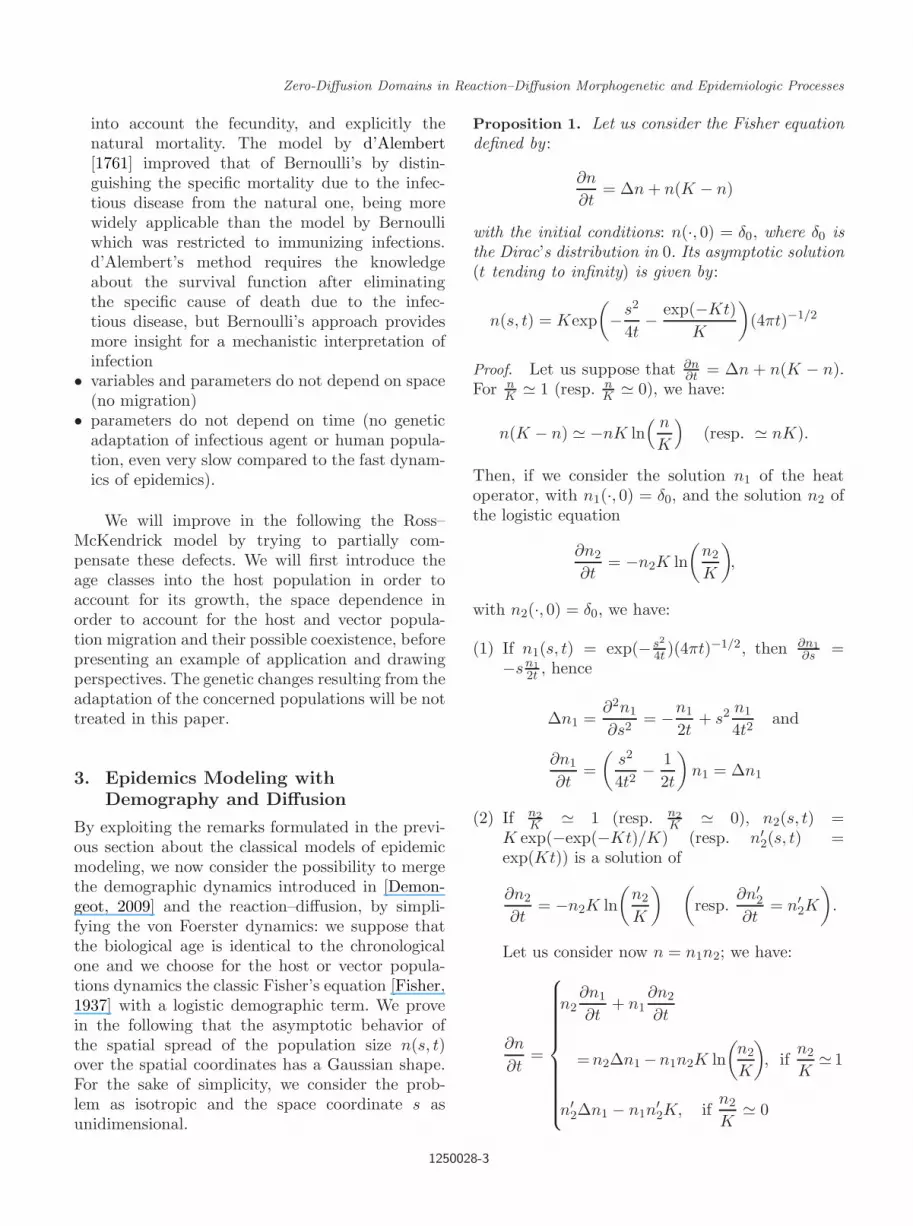
Plague was considered as endemic in the steppes ofSouthern-Russia where Mongols originated [Zhanget al., 2008]. Born in the Caspian sea area (proba-bly triggered by contacts between Mongolian andGenoa sailors and warriors during wars around1346), epidemic wave went through the Mediter-ranean routes (cf. Fig. 3). It reached ports likeMarseilles in France and Genoa in Italy at theend of the year 1347. In five years, it spreadwidely in Europe from two large commercial citiesand returned to the Caspian reservoir. A simpleSusceptible-Infective-Recovered model with Diffu-sion (SIRD) explains the essential of the observed
front wave dynamics during the years between 1348and 1350 [Gaudart et al., 2010a]. The model usesonly three coefficients: (i) a local viscosity propor-tional to the altitude, (ii) a contagion parameterand (iii) a death/recovering parameter (represent-ing the future of infecteds/infectives as dead orimmunized after being cured of the plague).
The Fisher equation [Fisher, 1937; Murray,2003] was first used for representing the evolutionof the host and vector subpopulations during thespread of the Black Death.
The model used for modeling the Black Deathspread is a SIRD model as in the Bankoumanastudy [Gaudart et al., 2007, 2009, 2010a], but with-out vector terms and has for its reaction termthe form of a Lotka–Volterra Ordinary DifferentialEquation (ODE) of dimension 3, plus a diffusionterm:
dS
dt= ε∆S − βSI ,
dI
dt= ε∆I + βSI − γR, (10)
dR
dt= ε∆R + γR,
where βSI term comes from the “law of massaction”, assuming homogeneous mixing betweensusceptibles and infecteds, β being the rate of tran-sition from susceptible to infected state calculatedper infected and per susceptible, γ is the rate oftransition from infected to post-infected state (e.g.death or immunity) per infected person and ε isthe diffusion coefficient. By taking the viscosity(inverse of ε) proportional to the altitude, the sim-ulated front waves are more similar to the observed
1250028-9

March 10, 2012 11:35 WSPC/S0218-1274 1250028
J. Demongeot et al.
Fig. 3. Top left: Spread of bubonic plague over sea and overland routes (after 〈http://www.cosmovisions.com/ChronoPestesMA02.htm〉). Top right: Observed wave fronts after 1 (red), 2 (blue) and 3 (green) years of spread from thetwo initial Mediterranean entry ports Genoa and Marseilles (1348) until the Atlantic ocean (1350) [Mocellin-Spicuzza, 2002];black grid corresponds to the collected altitudes. Bottom: Simulation of Eq. (10) with wave fronts of concentration of infectedsI after 3 (left) and 12 (right) months from Marseilles and Genoa.
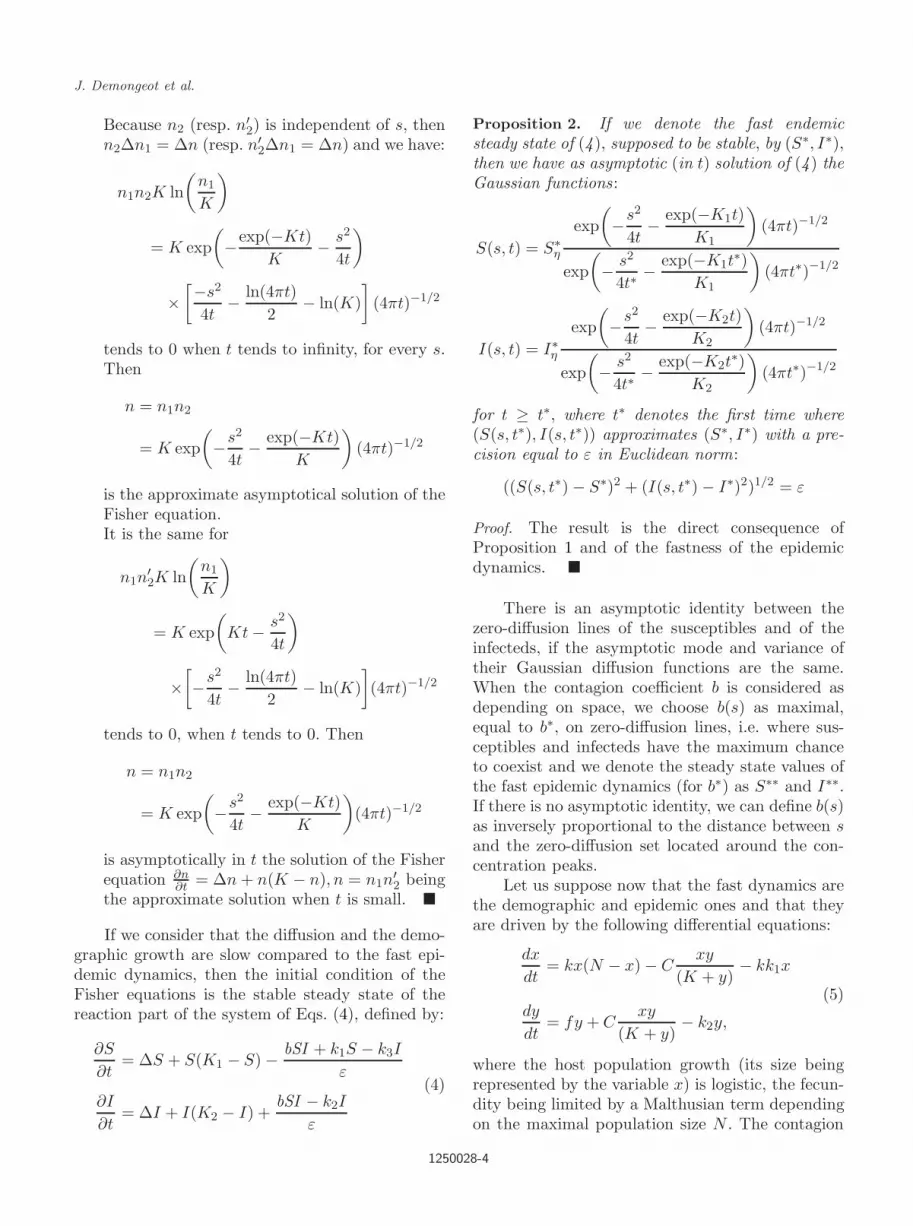
ones (cf. Fig. 3) than in the previous simulations[Murray, 2003]. The initial population size of sus-ceptibles in the main middle age cities has beenfixed following the demographic data. The resultsof simulations (cf. Fig. 3, bottom) are in agree-ment with the data observed in the 370 hospitalsof the order of St. Anthony (cf. Fig. 3, top right).Improvements could come from considering multi-ple entrance points (ports like Barcelona reachedin June 1348 or La Rochelle, Rouen and Doverreached later in 1348), and taking into account allthe commercial sea (Mediterranean and Atlantic)and overland routes (cf. Fig. 3, top left) as wellas the demography (fecundity and natural mortal-ity). The present endemic state (cf. Fig. 4) could be
explained by a new model taking into account theair routes [WHO, 1999]. An efficient prediction fromsimulations of a realistic model considering newaerial routes with a minimal viscosity [Khan et al.,2009] could serve this cause. Another improvementcould come from introducing saturation effects likethose made explicit in system (7). The contagionparameter β could also be chosen depending onspace, e.g. maximum in zones which constituteoverlaps between domains where diffusion of infec-tive vectors and hosts is minimum and domainswhere concentration of susceptibles is maximum,ensuring locally a large coexistence time, hence ahigh contagion rate between these large interactingsubpopulations.
1250028-10

March 10, 2012 11:35 WSPC/S0218-1274 1250028
Zero-Diffusion Domains in Reaction–Diffusion Morphogenetic and Epidemiologic Processes
Fig. 4. World distribution of plague in 1998 (after [WHO, 1999]).
7. The Feather PrimordiaMorphogenesis
The feather primordia morphogenesis is an embry-onic process, which allows to well position adultfeathers permitting, for example, the peacock to dothe wheel in order to attract the female (cf. Fig. 5).
The reaction–diffusion system corresponding tothe feather primordia morphogenesis [Michon et al.,2008] rules three variables, the density n of migrantprimordial cells and the concentration u (resp. v)of an activator (resp. inhibitor), the BMP-7 (resp.BMP-2), following the equations:
∂n
∂t= −�n − β
∂n
∂a+ ∇(χn∇u),
∂u
∂t= Du∆u + f0(u, v) − kuu, (11)
∂v
∂t= Dv∆v + g0(u, v) − kvv,
with f0(u, v) = c1nu2/(1 + v), g0(u, v) = c2nu2,n(s, 1, t) =
∫M1 2QβCn(s, a, t)n(s, a, t)da, and also
with Neumann boundary conditions. For the sake ofsimplicity, we will use in the following a simplified
equation for n:
∂n
∂t= Dn∆n −∇(χn∇u) + bn(1 − n). (12)
Then it is possible to derive explicitly Turing’sinstability necessary conditions [Turing, 1952],where us (resp. vs) denotes the stationary concen-tration of u (resp. v) and f0u (resp. g0u) the firstderivative of f0 (resp. g0) with respect to u at(us, vs):
(1) f0u + g0u < 0 ⇒ 2c1kvus/(kv + c2u2s) − ku
− kv < 0,(2) f0ug0v − f0vg0u > 0 ⇒ −2c1k
2vus/(kv + c2u
2s) +
kukv +2c1c2k2vu
3s/(kv + c2u
2s)2 > 0⇒−2c1k
3vus/
(kv + c2u2s)
2 + kukv > 0(3) Dug0v +Dvf0u < 0 ⇒ 2Dvc1kvus/(kv + c2u
2s)−
Dvku − Dukv < 0(4) (Dug0v +Dvf0u)2 > 4DuDv(f0ug0v −f0vg0u) ⇒
2Dvc1kvus/(kv + c2u2s) − (Dvku + Dukv) >
(4DuDvkukv − 8DuDvc1k3vus/(kv + c2u
2s)
2)1/2.
If v � 1 and n are near their stationary value, e.g. ifDn, χ and b are large, such that the system reachesrapidly its slow (u, v) manifold, we can decompose
1250028-11

March 10, 2012 11:35 WSPC/S0218-1274 1250028
J. Demongeot et al.
Fig. 5. Feather morphogenesis with identification of an activator u (BMP-7), an inhibitor v (BMP-2) and a mediator (Follis-tatine) as morphogens (left) interacting at the genetic level, where Gu (resp. Gv) and Ou (resp. Ov) denote the gene codingfor u (resp. v) and its operator (top middle and bottom right) for giving first feathers primordia and after, adult feathersallowing the wheel of feathers in the peacock (top right).
the two last equations of (11) in order to get apotential-Hamiltonian system, with:
∂u
∂t= −∂P
∂u+
∂H
∂v,
∂v
∂t= −∂P
∂v− ∂H
∂u,
P =kuu2 + kvv
2
2,
H = c1nu2 ln(1 + v) − c2nu3
3.
Then c1 and c2 (resp. ku and kv) can be consideredas frequency (resp. amplitude) modulating param-eters [Demongeot et al., 2007a, 2007b; Forest et al.,2007; Glade et al., 2007] and the synchronizabil-ity can be estimated by considering the isochronslandscape of the simplified system [Demongeot &Francoise, 2006; Ben Amor et al., 2010].
The very last important parameter is the ratiobetween the diffusion coefficients Du/Dv, which isless than 1 as usually in lateral inhibition [Demon-geot et al., 2009]: if the ratio is equal to the criti-cal value 0.06, we observe both in experiments (cf.
Fig. 5) and in simulations (cf. Fig. 6) a temporo-spatial synchrony between the effectors u and v.Both experiments and simulations show a coinci-dence of their remarkable Gaussian lines, i.e. theprojections of the null-curvature lines on the uand v concentration surfaces, defined by the follow-ing equations expressing the vanishing of the meanGaussian curvature:
Cu(x, y, t) =∂2u
∂x2
∂2u
∂y2−(
∂2u
∂x∂y
)2
= 0,
Cv(x, y, t) =∂2v
∂x2
∂2v
∂y2−(
∂2v
∂x∂y
)2
= 0.
These two remarkable lines for the effectors u and vcoincide for the critical value of Du/Dv = 0.06 (cf.Fig. 6). The 2D projections of these lines form frontwaves moving in the same direction as the frontsof the concentration contour lines, and where theycoincide, the diffusion term vanishes and u and v aresusceptible to form at this location a self-assemblylike the phospho-lipo-proteic plasmic membraneor the inner mitochondrial membrane [Demongeotet al., 2007c]. The coexistence at this common leastdiffusion location of migrant cells n as well as
1250028-12

March 10, 2012 11:35 WSPC/S0218-1274 1250028
Fig
.6.
Coin
ciden
ceof
the
null-c
urv
atu
relines
of
u(i
nre
d)
and
v(in
blu
e)co
nce
ntr
ation
surf
ace
s,w
hen
Du/D
vva
ries
from
0.0
5(lef
t)to
0.0
7(r
ight)
.For
Du/D
v=
0.0
6(m
iddle
),th
eco
inci
den
ceis
per
fect
on
the
centr
alpart
ofth
epic
ture
,w
hic
hco
rres
ponds
roughly
toth
eex
per
imen
talva
lue
ofth
ediff
usion
coeffi
cien
tsra
tio.
1250028-13

March 10, 2012 11:35 WSPC/S0218-1274 1250028
Fig
.7.
On
the
four
thum
bnails
(lef
t)dim
inishin
gk
v(f
rom
35
to0
wit
hst
epof5)
cause
sth
edec
rease
ofth
efe
ath
ernum
ber
and
am
plitu
de.
On
the
four
thum
bnails
(rig
ht)
dim
inis
hin
gc 2
(fro
m4500
to1200
wit
hst
ep1100)
cause
sfe
ath
erm
oti
fsdispariti
on
and
diff
usion
win
sov
erre
act
ion.
1250028-14
March 10, 2012 11:35 WSPC/S0218-1274 1250028
Zero-Diffusion Domains in Reaction–Diffusion Morphogenetic and Epidemiologic Processes
morphogens u and v permits indeed to build ananatomic boundary for the future feathers, avoid-ing chemical reactions between these components,which change their physical nature and involve ther-mic fluctuations (hence no zero diffusion). Thesephenomena are summarized in Fig. 6 which showsthe coincidence (or the spatial synchrony) betweenthe remarkable lines in 2D, suggesting that thismechanism can be permitted in many circumstancesof formation of an anatomic boundary: for exam-ple, in [Demongeot et al., 2007c], a lateral inhi-bition mechanism is also used to show a spatialsynchrony between transmembrane proteins (theATPase and the Translocase) allowing the realiza-tion of a variational principle, which maximizes themitochondrial ATP production and minimizes themean free path of adenylates inside the mitochon-drion, by favoring the spatial vicinity between theATPase and Translocase sites inside the inner mito-chondrial membrane. Many other parameters likec2 and kv are critical for the occurrence of feathers(cf. Fig. 7).
8. The Gastrulation Process
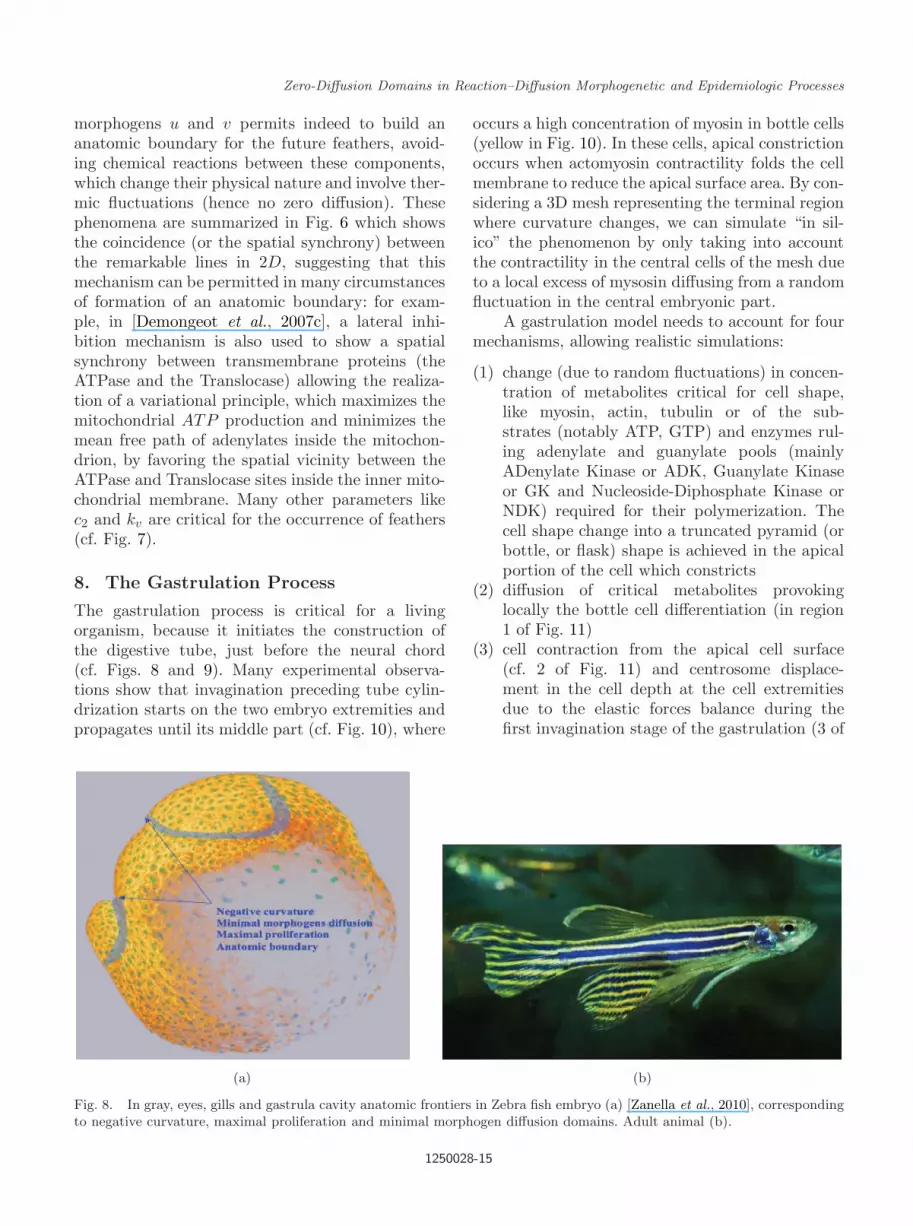
The gastrulation process is critical for a livingorganism, because it initiates the construction ofthe digestive tube, just before the neural chord(cf. Figs. 8 and 9). Many experimental observa-tions show that invagination preceding tube cylin-drization starts on the two embryo extremities andpropagates until its middle part (cf. Fig. 10), where
(a) (b)
Fig. 8. In gray, eyes, gills and gastrula cavity anatomic frontiers in Zebra fish embryo (a) [Zanella et al., 2010], correspondingto negative curvature, maximal proliferation and minimal morphogen diffusion domains. Adult animal (b).
occurs a high concentration of myosin in bottle cells(yellow in Fig. 10). In these cells, apical constrictionoccurs when actomyosin contractility folds the cellmembrane to reduce the apical surface area. By con-sidering a 3D mesh representing the terminal regionwhere curvature changes, we can simulate “in sil-ico” the phenomenon by only taking into accountthe contractility in the central cells of the mesh dueto a local excess of mysosin diffusing from a randomfluctuation in the central embryonic part.
A gastrulation model needs to account for fourmechanisms, allowing realistic simulations:
(1) change (due to random fluctuations) in concen-tration of metabolites critical for cell shape,like myosin, actin, tubulin or of the sub-strates (notably ATP, GTP) and enzymes rul-ing adenylate and guanylate pools (mainlyADenylate Kinase or ADK, Guanylate Kinaseor GK and Nucleoside-Diphosphate Kinase orNDK) required for their polymerization. Thecell shape change into a truncated pyramid (orbottle, or flask) shape is achieved in the apicalportion of the cell which constricts
(2) diffusion of critical metabolites provokinglocally the bottle cell differentiation (in region1 of Fig. 11)
(3) cell contraction from the apical cell surface(cf. 2 of Fig. 11) and centrosome displace-ment in the cell depth at the cell extremitiesdue to the elastic forces balance during thefirst invagination stage of the gastrulation (3 of
1250028-15

March 10, 2012 11:35 WSPC/S0218-1274 1250028
J. Demongeot et al.
Fig. 9. Building gastrulation cavity with invagination first phase showing four types of cells: (1) the exothelial, (2) the bottle(BC on middle left, arch “keystone”), (3) the trapezoidal and (4) the endothelial (top). Genetic network ruling the gastrulation,with only two fixed point attractors, if genes b and c vanish (middle right and bottom).
Fig. 11), which is purely mechanical withoutproliferation
(4) cell cycle arrest for bottle cells [Kurth, 2005]and after, proliferation at the end of gastru-lation, consolidating the tube formation (4 ofFig. 11). For example, the onset of gastrulation
in rodents is associated with the start of bot-tle cell differentiation within the embryo properand after, with a dramatic increase in the rateof growth and proliferation, the cell cycle timebeing 7 h to 7.5 h in ectoderm and mesoderm,but 3 h to 3.5 h in the cells of the primitive
1250028-16

March 10, 2012 11:35 WSPC/S0218-1274 1250028
Zero-Diffusion Domains in Reaction–Diffusion Morphogenetic and Epidemiologic Processes
Fig. 10. Progressive invagination due to the first bottle cell differentiation in gastrulation process: experimental data (top left,from http://www.molbio1.princeton.edu/wieschaus/); tentative mechanism of propagation of the random myosin fluctuation(in blue, top right); model with myosin diffusion (in red) and cell contraction, yellow color indicating the zones of minimaldiffusion (middle left) with explanation of the inward movement (middle right) and central mesh contraction showing theterminal invagination in axonometric and profile views, with calculation of forces exerted by the elastic constraints propagationon a central and distal cell, located respectively on the cylindric (A) and curved terminal (B) parts of the embryo (bottom).
1250028-17

March 10, 2012 11:35 WSPC/S0218-1274 1250028
J. Demongeot et al.
(a)
Fig. 11. (a) First steps of the gastrulation with (1) diffusion of constriction metabolites from the first bottle cells (in blue),(2) occurrence of the invagination from the initial bottle cell and (3) proliferation of bottle cells, before (4) closing and enlargingthe tube. (b) Curves showing the cell surface S over cell volume V ratio (S/V ) depending on the mode of attachment of themyosin fibers inside the cells A and B of Fig. 10.
1250028-18

March 10, 2012 11:35 WSPC/S0218-1274 1250028
Zero-Diffusion Domains in Reaction–Diffusion Morphogenetic and Epidemiologic Processes
(b)
Fig. 11. (Continued)
streak, whose total cell cycle time is reducedby shortening S and G2, as well as G1 in con-trast to cells later in development, where thecell cycle duration is modulated by varying theG1 length [Mac Auley et al., 1993].
The gastrulation model formalizes the mechanismscausing the mechanical perturbations due to thefirst bottle cell differentiation (cell 2 in blue ofFig. 11); after the apical constriction of the uppercells (cf. Figs. 10 and 11) and myosin diffusion, eachcell evolves with its walls following the Newton law:the sum of exerted forces is equal to the accelerationof the wall in the resultant direction (the mass ofa wall being equal to 1), and each cell is submittedto forces related to internal and external pressures(created by elastic forces applied from the centro-some to the cells’ extremities in Fig. 10, bottom),plus contact forces imposed by neighbor cells. Eachforce is orthogonally applied to the concerned cellwall and is proportional to its length, coefficientsbeing either the pressure or the cadherins concen-tration. The updating of each cell force balance issequential: when a cell moves, it takes its neigh-bors with itself. These movements cause variations
of cells areas: we suppose that growth occurs wherethe forces are high and cells are incompressible.After a radial division due to a small nutritivesurface/volume ratio of the bottle cells (followingthe Thom’s law, described in [Forest & Demon-geot, 2004, 2008; Forest et al., 2004, 2006]), we sup-pose that the growth in G1 following the mitosisincreases this ratio, ensuring a convenient nutri-tion. Cells are often shaped by requirements of cellsurface S over volume V ratio (S/V ) and namelyintestinal cells have tendency to increase the areathrough which nutrients are absorbed [Stanek, 1983;Miller & Levine, 2002]. Ratio S/V decreases wheninvagination occurs (cf. Fig. 9, bottom), especiallyif actomyosin fibers are orthogonal to microtubules[Silverman-Gavrila et al., 2008], depolymerizationreducing the extent of the apical constriction [Lee &Harland, 2010]. Forces exerted on walls push centro-some and nucleus to move in the cell depth at thelevel of the first curved distal parts of the embryo(cf. Figs. 9 and 10) in agreement with experiments[Leptin & Grunewald, 1990], due to the location ofthe elastic forces application points supposed to bethe same on neighbor walls, located at the cadherinand myosin-membrane-attached sites [Inoue, 1995;
1250028-19
March 10, 2012 11:35 WSPC/S0218-1274 1250028
J. Demongeot et al.
Angst et al., 2001; Laevsky & Knecht, 2003; Han-son et al., 2007]. Expression of genes like Rho (cf.Fig. 9) ruling enzymes and carrier proteins neededfor controlling metabolites critical for cell shap-ing [Chisholm, 2006] depends on a genetic regula-tory network described in [Leptin, 1999; Demongeotet al., 2003; Aracena et al., 2006]. Figure 9 shows theminimal architecture having four attractors corre-sponding to the four cell types needed for achievingthe digestive tube.
The domains of minimal diffusion of myosinare shown in yellow in Fig. 10 and are locatedon the frontiers of the invagination (zones of zero-curvature). The link between these domains and theanatomic boundaries have to be confirmed in fur-ther 3D microscopic studies by comparing the null-curvature maps of the embryo, the zero-diffusiondomains of the critical metabolites and the maximalproliferation zones. We conjecture in concludingthese two short studies about feather morphogen-esis and gastrulation that the zero-diffusion setscould be good candidates for ensuring locally thecoexistence, and after the self-assembling of thecomponents (carrier, receptor and attachment pro-teins as well as phospho-lipids) of cell interfacesbetween two tissues needed for separating organsfunctionally specified by differentiated cells. In thezero-diffusion zones indeed the effect of the tem-perature on the diffusion is minimum, becausethe viscosity (inverse of the diffusion coefficientD) is proportional to exp(E/kT ), where E isan activation energy, T the absolute temperatureand k the Boltzmann’s constant. We also noticethat if the concentration front wave is Gaussian,the zero-diffusion zone corresponds to the domainwhere the partial de Donder affinity is ln(u), ubeing the concentration of the diffusing substance[Dutt, 2000], that does not vary, after reaching thereaction equilibrium, in the case where the reac-tion has a fast dynamics with respect to a slowdiffusion:
∂ ln(u)∂t
=1u
∂u
∂t=
D∆u
u
If we authorize the value of D∆u/u to be suffi-ciently small, that corresponds also to the domainwhere the diffusion of u is minimum and its con-centration maximum. If the corresponding valueof u minimizes a chemical potential from whichthe reaction velocity derives, like in n-switchesinvolved in morphogenetic processes [Cinquin &
Demongeot, 2002a, 2002b], then the zero-diffusiondomains, in the case where they coincide for severalconstituents (e.g. of a membrane or aponeurosis),correspond to a local constancy of their concentra-tions favoring their interactions in order to buildthe self-assemblage the least sensitive to the thermalfluctuations.
9. Conclusion
We have considered firstly in this paper some nat-ural extensions of the classical Ross–McKendrick–Mac Donald approaches, in order to account fordemographic and spatial dependencies of the vari-ables involved in an infection process. One exam-ple has been presented, concerning the Black Deathspread in Europe during the middle-age, whichshows the interest of introducing space and biolog-ical age into the classical equations. In the future,other infectious diseases (like Sexually TransmittedDiseases) could be treated with the same approachshowing the importance of the demography (thesexual relationships depending on the age of thepartners) and of the socio-geography (conditioningthe sexual behavior). Based on the knowledge ofthe new aerial routes [Khan et al., 2009], epidemicsmodeling will also be revisited in the near futurefor predicting new pandemics, with a viscosity min-imal on the aerial routes. A second type of spatialdependency in a reaction–diffusion process occurs inthe morphogenesis modeling: like for the epidemics,both age and spatial diffusion can explain the occur-rence of spatial patterns, e.g. in the cases of feathermorphogenesis and gastrulation.
In both epidemics and morphogenesis mod-els, further studies have to be done in order todefinitely emphasize and make more precise thefunctional role of the zero-diffusion domains, inwhich chemical or infectious agents coexist andinteract.
Acknowledgments
We are very indebted to L. Forest for his invalu-able contribution to models and simulations, andfor his unforgettable friendship, and to N. Peyrierasfor showing the direction of a new experimen-tal research through the EEC project “Bioemer-gences”. The present work has been partiallygranted by the EEC VPH (Virtual PhysiologicalHuman) Network of Excellence.
1250028-20

March 10, 2012 11:35 WSPC/S0218-1274 1250028
Zero-Diffusion Domains in Reaction–Diffusion Morphogenetic and Epidemiologic Processes
References
Abbas, L., Demongeot, J. & Glade, N. [2009] “Synchronyin Reaction-diffusion models of morphogenesis:Applications to curvature-dependent proliferationand zero-diffusion front waves,” Phil. Trans. RoyalSoc. A. 367, 4829–4862.
d’Alembert, J. [1761] Opuscules Mathematiques (David,Paris).
Angst, B. D., Marcozzi, C. & Magee, A. I. [2001] “Thecadherin superfamily diversity in form and function,”J. Cell Biol. 117, 629–641.
Aracena, J., Gonzalez, M., Zuniga, A., Mendez, M. A. &Cambiazo, V. [2006] “Regulatory network for cellshape changes during Drosophila ventral furrow for-mation,” J. Theor. Biol. 239, 49–62.
Barry, S. & Gualde, N. [2006] “The biggest epidemics ofhistory,” L’Histoire 310, 38–49.
de Baux, P. [1766] Reflexions Presentees a la Faculte deMedecine de Paris sur le Rapport de Six des DouzeCommissaires Nommes par Ladite Faculte (Favet,Marseille).
Benedictow, O. J. [2004] The Black Death 1346–1353 :The Complete History (Boydell Press, Woodbridge,UK).
Ben Amor, H., Glade, N., Lobos, C. & Demongeot, J.[2010] “The isochronal fibration: Characterization andimplication in biology,” Acta Biotheoretica 58, 121–142.
Bernoulli, D. [1760] Essai d’une Nouvelle Analyse de laMortalite causee par la Petite Verole, et des Advan-tages de l’inoculation Pour la Prevenir (Acad. Roy.Sci., Paris).
Chisholm, A. D. [2006] “Gastrulation: Wnts signal con-striction,” Current Biol. 16, 874–876.
Cinquin, O. & Demongeot, J. [2002a] “Positive and neg-ative feedback: Striking a balance between necessaryantagonists,” J. Theor. Biol. 216, 229–241.
Cinquin, O. & Demongeot, J. [2002b] “Positive and neg-ative feedback: Mending the ways of sloppy systems,”Comptes Rendus Biologies 325, 1085–1095.
Crauste, F., Hbid, M. L. & Kacha, A. [2008] “A delayreaction-diffusion model of the dynamics of botulinumin fish,” Math. Biosci. 216, 17–29.
Davies, K. F. & Braun, W. J. [2010] “Modeling pointpatterns with the Ivanoff–Merzbach renewal process,”Environmetrics 21, 85–101.
Davies, K. F. & Braun, W. J., “A two-dimensionalMarkov renewal process,” Environmetrics 21, DOI:10.1002/env.1049, to appear.
Demongeot, J. [1983] “Coupling of Markov processes andHolley’s inequalities for Gibbs measures,” Proc. IXthPrague Conf. Information Theory, Statistical Deci-sion Functions and Random Processes (Academia,Prague), pp. 183–189.
Demongeot, J. [1985] “Random automata and randomfields,” Cellular Automata: Theory and Applications(reedited with the title Dynamical Systems and Cel-lular Automata) (Academic Press, NY), pp. 99–110.
Demongeot, J. & Fricot, J. [1986] “Random fields andrenewal potentials,” NATO ASI Serie F 20, 71–84.
Demongeot, J., Aracena, J., Thuderoz, F., Baum, T. P. &Cohen, O. [2003] “Genetic regulation networks: Cir-cuits, regulons and attractors,” Comptes Rendus Biol.326, 171–188.
Demongeot, J. & Francoise, J. P. [2006] “Approximationfor limit cycles and their isochrons,” Comptes RendusBiol. 329, 967–970.
Demongeot, J., Glade, N. & Forest, L. [2007a] “Lienardsystems and potential-Hamiltonian decomposition. I.Methodology,” Comptes Rendus Mathematique 344,121–126.
Demongeot, J., Glade, N. & Forest, L. [2007b] “Lienardsystems and potential-Hamiltonian decomposition.II. Algorithm,” Comptes Rendus Mathematique 344,191–194.
Demongeot, J., Glade, N., Hansen, O. & Moreira, A.[2007c] “An open issue: The inner mitochondrialmembrane (IMM) as a free boundary problem,”Biochimie 89, 1049–1057.
Demongeot, J. [2009] “Biological boundaries and biolog-ical age,” Acta Biotheoretica 57, 397–419.
Demongeot, J., Fouquet, Y., Tayyab, M. & Vuillerme, N.[2009] “Understanding physiological & degenerativenatural vision mechanisms to define robust contrastand segmentation operators,” PLoS ONE 4, e6010.
Demongeot, J., Gaudart, J., Mintsa, J. & Rachdi, M. [toappear]“Demography in epidemics modeling,” Com-mun. Pure Appl. Anal. 11, 61–82.
Dietz, K. & Heesterbeek, J. A. P. [2000] “Bernoulli wasahead of modern epidemiology,” Nature 408, 513.
Dietz, K. & Heesterbeek, J. A. P. [2002] “DanielBernoullis epidemiological model revisited,” Math.Biosci. 180, 121.
Dutt, A. K. [2000] “Non-equilibrium thermodynamics ofa model bistable chemical system,” Chem. Phys. Lett.322, 73–77.
Fisher, R. A. [1937] “The wave of advance of advanta-geous genes,” Ann. Eugenics 7, 353369.
Forest, L. & Demongeot, J. [2004] “Cellular modeling ofsecondary radial growth in conifer trees: Applicationto Pinus radiata,” Bull. Math. Biol. 68, 753–784.
Forest, L., San Martin, J., Padilla, F., Chassat, F.,Giroud, F. & Demongeot, J. [2004] “Morphogeneticprocesses: Application to cambial growth dynamics,”Acta Biotheoretica 52, 415–438.
Forest, L., Martinez, S., Padilla, F., Demongeot, J. &San Martin, J. [2006] “Modeling of auxin transportaffected by gravity and differential radial growth,” J.Theor. Biol. 241, 241–251.
1250028-21

March 10, 2012 11:35 WSPC/S0218-1274 1250028
J. Demongeot et al.
Forest, L., Glade, N. & Demongeot, J. [2007] “Lienardsystems and potential-Hamiltonian decomposition.Applications,” C. R. Acad. Sci. Biologies 330, 97–106.
Forest, L. & Demongeot, J. [2008] “A general formalismfor tissue morphogenesis based on cellular dynamicsand control system interactions,” Acta Biotheoretica56, 51–74.
Gaudart, J., Giorgi, R., Poudiougou, B., Ranque, S.,Doumbo, O. & Demongeot, J. [2007] “Spatial clus-ter detection: Principle and application of differentgeneral methods,” Rev. Ep. Sante Pub. 55, 297–306.
Gaudart, J., Toure, O., Dessay, N., Dicko, A. L., Ranque,S., Forest, L., Demongeot, J. & Doumbo, O. K.[2009] “Modeling malaria incidence with environmen-tal dependency in a locality of Sudanese savannaharea, Mali,” Malaria J. 8, 61.
Gaudart, J., Ghassani, M., Mintsa, J., Waku, J., Rachdi,M., Doumbo, O. K. & Demongeot, J. [2010a] “Demo-graphic and spatial factors as causes of an epi-demic spread, the copule approach. Application toretro-prediction of the Black Death of 1346,” IEEEAINA’2010 (IEEE Press, Piscataway), pp. 751–758.
Gaudart, J., Ghassani, M., Mintsa, J., Rachdi, M.,Waku, J. & Demongeot, J. [2010b] “Demographyand diffusion in epidemics: Malaria and black deathspread,” Acta Biotheoretica 58, 277–305.
Glade, N., Forest, L. & Demongeot, J. [2007]“Lienard systems and potential-Hamiltonian decom-position. III Applications in biology,” Comptes Ren-dus Mathematique 344, 253–258.
Hanson, P. I., Roth, R., Lin, Y. & Heuser, J. E. [2007]“Plasma membrane deformation by circular arrays ofESCRT-III protein filaments,” J. Cell Biol. 180, 389–402.
Horie, M., Honda, T., Suzuki, Y., Kobayashi, Y.,Daito, T., Oshida, T., Ikuta, K., Jern, P., Gojo-bori, T., Coffin, J. M. & Tomonaga, K. [2010]“Endogeneous non-retroviral RNA virus elements inmammalian genomes,” Nature 463, 84–88.
Inoue, S. [1995] “Possible continuity of subplasmalemmalcytoplasmic network with basement membrane cordnetwork: Ultrastructural study,” J. Cell Biol. 108,1971–1976.
Ivanoff, B. G. & Merzbach, E. [2006] “What is a multi-parameter renewal process?” Stochastics 78, 411–441.
Kermack, W. O. & McKendrick, A. G. [1932] “Contri-butions to the mathematical theory of epidemics. II.The problem of endemicity,” Proc. Roy. Soc. LondonSeries A 138, 55–83.
Kermack, W. O. & McKendrick, A. G. [1933] “Contri-butions to the mathematical theory of epidemics. III.Further studies of the problem of endemicity,” Proc.Roy. Soc. London Series A 141, 94–122.
Khan, K., Arino, J., Hu, W., Raposo, J., Sears, J.,Calderon, F., Heidebrecht, C., Macdonald, M.,Liauw, J., Chan, A. & Gardam, M. [2009] “Spreadof a novel Influenza A (H1N1) virus via globalairline transportation,” New England J. Med. 361,212–214.
Kurth, T. [2005] “A cell cycle arrest is necessary forbottle cell formation in the early Xenopus gastrula:Integrating cell shape change, local mitotic controland mesodermal patterning,” Mech. Dev. 122, 1251–1265.
Laevsky, G. & Knecht, D. A. [2003] “Cross-linking ofactin filaments by myosin II is a major contributor tocortical integrity and cell motility in restrictive envi-ronments,” J. Cell Biol. 116, 3761–3770.
Lambert, J. H. [1972] Beitrage zum Gebrauche der Math-ematik und deren Anwendung (Dritter Theil, Berlin).
Lee, J. & Harland, R. M. [2010] “Endocytosis is requiredfor efficient apical constriction during Xenopus Gas-trulation,” Current Biol. 20, 253–258.
L’Epine, G. J. [1764] Rapport de Six des Douze Com-missaires Nommes par la Faculte de Medecine aParis, Pour Examiner, Discuter les Avantages et lesInconvenients de l’inoculation de la Petite Verole(Faculte de Medecine, Paris).
Leptin, M. & Grunewald, B. [1990] “Cell shape changesduring gastrulation in Drosophila,” Development 110,73–84.
Leptin, M. [1999] “Gastrulation in Drosophila: The logicand the cellular mechanisms,” Embo J. 18, 3187–3192.
Leslie, P. H. [1945] “On the use of matrices in certainpopulation mathematics,” Biometrika 33, 183–212.
Mac Auley, A., Werb, Z. & Mirkes, P. E. [1993] “Char-acterization of the unusually rapid cell cycles duringrat gastrulation,” Development 117, 873–883.
Mac Donald, G. [1957] The Epidemiology and Control ofMalaria (Oxford University Press, Oxford).
McKendrick, A. G. [1925] “Applications of mathematicsto medical problems,” Proc. Edinburgh Math. Soc. 44,1–34.
May, N. [1770] Impartial Remarks on the SuttonianMethod of Inoculation (Tilley, London).
May, R. M. & Anderson, R. M. [1984] “Spatial hetero-geneity and the design of immunization programs,”Math. Biosci. 72, 83111.
Mendez, V., Fort, J., Rotstein, H. G. & Fedotov, S. [2003]“Speed of reaction–diffusion fronts in spatially hetero-geneous media,” Phys. Rev. E 68, 041105.
Michon, F., Forest, L., Collomb, E., Demongeot, J. &Dhouailly, D. [2008] “BMP-2 and BMP-7 play antag-onistic roles in feather induction,” Development 135,2797–2805.
Miller, K. R & Levine, J. [2002] Biology (Prentice Hall,Upper Saddle River, NJ), pp. 242–243.
1250028-22
March 10, 2012 11:35 WSPC/S0218-1274 1250028
Zero-Diffusion Domains in Reaction–Diffusion Morphogenetic and Epidemiologic Processes
Mocellin-Spicuzza, G. [2002] Chroniques d’une abbayeau Moyen-Age. Guerir l’ame et le Corps (Ed. Muse,Saint-Antoine l’Abbaye).
Murray, J. A. [1763] Fata Insitionis Variolarum in Suecia(University of Gottingen, Gottingen).
Murray, J. D. [2003] Mathematical Biology: II. Spa-tial Models and Biomedical Applications (Springer,Berlin).
Ross, R. [1916] “An application of the theory of proba-bilities to the study of a priori pathometry. Part I,”Proc. Royal Soc. London Series A 92, 204–230.
Silverman-Gavrila, R. V., Hales, K. G. & Wilde, A.[2008] “Anillin-mediated targeting of peanut to pseu-docleavage furrows is regulated by the GTPase ran,”Mol. Biol. Cell. 19, 3735–3744.
Sprengel, K. [1815] “Histoire de l’inoculation de la petiteverole,” Histoire de la Medecine (Deterville, Paris),pp. 33–81.
Stanek, Jr., J. A. [1983] “Why don’t cells grow larger?”Amer. Biol. Teacher 45, 393–395.
Trembley, J. [1796] Recherches sur la Mortalite de laPetite Verole (Mem. Acad. Roy. Sci., Paris).
Turing, A. M. [1952] “The chemical basis of morphogen-esis,” Philos. Trans. Roy. Soc. London B 237, 37–72.
Usher, M. B. [1969] “A matrix model for forest manage-ment,” Biometrics 25, 309–315.
WHO [1999] “La peste humaine en 1997,” ReleveEpidemiologique Hebdomadaire OMS 74, 340–344.
Zanella, C., Campana, M., Rizzi, B., Melani, C., San-guinetti, G., Bourgine, P., Mikula, K., Peyrieras, N. &Sarti, A. [2010] “Cells segmentation from 3-D confo-cal images of early zebrafish embryogenesis,” IEEETrans. Imag. Process. 19, 770–781.
Zeeman, E. C. [1993] “Controversy in science: On theideas of Daniel Bernoulli and Rene Thom,” NieuwArch. Wisk. 11, 257.
Zhang, S. Y., Yu, L. & Daszak, P. [2008] “EcoHealth andthe black death in the year of the rat,” Ecohealth 5,99–100.
1250028-23


