22
SHALE-ADVANTAGED CHEMICAL INDUSTRY INVESTMENT 9 April 2013 Martha Gilchrist Moore Sr. Director, Policy Analysis and Economics
SHALE-ADVANTAGED CHEMICAL INDUSTRY INVESTMENT
9 April 2013
Martha Gilchrist Moore
Sr. Director, Policy Analysis and Economics
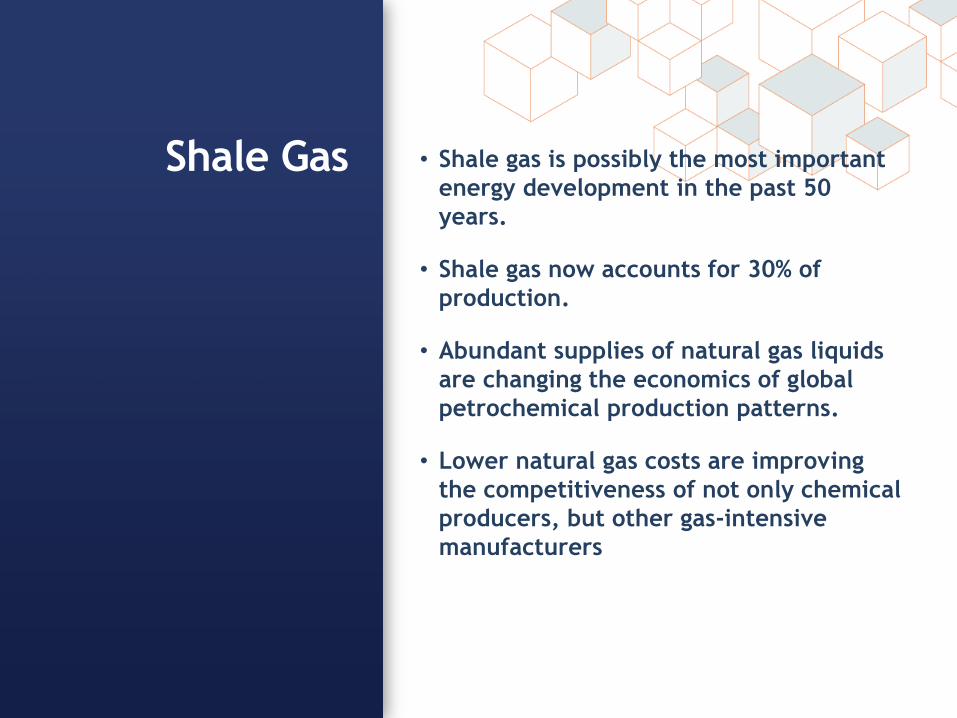
Shale Gas
• Shale gas is possibly the most important
energy development in the past 50
years.
• Shale gas now accounts for 30% of
production.
• Abundant supplies of natural gas liquids
are changing the economics of global
petrochemical production patterns.
• Lower natural gas costs are improving
the competitiveness of not only chemical
producers, but other gas-intensive
manufacturers
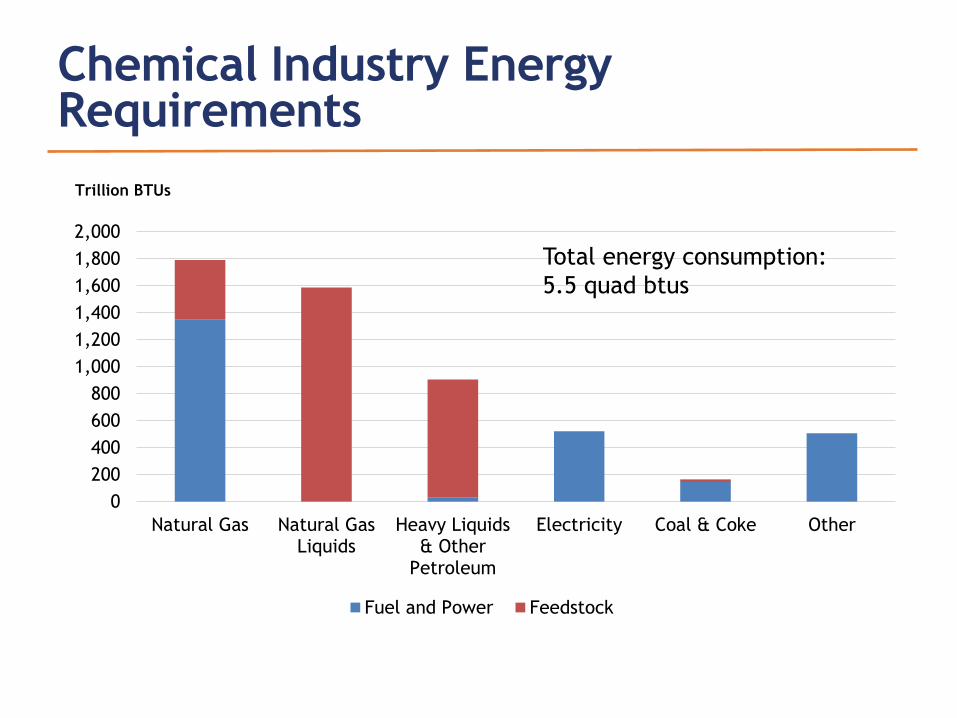
Chemical Industry Energy Requirements
0
200
400
600
800
1,000
1,200
1,400
1,600
1,800
2,000
Natural Gas Natural GasLiquids
Heavy Liquids& Other
Petroleum
Electricity Coal & Coke Other
Fuel and Power Feedstock
Trillion BTUs
Total energy consumption:
5.5 quad btus
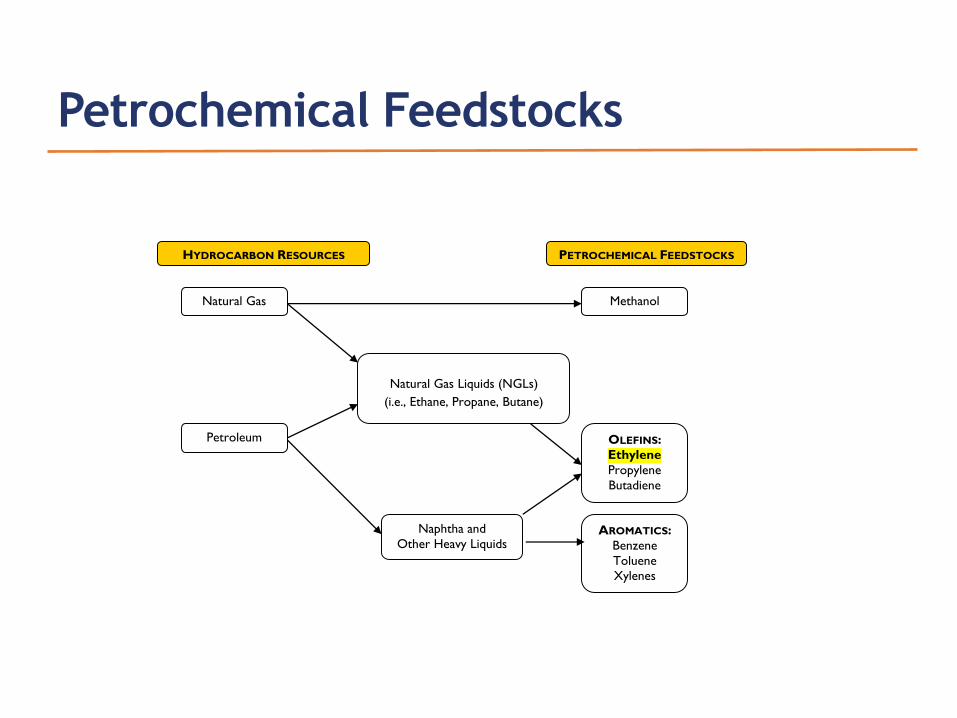
Petrochemical Feedstocks
HYDROCARBON RESOURCES PETROCHEMICAL FEEDSTOCKS
Natural Gas Methanol
Petroleum
Natural Gas Liquids (NGLs)
(i.e., Ethane, Propane, Butane)
OLEFINS:
Ethylene
Propylene
Butadiene
Naphtha and
Other Heavy Liquids AROMATICS:
Benzene
Toluene
Xylenes
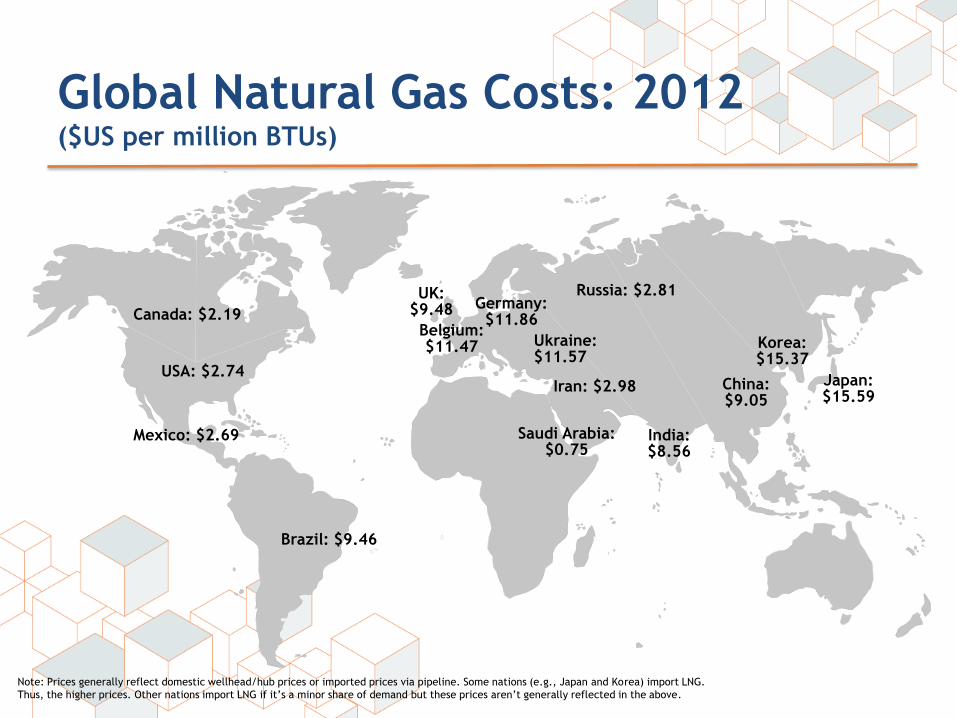
Global Natural Gas Costs: 2012 ($US per million BTUs)
Note: Prices generally reflect domestic wellhead/hub prices or imported prices via pipeline. Some nations (e.g., Japan and Korea) import LNG.
Thus, the higher prices. Other nations import LNG if it’s a minor share of demand but these prices aren’t generally reflected in the above.
USA: $2.74
Mexico: $2.69
Canada: $2.19
Saudi Arabia: $0.75
Iran: $2.98
Brazil: $9.46
Germany: $11.86
China: $9.05
India: $8.56
Korea: $15.37
Japan: $15.59
UK: $9.48
Belgium: $11.47
Russia: $2.81
Ukraine: $11.57
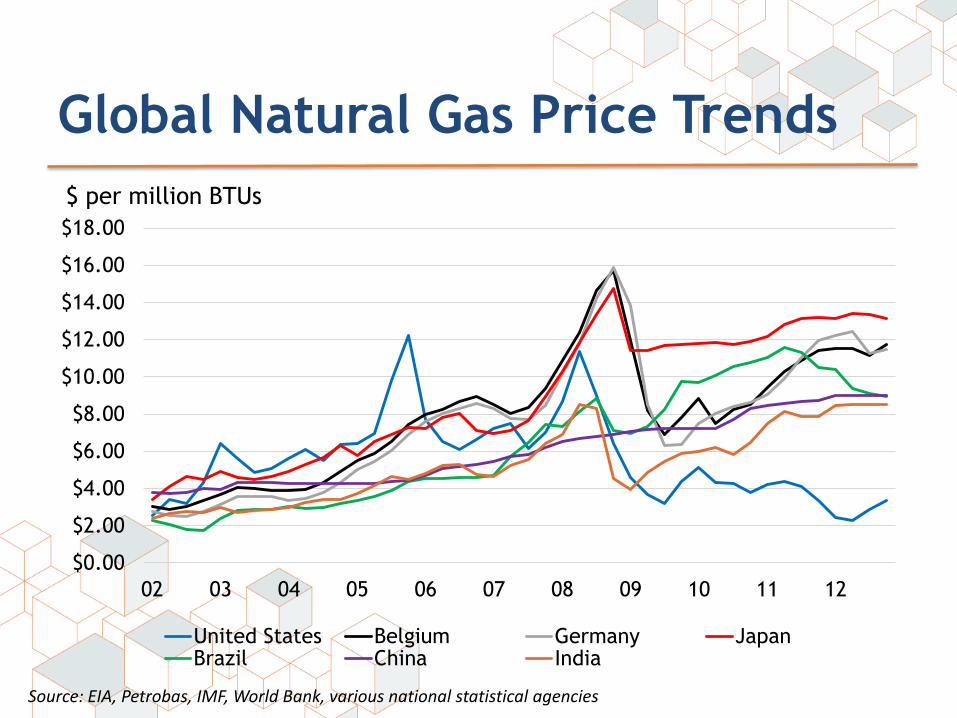
Global Natural Gas Price Trends
$0.00
$2.00
$4.00
$6.00
$8.00
$10.00
$12.00
$14.00
$16.00
$18.00
02 03 04 05 06 07 08 09 10 11 12
United States Belgium Germany JapanBrazil China India
Source: EIA, Petrobas, IMF, World Bank, various national statistical agencies
$ per million BTUs
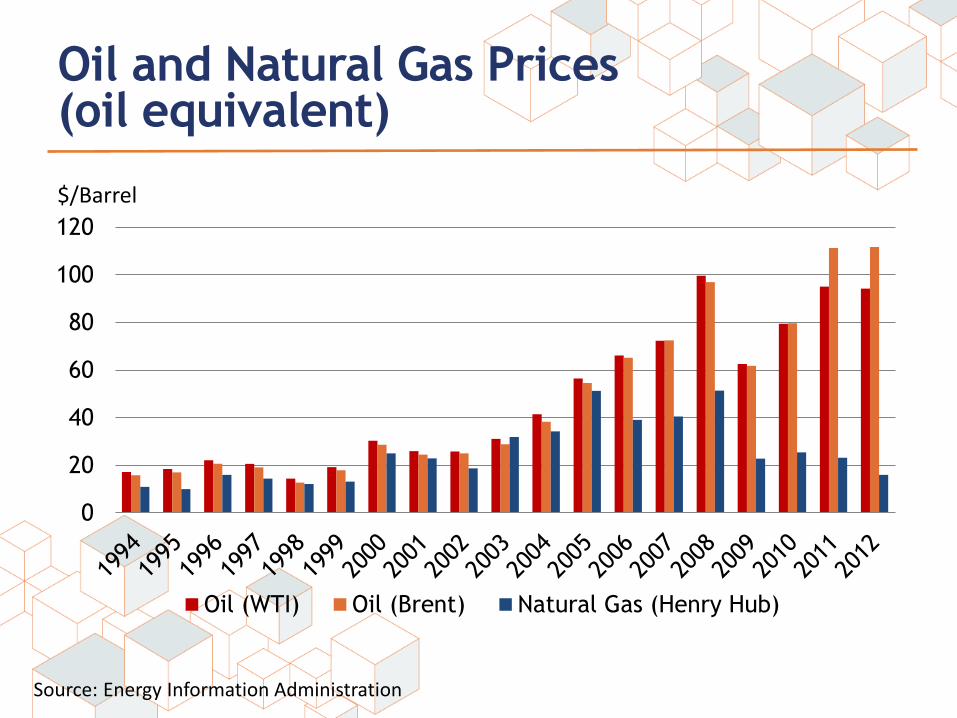
Oil and Natural Gas Prices (oil equivalent)
0
20
40
60
80
100
120
Oil (WTI) Oil (Brent) Natural Gas (Henry Hub)
$/Barrel
Source: Energy Information Administration
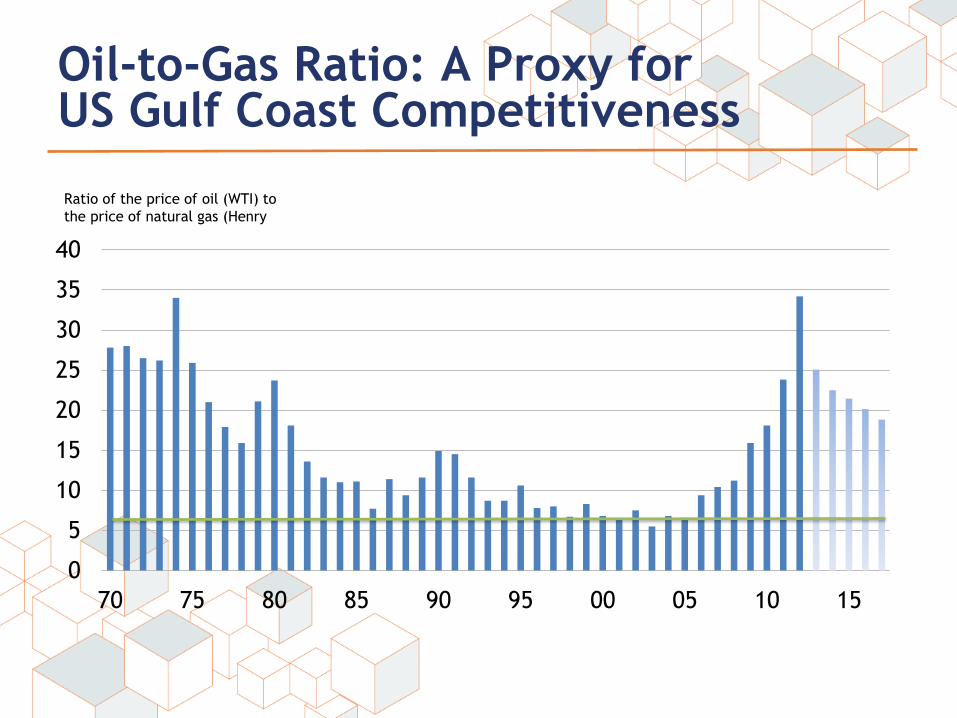
Oil-to-Gas Ratio: A Proxy for US Gulf Coast Competitiveness
0
5
10
15
20
25
30
35
40
70 75 80 85 90 95 00 05 10 15
Ratio of the price of oil (WTI) to
the price of natural gas (Henry
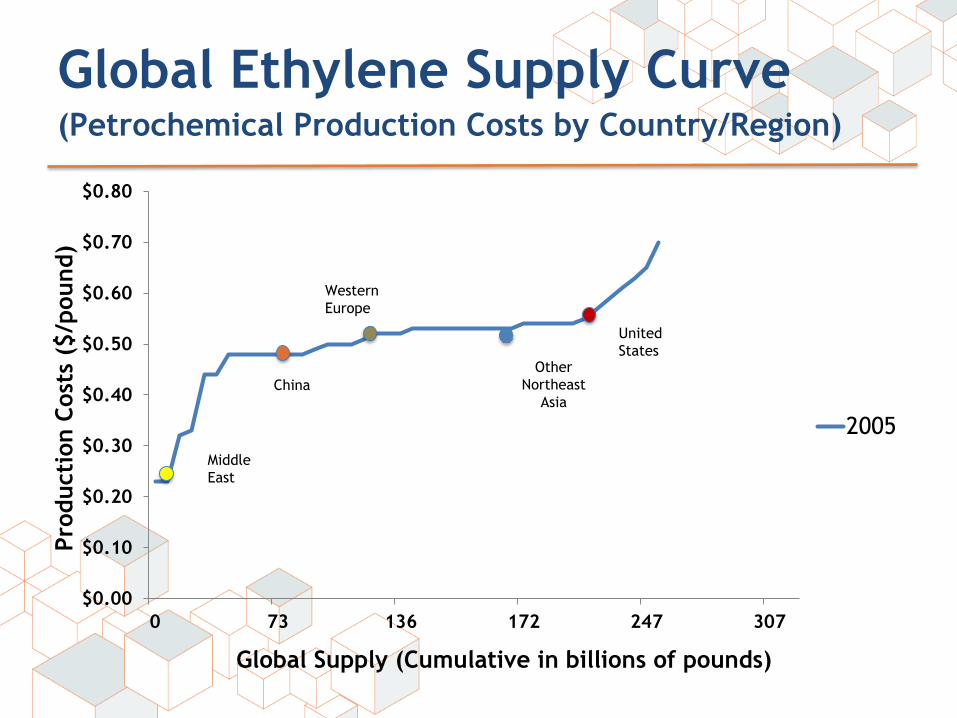
Global Ethylene Supply Curve (Petrochemical Production Costs by Country/Region)
$0.00
$0.10
$0.20
$0.30
$0.40
$0.50
$0.60
$0.70
$0.80
0 73 136 172 247 307
Pro
ducti
on C
ost
s ($
/pound)
Global Supply (Cumulative in billions of pounds)
2005
Middle
East
United
States
China
Other
Northeast
Asia
Western
Europe
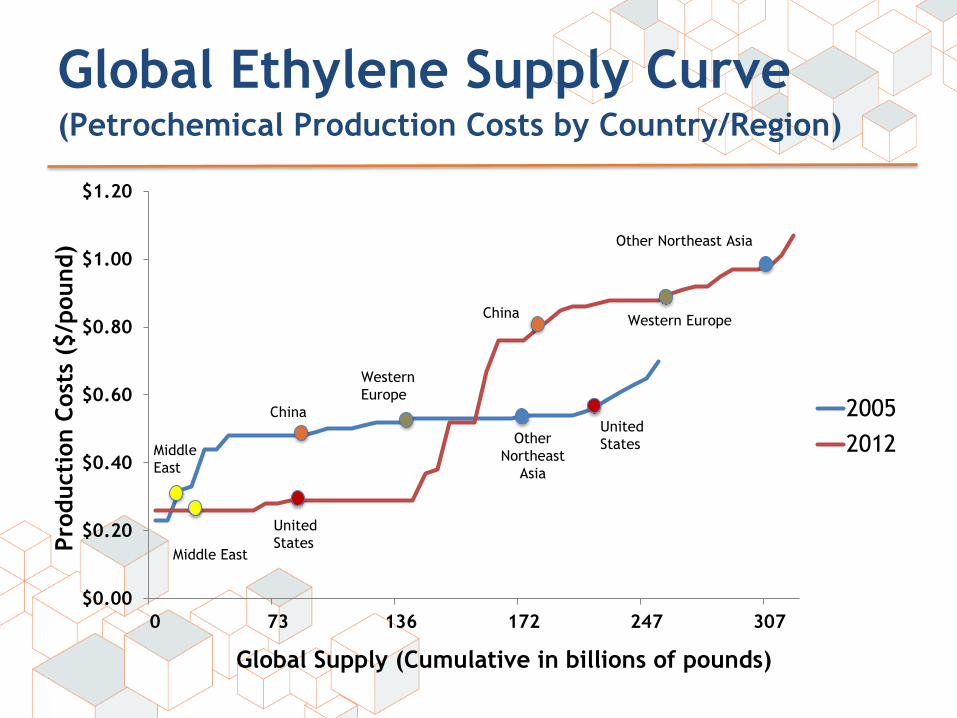
Global Ethylene Supply Curve (Petrochemical Production Costs by Country/Region)
$0.00
$0.20
$0.40
$0.60
$0.80
$1.00
$1.20
0 73 136 172 247 307
Pro
ducti
on C
ost
s ($
/pound)
Global Supply (Cumulative in billions of pounds)
2005
2012Middle
East
Middle East
United
States
United
States
China
Western Europe China
Western
Europe
Other Northeast Asia
Other
Northeast
Asia
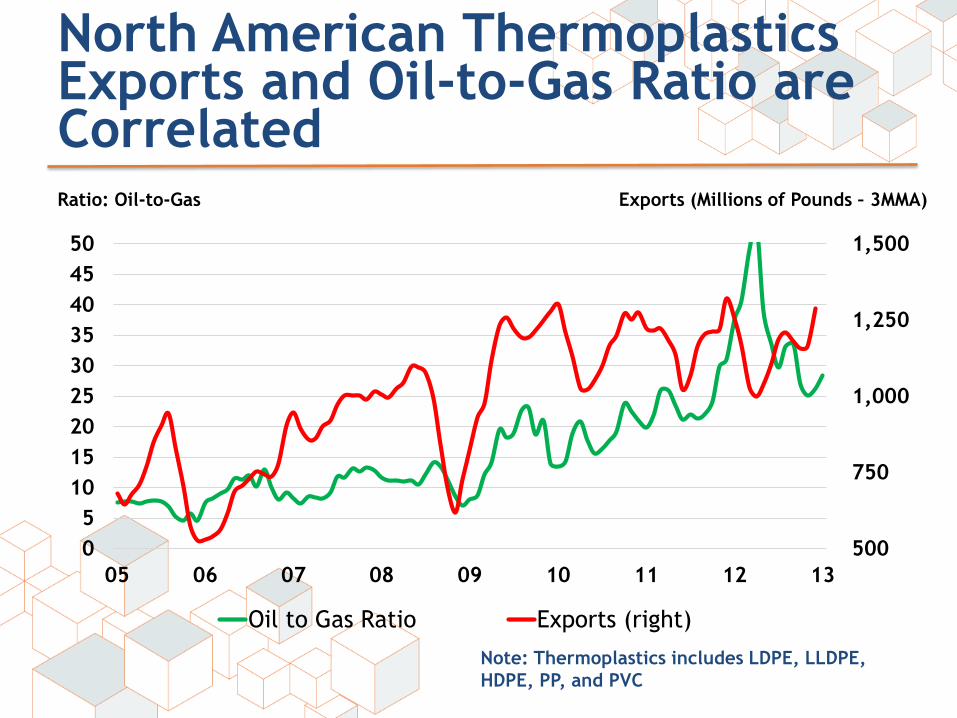
North American Thermoplastics Exports and Oil-to-Gas Ratio are Correlated
500
750
1,000
1,250
1,500
0
5
10
15
20
25
30
35
40
45
50
05 06 07 08 09 10 11 12 13
Oil to Gas Ratio Exports (right)
Ratio: Oil-to-Gas Exports (Millions of Pounds – 3MMA)
Note: Thermoplastics includes LDPE, LLDPE,
HDPE, PP, and PVC
0
5
10
15
20
25
30
35
01 02 03 04 05 06 07 08 09 10 11 12 13 14 15 16 17 18 19 20 21 22
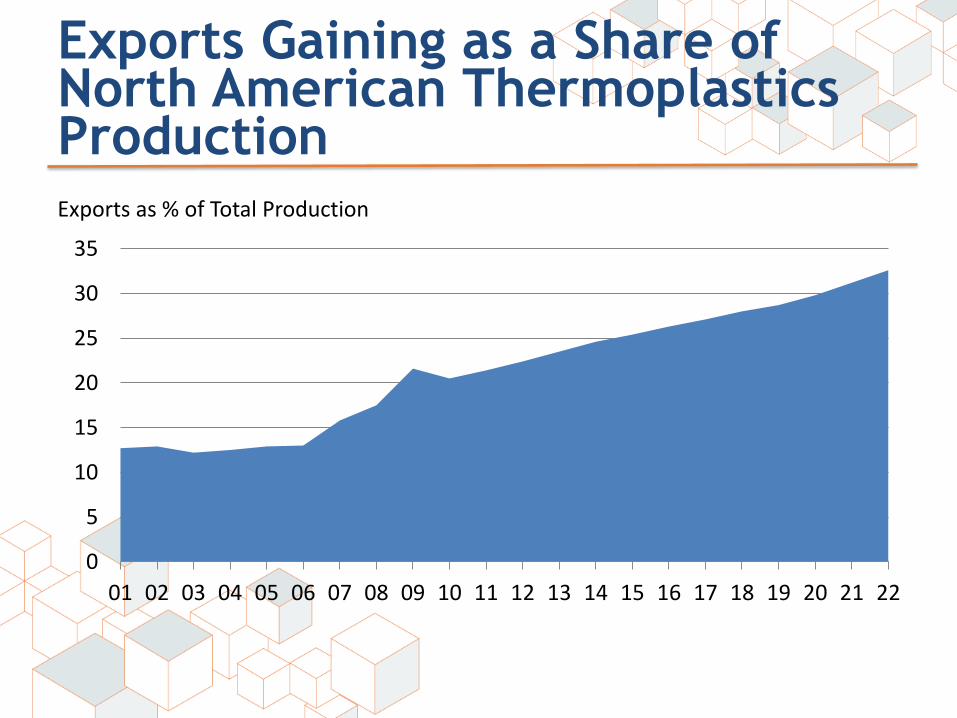
Exports Gaining as a Share of North American Thermoplastics Production Exports as % of Total Production
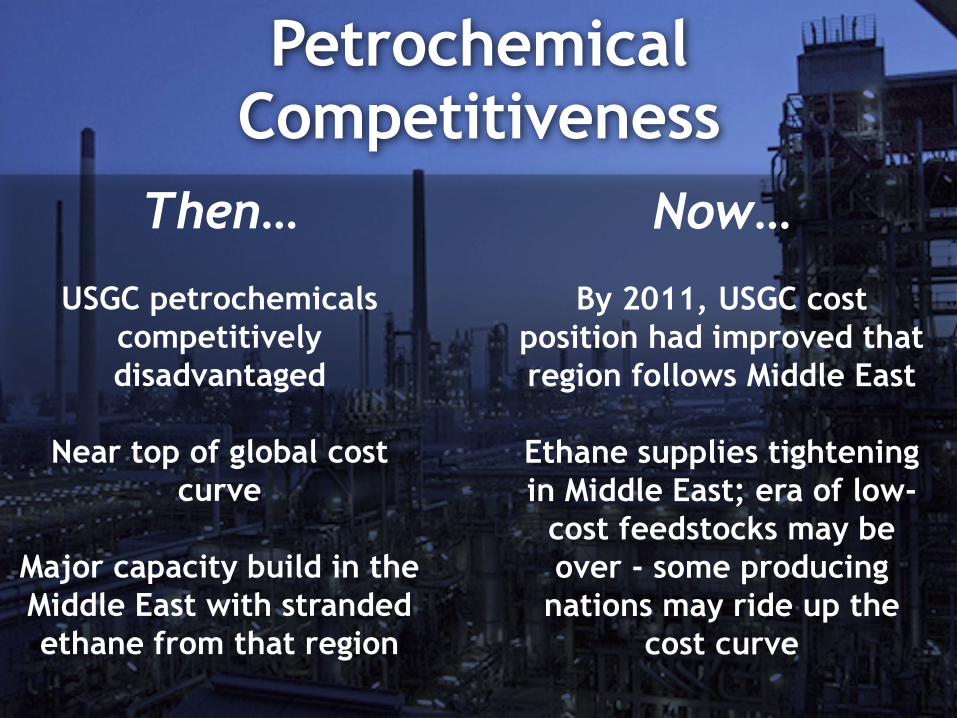
Petrochemical Competitiveness
Then…
USGC petrochemicals
competitively
disadvantaged
Near top of global cost
curve
Major capacity build in the
Middle East with stranded
ethane from that region
Now…
By 2011, USGC cost
position had improved that
region follows Middle East
Ethane supplies tightening
in Middle East; era of low-
cost feedstocks may be
over - some producing
nations may ride up the
cost curve
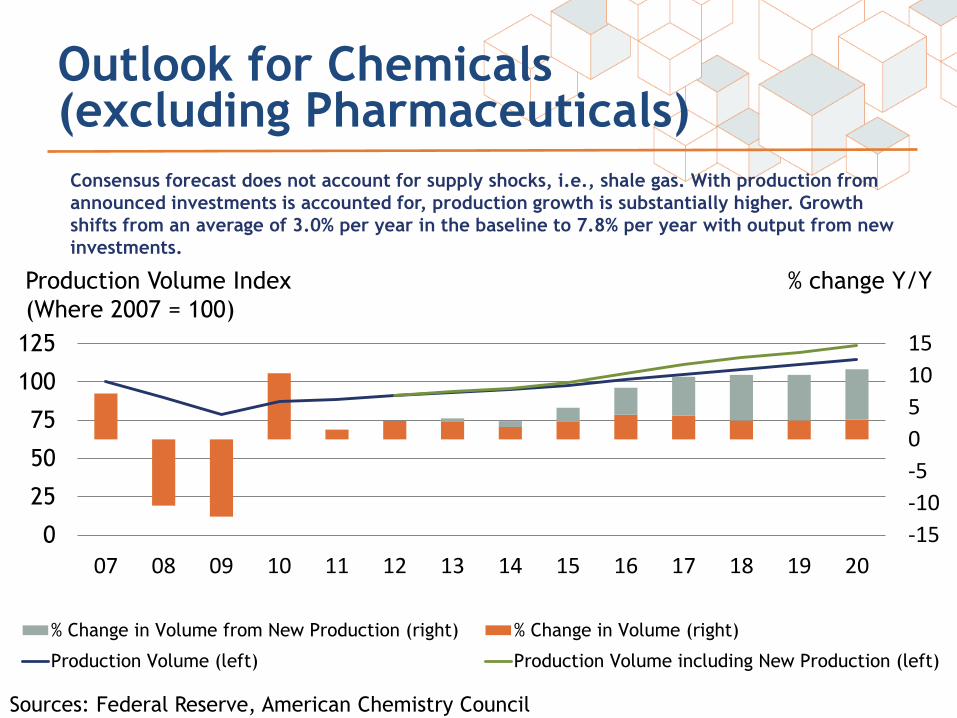
Outlook for Chemicals (excluding Pharmaceuticals)
-15
-10
-5
0
5
10
15
0
25
50
75
100
125
07 08 09 10 11 12 13 14 15 16 17 18 19 20
% Change in Volume from New Production (right) % Change in Volume (right)
Production Volume (left) Production Volume including New Production (left)
Production Volume Index
(Where 2007 = 100)
% change Y/Y
Consensus forecast does not account for supply shocks, i.e., shale gas. With production from
announced investments is accounted for, production growth is substantially higher. Growth
shifts from an average of 3.0% per year in the baseline to 7.8% per year with output from new
investments.
Sources: Federal Reserve, American Chemistry Council
16
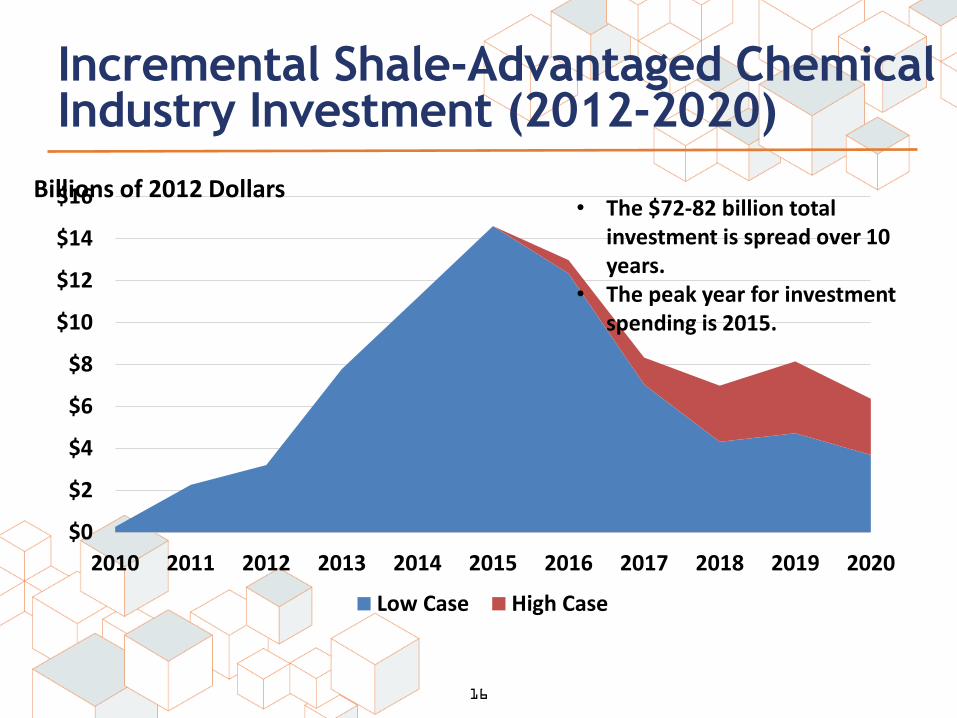
Incremental Shale-Advantaged Chemical Industry Investment (2012-2020)
$0
$2
$4
$6
$8
$10
$12
$14
$16
2010 2011 2012 2013 2014 2015 2016 2017 2018 2019 2020
Low Case High Case
Billions of 2012 Dollars • The $72-82 billion total
investment is spread over 10 years.
• The peak year for investment spending is 2015.
Shale Advantage Driving Capacity Expansion Across Many Products
Ethylene – capacity expected to grow by half
Ethlyene cracker co-products - propylene, butadiene
Derivatives – PE, vinyls, MEG, alpha-olefins, etc.
Co-products – chlor-alkali
Methanol
Nitrogeneous fertilizers – ammonia, urea and derivatives (AN, UAN)
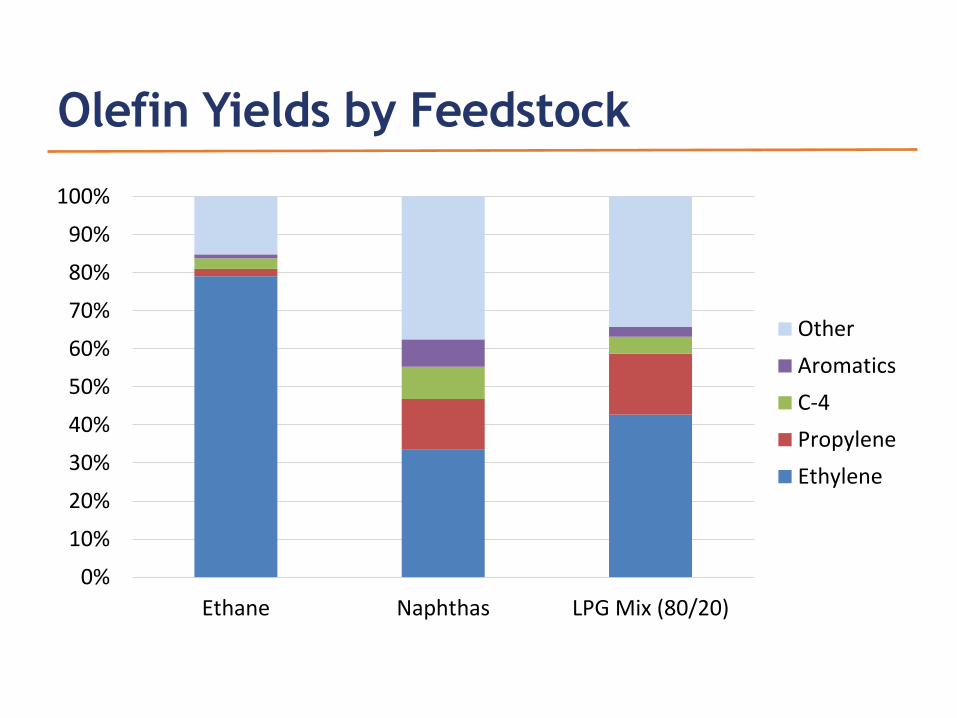
Olefin Yields by Feedstock
0%
10%
20%
30%
40%
50%
60%
70%
80%
90%
100%
Ethane Naphthas LPG Mix (80/20)
Other
Aromatics
C-4
Propylene
Ethylene
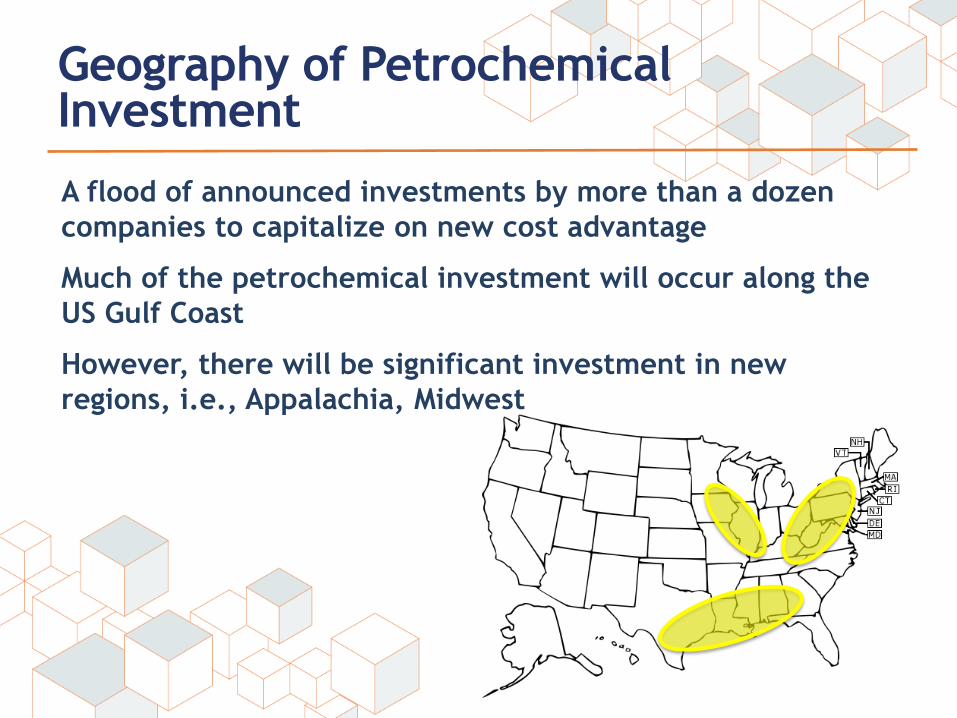
Geography of Petrochemical Investment
A flood of announced investments by more than a dozen
companies to capitalize on new cost advantage
Much of the petrochemical investment will occur along the
US Gulf Coast
However, there will be significant investment in new
regions, i.e., Appalachia, Midwest
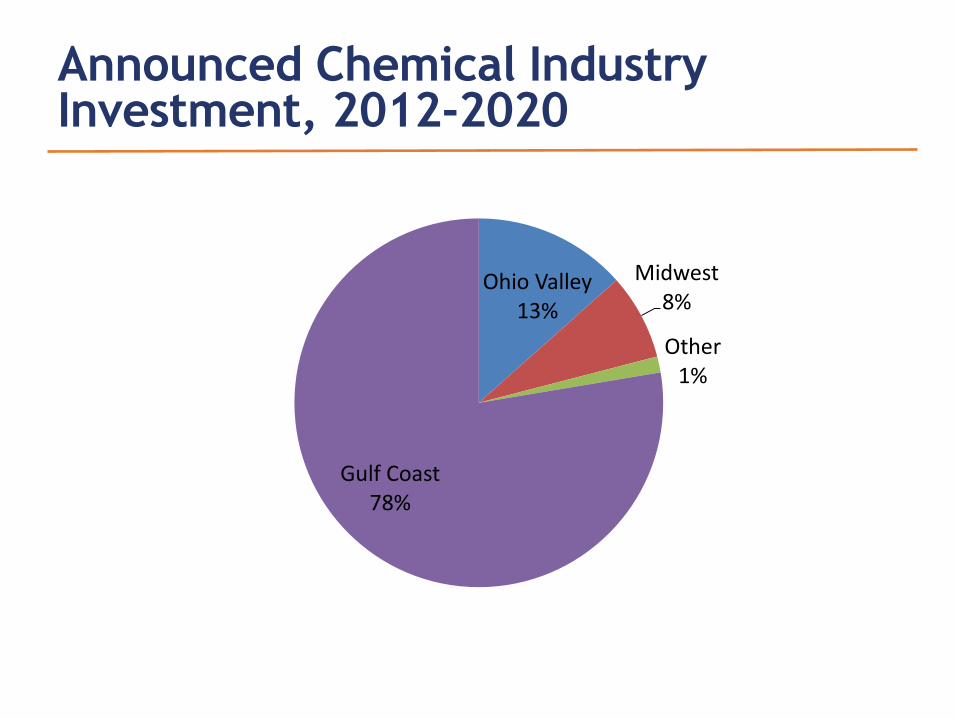
Announced Chemical Industry Investment, 2012-2020
Ohio Valley 13%
Midwest 8%
Other 1%
Gulf Coast 78%
Concluding Remarks
• Shale gas changes everything. Renewed US competitiveness from shale gas is already lifting chemical exports and production and will grow as new capacity comes online.
• Strong investment growth in chemicals already materializing.
• Investments by other customer industries will create additional opportunities.
• Further gains in plastic and chemical exports, employment, and capital spending.
• Challenges: skilled labor, environmental permitting, etc.