+ All Categories
Home > Documents > © 1992 – 2012 B-Safe Management Solutions Inc. Franklin, IN, USA. All Rights Reserved. Local &...

© 1992 – 2012 B-Safe Management Solutions Inc. Franklin, IN, USA. All Rights Reserved. Local &...

Date post: 01-Jan-2016
Category:
Upload: janice-hoover
View: 215 times
Download: 2 times
Share this document with a friend
44
© 1992 – 2012 B-Safe Management Solutions Inc. Franklin, IN, USA. All Rights Reserved. Local & Globa l B-Safe Management Solutions, Inc. Franklin, IN, 46131, USA 317 - 736 - 8980 www.behavioral-safety.com Safety Survey Reports
Transcript

© 1992 – 2012 B-Safe Management Solutions Inc. Franklin, IN, USA. All Rights Reserved.

Local &

Global

B-Safe Management Solutions, Inc.

Franklin, IN, 46131, USA

317 - 736 - 8980

www.behavioral-safety.com

Safety Survey Reports

© 1992 – 2012 B-Safe Management Solutions Inc. Franklin, IN, USA. All Rights Reserved.

Local &

Global

Agenda

• Survey Background• Survey results – Well Engineering• Survey results – Process Safety• The Way Forward

© 1992 – 2012 B-Safe Management Solutions Inc. Franklin, IN, USA. All Rights Reserved.

Local &

Global

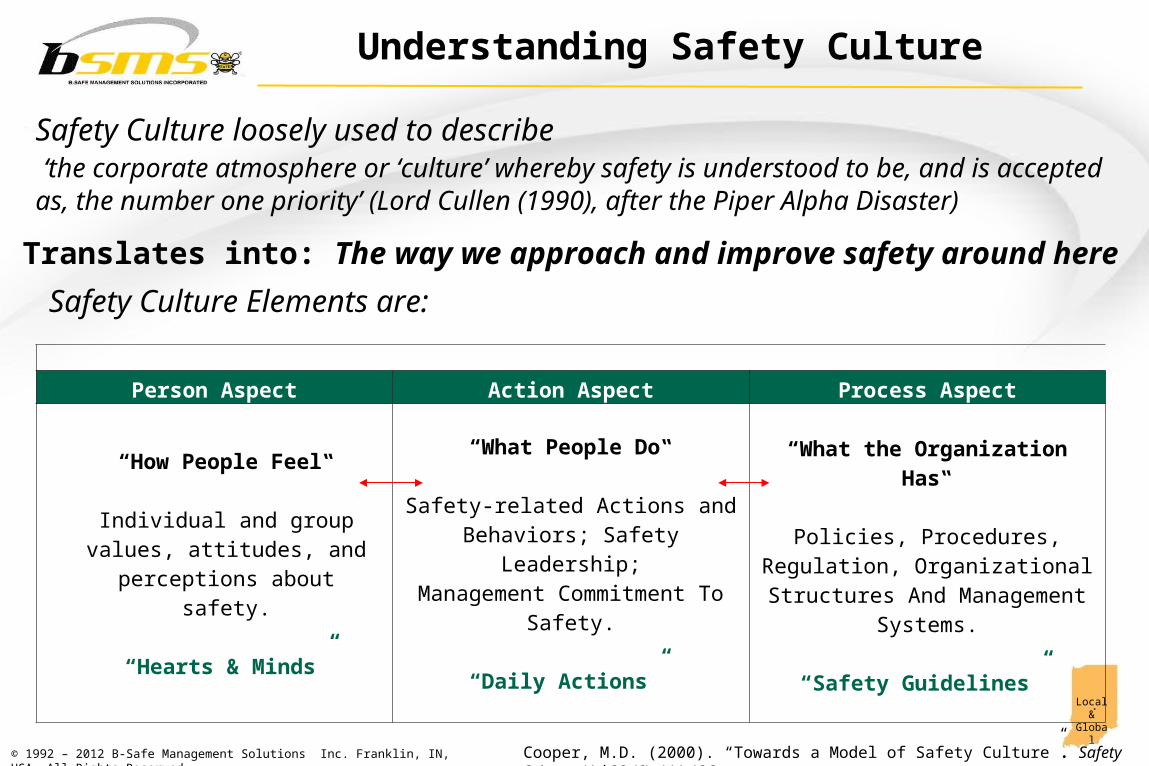
Safety Culture loosely used to describe ‘the corporate atmosphere or ‘culture’ whereby safety is understood to be, and is accepted as, the number one priority’ (Lord Cullen (1990), after the Piper Alpha Disaster)

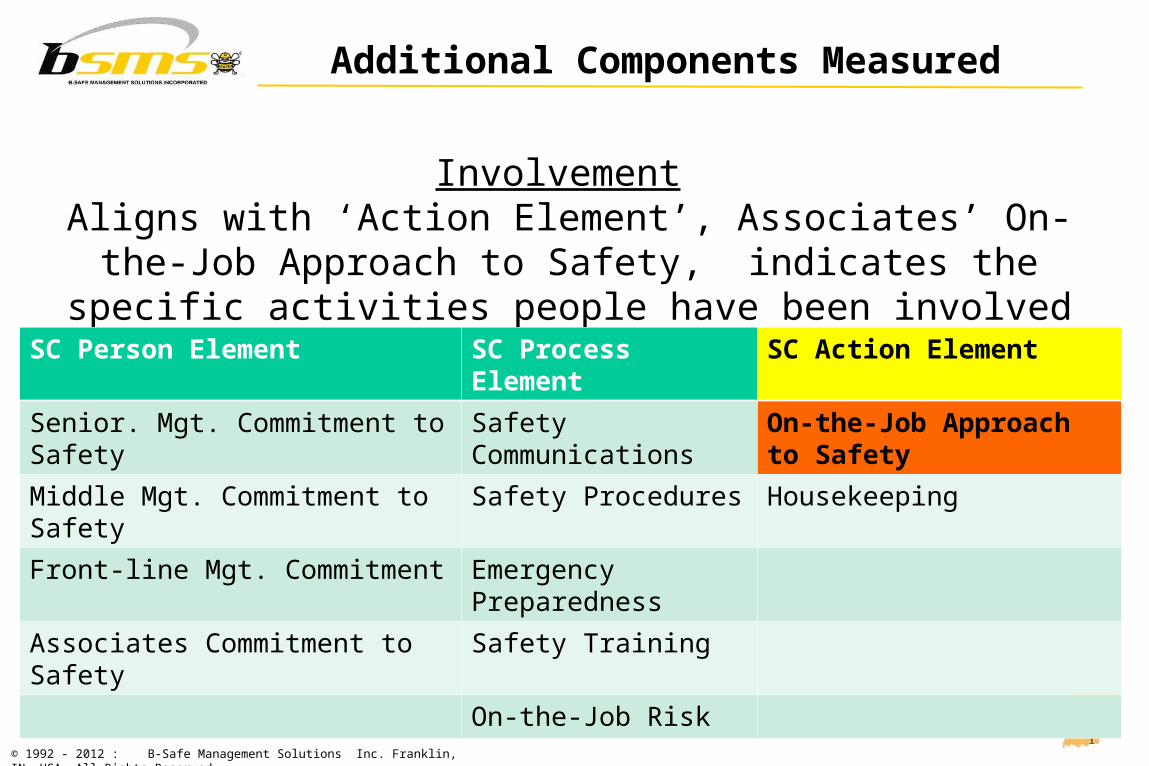
Person Aspect Action Aspect Process Aspect

“How People Feel‟

Individual and group values, attitudes, and perceptions about

safety.

“Hearts & Minds”

“What People Do‟

Safety-related Actions and Behaviors; Safety Leadership;

Management Commitment To Safety.

“Daily Actions”

“What the Organization Has‟

Policies, Procedures, Regulation, Organizational Structures And

Management Systems.

“Safety Guidelines”

Cooper, M.D. (2000). “Towards a Model of Safety Culture”. Safety Science, Vol 32 (6), 111-136.

Understanding Safety Culture

Safety Culture Elements are:

Translates into: The way we approach and improve safety around here

© 1992 – 2012 B-Safe Management Solutions Inc. Franklin, IN, USA. All Rights Reserved.

Local &

Global

Safety Culture Survey: 5 Step Approach

Work with PDO to identify issues

Work with PDO to identify issues

Conduct Online Safety Survey

Conduct Online Safety Survey

Conduct behavioral Observations /

Interviews

Conduct behavioral Observations /

Interviews

Analyze DataAnalyze Data

Customize approach to suitCustomize approach to suit

Collate ResultsCollate Results

Present reportPresent report

• Step 2: Safety Culture Survey Development

• Step 1: Onsite Validation Activities

• Step 4: Write Safety Survey Report

• Step 4: Distribute Survey to Personnel

• Step 5: Present Safety Survey Report

© 1992 - 2012 : B-Safe Management Solutions Inc. Franklin, IN, USA. All Rights Reserved.

Local &

Global

Safety Culture Assessment Survey Project

• Survey questions based on 20 years academic work

• Survey consistently measures safety culture and is accurate

• Demographics

• Employer, Primary Worksite, Employment Category & Injury Experience

• Staff views on safety practices

• 4 Point Scale – Highly Disagree to Highly Agree

SC Person Element SC Process Element SC Action Element

Senior. Mgt. Commitment to Safety Safety Communications Housekeeping

Middle Mgt. Commitment to Safety Safety Procedures On-the-Job Approach to Safety

Front-line Mgt. Commitment Emergency Preparedness

Associates Commitment to Safety Safety Training

On-the-Job Risk

Quality of Welfare Arrangements People’s Risk Rating of Workplace Hazards

Peoples Involvement in Safety Activities

© 1992 - 2012 : B-Safe Management Solutions Inc. Franklin, IN, USA. All Rights Reserved.

Local &

Global

Safety Culture Survey Process

• Safety Culture Survey Reviewed, Revised and Approved by PDO

• Distribution Methods to Process Online link to Translated/ English Survey via

Email ‘Hard Copy’ Arabic version distributed to sites

• Safety Culture Survey was active for 8 Weeks

•Monitored Completion of Surveys and Sent Reminders

• On-site Validation Process Included: Safety Culture Survey Validation Interviews with

PDO personnel Onsite Observation of conditions and behaviours

© 1992 - 2012 : B-Safe Management Solutions Inc. Franklin, IN, USA. All Rights Reserved.

Local &

Global

Safety Survey Report• Comprehensive Written Reports for Well Engineering & Process Safety

• Survey Scores Each survey question’s mean average score converted into a percentage Percentage scores placed in a ‘Banding’ range based on surveys from past 20 years Beginning =0-30%, Developing = 31-60, Performing 61-80%, High Performing =81-90%, and

Excelling = 91-100%.

• Benchmarked against 5 other industry sectors (Chemicals, Manufacturing, Mining, Oil & Gas, Utilities)

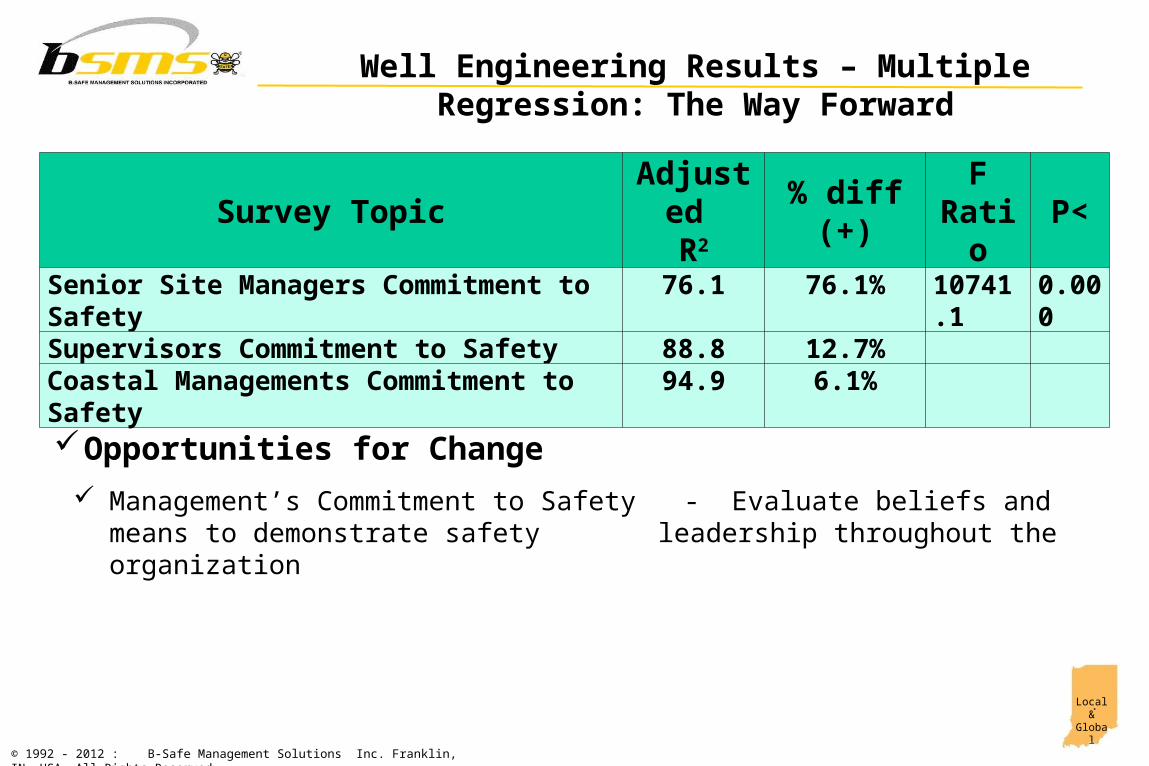
• Statistical Analyses Multiple Regression of all survey topics to Identify PDO’s ‘Safety Culture Predictors’ separately

for Well Engineering & Process Safety

© 1992 - 2012 : B-Safe Management Solutions Inc. Franklin, IN, USA. All Rights Reserved.

Local &

Global

Safety Survey Results

Well Engineering

© 1992 - 2012 : B-Safe Management Solutions Inc. Franklin, IN, USA. All Rights Reserved.

Local &

Global

Well Engineering Results - Sample Size & Response Rate

• 1,953 responses received from Well Engineering respondents

Employer Number of Respondents % of Sample

Abraj 40 2.05%Al Mansoori 22 1.13%Arabian Drilling 22 1.13%Baker Hughes 28 1.43%BJ 0 0.00%Boots & Coots 2 0.10%Dalma 353 18.07%Daqing Oilfield 2 0.10%Desert Byrne 1 0.05%DJ Towel 51 2.61%FOS 46 2.36%Halliburton 44 2.25%KCA Deutag 33 1.69%MBPS 437 22.38%Midwesco 40 2.05%Midwest 55 2.82%NDSC 16 0.82%PDO 197 10.09%Schlumberger 35 1.79%Sea & Land 146 7.48%Shaleem 69 3.53%Shiv - Vani 65 3.33%SOLTEX 15 0.77%Weatherford 166 8.50%Wood Group ESP 1 0.05%Other 57 2.92%

Worksite Number of Respondents % of Sample

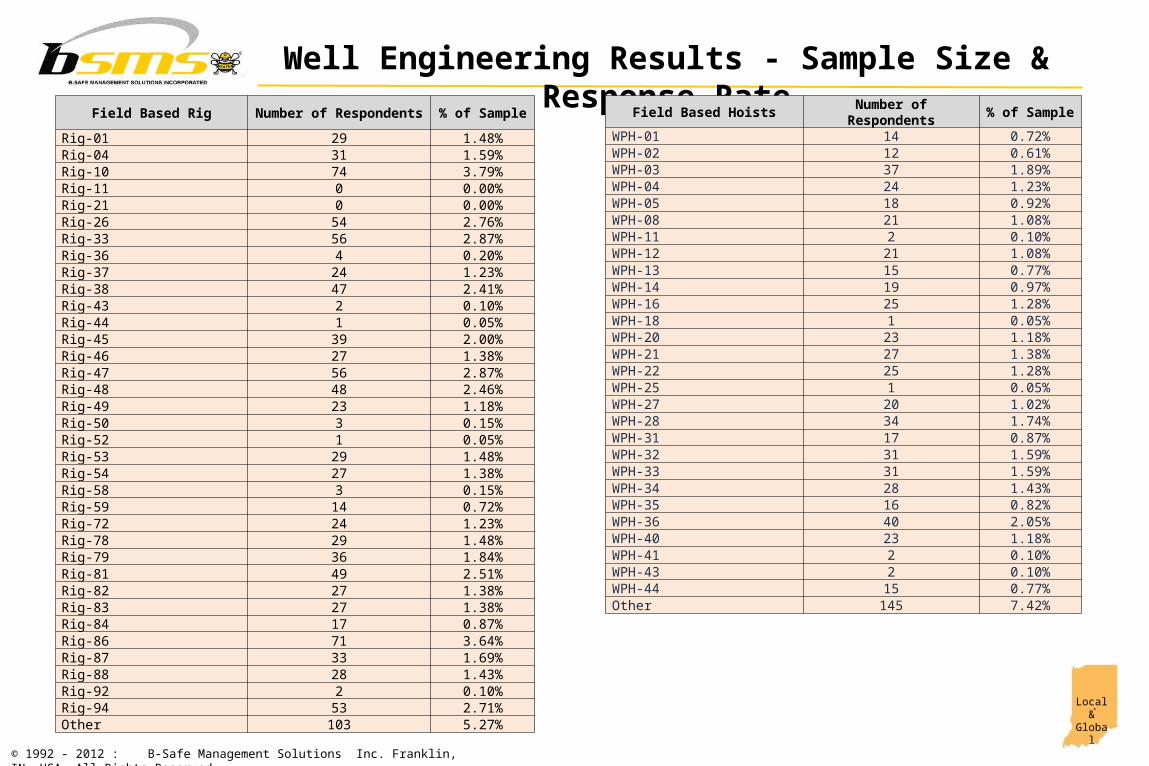
Coastal Based 115 5.89%Field Based Rig 1004 51.41%Field Based Hoist 544 27.85%Field Based Completion & Well Intervention -C&WI 156 7.99%

Field Based Office/Yard 122 6.25%

Field Based Office / Yard Number of Respondents % of SampleBahja 63 3.23%Fahud 166 8.50%Harweel 32 1.64%Lekhwair 110 5.63%Marmul 138 7.07%Nimr 269 13.77%Nizwa 30 1.54%Qarn Alam 144 7.37%Other 230 11.78%

Field Based Office / Yard Number of Respondents % of SampleSenior Manager 48 2.46%Department Head 34 1.74%Supervisor 609 31.18%Associates 1250 64.00%

Field Based Office / Yard Number of Respondents % of SampleInjured 119 6.09%Non-Injured 1822 93.29%

© 1992 - 2012 : B-Safe Management Solutions Inc. Franklin, IN, USA. All Rights Reserved.

Local &

Global

Well Engineering Results - Sample Size & Response RateField Based Hoists Number of Respondents % of Sample

WPH-01 14 0.72%WPH-02 12 0.61%WPH-03 37 1.89%WPH-04 24 1.23%WPH-05 18 0.92%WPH-08 21 1.08%WPH-11 2 0.10%WPH-12 21 1.08%WPH-13 15 0.77%WPH-14 19 0.97%WPH-16 25 1.28%WPH-18 1 0.05%WPH-20 23 1.18%WPH-21 27 1.38%WPH-22 25 1.28%WPH-25 1 0.05%WPH-27 20 1.02%WPH-28 34 1.74%WPH-31 17 0.87%WPH-32 31 1.59%WPH-33 31 1.59%WPH-34 28 1.43%WPH-35 16 0.82%WPH-36 40 2.05%WPH-40 23 1.18%WPH-41 2 0.10%WPH-43 2 0.10%WPH-44 15 0.77%Other 145 7.42%

Field Based Rig Number of Respondents % of Sample

Rig-01 29 1.48%Rig-04 31 1.59%Rig-10 74 3.79%Rig-11 0 0.00%Rig-21 0 0.00%Rig-26 54 2.76%Rig-33 56 2.87%Rig-36 4 0.20%Rig-37 24 1.23%Rig-38 47 2.41%Rig-43 2 0.10%Rig-44 1 0.05%Rig-45 39 2.00%Rig-46 27 1.38%Rig-47 56 2.87%Rig-48 48 2.46%Rig-49 23 1.18%Rig-50 3 0.15%Rig-52 1 0.05%Rig-53 29 1.48%Rig-54 27 1.38%Rig-58 3 0.15%Rig-59 14 0.72%Rig-72 24 1.23%Rig-78 29 1.48%Rig-79 36 1.84%Rig-81 49 2.51%Rig-82 27 1.38%Rig-83 27 1.38%Rig-84 17 0.87%Rig-86 71 3.64%Rig-87 33 1.69%Rig-88 28 1.43%Rig-92 2 0.10%Rig-94 53 2.71%Other 103 5.27%

© 1992 - 2012 : B-Safe Management Solutions Inc. Franklin, IN, USA. All Rights Reserved.

Local &

Global

Well Engineering Results - Average Safety Survey Score

PDO Well Engineering Total Score = 78.85%

© 1992 - 2012 : B-Safe Management Solutions Inc. Franklin, IN, USA. All Rights Reserved.

Local &

Global

Location Average % Survey Score Error Margin

Number of Responses Maturity

Well Engineering 78.85 % +/- 2% 1953 PerformingProcess Safety 80.90 % +/- 4% 497 Performing

Results – Average Safety Culture Scores

© 1992 - 2012 : B-Safe Management Solutions Inc. Franklin, IN, USA. All Rights Reserved.

Local &

Global

Well Engineering Results – Average Topic Scores

© 1992 - 2012 : B-Safe Management Solutions Inc. Franklin, IN, USA. All Rights Reserved.

Local &

Global

PDO– On-Site Validation

Validation interviews, discussion, observations

Some very good safety systems in place Some very good / comprehensive safety information posted on notice boards Many supervisors / managers have a good reputation regarding safety with their workforce Some of the best scaffolding standards in the GCC

Common Themes Identified

© 1992 - 2012 : B-Safe Management Solutions Inc. Franklin, IN, USA. All Rights Reserved.

Local &

Global

Well Engineering Results – On-Site Validation

Management / Supervision Managers say safety is important, but associates say productivity is put before safety to meet

production targets. Requests for Coastal-based management and HSE to visit field much more often

Safety Communications Many do not understand the HSE information provided from Muscat. Plans requested to explain how to use information to its fullest extent Numerous requests for assistance to turn information into practical application onsite Inconsistent transfer of information at site level Too much focus on minor incidents, not ‘kick’s, etc., that could lead to catastrophic events.

Safety Training Lack of awareness of people’s safety training needs. Materials and training are too simplistic Continuously repeated Pre-job safety briefs are seen as boring rituals Limited time for safety training, with requests for much more than currently provided Requests for HSE video library onsite in English & Arabic

Areas of Opportunity

© 1992 - 2012 : B-Safe Management Solutions Inc. Franklin, IN, USA. All Rights Reserved.

Local &

Global

Safety Procedures Too many safety regulations being created Confusing safety procedures slow the job down too much. Seems to lead to many people

working over allocated hours. Causing people to ignore them and focus on productivity. Noticeable that most people behaving safely, most of the time

Recognising Safety Performance Feeling in field based rigs / hoists that good/excellent safety performance is not being

recognised by corporate

Night Moves Night moves generally thought to be unsafe. Leading to people to work many more hours

than they should

Welfare Requests for annual health checks to test for ‘cocktail’ of chemical/fume exposures Noise at rig sites impacting on peoples sleep patterns. Impacting concentration levels during

shifts Many stated they experienced diarrhea and/or food poisoning due to poor food quality

Well Engineering Results – On-Site Validation

© 1992 - 2012 : B-Safe Management Solutions Inc. Franklin, IN, USA. All Rights Reserved.

Local &

Global

Additional Components Measured

Risk Rating Aligns with ratings of the ‘Process Element, On-the-Job Risk, and

Focuses on the Actual risks faced

SC Person Element SC Process Element SC Action Element

Senior. Mgt. Commitment to Safety Safety Communications On-the-Job Approach to Safety

Middle Mgt. Commitment to Safety Safety Procedures Housekeeping

Front-line Mgt. Commitment Emergency Preparedness

Associates Commitment to Safety Safety Training

On-the-Job Risk

© 1992 - 2012 : B-Safe Management Solutions Inc. Franklin, IN, USA. All Rights Reserved.

Local &

Global

Well Engineering Results – Personal Injury Risk Ratings

Workplace HazardsNumber of responses(ex 1953)

PDO Mean Average

Std. Dev. (Spread)

Risk Rating Maturity

Rating

Storage/stacking of goods/materials 1558 2.73 .92 68.3 MediumWorkplace design & layout problems 1639 2.68 .94 67.1 MediumManual handling 1733 2.56 .96 63.9 MediumVibration 1605 2.55 .95 63.7 MediumUse of compressed gas cylinders 1585 2.53 .99 63.2 MediumLoading / Unloading of vehicles 1525 2.51 .95 62.7 MediumContact with hot objects & surfaces 1656 2.49 .97 62.3 MediumFire 1743 2.48 1.00 62.0 Medium

Total Mean Average 1915 2.42 .71 60.6 MediumElectrical Hazards 1749 2.41 .97 60.3 MediumConfined Space 1690 2.38 .99 59.6 MediumPinch points & caught between 1757 2.31 .95 57.9 MediumExplosions from hazardous / flammable gases 1625 2.30 1.07 57.4 MediumUse of hand tools 1762 2.28 .99 57.1 MediumWorking with hazardous chemicals 1653 2.25 1.02 56.1 MediumSlipping and Tripping 1861 2.25 .89 56.2 MediumDropped objects 1803 2.25 .97 56.2 MediumCrane & Forklift Operations 1737 2.23 .97 55.7 MediumHigh pressure line/equipment failure 1652 2.22 .99 55.6 MediumWorking at Height 1734 2.21 1.02 55.2 MediumExposure to H2S 1755 2.19 1.02 54.8 MediumNoise 1836 2.04 .93 50.9 Medium

© 1992 - 2012 : B-Safe Management Solutions Inc. Franklin, IN, USA. All Rights Reserved.

Local &

Global

Additional Components Measured

Involvement Aligns with ‘Action Element’, Associates’ On-the-Job Approach to

Safety, indicates the specific activities people have been involved and when

SC Person Element SC Process Element SC Action Element

Senior. Mgt. Commitment to Safety Safety Communications On-the-Job Approach to Safety

Middle Mgt. Commitment to Safety Safety Procedures Housekeeping

Front-line Mgt. Commitment Emergency Preparedness

Associates Commitment to Safety Safety Training

On-the-Job Risk

© 1992 - 2012 : B-Safe Management Solutions Inc. Franklin, IN, USA. All Rights Reserved.

Local &

Global

Well Engineering Results – Involvement in Safety

Involvement In SafetyNumber of responses(ex 1953)

PDO Mean

Average

Std. Dev. (Spread)

Average Time since last involved

Seen a safety video 1934 4.18 1.07 6-9 MonthsTried to prevent a colleague doing something unsafe 1934 4.17 1.36 6-9 monthsDiscussed safety at a crew briefing 1934 4.10 1.35 6-9 MonthsReported an unsafe practice 1933 4.06 1.39 6-9 MonthsAttended a safety training course 1934 4.00 1.18 6-9 monthsTook part in an emergency drill 1934 3.97 1.45 9-12 MonthsTook part in a STOP tour or Hazard Hunt 1934 3.86 1.55 9-12 MonthsSelected and trialed PPE 1933 3.75 1.62 9-12 MonthsTook part in a risk assessment/HAS 1934 3.72 1.55 9-12 MonthsRaised a suggestion to improve safety 1934 3.71 1.49 9-12 Months

Total Mean Average 1934 3.48 .90 9-12 MonthsReported a near-miss 1934 3.33 1.75 9-12 MonthsPresented at a safety committee meeting 1934 3.22 1.90 9-12 MonthsHelped review a safety procedure 1934 3.09 1.78 9-12 MonthsParticipated in an accident investigation 1934 2.46 1.88 12-24 Months

Use of Time out for Safety Maturity RatingJobs are stopped when ‘Time Outs’ are called 1883 2.14 .51 DevelopingHow many times have you called a ‘Time Out’? 1932 1.86 1.65 Beginning

© 1992 - 2012 : B-Safe Management Solutions Inc. Franklin, IN, USA. All Rights Reserved.

Local &

Global

Additional Components Measured

Welfare Arrangements Aligns with ‘Person Element’, the Commitment to Safety, and

identifies the welfare arrangements that affects people’s commitment

SC Person Element SC Process Element SC Action Element

Senior. Mgt. Commitment to Safety Safety Communications On-the-Job Approach to Safety

Middle Mgt. Commitment to Safety Safety Procedures Housekeeping

Front-line Mgt. Commitment Emergency Preparedness

Associates Commitment to Safety Safety Training

On-the-Job Risk

© 1992 - 2012 : B-Safe Management Solutions Inc. Franklin, IN, USA. All Rights Reserved.

Local &

Global

Phase 3: Results – Welfare Arrangements

Welfare ArrangementsNumber of responses(ex 2265)

Mean Average

(Scale 1-5)

Std. Dev. (Spread)

Average Rating

Quality of Personal Protective Equipment (PPE) 1881 3.55 1.24 Adequate

Washing of coveralls / work wear 1844 3.50 1.17 AdequateFirst Aid facilities 1891 3.47 1.27 AdequateProvision of coveralls/ work wear 1858 3.36 1.28 Adequate

Total Mean Average 1916 3.22 .99 AdequateAccommodation facilities 1850 3.21 1.32 AdequateWashing facilities 1881 3.19 1.07 AdequateToilet facilities 1889 3.10 1.32 AdequateMessing / Refreshment facilities 1820 2.79 1.35 PoorRecreation facilities 1811 2.69 1.37 Poor

© 1992 - 2012 : B-Safe Management Solutions Inc. Franklin, IN, USA. All Rights Reserved.

Local &

Global

Survey Topics Correlation Coefficient

SignificanceP<.10*

orP< 0.05**

Risk Ratings -.026 .442Involvement in Safety Ratings -.085 .313Welfare Ratings .024 .446 Coastal Management’s Commitment to Safety -.164 .180Senior Site Management’s Commitment to Safety -.227 .099*

Supervisor’s Commitment to Safety -.343 .023**Associate’s Commitment to Safety -.213 .114Safety Communications -.251 .076*Standard Operating Procedures -.117 .252Emergency Preparation -.299 .043**Safety Training -.273 .047**On-the-Job Risk -.133 .227Housekeeping -.162 .181On-the-Job Approach to Safety -.309 .038**

Field Based Rigs

Survey Topics

Correlation Coefficient

SignificanceP<.10*

orP< 0.05*

Risk Ratings -.130 .250Involvement Ratings .097 .309Welfare Ratings .141 .233 Coastal Management’s Commitment to Safety -.130 .251Senior Site Management’s Commitment to Safety -.202 .146Supervisor’s Commitment to Safety -.047 .404Associate’s Commitment to Safety -.143 .233Safety Communications -.099 .304Standard Operating Procedures -.244 .101Emergency Preparation -.214 .133Safety Training -.329 .041**On-the-Job Risk -.136 .241Housekeeping -.320 .046**On-the-Job Approach to Safety -.292 .062*

Hoist Based Rigs

Correlation Between Survey Scores and Incident Statistics

© 1992 - 2012 : B-Safe Management Solutions Inc. Franklin, IN, USA. All Rights Reserved.

Local &

Global

Multiple Regression

A way to identify those survey topics that predict PDO’s future safety performance to provide focus

On-the-Job Risk

Management & Associates Commitment to Safety

Safety Communications

On-the-Job Approach to Safety

The few Topics identified that will

provide most significant impact if improved

Action Elements

Person Elements

Process Elements

Overall Safety Culture

Improvement

The larger the correlation the larger the influence…

Emergency Preparation

SOP’s

Safety Training

Housekeeping

© 1992 - 2012 : B-Safe Management Solutions Inc. Franklin, IN, USA. All Rights Reserved.

Local &

Global

Survey Topic Adjusted R2 % diff (+) F

Ratio P<

Senior Site Managers Commitment to Safety 76.1 76.1% 10741.1 0.000Supervisors Commitment to Safety 88.8 12.7% Coastal Managements Commitment to Safety 94.9 6.1%

Well Engineering Results – Multiple Regression: The Way Forward

Management’s Commitment to Safety - Evaluate beliefs and means to demonstrate safety leadership throughout the organization

Opportunities for Change

© 1992 - 2012 : B-Safe Management Solutions Inc. Franklin, IN, USA. All Rights Reserved.

Local &

Global

There are 5 major Safety Culture areas where progress can be made to propel PDO Well Engineering into the world-class safety culture range.

Enhance the safety leadership skills of all managerial levels.

Fully involve Associates in safety via sound and proven strategies, such as conducting risk assessments, and developing a comprehensive and adaptive Behavioral Safety process.

Review the quality of the content, delivery and scope of PDO’s Safety Training courses and their effectiveness;

Review the quality, type and number of safety communications to ensure the safety message is received as intended in the field

Set a corporate target of 95% of all corrective actions being completed within 30 days of being reported and track it.

Phase 4: The Way Forward

© 1992 - 2012 : B-Safe Management Solutions Inc. Franklin, IN, USA. All Rights Reserved.

Local &

Global

PDO Safety Survey Results

Process Safety

© 1992 - 2012 : B-Safe Management Solutions Inc. Franklin, IN, USA. All Rights Reserved.

Local &

Global

Process Safety Results - Sample Size & Response Rate

• 479 responses received by Process Safety respondents

Employer Number of Respondents

% of Sample

OSD 212 44.26%Other PDO Directorate 80 16.70%PDO main/sub-contractor - Other PDO contractor 63 13.15%GD 47 9.81%UID 36 7.52%OND 20 4.18%PDO main/sub-contractor - Standalone Engineering contractor 4 0.84%

PDO main/sub-contractor - EMC North 3 0.63%PDO main/sub-contractor - OND North 2 0.42%PDO main/sub-contractor - EMC South 1 0.21%PDO main/sub-contractor - OND South 0 0.00%XD 0 0.00%

Worksite Number of Respondents

% of Sample

MaF based - Office based 170 35.49%Interior based - Marmul 79 16.49%Interior based - Amal Steam Project 63 13.15%Interior based - Nimr 62 12.94%Interior based - Other PDO area/station 54 11.27%Interior based - CPP 22 4.59%Interior based - Other PDO project 8 1.67%MaF based - Site based (Workshop, Terminal, Laboratory, etc.) 5 1.04%

Interior based - Fahud 4 0.84%Interior based - Harweel 0 0.00%Interior based - Seismic field work 0 0.00%

Employment Category Number of Respondents

% of Sample

Senior Manager 10 2.09%Department Head 48 10.02%Supervisor 159 33.19%Associates 250 52.19%

Injury Experience Number of Respondents % of Sample

Injured 24 5.01%Non-Injured 443 92.48%

© 1992 - 2012 : B-Safe Management Solutions Inc. Franklin, IN, USA. All Rights Reserved.

Local &

Global

Process Safety Results - Average Safety Survey Score

PDO Process Safety Total Score = 80.9%

© 1992 - 2012 : B-Safe Management Solutions Inc. Franklin, IN, USA. All Rights Reserved.

Local &

Global

Location Average % Survey Score Error Margin

Number of Responses Range

Process Safety 80.9 +/- 4% 497 PerformingWell Engineering 79.5 +/- 2% 1953 Performing

Results – Average Safety Culture Scores

© 1992 - 2012 : B-Safe Management Solutions Inc. Franklin, IN, USA. All Rights Reserved.

Local &

Global

Breakdown of Results

What We Measured to Establish the Level of Safety Culture

SC Person Element SC Process Element SC Action Element

Senior. Mgt. Commitment to Safety Safety Communications On-the-Job Approach to Safety

Middle Mgt. Commitment to Safety Safety Procedures Housekeeping

Front-line Mgt. Commitment Emergency Preparedness

Associates Commitment to Safety Safety Training

On-the-Job Risk

Welfare Arrangements Personal Injury Hazards Involvement in Safety

Process Safety Hazards

© 1992 - 2012 : B-Safe Management Solutions Inc. Franklin, IN, USA. All Rights Reserved.

Local &

Global

Process Safety Results – Average Topic Scores

© 1992 - 2012 : B-Safe Management Solutions Inc. Franklin, IN, USA. All Rights Reserved.

Local &

Global

Additional Components Measured

Risk Rating Aligns with ratings of the ‘Process Element, On-the-Job Risk, and Focuses

on the Actual risks faced

SC Person Element SC Process Element SC Action Element

Senior. Mgt. Commitment to Safety Safety Communications On-the-Job Approach to Safety

Middle Mgt. Commitment to Safety Safety Procedures Housekeeping

Front-line Mgt. Commitment Emergency Preparedness

Associates Commitment to Safety Safety Training

On-the-Job Risk

© 1992 - 2012 : B-Safe Management Solutions Inc. Franklin, IN, USA. All Rights Reserved.

Local &

Global

Process Safety Results – Personal Injury Risk Ratings

Personal Injury Causing Workplace Hazards # of Responses(ex 479)

PDO Mean Average

Std. Dev. (Spread) Risk Rating

Conducting seismic operations 203 3.11 0.87 LowStorage/stacking of Goods/Materials 347 3.05 0.78 LowOperating and maintaining marine oil facilities 183 3.00 0.98 Low Operating and maintaining air travel facilities 205 2.97 0.96 MediumConditions leading to hand/body vibration 352 2.96 0.89 MediumManual handling of heavy Goods/Materials 339 2.96 0.84 MediumLoading/unloading of vehicles 326 2.88 0.91 MediumEntanglement & trapping in machinery 350 2.86 0.93 MediumMobile plant operations on site 309 2.84 0.92 MediumInadequate house keeping 437 2.81 0.79 MediumUse of hand and power tools 364 2.81 0.91 MediumContact with hot objects & surfaces 370 2.80 0.88 MediumInadequate Hygiene and food poisoning 408 2.80 0.84 MediumWorkplace design & layout problems 443 2.78 0.80 MediumFalling objects 439 2.78 0.87 MediumCompressed air hazards 350 2.77 0.96 MediumTotal Mean Average 463 2.76 0.64 MediumUse of compressed gas cylinders 321 2.75 1.00 MediumLifting operations 345 2.73 0.92 MediumActions leading to Repetitive Strain Injury 427 2.68 0.84 MediumFire potential of combustible/flammable materials 385 2.65 0.91 MediumWorking with hazardous chemicals 347 2.65 1.01 MediumWorking at height 351 2.63 1.01 MediumSlipping and Tripping 453 2.62 0.83 MediumWork in situations leading to ergonomic issues 404 2.61 0.86 MediumElectrical Hazards 436 2.61 0.95 MediumExposure to environmental hazards (heat, scorpions, etc.) 395 2.59 0.87 MediumExplosions from hazardous/flammable gases 370 2.57 1.02 MediumNoise 415 2.55 0.91 MediumContact with process fluids (H2S, oil etc.) 365 2.38 0.99 MediumStress (work pressure, emotional stress, etc.) 451 2.16 0.81 MediumRoad Transport. 439 2.14 0.91 Medium

© 1992 - 2012 : B-Safe Management Solutions Inc. Franklin, IN, USA. All Rights Reserved.

Local &

Global

Additional Components Measured

Process Risk Ratings Aligns with ratings of the ‘Process Element, On-the-Job Risk, and

Focuses on the Actual risks faced

SC Person Element SC Process Element SC Action Element

Senior. Mgt. Commitment to Safety Safety Communications On-the-Job Approach to Safety

Middle Mgt. Commitment to Safety Safety Procedures Housekeeping

Front-line Mgt. Commitment Emergency Preparedness

Associates Commitment to Safety Safety Training

On-the-Job Risk

© 1992 - 2012 : B-Safe Management Solutions Inc. Franklin, IN, USA. All Rights Reserved.

Local &

Global

Phase 3: Results – Process Hazard Risk Ratings

Asset Damage Hazards# of

responses(ex 479)

PDO Mean Average

Std. Dev. (Spread) Risk Rating

Mobile plant operations 306 2.57 .93 MediumFrequent alarm patterns 347 2.54 .90 MediumCompressed air hazards 349 2.46 .94 MediumContact with hot objects & surfaces 353 2.44 .88 MediumTotal Mean Average 403 2.41 .83 MediumUse of compressed gas cylinders 343 2.40 .98 MediumNot complying with preventative maintenance plans 347 2.34 .93 MediumDuring plant shutting down and starting up 336 2.32 .89 MediumElectrical Hazards 378 2.29 .99 MediumOver-rides 336 2.22 .98 MediumProcess fluids spills and leaks 345 2.20 .90 MediumRelease of process fluids 331 2.18 .97 MediumNot complying to PtW requirements where applicable 352 2.18 1.04 MediumFire potential of combustible/flammable gases 364 2.16 .98 MediumNot conducting isolation where applicable 341 2.15 1.08 MediumCorrosion of pipeline and equipment 340 2.12 .95 MediumNot conducting gas test where applicable 333 2.12 1.04 MediumExplosions from hazardous/flammable gases 348 2.08 1.03 Medium

© 1992 - 2012 : B-Safe Management Solutions Inc. Franklin, IN, USA. All Rights Reserved.

Local &

Global

Potential Process Safety Indicators

Potential Process Safety Indicators Indicator Type Indicator Status

Asset Integrity Frequent alarm patterns Performance Driver LeadingIdentifying Potential Compressed air hazards Performance Driver LeadingIdentifying Potential Electrical Hazards Performance Driver LeadingIdentifying Corrosion of pipeline and equipment Performance Driver LeadingContact with hot objects & surfaces Outcome LaggingLeaks (i.e. Fire potential) of combustible/flammable gases Outcome LeadingProcess fluids spills and leaks Outcome LaggingRelease of process fluids Outcome LaggingExplosions from hazardous/flammable gases Outcome Lagging

Operator CompetencyCorrect Use of compressed gas cylinders (behaviors) Performance Driver LeadingMobile plant operations (Behaviors) Performance Driver LeadingPlant shut down and start up failures Outcome LaggingOver-rides Outcome Lagging

Safety Management Activities (Behaviors)Complying with preventative maintenance plans Performance Driver LeadingComplying to PtW requirements where applicable Performance Driver LeadingConducting isolation where applicable Performance Driver LeadingConducting gas test where applicable Performance Driver Leading

© 1992 - 2012 : B-Safe Management Solutions Inc. Franklin, IN, USA. All Rights Reserved.

Local &

Global

Additional Components Measured

Involvement Aligns with ‘Action Element’, Associates’ On-the-Job Approach to

Safety, indicates the specific activities people have been involved and when

SC Person Element SC Process Element SC Action Element

Senior. Mgt. Commitment to Safety Safety Communications On-the-Job Approach to Safety

Middle Mgt. Commitment to Safety Safety Procedures Housekeeping

Front-line Mgt. Commitment Emergency Preparedness

Associates Commitment to Safety Safety Training

On-the-Job Risk

© 1992 - 2012 : B-Safe Management Solutions Inc. Franklin, IN, USA. All Rights Reserved.

Local &

Global

Phase 3: Results – Process Safety - Involvement in Safety

Involvement In SafetyNumber of responses(ex 479)

PDO Mean Average

Std. Dev. (Spread)

Average Time since last involved

Seen a safety video 443 4.30 1.22 6-9 months Tried to prevent a colleague doing something unsafe 442 3.84 1.66 9-12 MonthsAttended a safety training course 443 3.79 1.37 9-12 MonthsDiscussed safety at a crew briefing 440 3.59 1.88 9-12 MonthsReported an unsafe practice 442 3.43 1.93 9-12 MonthsTook part in a STOP tour or Hazard Hunt 441 3.14 2.02 9-12 MonthsRaised a suggestion to improve safety 441 3.13 1.90 9-12 Months

Total Mean Average 443 2.85 1.11 9-24 MonthsTook part in an emergency drill 441 2.80 1.98 12-24 MonthsTook part in a risk assessment/HAS 441 2.77 2.03 12-24 MonthsPresented at a safety committee meeting 441 2.39 2.12 12-24 MonthsSelected and trialed Personal Protective Equipment 440 2.34 2.09 12-24 MonthsReported a near-miss 441 2.28 1.95 12-24 MonthsHelped review a safety procedure 441 2.10 2.03 12-24 MonthsParticipated in an accident investigation 442 1.55 1.82 More than 2 years

Use of Time out for Safety Maturity RatingJobs are stopped when “Time Outs” are called 437 2.40 .89 DevelopingHow many times have you called a “Time-Out”? 438 1.69 1.81 Beginning

© 1992 - 2012 : B-Safe Management Solutions Inc. Franklin, IN, USA. All Rights Reserved.

Local &

Global

Additional Components Measured

Welfare Arrangements Aligns with ‘Person Element’, the Commitment to Safety, and

identifies the welfare arrangements that affects people’s commitment

SC Person Element SC Process Element SC Action Element

Senior. Mgt. Commitment to Safety Safety Communications On-the-Job Approach to Safety

Middle Mgt. Commitment to Safety Safety Procedures Housekeeping

Front-line Mgt. Commitment Emergency Preparedness

Associates Commitment to Safety Safety Training

On-the-Job Risk

© 1992 - 2012 : B-Safe Management Solutions Inc. Franklin, IN, USA. All Rights Reserved.

Local &

Global

Process Safety Results – Welfare Arrangements

Welfare ArrangementsNumber of responses(ex 479)

Mean Average

(Scale 1-5)

Std. Dev.

(Spread)

Average Rating

First Aid facilities 413 3.56 .94 AdequateQuality of Personal Protective Equipment (PPE) 395 3.54 .99 AdequateAccommodation facilities 374 3.45 .98 Adequate

Total Mean Average 423 3.41 .76 AdequateProvision of coveralls/ work wear 383 3.40 1.07 AdequateWashing facilities 385 3.39 .98 AdequateToilet facilities 419 3.39 .96 AdequateWashing of coveralls / work wear 335 3.33 1.01 AdequateRecreation facilities 391 3.27 1.02 AdequateMessing / Refreshment facilities 387 3.25 1.01 Adequate

© 1992 - 2012 : B-Safe Management Solutions Inc. Franklin, IN, USA. All Rights Reserved.

Local &

Global

Survey Topic Adjusted R2 % diff (+) F

Ratio P<

Senior Site Managers Commitment to Safety .537 53.73 574.18 .000‘On-the-Job’ Approach to Safety .744 20.66 Emergency Preparedness .834 8.98 Housekeeping .885 5.10

Process Safety Results – Multiple Regression: The Way Forward

Sr. Mgmt. Commitment to Safety - Evaluate beliefs and means to demonstrate ‘On-the-Job’ Approach to Safety - Need to reduce the number of ‘At-Risk’

behaviors Emergency Preparedness - Evaluate plans and awareness of workforce Housekeeping - Need to review effectiveness and time spent

Opportunities for Change

© 1992 - 2012 : B-Safe Management Solutions Inc. Franklin, IN, USA. All Rights Reserved.

Local &

Global

There are 6 major Safety Culture areas where progress can be made to propel PDO Process Safety into the world-class safety culture range.

Enhance the safety leadership skills of all managerial levels.

Review the current risk assessments with the job holders, and identify gaps to help put any appropriate risk controls in place.

Address the inherent Asset Damaging Process Safety risks and consider, If not already done, examining incident databases by those Process Safety risks that fall under Asset Integrity, Operator Competency and Safety Management activities to identify which type of process safety risk is most prevalent in PDO;

Fully involve Associates in safety via sound and proven strategies, such as conducting risk assessments, and developing a comprehensive and adaptive Behavioral Safety process.

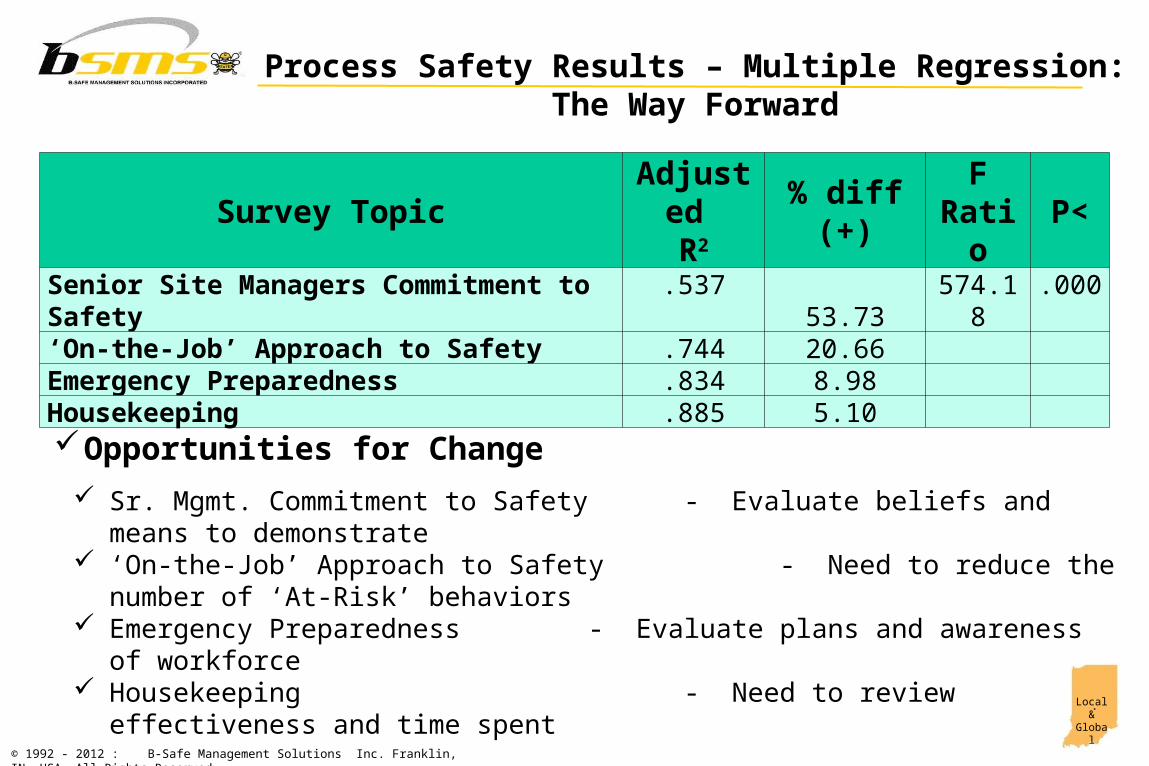
Review the effectiveness of the Emergency Preparedness .

Review ways of improving and maintaining housekeeping

Set a corporate target of 95% of all corrective actions being completed within 30 days of being reported and track it.

Phase 4: The Way Forward

© 1992 - 2012 : B-Safe Management Solutions Inc. Franklin, IN, USA. All Rights Reserved.

Local &

Global

Questions / Comments?


Recommended