1
SHEAR CAPACITY OF POST-TENSIONED CONCRETE GIRDERS WITHOUT SHEAR REINFORCEMENT
By
GUSTAVO ADOLFO LLANOS
A THESIS PRESENTED TO THE GRADUATE SCHOOL OF THE UNIVERSITY OF FLORIDA IN PARTIAL FULFILLMENT
OF THE REQUIREMENTS FOR THE DEGREE OF MASTER OF SCIENCE
UNIVERSITY OF FLORIDA
2008
4
ACKNOWLEDGMENTS
I would like to thank the chair and members of my supervisory committee for their
mentoring, and the Florida Department of Transportation for its generous support. I thank my
family and friends for their loving encouragement, which motivated me to complete my study.
5
TABLE OF CONTENTS page
ACKNOWLEDGMENTS ...............................................................................................................4
LIST OF TABLES ...........................................................................................................................7
LIST OF FIGURES .........................................................................................................................8
LIST OF ABBREVIATIONS ........................................................................................................11
ABSTRACT ...................................................................................................................................12
CHAPTER
1 OBJECTIVES .........................................................................................................................14
2 APPROACH ...........................................................................................................................15
3 LITERATURE REVIEW .......................................................................................................16
4 GIRDER DESIGN ..................................................................................................................20
5 BEAM NOMENCLATURE ...................................................................................................24
6 GIRDER CONSTRUCTION AND MATERIAL PROPERTIES ..........................................25
7 PRESTRESSING ....................................................................................................................40
7.1 Prestressing Application ..............................................................................................40 7.2 Instrumentation ............................................................................................................40 7.3 Results: Seating Losses ................................................................................................41
8 MATERIAL PROPERTIES ...................................................................................................55
9 SHEAR TEST SETUP AND PROCEDURES .......................................................................56
10 RESULTS AND DISCUSSION: SHEAR TESTS .................................................................61
10.1 Test C1U3 ....................................................................................................................61 10.2 Test C2U3 ....................................................................................................................61 10.3 Test C3U2 ....................................................................................................................62
11 EFFECT OF SUPPORT CONDITIONS ON BEHAVIOR ...................................................74
12 STRUT AND TIE ANALYSIS: C3U2 ..................................................................................86
6
13 COMPARISON WITH THEORETICAL CAPACITIES ......................................................97
14 SUMMARY AND CONCLUSIONS ...................................................................................100
LIST OF REFERENCES .............................................................................................................102
BIOGRAPHICAL SKETCH .......................................................................................................103
7
LIST OF TABLES
Table page 6-1 Dates of C beams ...............................................................................................................39
7-1 Jacking force measured with load cell ...............................................................................53
7-2 Working P-gages for each C beam ....................................................................................53
7-3 Measured changes in stress due to seating losses ..............................................................53
7-5 Elastic losses for C beams ..................................................................................................53
7-6 Long term losses in C2 ......................................................................................................54
8-1 Average cylinder strengths ................................................................................................55
8-2 PT-bar strengths .................................................................................................................55
13-1 Post-tensioned beam nominal moment capacities .............................................................99
13-2 Post-tensioned beam shear capacity results .......................................................................99
8
LIST OF FIGURES
Figure page 3-1 Strength of concrete beams failing in shear for various a/d ratios .....................................19
4-1 Full beam section ...............................................................................................................20
4-2 Girder cross section and post-tensioning tendon details ....................................................21
4-3 Reinforcement and tendon layout ......................................................................................22
4-4 Deck configuration and reinforcement ..............................................................................23
5-5 Beam nomenclature ...........................................................................................................24
6-1 Pouring of beam .................................................................................................................27
6-2 End block reinforcement ....................................................................................................28
6-4 Strain gages leads exiting duct ...........................................................................................30
6-5 Placement of U-bars ...........................................................................................................31
6-6 Formwork of beam and vibrating of concrete ....................................................................32
6-7 Bottom anchorage with PT duct and grouting tube.. .........................................................33
6-8 Beam being poured ............................................................................................................34
6-9 Pouring of beam finished ...................................................................................................35
6-10 Hand pump for grouting.....................................................................................................36
6-11 Deck formwork and mild steel reinforcement ...................................................................37
6-12 Finished beam ....................................................................................................................38
7-1 Hydraulic jack used to stress tendons ................................................................................44
7-2 Tendon designation for C beams .......................................................................................45
7-3 Location of gages for C beams ..........................................................................................46
7-4 Tendon stress during post-tensioning of beam C1 .............................................................47
7-5 Tendon stress during post-tensioning of beam C2 .............................................................48
7-6 Example of seating and elastic losses ................................................................................49
9
7-7 Summary of seating losses .................................................................................................50
7-8 Summary of elastic losses ..................................................................................................51
7-9 Long term strains in beam C2 ............................................................................................52
9-1 Test setup and instrumentation for C beams ......................................................................56
9-2 Support Conditions for C1U3 and C2U3 ...........................................................................57
9-3 Test C1U3 ..........................................................................................................................58
9-4 Test C2U3 ..........................................................................................................................59
9-5 Test C3U2 ..........................................................................................................................60
10-1 Load vs. displacement for C1U3 .......................................................................................63
10-2 C1U3S14 plot ....................................................................................................................64
10-3 First and final crack pattern for C1U3 ...............................................................................65
10-4 Load vs. displacement for C2U3 .......................................................................................66
10-5 C2U3S14 plot ....................................................................................................................67
10-6 First and final crack pattern for C2U3 ...............................................................................68
10-7 Load vs. displacement for C3U2 .......................................................................................69
10-8 First and final crack pattern for C3U2 ...............................................................................70
10-9 Strain gages S13, S14, and S15 .........................................................................................71
10-10 Crack causing transfer of flexure to strut and tie ...............................................................72
10-11 Cracks around PT anchorage .............................................................................................73
11-1 Support condition for C1U3 ...............................................................................................77
11-2 Support condition for C2U3 ...............................................................................................78
11-3 Computer model of beam C at an a/d ratio of 3.0 ..............................................................79
11-4 Bearing friction model .......................................................................................................80
11-5 Definition of transverse support displacement ..................................................................81
11-6 Effect of support restraint on the beam capacity ...............................................................82
10
11-7 Load vs. displacement for C1U3 and C2U3 ......................................................................83
11-8 Plot of C1U3S14, C2U3S14, total bottom displacement for C1U3 and C2U3 .................84
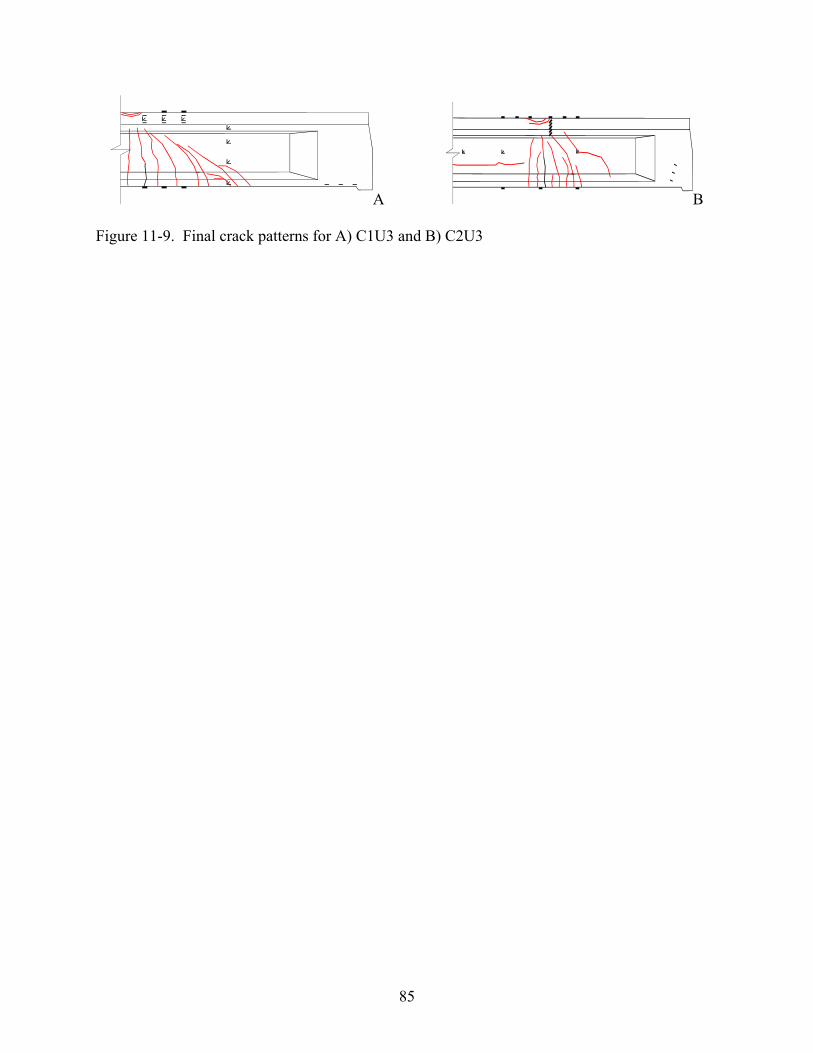
11-9 Final crack patterns ............................................................................................................85
12-1 C3U2 strain gages S13, S14, and S15................................................................................89
12-2 Crack causing transfer of flexure to strut and tie ...............................................................90
12-3 Change in strain as loading ................................................................................................91
12-4 Strut and tie model .............................................................................................................92
12-5 Strain gage plot for S5, S6, and S18 ..................................................................................93
12-6 Change in strain as loading ................................................................................................94
12-7 Strut and tie model .............................................................................................................95
12-8 Strain gage plot for S5, S6, and S18 ..................................................................................96
13-9 Forces in strut-and-tie model .............................................................................................98
11
LIST OF ABBREVIATIONS
a/d shear span to depth
fpu specified tensile strength of prestressing steel (ksi)
Icr cracked moment of inertia (in.4)
LVDT linear variable displacement transducer
Mn nominal moment capacity (kip*ft)
PT post-tensioning
w/c water cement ratio
Vc shear contribution of concrete (kip)
Vs shear contribution of the steel stirrups (kip)
ΔT total lateral displacement (in)
θ strut angle
β factor relating effect of longitudinal strain on the shear capacity of concrete
12
Abstract of Dissertation Presented to the Graduate School of the University of Florida in Partial Fulfillment of the Requirements for the Degree of Doctor of Philosophy
SHEAR CAPACITY OF POST-TENSIONED CONCRETE GIRDERS WITHOUT SHEAR
REINFORCEMENT
By
Gustavo Adolfo Llanos
December 2008
Chair: Homer Hamilton Major: Civil Engineering
The objective of this study was to evaluate the behavior of post-tensioned I-girders with
end blocks. The beams had two parabolic tendons and two straight that were anchored at each of
the ends of the beam. Post-tensioning of the beams was done in the laboratory with the objective
of measuring losses due to seating, elastic, creep and shrinkage.
Outside of the end block, approximately 3 ft from each end, there was no shear
reinforcement. U-bars were used in the top flange to provide composite action between the deck
and girder. Without the presence of shear reinforcement loading configurations used short shear
span to depth ratios to see if a shear failure would occur.
In the field these beams were observed to have no bearing pads and rested directly on
concrete. Two post-tensioned beams with the same loading pattern were tested to failure with
only the support condition varying, one neoprene and one resting directly on concrete. This was
done to see if the stiffness would be affected by the support conditions. A third test was
conducted for a shorter shear span to observe the type of failure that would occur. Each girder
was instrumented to measure strains, vertical deflections and crack initiation at relevant points.
13
Finally, capacities were predicted using three methods, ACI, AASHTO, and Strut-and-Tie.
These predicted values were compared to experimental capacities to observe the disparity
between the two.
14
CHAPTER 1 OBJECTIVES
One of the early forms of prestressing used in Florida for short span bridges was a precast,
post-tensioned I-girder with end blocks. These girders were used in simply supported conditions
in which the beam would bear directly on the concrete pier cap with only a layer of tar paper
separating the two. These beams are particularly interesting because they are post-tensioned
with both parabolic and straight threadbar tendons and have no shear reinforcement. Mild steel
reinforcement is provided only at the end blocks approximately 3 ft from each end, presumably
to protect against anchorage failure.
15
CHAPTER 2 APPROACH
Three beams were constructed using construction drawings from actual bridge girders in
service as a basis for design. The beams were tested in three-point bending. Two of the beams
have a shear span to depth (a/d) ratio of 3.0 and the third had an a/d of 2.0. The first two beams
were tested with and without neoprene to determine how the behavior might change when the
horizontal reaction varies. The third beam evaluated the shear capacity with no mild steel shear
reinforcement.
16
CHAPTER 3 LITERATURE REVIEW
Schlaich et al.1 presented the strut-and-tie model. This method is similar to a truss model.
Compression is carried by concrete and is represented by struts. Diagonal struts are oriented
parallel to the expected axis of cracking. Tension forces are carried by stirrups, longitudinal
reinforcement, or prestressing steel. These tension members are called ties. Where the truss
members intersect is called nodes. Concrete represents the strength in the nodes. The anchorage
of the ties is important when considering the nodes strength. The strut-and-tie model allows
yielding in the ties before the failure of the concrete members such as the nodes and struts. The
nodes are classified depending on the forces acting on it. A minimum of three forces need to act
on a node to maintain equilibrium. There is also a region called an extended nodal zone which is
the intersection of the strut width and the tie width.
To use the strut-and-tie model the member is classified in regions, B and D. The B-regions
(B for beam or Bernoulli) are based on the Bernoulli hypothesis that strain distribution in a plane
remains linear for any loading condition such as bending, shear, axial forces and torsional
moments. D-regions (D for discontinuity, disturbance or detail) are the parts of the structure
where the strain distribution is nonlinear. These regions are labeled this way because of the
changes in geometry or due to changes in loading conditions. Strut-and-Tie models are best for
modeling short shear spans like B-regions.
The American Concrete Institute (ACI)2 provides examples of several different strut and
tie models for a variety of structural members. Guidelines are given when calculating the
strength of the struts, tie, and nodes. Reduction factors are provided for nodal zones under
different loading conditions. Examples are given for idealized prismatic struts and for bottle-
shaped struts. Bottle-shaped struts are present when there is diagonal reinforcement to prevent
17
splitting of the concrete. ACI reproduces Figure 3-1 from “Prestressed Concrete Structures3”.
The figure represents the shear strength of beam loaded at various a/d ratios. For beams loaded
at a/d ratios o f less than 2.5, D-regions control the design of the beam. For a/d ratios greater
than 2.5, B-regions are best for modeling the beams strength.
Ramirez4 (1994) does a full member strut-tie design of a precast pretensioned beam with
depressed strands at midspan. He compares his results with the ACI code which uses a sectional
approach. At the time the article was presented there were no requirements considering the
interaction of adjacent strands. A strut and tie model is presented which shows the detailing
needed to prevent splitting. A strut and tie model of the forces in the compression flange is also
presented. Proper detailing of the web flange connection is necessary to insure that cracking does
not occur. This could leave the flange ineffective in resisting longitudinal stresses.
Alshegeir and Ramirez5 (1992) performed testing of three full-scale pretensioned
AASHTO type I and II beams. Following testing an analysis was done. The use of higher
strength concrete would improve ultimate capacities by strengthening the nodes and the struts.
The size of the bearing plates at the load and support determine one of the dimensions in the
nodal zone. The dimensions in the nodal zone determine the stresses in them. The nodes in the
support and the load point encourage the use of the full uniaxial compressive strength of
concrete. This is because of all of the framing elements are in compression. When tension ties
are present in the node the use of a reduced uniaxial compressive strength should be used.
MacGregor and Wight6 (2005) explain six methods for shear design. The first is a Truss
Analogy also known as Strut and Tie model which considers one load case and analyzes the
mechanism resisting that load. The second is the traditional ACI design procedure which uses a
Vc, the shear contribution of concrete, term that is factored depending on the type of concrete
18
and also by an empirical function. ACI uses a Vs, the shear contribution of the stirrups, term
which implies that the cracks are forming at an angle close to 45 degrees. The following three
methods are variations of the Compression Field Theory (CFT). CFT looks at the web of the
beam cracking due to principal tension stresses in the web. Since the web is cracking the web
losses ability to transmit tension force. A mechanism similar to a truss carries tension forces
through stirrups and compression forces between the cracks. The first CFT method, CFT-84, did
not consider Vc and only considered the stirrups for contribution to shear capacity. The second
method, MCFT-94, took into account the contribution of concrete similar to ACI but factored Vc
by β which considers the strut angle, θ. This version uses tables for getting β and θ. The latest
version, MCFT-04, gives equations for calculating θ to allow for a simpler approach to getting β.
The last method is the Shear Friction Method. This method considers the shear contribution to
shear capacity of concrete to be friction between sections throughout a beam. These sections
represent the inclined cracks or shear slip planes. Although these sections should be considered
at an incline for simplicity they are taken to be straight. This allows us to consider the three main
methods for predicting shear capacities and what they consider in analyzing shear capacity.
Bakht and Jaeger7 (1988) study the bearing restraint in slab-on-girder bridges. Models are
done for steel on steel and steel on concrete bearings. The presence of horizontal restraints at the
girder bearings provides stiffness to the beam. Bridges with relatively new bearing pads provide
bearing restraint that can reduce the total moments due to applied loads by 9%. When compared
to theoretical deflections, there was a 20 to 30% decrease in measured deflections. It is
suggested that bearings permitting free movement of the girder not be provided for short spans
bridges that can be designed for thermal effects and bearing restraint forces. Providing bearing
restraints can provide a single span bridge with a substantial increase in capacity.
20
CHAPTER 4 GIRDER DESIGN
The constructed girders were modeled after post-tensioned beam configurations used in
Florida bridge construction in the 1950’s. The nearly 47-ft long beams had four 1-in. diameter
post-tensioning bars., which was a slight alteration from the original plans that called for 1 1/8-
in. diameter (Figure 4-1). Although the plans called for high strength creepless alloy steel, Grade
150 bars (fpu = 170ksi) were used in the prototype based on availability. The properties of steel
that the plans called for were not know. Two bars were placed in a parabolic configuration with
the other two bars placed at the bottom of the beam in a straight configuration (Figure 4-2). Mild
steel was placed in the end block for 34 in. at each end of the beam (See Figure 4-3). The
longitudinal steel in the end block extended just beyond the last stirrup. The U-shaped bars
located at the top of the beam were intended to ensure composite action and do not extend a
sufficient distance into the beam to provide added shear capacity. A 2 ft 4 in. wide by 7 in. thick
deck was placed on the girder to imitate actual service conditions (Figure 4-4). The deck
reinforcement consisted of two rows of transverse #5 bars and two rows of longitudinal #4 bars.
46' - 10"
10 - #6 bars 8 - #5 bars 10 - #6 bars
8" 8"
Figure 4-1. Full beam section
21
PARABOLIC BARS
STRAIGHT BARS
8" 8"
6" 6"
16"
6 1/2
"6"
10"
Figure 4-2. Girder cross section and post-tensioning tendon details
22
1' - 8"
4" 4 SP @ 3" 3 SP @ 6"
2 7/16"6"
4"1' - 4
"
2 1/
2"
1" PT BAR
Figure 4-3. Reinforcement and tendon layout
23
2 - #4 @ 14"3 - #5 @ 12"
#5 bar @ 12" sp.
#5 bar @ 6" sp.
2' - 4"
7"
Figure 4-4. Deck configuration and reinforcement
24
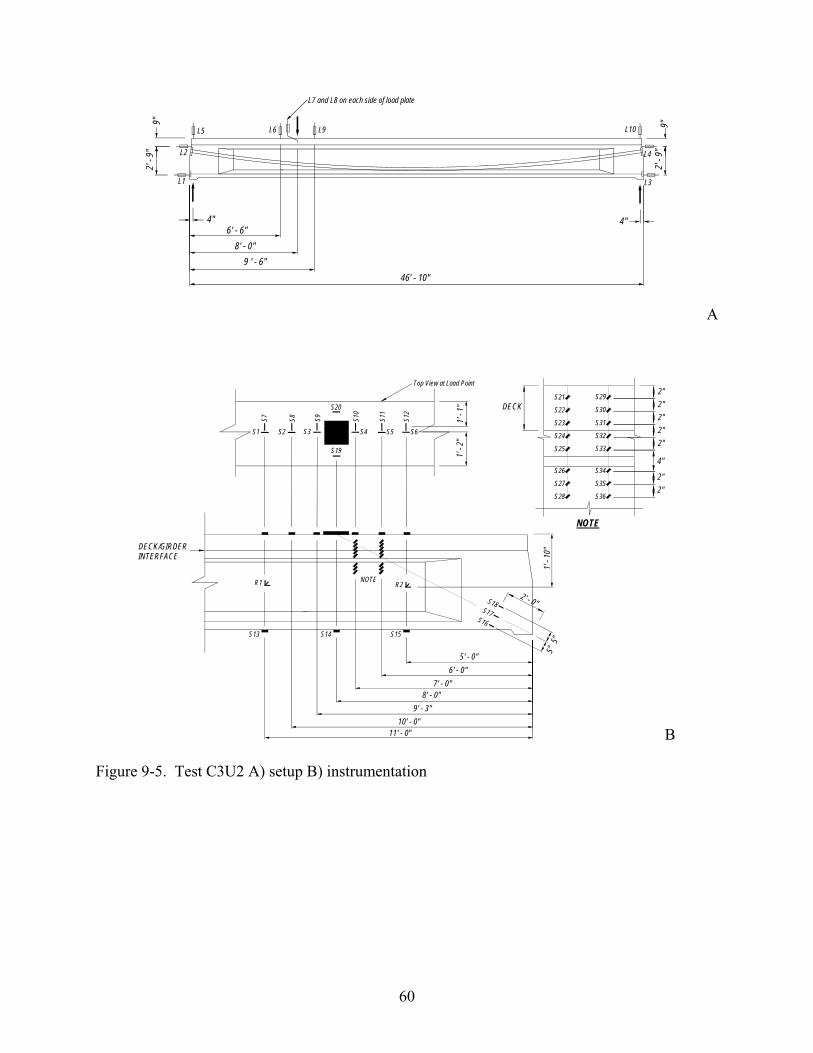
CHAPTER 5 BEAM NOMENCLATURE
The following sections describe testing conducted on several different beam configurations
with a number of different load configurations. The beams, tests, and instrumentation will be
referred to using the same system. C2U3 is an example of beam 2 with an a/d of approximately
3. C1U3L3 is an example of an LVDT number 3 in beam 1 with an a/d of approximately 3.
_ _ _ _ _ _ _Beam
TestInstrumentation Label
Gage Number Sequentially Numbered<One or Two Digits>
P - Strain Gage on Post-Tensioning BarR - Strain Gage Rosette on ConcreteS - Single Strain Gage on Concrete
L - LVDT
C1U3 (a/d = 3.0)C2U3 (a/d = 3.0)C3U2 (a/d = 2.0)
Figure 5-5. Beam nomenclature
25
CHAPTER 6 GIRDER CONSTRUCTION AND MATERIAL PROPERTIES
Construction was performed at the Florida Department of Transportation Structures
laboratory in Tallahassee, Florida. Formwork was constructed of welded steel panels that were
assembled to provide a single form for the full length of the beam. Steel reinforcement was
fastened to the formwork and rested on chairs in order to keep them in place while concrete was
poured (See Figure 6-2 and Figure 6-3). 40 mm galvanized steel duct was used to hold a single
post-tensioning bar. The duct was fastened to formwork and strapped to chairs at incremental
points along the beam length to maintain the parabolic or straight configuration during casting.
Assembly started with placing the bottom forms on the top flange of a steel I-beam, which
was placed on the strong floor. One side of the formwork was erected. Mild steel cages were
assembled and placed at each end. Plywood bulkheads were fabricated that enclosed the ends of
the beam form.
Anchorages were 1-3/4 in. x 6 in. x 10 in. steel plates with countersunk holes. The holes
were conical in shape. The anchorages are fitted with 1 in. anchor nuts. The anchorages were
dome shaped so that when fitting against the bearing plate there is one line of contact surface.
The anchorages were fastened to the plywood bulkhead in the proper configuration and angle.
The duct was then formed and installed from anchorage to anchorage along with tubes and vents
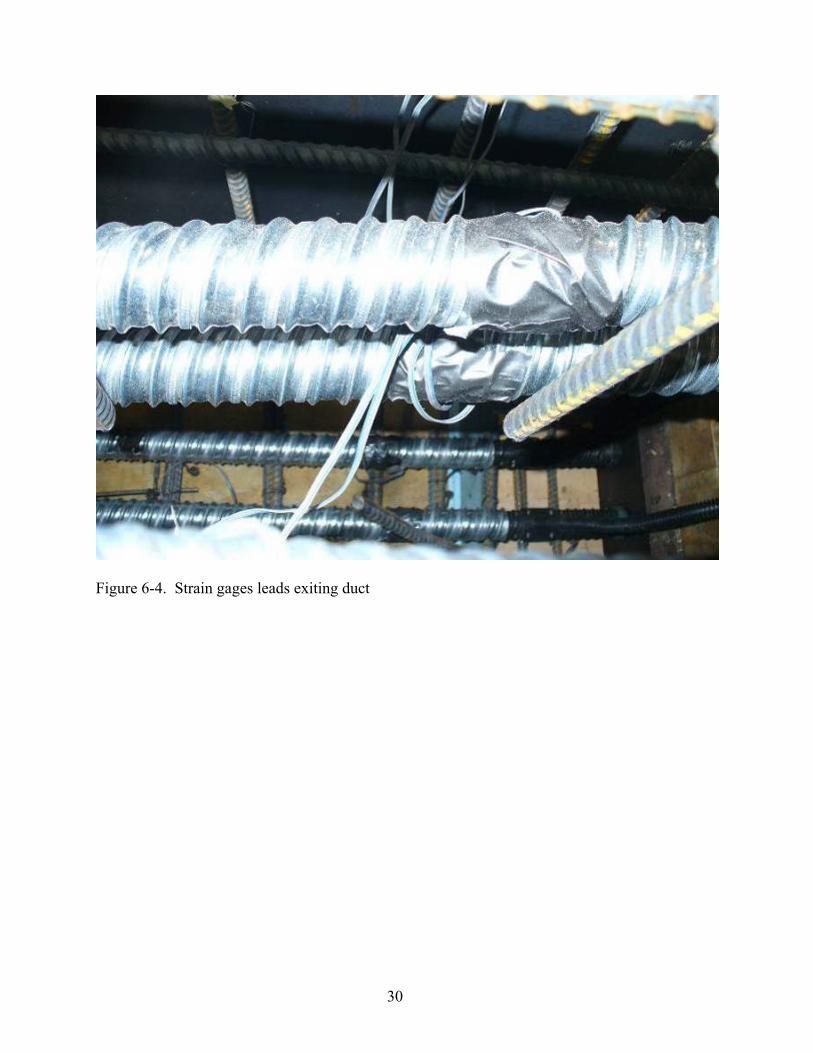
necessary to facilitate grouting. Strain gages were applied to the prestressing bars as detailed in
the instrumentation section. A hole was cut into the duct surrounding theses gages to pass the
wires connecting to these gages. The bars were then carefully inserted into the duct with anchor
nuts installed. The hole was sealed and the wires were lead out of the beam (See Figure 6-4). U-
bars were held in place by tying them to a longitudinal bar running along the top of the beam
26
(See Figure 6-5). The opposite form was then installed with all-thread rod used as form ties.
Final adjustments in duct and reinforcement were made after the form ties were in place.
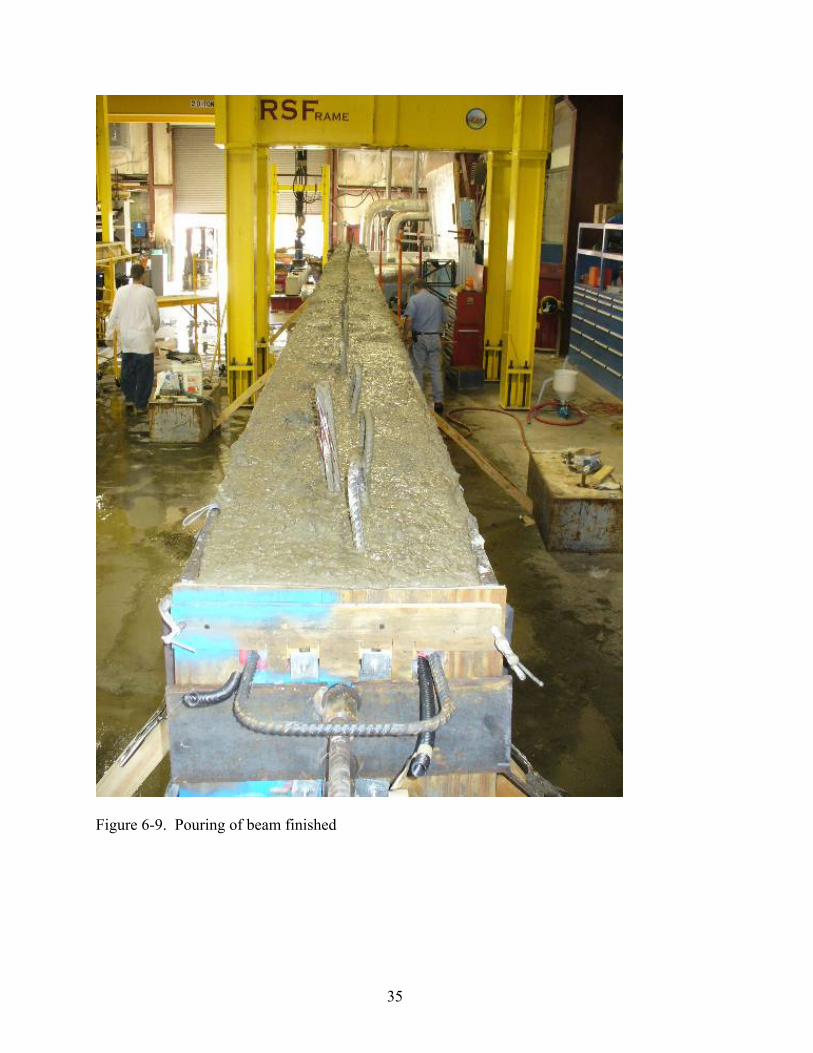
The beams were cast using ready mix concrete that was bucketed to the form with the
laboratory crane (Figure 6-8). The water cement ratio was 0.41 and the aggregate size and type
was ¾ in. Florida Limestone. One concrete truck was needed for the entire beam. The concrete
was vibrated using both internal and external vibration. Twelve cylinders were taken to test
compressive strength of the concrete. When cylinder strengths tested at or above 3600psi the
beam was stressed as detailed in the following section.
Immediately after stressing the PT ducts were grouted. The grouting procedure was as
follows. The grout used was a Portland cement and water mixture mixed to w/c=0.45. Several
batches of grout were mixed in a 5-gallon bucket single batch and used to fill the ducts with the
hand pump shown in Figure 6-10. The grout was injected from one end of the beam and was
continuously pumped until it ran out of the vent pipe at the opposite anchorage. The grouting
proceeded from bar 1 duct to bar 4 duct.
After grouting, the deck formwork and mild steel reinforcement were placed (Figure 6-11).
The deck was poured using the same method as the beam. The finished beam is shown in Figure
6-12.
33
A
B
Figure 6-7. Bottom anchorage with PT duct and grouting tube. A) inside view, B) outside view.
39
Table 6-1. Dates of C beams Beam Casting of
Beam Casting of Deck
Post-Tensioning
Grouting Testing
C1 12-5-07 1-15-08 12-10-07 12-10-07 2-20-08 C2 1-30-08 3-26-08 2-5-08 2-5-08 4-30-08 C3 4-11-08 6-2-08 4-16-08 4-16-08 7-25-08
40
CHAPTER 7 PRESTRESSING
7.1 Prestressing Application
A 60 Mp Series 04 jack was used to stress the PT bars. The jack is a 80 ton hydraulic
actuator designed to stress a single threadbar tendon. The jack is fitted with a socket at the nose
that fits the PT bar nut and can tighten just prior to release.
The target prestress for each tendon was 93 kips. Prestress was measured with load cells
placed between the anchor plate and the jack. As each bar was being stressed the nut needed to
be tightened with a wrench that was attached to the jack. The jack was placed on the anchorages
at the North end of the beam (as it was oriented during stressing). Refer to Figure 7- for a picture
of the jack.
To avoid exceeding allowable concrete stresses, the bars were stressed in two stages in the
following order: 2,3,1,4 (Figure 7-2). The first stage consisted of stressing each tendon to 50%
of the desired final stress in the order indicated. The stressing sequence was then repeated to
reach the final desired stress. Table 7-1 shows the jacking force at each stage for each beam.
7.2 Instrumentation
Strain gages were applied to the bars to allow measurement of prestress losses and tendon
stresses during load testing. Tandem gages were placed on the bars near each end of the beam
(Figure 7-3). Using the measured strains, stresses were calculated by factoring them by Young’s
modulus. Some of the gages were damaged during installation and prestressing of the tendons.
Table 7-2 shows the surviving strain gages for C1 and C2. None of the gages in C3
survived or provided data that could be used to measure stresses.
41
7.3 Results: Seating Losses
Measurements were taken during post-tensioning to determine seating losses, elastic
losses, friction losses and early creep losses. Seating losses in prestressing bar anchorages occur
when the bar is released and the anchor nut is allowed to settle against the anchor plate. As the
bar is being prestressed, the anchor nut is tightened with a wrench to minimize the seating losses
when the tendon is released. When the bar is released the remaining space is closed, which is
termed take up.
Seating losses can be measured by observing the change in strain that occurs when the jack
is released. This is best done when using the strain data from the gages located nearest the
stressing end of the beam. Strain gages at the dead end will be affected by friction losses from
wobble or drape. Figure 7-4 and Figure 7-5 show a time trace of the stress in each tendon. The
stress was calculated from strain data using a Young’s modulus of 28,500 ksi. The plots display
only the data from strain gages that were operating properly and include the average of each
tandem pair of strain gages when both were operating correctly and single readings when only
one of the gages was working properly. The plots illustrate the staging used to stress the
tendons. Each was initially stressed to approximately half of the target prestress, followed by
another round of prestressing to reach the target prestress.
Figure 7-6 illustrates how elastic losses and seating losses were determined from the
strains measured in the bars during post-tensioning. The graph shows the plots of two tandem
strain gages converted to stress. As noted on the plot, seating loss was the immediate reduction
in stress as the jack was released. The maximum strain of the averaged tandem pair of strain
gages was used. The three subsequent sharp drops in stress are the elastic losses caused by
stressing each of the adjacent tendons.
42
The jacking stresses and loss in stress due to seating are summarized in Table 7-3. The
seating losses for beam C1 bars 3 and 4 and beam C2 bar 1 were measured using strain gages at
the stressing end of the beam. Seating losses for bars 3 and 4 in beam C2 were measured using
the strain gages at the dead end. In addition, the prestress loss as a percentage of the jacking
stress is shown for both stages. Seating losses for the straight tendons (3 and 4) were
consistently in the range of 2% regardless of the jacking stress. The parabolic tendon, however,
was 2 to 3 times this value. This could have been due to the anchor plate not being perpendicular
to the post-tensioning bar. This could have caused the bar to sit lower on the countersunk hole
while stressing. When the bar is released the bar would pull up higher and sit tighter into the
anchor plate.
The take up at the stressing end anchorage was calculated using this sudden change in
strain and multiplying it by the length of the tendons, 46ft 10in. and are presented in Table 7-4.
Typical set can be about 0.03 in. but varies depending on the type of anchorage (Lin and Burns
1981).
Table 7-5 shows the elastic losses due to stressing of adjacent tendons. The change in
strain for each tendon was measured as each of the following bars in the sequence were stressed.
For example, during stage 1 stressing of tendon 4 in beam C1, the measured decrease in stress of
tendon 3 was 1.8 ksi. The attendant loss of prestress was 3.9% based on the stress in tendon 3
just prior to stressing tendon 4. In general, the highest losses were caused by immediately
adjacent tendons. For instance, the maximum loss in tendon 1 (3.0%) was caused by the
adjacent tendon 2.
43
Using the AASHTO8 method for calculating losses due to elastic shortening the first and
second stage of stressing was calculated to be 2.6 ksi. A comparison could not be done due to a
lack of data.
A wobble coefficient was calculated for Bar 4 beam C1. This was done by taking the
maximum stress in the bar, measured by the strain gage, at the jacking end and comparing the
stress at the same point in time at the dead end of the beam. Using these two stresses a wobble
coefficient of 0.0007 per ft was measured. The American Concrete Institute, ACI, gives a range
for the wobble coefficient of 0.0001 to 0.0006 for high-strength bars grouted in metal sheathing
(ACI 2005).
To observe long-term losses, tendon stresses in C2 were measured for approximately 2.5
days after stressing (Figure 7-9). The percentage of losses due to short-term creep and shrinkage
effects were 6.3 and 5.6 percent (See Table 7-6). A loss of 1.6 ksi is calculated using the
AASHTO method. Equation 5.9.5.4.2a-1 and 5.9.5.4.2b-1, from AASHTO 2007, were used for
calculating shrinkage and creep, respectively. Using our initial prestress force this yields a loss
of approximately 1.7%.
46
P13 & P14
P9 & P10
P5 & P6
P1 & P2
P15 & P16
P11 & P12
P7 & P8
P3 & P4
BACK BAR
FRONT BAR1' - 0" +-
1' - 0" +-
Figure 7-3. Location of gages for C beams
47
Time (seconds)
Stre
ss (k
si)
Stre
ss (M
Pa)
0 500 1000 1500 2000 25000
20
40
60
80
100
120
0
150
300
450
600
750C1U3P11C1U3P12C1U3P14C1U3P15C1U3P16
Figure 7-4. Tendon stress during post-tensioning of beam C1
48
Time (seconds)
Stre
ss (k
si)
Stre
ss (M
Pa)
0 500 1000 1500 2000 2500 30000
20
40
60
80
100
120
0
150
300
450
600
750C2U3P3C2U3P9C2U3P10C2U3P13C2U3P14
Figure 7-5. Tendon stress during post-tensioning of beam C2
49
Time (seconds)
Stre
ss (k
si)
0 500 1000 1500 200040
42
44
46
48
50Average Stress in C1 Bar 3
Seating Loss
Elastic Loss
Creep
Figure 7-6. Example of seating and elastic losses
50
1 2 3 4Tendons
Pre
stre
ss L
oss
(%)
0
1
2
3
4
5
6
7
8
9
10C1 Stage 1C2 Stage 1C1 Stage 2C2 Stage 2
Figure 7-7. Summary of seating losses
51
Pre
stre
ss L
oss
(%)
0
2
4
6
8
10
12
14C1C2
1 2 3 4Tendons
Figure 7-8. Summary of elastic losses
52
Time (seconds)
Stre
ss (k
si)
Stre
ss (M
Pa)
0 50000 100000 150000 200000 2500000
20
40
60
80
100
120
0
150
300
450
600
750
C2U3P3C2U3P13C2U3P14
Figure 7-9. Long term strains in beam C2
53
Table 7-1. Jacking force measured with load cell
Stage Jacking Force (kip)
C1 C2 C3 1 46.7 45.7 46.7 2 94.5 93.4 93.5 Table 7-2. Working P-gages for each C beam C1 C2 P11 P3 P12 P9 P14 P10 P15 P13 P16 P14
Table 7-3. Measured changes in stress due to seating losses
Bar Stage Jacking Stress (ksi) Seating Loss (ksi) Prestress Loss (%) C1 C2 C1 C2 C1 C2
1 1 --- 42.8 --- 3.13 --- 7.3 2 --- 99.7 --- 4.46 --- 4.5
3 1 48.6 49.9 1.0 0.74 2.1 1.5 2 100 99.2 1.3 0.47 1.3 0.5
4 1 48.0 53.5 1.4 1.50 2.4 2.8 2 103 103 2.2 2.46 2.1 2.4
Table 7-4. Measured take-up
Tendon Stage 1 (in.) Stage 2 (in.) C1 C2 C1 C2
1 --- 0.06 --- 0.09 3 0.02 0.02 0.02 0.01 4 0.03 0.03 0.04 0.05
Table 7-5. Elastic losses for C beams
Tendon Jacking Tendon
Stage 1 Stage 2 C1 C2 C1 C2 Δf (ksi) %loss
Δf (ksi) %loss
Δf (ksi) %loss
Δf (ksi) %loss
1 4 --- --- 0.51 1.3 --- --- 0.46 0.5 3 1 0.9 2.0 0.81 1.7 1.1 1.1 1.21 1.2 3 4 1.8 3.9 1.75 3.4 2.4 2.4 1.91 2.0
55
CHAPTER 8 MATERIAL PROPERTIES
For each beam tested cylinder strength were tested for the beam itself and the deck. The
average strengths for the beam and the deck are presented in Table 8-1. Samples of the post-
tensioning bars were also taken and tested, their average material properties are presented in
Table 8-2.
Table 8-1. Average cylinder strengths Beam Beam Cylinder Strengths (ksi) Deck Cylinder Strengths (ksi) C1 7.96 3.34 C2 8.64 5.47 C3 8.64 4.89
Table 8-2. PT-bar strengths EUL @ 0.50% Stress (ksi) 140.2 Tensile Strength (ksi) 169.9 Elongation (%) 7.8 Young’s Modulus (ksi) 30152.5
56
CHAPTER 9 SHEAR TEST SETUP AND PROCEDURES
Three tests were conducted using a three point loading scheme shown in Figure 9-1. Two
tests were conducted using a shear span to depth (a/d) ratio of 3.0. One of these tests (C1U3)
was set up with the beam bearing directly on the concrete pedestal support (Figure 9-2). The
second test (C2U3) was set up with the beam bearing on a neoprene pad (2in. thick). This was
done to observe the effect of the support conditions on the beam behavior. The third test (C3U2)
was loaded at a/d = 2.0 and was bearing on a neoprene pad. This test was intended to evaluate
the shear behavior of the short shear span and no shear reinforcement.
The load was applied through a 1½-in. thick reinforced neoprene bearing pad at a loading
rate of 0.25 kips/second. Displacements were measured at the load point and each of the
supports. Beam end movement was measured at the top and bottom. A load cell was used to
measure load under the actuator. The detailed instrumentation for each test is shown in Figure 9-
3 through Figure 9-5. Strain was measured with 60 mm strain rosettes and strain gages. For test
C2U3 five 30 mm strain gages were used in the deck and top flange of the beam in addition to
the 60 mm gages. Test C3U2 used sixteen 30 mm strain gages in the top flange and deck of the
beam in addition to the 60 mm gages.
4" 4"
9"2'
- 9"
9"2'
- 9"
46' - 10"
a
LVDT
LVDTLVDT
LVDT
Load Cell
Figure 9-1. Test setup and instrumentation for C beams
58
4" 4"
9"2'
- 9"
9"2'
- 9"
46' - 10"
12' - 1"
L1
L2
L3
L4
L5 L8
L6 and L7 on each side of load plate
A
1"6" 4"
10"
2' - 8
" 1' - 7
"
3' - 1
0"
1' - 10"1' - 1"
2' - 7"7' - 10"
10' - 1"11' - 1"
12' - 1"
S14S13S12
S10 S11S9 R7
R6
R5
R4
S16S15
S8S7S6R3R2R1S5S4S3
S1 S2
Top View at Load Point
1' - 1
"1'
- 2"
DECK/GIRDERINTERFACE
B
Figure 9-3. Test C1U3 A) setup B) instrumentation
59
4"
9"2'
- 9"
9"2'
- 9"
46' - 10"
12' - 1"
L1
L2
L3
L4
L5 L6 L10
L7 and L8 on each side of load plate
L9
10' - 7"
13' - 7"
4"
A
10' - 1"11' - 1"
12' - 1"13' - 1"
14' - 1"15' - 1"
1' - 1
0"
9' - 1"
20' - 0"
S15S14S13
R2R1R3
S6S5S4S1S2S3
S29
S31
S30
S26
Top View at Load Point
S28
S27 S20
S19
S17S18
2' - 6"6"
6"
S21
S22
S23
S24
S25
2"2"2"2"2"
DECK
NOTE
NOTE
S10
S12
S11S9 S7S8
1' - 2"2' - 2"
3' - 2"
10"1' - 10"
2' - 10"
1' - 1
"1'
- 2"
S16
DECK/GIRDERINTERFACE
B
Figure 9-4. Test C2U3 A) setup B) instrumentation
60
4"
9"2'
- 9"
9"2'
- 9"
46' - 10"
8' - 0"
L1
L2
L3
L4
L5 L6 L10
L7 and L8 on each side of load plate
L9
6' - 6"
9 ' - 6"
4"
A
6' - 0"7' - 0"
8' - 0"9' - 3"
10' - 0"11' - 0"
1' - 1
0"
5' - 0"
S15S14S13
R2R1
S17
S8S7
S2S1
S9
S3
S10
S4
S11
S5
S12
S6
S20
S19
Top View at Load Point
5"5"
S18
S16
2' - 0"
S29
S30
S31
S32
S33
2"2"2"2"2"
DECK
NOTE
NOTE
1' - 1
"1'
- 2"
DECK/GIRDERINTERFACE
S21
S22
S23
S24
S25
4"
2"2"
S26
S27
S28
S34
S35
S36
B
Figure 9-5. Test C3U2 A) setup B) instrumentation
61
CHAPTER10 RESULTS AND DISCUSSION: SHEAR TESTS
10.1 Test C1U3
Figure 10-1 showed linear-elastic behavior for test C1U3 up to a load of 74 kips where the
first flexural crack occurred. The crack was detected by gage S14, which was located on the
beam bottom under the load point (Figure 10-2). Gage S14 showed that the flexural crack
formed at a tensile strain of nearly 400 microstrain. Figure 10-3 showed the location of the first
crack. As loading continued, further flexure cracks formed under the load point as the stiffness
decreased. The beam reached its maximum capacity at a shear of 135 kips where a flexure-
compression failure occurred in the deck under the load point. Figure 10-3 showed the final
crack pattern.
10.2 Test C2U3
The initial behavior of C2U3 was similar to C2U3 up to and including cracking. Figure
10-4 showed linear elastic behavior up to a load of 74 kips where the first flexural crack
occurred. The crack was detected by gage S14, which was located on the beam bottom under the
load point (Figure 10-5). Although the initial strain behavior was linear, the behavior appeared
to soften as the cracking load of 74 kips was reached the strain spiked. Figure 10-6 showed the
location of the first crack. At a load of approximately 92 kips the beams began to soften.
Softening in the beam was shown by the change of slope in the load displacement curve.
Beyond this point the beam was cracking more frequently. The load-displacement eventually
plateaus, indicating that the tendons have yielded. The beam reached its maximum capacity at a
shear of 127 kips where a flexure-compression failure occurred in the deck under the load point.
Figure 10-6 showed the final crack pattern.
62
10.3 Test C3U2
Figure 10-7 is the load displacement plot for test C3U2. The beam showed linear-elastic
behavior until a load of 86 kips. A crack was also heard and observed at this load. Figure 10-8
showed where the first crack initiated. As loading continued cracks were observed. Strain gages
S13, S14, and S15 showed when some of these cracks occurred (See Figure 10-9). S14 showed a
constant growth in strain until a load of 92 kips where the strain immediately changed slope and
began to lose tensile strain. The strain measured at 92 kips was 386 microstrain. Cracks also
formed at 109 kips and at 155 kips. The load displacement curve shows that the beam was
cracking a significant amount during this range of loads. At a load of 156 kips a large crack was
observed running through the web and into the transition zone between the web and the end
block (See Figure 10-10). At a load of approximately 179 kips the load displacement curve
began to flatten with little increase in capacity relative to displacement indicating that the bar
were yielding. At a load of 187 kips cracks were observed around the anchor plate for the
parabolic PT bars (See Figure 10-11). The test was terminated at this point to avoid an explosive
failure. The final crack pattern can be seen in Figure 10-8. The peak load measured during
testing was 187 kips. This widespread cracking and large deflection indicate that the prestressing
bars had reached yield. The final failure mode, however, was not determined because the test
was terminated prior to reaching the peak capacity.
63
Displacement (inches)
Sup
erim
pose
d S
hear
(kip
)
0 0.5 1 1.5 2 2.5 30
25
50
75
100
125
150
Figure 10-1. Load vs. displacement for C1U3
64
Superimposed Shear (kip)
Stra
in (m
icro
stra
in)
0 25 50 75 100 125 150-500
-400
-300
-200
-100
0
100
200
300
400
500
S14
Figure 10-2. C1U3S14 plot
66
Displacement (inches)
Sup
erim
pose
d S
hear
(kip
)
0 1 2 3 4 5 60
25
50
75
100
125
150
Figure 10-4. Load vs. displacement for C2U3
67
Superimposed Shear (kip)
Stra
in (m
icro
stra
in)
0 50 100 150-1000
-750
-500
-250
0
250
500
750
1000
S14
Figure 10-5. C2U3S14 plot
69
Displacement (in.)
Sup
erim
pose
d S
hear
(kip
)
0 0.5 1 1.5 2 2.5 30
50
100
150
200
Figure 10-7. Load vs. displacement for C3U2
71
Superimposed Shear (kip)
Stra
in (m
icro
stra
in)
0 50 100 150 200-100
0
100
200
300
400
500
S15S14S13
S13
S14
S15
Figure 10-9. Strain gages S13, S14, and S15
74
CHAPTER 11 EFFECT OF SUPPORT CONDITIONS ON BEHAVIOR
C1U3 and C2U3 were conducted with a shear span to depth ratio (a/d) of 3.0. The first
test, C1U3, used support conditions shown in Figure 11-1 in which the beam was bearing
directly on concrete. The second test, C2U3, used neoprene pads under each of the supports
(Figure 11-2). Both tests had the same loading scheme and loading rate, the support conditions
were the only variable between the two tests. The intent of the test was to explore the difference
in behavior between the two support conditions. This information will be used to guide the
interpretation of data on future load tests.
Typically, beams are modeled assuming the beam is supported by a pin and roller, which
offers no resistance to transverse movement. Conversely, arches are modeled with pinned
supports, which provide and infinitely stiff support and ensure pure arching action. These
modeling choices are made with the understanding that the actual conditions are situated
somewhere between these bounds. Shallow arches require very stiff support conditions to ensure
pure compression. Furthermore, very small transverse movements allowed at the reaction will
shift the behavior from arching to flexure.
To estimate the magnitude of load that must be resisted by the supports in the laboratory,
the beam specimen was modeled using membrane elements as shown in Figure 11-3. A
rectangular cross-section was used with a thickness of 17 in., which is the average thickness of
the specimen. The element was 5.8-ft long by 3.92-ft deep, and a modulus of elasticity of 4030
ksi was used, which corresponds to a compressive strength of 5 ksi. The transverse and vertical
reactions for a unit load required to maintain pure arching are shown in the figure.
While pure arching was not expected to occur using the tested support conditions, some
effect was anticipated. Figure 11-4 shows the expected restraint provided by the supports used in
75
the testing. For the direct bearing testing, the transverse reaction is expected to be a function of
the frictional force generated by the direct concrete contact. For the neoprene bearing pad test,
the reaction is expected to be a function of the shear stiffness and the transverse displacement of
the bottom of the beam. Figure 11-5 defines the transverse support displacement.
Figure 11-6 shows the effect of the transverse reactions on the internal forces. As the HL
reaction increases, then the tension force required to maintain equilibrium is reduced. If the
horizontal reaction is sufficient, then T will go to zero.
The overall behavior of the two tests is illustrated in the load vs. displacement curves
shown in Figure 11-7. As discussed previously, the shear at which cracking occurred was
approximately 74 kips for both tests. Furthermore, the behavior up to cracking appears very
similar between the two beams, indicating that the different support conditions had little effect
before the beam cracked. This lack of difference is likely due to the relatively small amount of
support movement needed to relieve arching action before cracking occurs.
Figure 11-8 shows the flexural tensile strain under the load point and the total lateral
displacement of the beam bearing (ΔT) defined as:
RLT Δ+Δ=Δ (10-1)
where the variables are defined in Figure 11-5. The total transverse movement of the bearings
on both beams is nearly identical up to cracking. The total movement measured for C1U3 and
C2U3 at a superimposed shear of 70 kips was 0.080 and 0.085 inches respectively.
For comparison, one of the transverse support restraints was removed from the model
shown in Figure 11-3 to determine the total transverse movement expected. The resulting total
movement was 0.108 in., which is comparable with the observed values. For the direct concrete
bearing condition, it is suspected that support blocks settled as load was applied, which relieved
the arching action prior to cracking. Furthermore, the movement was so small that the neoprene
76
bearing pad generated little transverse reaction. In conclusion, the bearing conditions used in
these tests appeared to have little effect on the early behavior of the beams. If similar bearing
conditions are encountered in the field, then it is expected that little difference might be seen in
the field under load test conditions.
After first crack the beam behavior began to diverge (Figure 11-7). The direct bearing test
showed a higher post-cracking stiffness with a 6.8% higher capacity than that of the neoprene
bearing test. The ultimate displacement, however, was approximately 59.0% of the neoprene
bearing test. Further evidence of post-cracking bearing restraint is seen in the divergence of ΔT
as ultimate capacity is approached (Figure 11-8). After cracking, the total outward support
movement of C2U3 was greater than that of C1U3 indicating that the transverse force generated
at the support for C1U3 was beginning to effect the behavior. This difference is an indication
that the frictional force generated was greater than that provided by the neoprene bearing pads.
In conclusion, the direct contact bearing provided more restraint than that of the neoprene
bearing pad, thus resulting in higher capacity and less ductility.
The two final crack patterns can be seen in Figure 11-9. For C1U3 cracks were not
observed to spread into the top flange as they were in C2U3. Since the cracks are smaller in
C1U3 its cracked moment of inertia, Icr, is larger than that of C2U3. The stiffness of a member
is dependant on its moment of inertia, the higher the Icr, the smaller the deflection. This behavior
is observed while comparing the two load vs. displacement plots in Figure 11-7.
Both C1U3 and C2U3 displayed the same behavior until cracking occurred. Once cracking
becomes present the two tests begin to react in different ways because of the support conditions.
The inability of C1U3’s ends to slide freely cause a marginal increase in capacity, 8 kips, but
lead to a sudden failure, C2U3 had a ductile failure which is more desirable.
83
Displacement (inches)
Sup
erim
pose
d S
hear
(kip
)
0 1 2 3 4 5 60
50
100
150
C1U3C2U3
Figure 11-7. Load vs. displacement for C1U3 and C2U3
84
Superimposed Shear (kip)
Stra
in (m
icro
stra
in)
DT (
inch
es)
0 50 100 150-1000 -2
-500 -1
0 0
500 1
1000 2
S14 for both C1 and C2
StrainC1U3
StrainC2U3
DTC2U3
DTC1U3
Figure 11-8. Plot of C1U3S14, C2U3S14, total bottom displacement for C1U3 and C2U3
86
CHAPTER 12 STRUT AND TIE ANALYSIS: C3U2
Figure 10-7 is the load displacement plot for test C3U2. The beam shows linear-elastic
behavior until a load of 86 kips. As loading continued flexure cracks were observed. Strain
gages S13, S14, and S15 are located at the bottom of the beam and measure the initial flexure
cracks. At a load of 153 kips a large crack was observed running through the web and into the
transition zone between the web and the end block (Figure 12-2). When this crack occurs the
beam stops behaving as a flexural member and begins to behave as a strut and tie model. Figure
12-3 shows the strain through the height of the beam as loading continues. The strain
distribution is linear until a load of 153 kips where the strain is no longer linear due to cracking.
Evidence of this change in behavior can be observed in Figure 12-4.
Figure 12-5 shows that the gages on the top of the deck, S5 and S6, grow constantly in
compression until 153 kips where the strain suddenly drops. Corresponding to the sudden drop
in strain for gages S5 and S6 there is a jump in compressive strain in gage S18. This shows that
when this crack occurs the compressive strain is transferred from the deck and into the
compression strut.
As loading increases the parabolic bars begin to carry load. When this happens a node is
created at the junction between the original strut and the parabolic bars, or tie. As the second tie
carries additional force the node travels towards the anchorage. The compression forces begin to
change direction at the node towards the support. At a load of approximately 179 kips the load
displacement curve begins to flatten with little increase in capacity relative to displacement. The
flattening of the load displacement curve shows that the PT bars are beginning to yield. At a
load of 188 kips cracks were observed around the anchor plate for the parabolic PT bars.
Cracking around the anchor plate confirm that the parabolic tendons were carrying all the tensile
87
force in the strut and tie model. The PT bars, or the tie, is what caused the beam to fail. The
bars could no longer carry any additional force.
Figure 10-7 is the load displacement plot for test C3U2. The beam shows linear-elastic
behavior until a load of 86 kips. As loading continued flexure cracks were observed. Strain
gages S13, S14, and S15 are located at the bottom of the beam and measure the initial flexure
cracks. At a load of 153 kips a large crack was observed running through the web and into the
transition zone between the web and the end block (Figure 10-10). When this crack occurs the
beam stops behaving as a flexural member and begins to behave as a strut and tie model. Figure
12-3 shows the strain through the height of the beam as loading continues. The strain
distribution is linear until a load of 153 kips where the strain is no longer linear due to cracking.
Cracking in the beam has occurred before 153 kips as shown by gages S13 and S14 yet the
progression of strain is still linear that load. This is confirmation that the beam has full
composite action between the deck and beam, beam theory applies, and the section is behaving
as a B-region. B-regions typically begin at a distance of one member-depth away from a
discontinuity. This distance is used as a guideline and is not precise. The load point for this test
lies at approximately one member –depth away from the transition between the end block and
the I-shape in the section. Evidence of this change in behavior can be observed in Figure 12-4.
Figure 12-5 shows that the gages on the top of the deck, S5 and S6, grow constantly in
compression until 153 kips where the strain suddenly dropped. Corresponding to the sudden
drop in strain for gages S5 and S6 there was jump in compressive strain in gage S18. This
showed that when this crack (Figure 10-10) occurred the compressive strain was transferred from
the deck and into the compression strut (Figure 12-4).
88
As loading increased the parabolic bars begin to carry load. When this happened a node is
created at the junction between the original strut and the parabolic bars, or tie. As the second tie
carried additional force the node traveled towards the anchorage. The compression forces began
to change direction at the node towards the support. At a load of approximately 179 kips the
load displacement curve began to flatten with little increase in capacity relative to displacement.
The flattening of the load displacement curve showed that the PT bars are beginning to yield. At
a load of 188 kips cracks were observed around the anchor plate for the parabolic PT bars.
Cracking around the anchor plate confirm that the parabolic tendons were carrying all the tensile
force in the strut and tie model. The PT bars, or the tie, is what caused the beam to fail. The
bars could no longer carry any additional force.
89
Superimposed Shear (kip)
Stra
in (m
icro
stra
in)
0 50 100 150 200-100
0
100
200
300
400
500
S15S14S13
S13
S14
S15
Figure 12-1. C3U2 strain gages S13, S14, and S15
91
Strain (microstrain)
Hei
ght f
rom
Bot
tom
of B
eam
(in)
-300 -200 -100 0 100 200 3000
10
20
30
40
50 153 kip 120 kip 80 kip 0 kip
Figure 12-3. Change in strain as loading
93
Superimposed Shear (kip)
S5
and
S6
Stra
in (m
icro
stra
in)
S18
Stra
in (m
icro
stra
in)
0 50 100 150 200-400 -100
-300 -75
-200 -50
-100 -25
0 0
100 25
200 50
300 75
400 100
S5 S6
S18
S5
S6
S18
Figure 12-5. Strain gage plot for S5, S6, and S18
94
Strain (microstrain)
Hei
ght f
rom
Bot
tom
of B
eam
(in)
-300 -200 -100 0 100 200 3000
10
20
30
40
50 153 kip 120 kip 80 kip 0 kip
Strain Plot
Figure 12-6. Change in strain as loading
96
Superimposed Shear (kip)
S5
and
S6
Stra
in (m
icro
stra
in)
S18
Stra
in (m
icro
stra
in)
0 50 100 150 200-400 -100
-300 -75
-200 -50
-100 -25
0 0
100 25
200 50
300 75
400 100
S5 S6
S18
S5
S6
S18
Figure 12-8. Strain gage plot for S5, S6, and S18
97
CHAPTER 13 COMPARISON WITH THEORETICAL CAPACITIES
It is generally accepted that when the shear span to depth ratio (a/d) is less than about 2.5,
then the behavior is better modeled by strut and tie method. When a/d greater than 2.5, then
semi-empirical sectional models are usually employed to determine capacity. This section
provides a comparison of the calculated capacity of the beam and the experimentally measured
capacity. When the shear span ratio is in the range used for these tests (2.0 and 3.0) the failure
mode can vary widely depending on the beam configuration, detailing, and material properties.
These failure modes can be flexural, shear-compression, web-shear, or anchorage, or a
combination thereof. Consequently, the calculated values presented in this section cover the
range of possibilities to determine those that best fit the actual measured capacity and behavior.
Nominal moment capacity, Mn, was calculated using strain compatibility (See Table 13-1).
The stress strain curve generated from the average yield and ultimate strengths from bar tension
tests was used to calculate moment capacity. The material properties used to calculate moment
capacity were: the compressive strength of concrete was 7.98 ksi, the prestress in the bars was
109 ksi, the yield stress for the bars was 140 ksi, and Young’s modulus for the bars was 28500
ksi.
Shear capacity was calculated using the methods prescribed in AASHTO LRFD and ACI.
Using the ACI method gave the most conservative results compared to the two other methods.
With an a/d of 2 the experimental capacity was 367% of the theoretical result. The experimental
results for the a/d ratios of 3 were 318% and 291% of the theoretical result. MCFT was more
accurate as you increased the distance of the loading point from the support. The second a/d of 3
test yielded the most accurate result being within 58% of the theoretical result (See Table 13-2).
98
A strut-and-tie model was performed for an a/d ratio of 2. From testing it can be seen that
the PT bars were yielding. Since the bars were yielding, the forces in them were found by
multiplying the area of the bars, 0.85 sq in., by their yielding stress. Each tie had two PT bars
and their yielding stress was 140 ksi, which was found from testing data. By making a cut at the
load point and summing the moments about the node just below the load point, the force at the
reaction can be found. With the forces in the bars and at the reaction known the forces in the
struts were found by nodal analysis. The calculated forces in each of the members can be seen in
Figure 13-9.
Comparing the experimental to predicted capacities for shear or flexure it could be seen
that flexure provided the best representation of the beams capacity. This was due to the beams
unusual configuration.
172 kip
211 kip
- 299 kip
- 501 kip
238 kip @ 6 deg.
238 kip
(-) Compression
479 kip @ 8 deg.
Figure 13-9. Forces in strut-and-tie model
99
Table 13-1. Post-tensioned beam nominal moment capacities
a/d Mexp Mn Mexp/ Mn(kip*ft) (kip*ft) (kip*ft)
2 1507 1428 1.06 3 1685 1519 1.11 3 (2nd Test) 1587 1519 1.05 Table 13-2. Post-tensioned beam shear capacity results
a/d ACI Strut & Tie MCFT VEXP Vn VEXP / Vn Vn VEXP / Vn Vn VEXP / Vn
(kip) (kip) (kip) (kip) 2 196 42 4.67 172 1.14 84 2.33 3 142 34 4.18 --- --- 84 1.69 3 (2nd Test) 133 34 3.91 --- --- 84 1.58
100
CHAPTER 14 SUMMARY AND CONCLUSIONS
Post-tensioned beams were constructed and post-tensioned. This set of testing conducted
destructive load tests to post-tensioned beams which had no shear reinforcement outside of the
end block, approximately 3 ft from each end of the beam. The beams had two straight bars and
two parabolic bars. The bars were anchored using 1 ¾ in. thick steel plates. Post-tensioning
stresses were monitored and recorded. Losses were calculated using measured strains during
stressing. Seating, Elastic, short-term Creep and Shrinkage losses were able to be measured. The
short-term creep and shrinkage losses were measured for approximately 2.5 days. Losses due to
creep and shrinkage were higher than calculated values from AASHTO 2007. Creep and
shrinkage are measured over longer periods of time than the period which was measured during
our tests which may have altered the comparison. Tests were done to observe the effect of
support conditions on the behavior of the beam. The support conditions were of interest because
of the variability of them in the field. The beams were observed to be resting on tar paper and
steel plates. A test was done with a shorter shear span to see if the beam would fail in shear.
Shear was of interest because of the lack of reinforcement in the beams. This lack of
reinforcement has produced low bridge ratings for the beams. The following conclusions were
made:
• The measured take-up was in the range recommended by Lins and Burns (1981) for straight bars.
• Parabolic bars had slightly higher take up values due to their alignment with the anchor plate.
• A concrete on concrete bearing surface behaved the same as a beam with neoprene bearing pads up until cracking occurred. Once cracking occurred the stiffnesses of the beams differed resulting in a more ductile failure mode for the neoprene bearing pads.
• Bearing surfaces did not change the failure mode, which was a flexural failure.
101
• The concrete surface only provided a slight increase in capacity over the neoprene pad but led to a non-ductile failure.
• Loading the beam at an a/d ratio of 2 did not cause the beam to fail in shear even with the absence of shear reinforcement.
• The failure at an a/d 2 was due to the PT bars yielding which was best represented by a strut-and-tie model or its moment capacity.
• The moment capacity for each of the tests, a/d of 2 and 3, provided the most accurate representation of the beams capacity.
102
LIST OF REFERENCES
1. Schlaich, J.; Schäfer, K.; and Jennewein, M. “Toward a Consistent Design of Structural Concrete,” PCI Journal, V. 32(3), No. 3, 1987, pp. 74-151.
2. ACI Committee 318 (ACI), “Building Code Requirements for Structural Concrete and Commentary (ACI 318-05/ACI 318R-05),” American Concrete Institute, Detroit, 2005.
3. Collins, M.P., Mitchell, D., “Prestressed Concrete Structures.” Prentice Hall Inc., Englewood Cliffs, 1991, 766 pp.
4. Ramirez, J.A., “Strut-Tie Design of Pretensioned Concrete Members.” ACI Structural Journal, V. 91, No. 4, Sept.-Oct. 1994, pp. 572-578.
5. Alshegeir, A. and Ramirez, J.A., “Strut-Tie Approach in Pretensioned Deep Beams.” ACI Structural Journal, V. 89, No. 3, May-June 1992, pp. 296-304.
6. MacGregor, J. and Wight, J., “Reinforced Concrete: Mechanics and Design.” Pearson Preston Hall, Upper Saddle River, N.J.
7. Bakht, B. and Jaeger, L.G., “Bearing Restraint in Slab-on-Girder Bridges.” Journal of Structural Engineering, V. 114, No. 12, December 1988, pp. 2724-2740.
8. American Association of State and Highway Officials (AASHTO), “AASHTO LRFD Bridge Specifications.” Washington, DC. 2007.
103
BIOGRAPHICAL SKETCH
Gustavo Adolfo Llanos was born in 1984. He was born and raised in Miami, Florida, and
is the youngest of two brothers. He graduated from Miami Killian High School in 2002. He
earned his B.S. in civil engineering from Florida State University (FSU) in 2006. He is pursuing
his M.E. in structural engineering from the University of Florida (UF). Upon completion of his
master’s degree, Gustavo will be working with BCC Engineering in Miami, Florida.