135
© 2016 MENGYANG GUO ALL RIGHTS RESERVED

© 2016
MENGYANG GUO
ALL RIGHTS RESERVED
SPATIALLY RESOLVED INFRARED IMAGING FOR BUILDING PERFORMANCE
EVALUATION
by
MENGYANG GUO
A thesis submitted to the
Graduate School-New Brunswick
Rutgers, The State University of New Jersey
In partial fulfillment of the requirements
For the degree of
Master of Science
Graduate Program in Civil and Environmental Engineering
Written under the direction of
Dr. Jie Gong
And approved by
__________________________
__________________________
__________________________
New Brunswick, New Jersey
May 2016

ii
ABSTRACT OF THE THESIS
SPATIALLY RESOLVED INFRARED IMAGING FOR BUILDING PERFORMANCE
EVALUATION
By MENGYANG GUO
Thesis Director:
Dr. Jie Gong
Understanding the interior workings of buildings has become an increasingly important research
topic as a growing population of people is living in urbanized environments. Infrared
thermography has been used extensively for detecting building defects that affect energy
performance. The focus of this project not only concerns building energy performance but also
health and structure hazards. The first objective of this research study is to review the use of
infrared thermography for building performance inspection and synthesize findings from existing
studies to demonstrate the potential of infrared thermography for detecting and quantifying
health and structure hazards. The second objective of this research study is to explore the
effectiveness of integration of infrared thermography and spatial sensing methods for intelligent
building hazard detection and evaluation. The proposed research methodology involves several

iii
major components including design of data collection protocols, data fusion and intelligent
extraction of building hazard related attributes, and field validation of proposed methods. The
study was validated by surveying the health and safety performance of two multi-family
buildings in a densely populated city in the Northeastern US, using the developed appraisal
method that integrate infrared thermography with 3D point cloud data. The efficacy of integrated
laser scanning and thermal imaging to determine housing-related health and structure-related
issue was assessed. It is important to note that the research results reported in this study is part
of a larger research effort aimed at developing quantitative understanding on the correlation
between the defects inside the residential building and how they impact the residents’ health and
comfort in a systemic way.

iv
ACKNOWLEDGEMENTS
My deepest gratitude goes to Professor Gong Jie, my advisor, for his constant encouragement
and guidance. He provided consistent and illuminating assistance and helped me through all the
stages of fulfilling this thesis. Without his consistent and illuminating instruction, this thesis
could not have reached its present form.
I also thank Dr. C. Andrews and Dr. J. Jin, for serving on my committee and their thoughtful
guidance and suggestions. I am also great indebted to the professors and teachers at the
Department of Civil and Environmental Engineering, who have instructed and helped me a lot in
the past years.
Lastly, I want to thank my beloved family for their loving considerations and great confidence in
me all through these years. I would especially thank my husband, Yisheng, who has been a
constant source of support and encouragement during the challenges of graduate school and life.

v
Table of Contents
ABSTRACT ................................................................................................................................... ii
ACKNOWLEDGEMENTS ........................................................................................................ iv
Introduction ................................................................................................................................... 1
Infrared Thermography for Building Hazard Detection: A Review ....................................... 5
2.1 Introduction ......................................................................................................................... 5
2.2 Green Building and Healthy Homes .................................................................................. 6
2.3 Infrared Thermography: Principles and Trends ........................................................... 11
2.3.1 The Principle of Infrared Thermography ...................................................................... 11
2.3.2 Infrared Camera Market ............................................................................................... 15
2.4 Infrared Thermography for Building Diagnosis ............................................................ 22
2.4.1 Building Defect Detection ............................................................................................ 22
2.4.2 Infrared Thermography Based R Value Estimation ..................................................... 33
2.4.3 Synthesis of Existing Studies ....................................................................................... 39
2.4.4 Factors Affecting Validity of Infrared Thermography Results .................................... 45
2.5 Conclusions ........................................................................................................................ 47
Spatially Resolved Infrared Imaging for Building Performance Evaluation........................ 48
3.1 Introduction ....................................................................................................................... 48
3.2 Related Work ..................................................................................................................... 50
3.3 Research Methodology ...................................................................................................... 55
3.3.1 Design of Data Collection Protocols ............................................................................ 56
3.3.2 Fusion of thermographic and LiDAR data and Intelligent Hazard Data Extraction .... 63

vi
3.4 Field Validation ................................................................................................................. 77
3.4.1 Data Collection Protocols ............................................................................................. 77
3.4.2 Field Data Collection .................................................................................................... 82
3.5 Results and Discussion ...................................................................................................... 88
3.5.1 Defect Detection Results .............................................................................................. 88
3.5.2 Apartment Condition Grading Results ......................................................................... 93
3.5.3 Summary of Apartment Attributes ............................................................................... 94
3.6 Conclusions and Future Research ................................................................................. 108
Appendix A:Building Defects Example in Building 1 ........................................................... 109
Appendix B:Building Defects Example in Building 2 ............................................................ 111
References .................................................................................................................................. 114

vii
Contents of Tables
Table 1: Summary of green building components .......................................................................... 7
Table 2: Healthy Home Rating System (HHRS) – Categorization of 29 hazards ....................... 10
Table 3: Basic infrared camera parameters ................................................................................... 16
Table 4: Infrared cameras for optical gas imaging ....................................................................... 18
Table 5: HERS Standard for missing insulation ........................................................................... 28
Table 6: HERS Standard for compression and incomplete fill ..................................................... 30
Table 7: RESNET Interim Guidelines for thermographic inspection of Building Insulation
Grading Standards ......................................................................................................................... 32
Table 8: Direct method and reflector method for apparent temperature estimation ..................... 36
Table 9: Determining the emissivity of the target ........................................................................ 38
Table 10: Current Building Point Cloud Generation Methods for 3D Thermal Building Model. 42
Table 11: A summary of infrared thermographic studies for building defect detection ............... 43
Table 12: Connections between defects in building envelops and home hazards ........................ 44
Table 13: Environmental conditions affecting the validity of infrared thermography ................. 45
Table 14 : Application of Infrared Thermography for Building Diagnosis .................................. 51
Table 15: Healthy Home Rating System (HHRS) – Categorization of 29 Hazards ..................... 56
Table 16: Connections between defects in building envelops and home hazards ........................ 58
Table 17: Data attribute list ........................................................................................................... 58
Table 18: Guidelines for the temperature factor for thermal bridge on wall ................................ 62
Table 19: 3D thermal model generation process and description ................................................. 64
Table 20: The effect of temperature scale on the number of inliner points .................................. 68
Table 21: List of data attributes collected from 3D infrared thermographic data ........................ 73

viii
Table 22: Specification for FLIR T650sc ..................................................................................... 77
Table 23: The specification of Faro Focus 3D Scanner ................................................................ 78
Table 24: Specification for FLIR MR77 ....................................................................................... 80
Table 25: Weather data from weather station ............................................................................... 81
Table 26: Data sheet for building 1 ............................................................................................... 82
Table 27: Data sheet for building 2 ............................................................................................... 82
Table 28: Extracted attributes for building 1(part one) ................................................................ 94
Table 29: Extracted attributes for building 1 (part two) ............................................................... 95
Table 30: Attribute descriptions for building 1............................................................................. 96
Table 31: Apartment information for building 2 – Exterior wall area .......................................... 98
Table 32: Attribute list for building 2 (part one) .......................................................................... 99
Table 33: Attribute list for building 2 (part two) ........................................................................ 100
Table 34: Thermal infrared data for building 2 (part one) .......................................................... 101
Table 35: Thermal infrared data for building 2 (part two) .......................................................... 102
Table 36: Attribute description for building 2 ............................................................................ 103

ix
Contents of Figures
Figure 1: The electromagnetic spectrum....................................................................................... 12
Figure 2: In addition to the radiation emitted from the target, the sensor also received reflected
radiation ........................................................................................................................................ 14
Figure 3: Pocket-sized infrared cameras ....................................................................................... 22
Figure 4: Infrared images taken in a simple apartment after a rainy day ..................................... 23
Figure 5: Thermography of interior wall surface with water leaking on the ceiling and in the wall
....................................................................................................................................................... 23
Figure 6: Thermography of interior wall surface with thermal bridge in winter .......................... 25
Figure 7: Thermography showing air infiltrations ........................................................................ 26
Figure 8: Thermography of interior wall surface with missing insulation ................................... 27
Figure 9: Grade II insulation grading example from RESNET Interim Guidelines for
thermographic inspection of Building Insulation Grading Standards........................................... 33
Figure 10: Ways to measure the radiation intensity...................................................................... 37
Figure 11: Measuring reflected temperature and emissivity......................................................... 37
Figure 12: An integrated approach for housing-related hazard detection and management ........ 55
Figure 13: 3D thermal model generation and anomalies detection .............................................. 64
Figure 14: 3D view of scanned living room and bathroom .......................................................... 66
Figure 15: Same infrared image with different temperature scale and its temperature in matrix 66
Figure 16: The effect of temperature scale and color palette on infrared images ......................... 67
Figure 17: Feature points detected in three infrared images ......................................................... 68
Figure 18: Matched SURF points, including outliers ................................................................... 68
Figure 19: Automatic indoor infrared image stitching result........................................................ 69

x
Figure 20: Infrared image and segmentation result ...................................................................... 70
Figure 21: Infrared images with cold alarm .................................................................................. 70
Figure 22: Indoor infrared image stitching and segmentation results........................................... 70
Figure 23: 3D thermal model of building exterior area ................................................................ 71
Figure 24: Raw data and 3D thermal point cloud ......................................................................... 72
Figure 25: 3D thermal model and their paired 3D temperature-segmentation model .................. 72
Figure 26: 3D thermal model and segmented 3D point cloud ...................................................... 73
Figure 27: Exterior area data collection ........................................................................................ 84
Figure 28: Common area data collection. ..................................................................................... 85
Figure 29: Example of apartment data. ......................................................................................... 86
Figure 30: Real-time outdoor temperature and humidity captured from weather station and
moisture meter .............................................................................................................................. 87
Figure 31: Poor or missing insulation issues ................................................................................ 89
Figure 32: Moisture issues ............................................................................................................ 90
Figure 33: Air infiltration examples ............................................................................................. 91
Figure 34: Cold air infiltration through wall sockets .................................................................... 91
Figure 35: Thermal bridge issues with two buildings ................................................................... 92
Figure 36: Issues with hot water risers ......................................................................................... 93
Figure 37: Summary of insulation condition for building 2 ....................................................... 107
Figure 38: Summary of R-Value and NESNET Insulation Grade for building 2 ....................... 107

1
Chapter 1
Introduction
Florence Nightingale said “The connection between health and dwelling is one of the
most important that exists”. The fact that people spend 50% or more of every day inside their
homes make the housing environment one of the major influences on health and well-being. As
the impact of buildings becomes increasingly apparent, two new fields called “Green Building”
and “Health Homes” are gaining momentum.
Green Building, also known as green construction or sustainable building, refers to both a
structure and the using of processes that are environmentally responsible and resource-efficient
throughout a building’s life-cycle. As one of the major components of green building, energy
consumption and efficiency have become issues of growing concern as both supply and demand
are strained. In the United States, buildings’ heating and cooling use 37.3% of the total building
energy consumption in 2010. With more than 134 million houses in the United States (U.S.
Census Bureau 2010), this presents a tremendous opportunity to decrease energy consumption
and reduce inefficiencies.
On the front of “Healthy Homes”, the history of researches linking housing and health
can go back to more than 60 years ago by the American Public Health Association (APHA)
Committee on the Hygiene of Housing. As a century-old concept, “Healthy Homes”, promotes a
safe, decent, and sanitary housing for preventing disease and injury, has got increasing attention
nationally. It is estimated that, in the United States, millions of home occupants are exposed to

2
moderate or even severe health and safety hazards such as roofing structural problems, heating
and plumbing deficiencies, leaks, and pest problems that are associated with a wide range of
health issues from injuries to respiratory illnesses.
To promote green building and healthy home, there is a great need to understand the
performance of hundreds of millions of existing building stocks. Given the sheer number of these
buildings and homes, cost-effective, non-destructive, and non-invasive methods that can detect
and evaluate building performance are game changes. Recently, with the development of thermal
infrared technologies, Infrared Thermography has been increasingly used as a valuable tool for
quick inspecting and performing non-destructive testing for building elements, detecting where
the building deficiencies are and monitoring how energy is leaking from envelope. Problems that
can be identified in a building through thermal infrared imaging include cracks, lack of
insulation, damage door and window seals, and building-up of moisture (Vidas and Moghadam
2013). Successful inspection may lead to addressing these issues, along with achieving
refinements in building design, which will ultimately improve building environment and energy
performance.
Despite the recent advance in standardizing infrared thermography based building
inspection, the effectiveness of infrared thermography still relies heavily on correct and rapid
interpretation of visual displays of thermal images. Correct and rapid interpretation of thermal
images requires considerable experience and can be assisted by a systems view of building
structures. For many building professionals, infrared thermography interpretation is a very
subjective process, and there are very few, if not none, software tools for automated
interpretation of thermal images. Furthermore, interpretation of thermal images often happens in
a context with limited geometric information on the building being investigated. As a result,

3
spatial patterns of surface temperature anomaly cannot be easily visualized to detect interrelated
building system defects. In many cases, accurate estimation of building defects and hazards often
requires multiple trips to carry out geometric survey of susceptible building areas (Alba et al.
2011; Laguela et al. 2012).
At the same time, reality capture technologies such as RGB-D cameras, Structure from
Motion (SFM), and laser scanners, have become main stream practices in interior and exterior
modeling. RGB-D cameras are novel sensing systems that can capture RGB images along with
per-pixel depth information. Originally developed for the purpose of gaming and human
computer interface, RGB-D cameras have also shown promises in mapping of small-scale
environments. Structure from Motion is the process of estimating three-dimensional structures
from 2D image sequences (Agarwal et al. 2011). Comparing to Structure from Motion, RGB-D
cameras allow the capture of reasonably accurate mid-resolution depth and appearance
information at high data rates and at a very low cost. Light Detection and Ranging (LiDAR) a
relatively new class of survey instrument that have been available on the market for about ten
years and has become a popular and increasingly used technology for providing as-built and
inventory data in building inspections.
There are opportunities in integrating infrared and spatial sensing technologies into a
unified platform for systematic and quantitative assessment of building performance from the
perspectives of both green building and healthy home. Previous studies have predominately
focused on building defects impacting energy performance. Few studies have been devoted to
understand which features related to building performance (energy performance and building
hazards) can be reliably extracted from the fused 3D and infrared data, and also to which agree
these extraction processes can be automated.

4
The purpose of this research project is to investigate integration of spatial and infrared
sensing for systematic detection of building defects that are quantitative in nature and indicative
in understanding issues related to both green building and healthy home. Sensing fusion and
pattern extraction methods are developed in this project with a goal to expand these methods to
crowd sourced approaches. The analysis framework developed in this study was validated on two
multifamily high-rise buildings to demonstrate its effectiveness in building performance
diagnosis and its potential in gathering high quality data sets that can be correlated to other
healthy home indicators such as indoor air quality, etc.
This thesis consists of two standalone papers. The first paper provides a systematic
review of existing research in infrared building hazard detection. The second paper concerns the
effectiveness of integration of infrared thermography and spatial sensing methods for intelligent
building hazard detection and evaluation.

5
Chapter 2
Infrared Thermography for Building Hazard Detection: A Review
2.1 Introduction
Green Building, also known as green construction or sustainable building, refers to both a
structure and the using of processes that are environmentally responsible and resource-efficient
throughout a building’s life-cycle. As one of the major components of green building, energy
consumption and efficiency have become issues of growing concern as both supply and demand
are strained. In the United States, buildings’ heating and cooling use 37.3% of the total building
energy consumption in 2010. With more than 134 million houses in the United States (U.S.
Census Bureau 2010), this presents a tremendous opportunity to decrease energy consumption
and reduce inefficiencies. On the front of “Healthy Homes”, the history of researches linking
housing and health can go back to more than 60 years ago by the American Public Health
Association (APHA) Committee on the Hygiene of Housing. As a century-old concept,
“Healthy Homes”, promotes a safe, decent, and sanitary housing for preventing disease and
injury, has got increasing attention nationally. It is estimated that, in the United States, millions
of home occupants are exposed to moderate or even severe health and safety hazards such as
roofing structural problems, heating and plumbing deficiencies, leaks, and pest problems that are
associated with a wide range of health issues from injuries to respiratory illnesses.
There is an opportunity emerging as a side benefit from the recent focus on energy
efficient buildings. That effort has spurred much research into the development of non-
destructive and non-invasive technologies for building energy performance inspection. For

6
example, Infrared Thermography (IRT) is a popular technology used for diagnosis of building
defects. While these technologies have their primary focus on improving energy efficiency, they
brings new opportunities for identifying and diagnosing various housing-related health and
safety hazards; many of these hazards are interrelated or interacting threats to healthy living.
The purpose of this paper is to provide a systematic review of existing research in
infrared building hazard detection. The paper begins with discussion of health and structure
hazards in buildings and homes, followed by a review of current research in building defect
detection with infrared thermography technologies.
2.2 Green Building and Healthy Homes
Building performance (structure performance and indoor air quality) and residents’ health
symptom are two major fields that judge how suitable a building is for living. As the impact of
buildings becomes increasingly apparent, two new fields called “Green Building” and “Health
Homes” are gaining momentum.
The primary focus of green building movement is on designing and constructing a
structure and the using of processes that are environmentally responsible and resource-efficient
throughout a building’s life-cycle. The U.S. Environmental Protection Agency listed the 5
principles for a green building, which are Sustainable Site Design, Water Quality and
Conservation, Energy and Environment, Indoor Environmental Quality, Materials and Resources
(Table 1). On the one hand, as one of the major components of green building, energy
consumption and efficiency have become issues of growing concern as both supply and demand
are strained. In the United States, buildings’ heating and cooling use 37.3% of the total building
energy consumption in 2010. With more than 134 million houses in the United States (U.S.
Census Bureau 2010), this presents a tremendous opportunity to decrease energy consumption

7
and reduce inefficiencies. On the other hand, green building also concerns “Indoor
Environmental Quality”, which clearly serves a tie to healthy homes.
As a century-old concept, “Healthy Homes”, promotes a safe, decent, and sanitary
housing for preventing disease and injury, has got increasing attention nationally. In 2013, the
U.S. Department of Housing and Urban Development (HUD), the White House Council on
Environmental Quality (CEQ), the Environmental Protection Agency (EPA), the Surgeon
General, and the Department of Energy have introduced a collaborative initiative entitled
Advancing Healthy Housing—a Strategy for Action. The program prompts federal agencies to
support “pre-emptive actions” for reducing the number of US homes with health and safety
hazards. Examples of resources that support this approach can be found in the form of guidance
manuals and websites, training/education such as SolarOne’s Workforce Lab program, and
embedded within certification programs such as GREENGUARD or LEED. These resources are
developed by professional organizations, federal and state agencies and nonprofit organizations
and are frequently collaborative efforts. A few examples include HUD’s Healthy Homes
program, US EPA’s Tips for Housing Managers and the NJ Department of Health Indoor
Environments Program.
Table 1: Summary of green building components
Fundamental
Principles of
Green Building
Key Principles Description
Sustainable Site
Design
Minimize urban sprawl and needless destruction of valuable land, habitat
and green space, which results from inefficient low-density development.

8
Encourage higher density urban development, urban re-development and
urban renewal, and brownfield development as a means to preserve
valuable green space. Preserve key environmental assets through careful
examination of each site. Engage in a design and construction process
that minimizes site disturbance and which values, preserves and actually
restores or regenerates valuable habitat, green space and associated eco-
systems that are vital to sustaining life.
Water Quality and
Conservation
Preserve the existing natural water cycle and design site and building
improvements such that they closely emulate the site’s natural “pre-
development” hydrological systems. Emphasis should be placed on
retention of storm water and on-site infiltration and ground water
recharge using methods that closely emulate natural systems. Minimize
the unnecessary and inefficient use of potable water on the site while
maximizing the recycling and reuse of water, including harvested
rainwater, storm water, and gray water.
Energy and
Environment
Minimize adverse impacts on the environment (air, water, land, natural
resources) through optimized building siting, optimized building design,
material selection, and aggressive use of energy conservation measures.
Resulting building performance should exceed minimum International
Energy Code (IEC) compliance level by 30 to 40% or more. Maximize
the use of renewable energy and other low impact energy sources.
Indoor
Environmental
Provide a healthy, comfortable and productive indoor environment for
building occupants and visitors. Provide a building design, which affords

9
Quality the best possible conditions in terms of indoor air quality, ventilation,
thermal comfort, access to natural ventilation and daylighting, and
effective control of the acoustical environment.
Materials and
Resources
Minimize the use of non-renewable construction materials and other
resources; Maximize the use of recycled content materials, modern
resource efficient engineered materials, re-usable, renewable, sustainably
managed, bio-based materials and resource efficient composite type
structural systems wherever possible.
Data Retrieved from: US EPA Online
http://www3.epa.gov/statelocalclimate/documents/pdf/12_8_what_is_green_GGGC.pdf
HUD’s Healthy Home Rating System (HHRS) was developed based upon the successful
Housing Health and Safety Rating System (HHSRS), which can address key issues affecting
health and safety due to conditions in the home, provides analysis of how hazardous a dwelling
is and provides evidence and statistical information to assist assessors in making judgments. The
HHRS provides a method of grading the severity of threats to health and safety in any dwelling,
from house, self-contained flat/apartment, non self-contained flat/apartment, a room rented
within a dwelling or house, to a room in a university hall or similar residential building and the
means of access and shared or common rooms and facilities. There are 29 summarized hazards
listed in the HHRS Hazards Summary Chart across four categories including Physiological,
Psychological, Infection, and Safety (Table 2) (U.S. HUD).

10
Table 2: Healthy Home Rating System (HHRS) – Categorization of 29 hazards
Categorization Hazard Type
Physiological 1. Dampness and Mold
2. Excess Cold
3. Excess Heat
4. Asbestos and manmade fibers
5. Biocides
6. Carbon Monoxide
7. Lead-based paint
8. Radiation
9. Un-combusted fuel
10. Volatile
Psychological 11. Crowding and Space
12. Entry by Intruders
13. Lighting
14. Noise
Infection 15. Domestic Hygiene, Pests, and
Refuse
16. Food Safety
17. Personal Hygiene
18. Water Supply
Safety 19. Falls in bath etc.
20. Falls on the level
21. Falls on stairs etc.
22. Falls from windows etc.
23. Electrical hazards
24. Fire hazards
25. Hot surfaces etc.
26. Collision/Entrapment
27. Ergonomics
28. Explosions
29. Structural collapse
The fact that people usually spend half of time or more everyday inside their homes
making the housing environment one of the major influences on health and well-being.
Nevertheless, in the United States, millions of home occupants are exposed to moderate or even
severe health and safety hazards such as roofing or other structural problems, heating and

11
plumbing deficiencies, leakages, and pest problems that are associated with a wide range of
health issues from respiratory illness, SBS to injuries. Many of these home occupants have
limited resources to detect these building and home hazards. There is a need for cost effective
and non-intrusive technologies that can reliably detect and diagnose these hazards. Infrared
thermography has been widely used for building performance inspection, in particular for
detecting energy leakage from building envelope to quantify potential energy saving, identifying
problems and deficiencies inside of the building. With the recent technological advance in
infrared technology, infrared thermography is no longer an exclusive tool for building inspection
specialist, and becomes accessible to the general public. The concept of using infrared
thermograph as a cost effective building and home hazard detection method is intriguing. The
central motivation of this review paper is to synthesize the studies in the field of using infrared
thermography for building defect diagnosis in order to foster better understanding of the
potential of infrared thermography for building and home hazard detection.
2.3 Infrared Thermography: Principles and Trends
2.3.1 The Principle of Infrared Thermography
Infrared Thermography (IRT) is the process of acquisition and analysis of thermal
information from non-contact thermal imaging devices. Thermographic cameras can detect
radiation in the infrared range of the electromagnetic spectrum and produce images of that
radiation. Infrared light is one of the electromagnetic radiations (Figure 1) with a wavelength
between 0.7 and 300 micrometers. Since infrared radiation is emitted naturally from any object
with a temperature above absolute zero (-273.15 °C or 0 °K) according to the black body
radiation law, thermography makes it possible to see one’s environment with or without visible
illumination. As shown in Figure 1, the infrared spectrum can be divided into five categories:

12
Near infrared (NIR), Short wavelength infrared (SWIR), Mid wavelength infrared (MWIR), long
wavelength infrared (LWIR), and far infrared (FIR). The applications of infrared waves include:
communications, thermal imaging, night vision, missile tracking, heating, and other uses in the
field of astronomy, meteorology, spectroscopy, biological systems and so on.
Figure 1: The electromagnetic spectrum
The energy of emitted radiation can be converted to temperature by means of the Stefan
Boltzmann Law, which states that the power radiation by a material is directly proportional to the
fourth power of its absolute temperature as:
𝑞𝑟𝑎𝑑 = 𝜀𝜎𝑇4 (1)
where 𝜀 is infrared emissivity of the material, 𝜎 is the Stefan-Boltzmann constant
(5.67×10⁻⁸ W m−2 K−4 ), and T is the surface temperature of the material. Emissivity, 𝜀 ,
presents how efficiently a material transfers energy by radiation heat transfer. It is a unit value
defined as the fraction of energy emitted relative to the radiation of perfect emitter or blackbody.

13
The amount of radiation emitted by an object increases with temperature; therefore, a thermal
device can measure the emitted IR energy and converts it to digital temperature readout which
allows one to see variations in temperature. Thus through an infrared device, those thermal
patterns and heat signature can be captured and displayed as visible information to naked eyes.
However, such temperature readings could be false due to the fact that the energy reaches a
thermal sensor (Infrared camera) is a sum of energy emitted from the target and the energy
emitted from surrounding environment and intercepted by the objects surface. In a simple term,
the total energy emitted from the object is a combination of emitted energy, transmitted energy
and reflected energy (Figure 2). The sum of emission is composed of absorption , reflection , and
transmission , and the value is equal to one.
%Reflected +% Tranmistted +% Absorbed = 100% (2)
The absorption is the degree to which infrared energy is absorbed by a material, while,
transmission is the degree that thermal energy passes through a material. In some case, if the
object is opaque, the tranmissed energy become 0 and the emissivity and refectivity add together
to be 100%. Reflection describes how much infrared energy is refected off a material. The
sensor cannot distinguish between the energy emitted versus energy transmitted or reflected, so
the temperature captured from infrared sensor is usually the “apparent” temperature.

14
Figure 2: In addition to the radiation emitted from the target, the sensor also received reflected
radiation
Subsurface anomalies in building structures, such as moisture and insulations, interrupt
heat flow and produce localized differences in wall surface temperature. These localized
variations in surface temperature in turn affect the amount of infrared radiation emitted from the
surface, which are often detectable using an infrared camera. As discussed in the last paragraph,
radiation measured by an infrared camera not only depends on the temperature of an object but
also influenced by reflected radiation. To measure temperature accurately, it is therefore
necessary to compensate for the effects of a number of different radiation sources. According to
the FLIR Report on Buildings, object parameters required for accurate temperature measurement
include emissivity of object, reflected apparent temperature, the distance between the object of
interest and the camera, relative humidity, and atmosphere temperature (FLIR System AB. 2009).
In addition to moisture and insulations, infrared thermography can also be employed to

15
determine the heat losses in buildings (C.A. Balaras 2002), predict structure failures (M.R. Clark
2003), and other problems relating to humidity (V.De Luca 1996).
There are two types of thermography inspections: passive thermography and active
thermography. The passive approach measures surface temperature differences of a structure
during normal conditions, while the active approach generates the temperature differences of the
structure using an external stimulus. External stimulus can be any kind of external heat sources,
such as lamps, ovens, and hot packs (Kylili et al. 2014). Although the effectiveness of passive
thermography can be complicated by weather and environmental condition, passive
thermography, as a simpler and more rapid approach when compared with active thermography,
is widely used in building diagnostics. In general, passive thermography has been used for
structure inspection, electrical inspection, and mechanical inspection in the context of building
performance inspection.
2.3.2 Infrared Camera Market
Thermography has a long history and had been used by firefighters to see through smoke,
by maintenance technicians to locate overheating issues and section of power lines, by building
construction technicians to see the thermal signatures to locate heat leaks. Although night vision
and thermal imaging are both used to detect objects at night, they have different principles that
night vision relies on at least a very low level of light and will not work in complete darkness. In
the context of this research, our primary interest is thermal imaging cameras.
Although there are a number of components that contribute to the quality and cost of an
infrared camera (thermal imaging camera), the two most important factors are detector resolution
and thermal sensitivity. The detector resolution describes the number of pixels that can measure
the temperature. The typical resolutions coming with a thermal imaging camera are 80×60,

16
160×120, 320×240, 640×480 and 1024×768. A 640×480 detector can produce an infrared image
composed of 307,200 pixels. The thermal sensitivity is the least temperature difference an
infrared camera can detect. A sensitivity of 0.02°C means that the camera can distinguish
between two surfaces with a two-hundredths of a degree temperature difference. In addition to
detector resolution and thermal sensitivity, temperature range is also important. The temperature
range of an infrared camera describes the maximum and minimum temperature that the camera
can measure. A temperature range of -40°C to +2000°C means that camera can measure
temperature from -40°C to 2000°C. Table 3 provides a complete list of key parameters related to
the performance of an infrared camera.
Table 3: Basic infrared camera parameters
Infrared
Camera
Characteristics
Description Example
Resolution Describe the number of
pixels can be measure
the temperature
640×480, means the infrared camera can produce an
infrared image composed of 307,200 pixels
Thermal
Sensitivity
Describe the least
temperature difference
one infrared camera can
detect
sensitivity of 0.02°C means that camera can
distinguish between two surfaces with a two-
hundredths of a degree temperature difference
Accuracy Describe how accurate
the temperature reading
An infrared camera with a +/-2% accuracy means
the infrared camera is calibrated within a +/-2% of

17
is. reading
D/S Ratio Distance-to-spot ratio.
The distance-to-spot
ratio is the size of the
area being evaluated by
the infrared camera as it
relates to distance.
If the target to be measured is 5 inches in size, and
the infrared thermometer has a D/S ratio of 8:1, then
the maximum distance at which can reliably measure
the temperature of the target is 40 inches. When the
distance is farther than 40 inches, not only the target
will be measure, but also the surrounding objects
that falls within the “spot” will be measured at the
same time.
The wavelength of an infrared camera often dictates its application areas. One means of
categorizing infrared cameras is by spectral response. The most common design approach is to
select a segment of infrared spectrum, and integrate the energy falling on the infrared detector for
that segment. Many general-purpose cameras use a wideband 8 to 14 μm for measuring objects
below 500°C (Calex Electronics Limited). A narrow bans may be used for some special purposes
and applications (e.g. gas detection).
When an infrared camera is used for building diagnosis, electrical inspection, and
mechanical inspection applications, the spectral range usually goes from 7.5 to 14 μm. Infrared
cameras used for optical gas imaging and furnace inspection usually have a different spectral
range when compared with other thermal cameras. Depends on detailed applications, gas
detection cameras can be divided for various applications such as oil and petrochemical
application, manufacturing application, electric utility application, natural gas application,

18
chemical application, furnace and boiler inspection application and independent lab testing
(Table 4).
Table 4: Infrared cameras for optical gas imaging
Infrared
Wave
[μm]
Gas Detected Gas
Detection
Application
Description
3.2 – 3.4 1-Pentene,Benzene,
Butane, Ethane ,Ethanol ,
Ethylbenzene ,Ethylene ,
Heptane ,Hexane ,
Isoprene, MEK ,Methane ,
Methanol, MIBK, Octane ,
Pentane ,Propane,Propylene,
Toluene ,Xylene,
Oil and
Petrochemica
l;
Manufacturin
g;
Nature gas
Detection;
Chemical;
Detect spot leaks in piping,
flanges and connections in
petrochemical operations.
3.8-4.05 Gas from furnaces, heaters and
boilers.
Furnace and
boiler
inspection
The camera with this infrared
wave is specially designed to
inspect industrial furnaces,
heaters and boilers, which is
equipped with a special mid
wave "flame filter" that is

19
specifically engineered for high
temperature (up to 1500°C). It
will help make inspection faster,
work safer and avert
unscheduled shutdowns.
4.2- 4.4 CO2 Oil and
Petrochemica
l;
Manufacturin
g;
Nature gas
detection;
Visualize CO2 leaks during
normal operation and keep
operations safe.
4.52-
4.67
CO and Nitrous Oxide (
N2O); Ketene;Ethenone (
C2H2O); Butyl Isocyanide;
Hexyl Isocyanide; Cyanogen
Bromide (CNBr); Acetonitrile
(C2H3N); Acetyl Cyanide;
Chlorine Isocyanate (CClNO);
Bromine Isocyanate (CBrNO);
Methyl Thiocyanate (C2H3NS);
EthylThiocyanate;
Chlorodimethylsilane(
Electric
Utility;
Visualize CO or other harmful
gases leaks from a safe distance
without interrupting the
operation.
20
(CH3)2SiHCl;
Dichloromethylsilane; Silane
(H4Si); Germane (GeH4); Arsine
(AsH3);
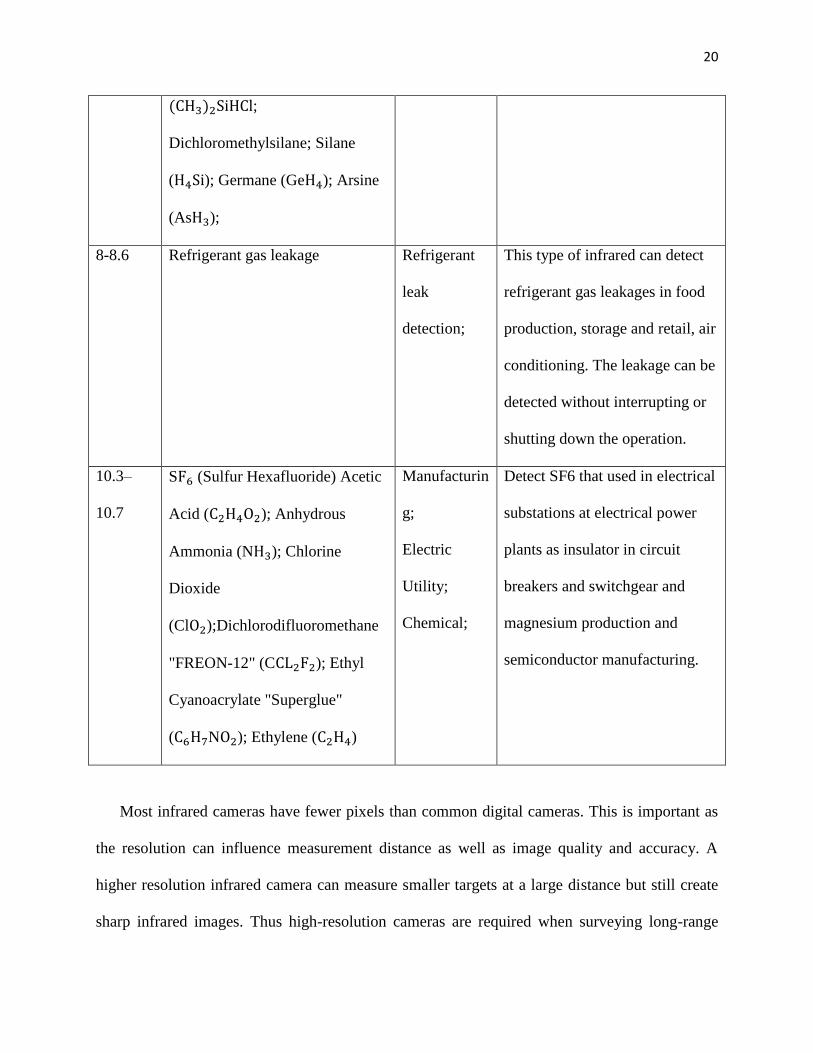
8-8.6 Refrigerant gas leakage Refrigerant
leak
detection;
This type of infrared can detect
refrigerant gas leakages in food
production, storage and retail, air
conditioning. The leakage can be
detected without interrupting or
shutting down the operation.
10.3–
10.7
SF6 (Sulfur Hexafluoride) Acetic
Acid (C2H4O2); Anhydrous
Ammonia (NH3); Chlorine
Dioxide
(ClO2);Dichlorodifluoromethane
"FREON-12" (CCL2F2); Ethyl
Cyanoacrylate "Superglue"
(C6H7NO2); Ethylene (C2H4)
Manufacturin
g;
Electric
Utility;
Chemical;
Detect SF6 that used in electrical
substations at electrical power
plants as insulator in circuit
breakers and switchgear and
magnesium production and
semiconductor manufacturing.
Most infrared cameras have fewer pixels than common digital cameras. This is important as
the resolution can influence measurement distance as well as image quality and accuracy. A
higher resolution infrared camera can measure smaller targets at a large distance but still create
sharp infrared images. Thus high-resolution cameras are required when surveying long-range

21
targets or small components, especially for electrical and mechanical applications. For example,
an infrared camera with a 25° lens and an 80×60-pixel detector will have a smaller spot
measuring size than an infrared camera with a 25°lens and a 160×120-pixel detector. In general,
there are four types of resolutions available on the market:
Low resolution (As low as 60×60 pixels)
Standard resolution (Typically 160×120 pixels)
High resolution (From 320×240 pixels up to 640×480 pixels)
Very high resolution (1024×768 or higher pixels)
Infrared cameras can also be varied in size. The general trend is with the rapid
development in thermal technology, thermal devices become increasing affordable and portable.
With the latest technology, the thermal cores become smaller and much less expensive. The
FLIR One and Seek Thermal realized the fusion of smartphone and thermal camera. FLIR C2
and Seek Reveal(Figure 3) are the full-featured, pocked-sized, completely standalone camera
that designed for a wide range of building, electrical and mechanical applications. In the past,
thermography cameras are almost exclusive assets operated by professionals. This has changed
since the introduction of miniature size smart phone-based infrared cameras. These cameras open
the door to wide adoption of infrared thermography based building performance inspection by
home owners and building operators, which will form the basis for a citizen science framework
on building and home inspection.

22
Figure 3: Pocket-sized infrared cameras
(a)FLIR One for Android; (b) Seek Thermal for iPhone; (c) FLIR C2 ;(d) Seek Reveal
2.4 Infrared Thermography for Building Diagnosis
2.4.1 Building Defect Detection
Infrared technology has been increasingly used in building inspection to provide people
with the distribution of temperature that allows building inspectors to see problems they would
have missed through traditional assessment method. These problems include water penetration of
walls and roof (Figure 4 and Figure 5), leaks in the plumbing, electrical problems, missing,
improperly installed or damaged insulations, thermal bridges, and air infiltrations. While some of
these problems are self-explanatory, the others, such as thermal bridge and air infiltration are not
quite obvious to interpret. Detailed explanations of the symptoms of these problems are provided
as the following.
As the most common defect that can be identified from infrared thermography, moisture
issue has been confirmed not only impact the indoor humidity, but also human comfort and air
quality (Rode et al., 2001; Simonson et al., 2002). Moisture areas are detectable to infrared

23
thermography because a wet mass can retain the absorbed heat for a longer time than a dry mass
and as a result of this the wet area takes a longer time to radiate the heat during the heating
process. Figure 5 shows some examples of moisture intrusion detected by infrared thermography.
Figure 4: Infrared images taken in a simple apartment after a rainy day
Figure 5: Thermography of interior wall surface with water leaking on the ceiling and in the wall
Thermal bridges, also called a cold bridge or heat bridge, are limited areas in the
construction where heat flow is higher than the heat flow in the undisturbed area. They are

24
usually caused by structural components that penetrate the insulation’s thermal barrier. This
creates a shot-circuit path for the heat flow, which cause unexpected heat transfer and energy
waste. Possible consequences from thermal bridges are condensation of water vapor in buildings,
especially the older buildings and significant energy loss. Several studies showed that thermal
bridges may cause up to 30% of the extra-thermal losses through the envelope in winter, in this
way increasing the energy consumption during heating season (Theodosiou and Papadopoulos
2008). Other effect of thermal bridges includes provide habitant for molds and fungi and produce
bad indoor air quality conditions (Ascipne et al. 2013; GhaffarianHoseini et al. 2013). To
quantify the extent of thermal bridge, temperature factor is used for the assessment of thermal
bridge and air leakages. Kalamees (2007 and 2008) determined the typical places of air leakage
and thermal bridge through the infrared camera and calculated the temperature factor at the
internal surface (fRsi, −). The temperature factor fRsi
at the internal surface shows the relation of
the total thermal resistance of the building envelope (RT, (m2 ∙ K)/W) to the thermal resistance
of the building envelope without the internal surface resistance (Rsi, (m2 ∙ K)/W) and can be
calculated with measured internal surface temperature (Ts,in, °C), indoor temperature (Tin, °C)
and outdoor temperature (Tout , °C) according to following equation (Hugo 2012, Kalamees
2007).
RT − Rsi
RT= fRsi
= Ts,in − Tout
Tin − Tout (3)
Studies related to temperature factor pointed out that the poor temperature factor related
to poor insulation values and in their researches a level of grade was given: A temperature factor
for Thermal bridges with fRsi≥ 0.65 and fRsi
≥ 0.61 reflect good level and tolerable level,

25
while when temperature factors are lower than 0.61, the detected air may include health risks or
hazards (Kalamees 2008; Little 2011; Schock and Isokorb 2015).
Figure 6: Thermography of interior wall surface with thermal bridge in winter
Air leakage also known as infiltration is the unintentional or accidental introduction of
outside air into a building, typically through cracks in the building envelope and through use of
doors and passage (U.S. DOE 2012). Air leakage through windows and doors allow unwanted
outdoor air to enter inside the building (infiltration) or indoor air to escape (exfiltration). Thus
increasing the heat gains during the summer and heat lose during the winter. They are important
in terms of building energy performance because it can reduce the effectiveness of insulation and
significantly reduce the energy efficiency of the building through direct air intrusion. In addition,
during the heating seasons, cold air drafts near the windows could cause thermal discomfort for
residents, especially for children and occupants age 65 or above. Air leakage can occur in the
junction of exterior walls, space between window/door jambs and framing, floors, electrical
boxes or switches on the exterior wall. Air infiltration at electrical switches and outlets is one
common issue happens in residential building, during heating season, leaks through electrical
boxes and switches can cause comfort complaints and raise the risk of moisture problems in

26
walls. Through the infrared camera, the cold air leakage can be easily point out around the
window or a doorframe. Balaras and Argiriou (2002) pointed out that IR thermography can see
the end results of the cold airflow, though it cannot see the cold air or measure the air
temperature. Some of air infiltration examples are shown in Figure 7.
Figure 7: Thermography showing air infiltrations: (a) Cold air infiltration around the doorframe;
(b) Cold air infiltration around the window; and (c) Cold air infiltration at wall socket
Thermal insulation reduces heat losses by conduction through the building envelope (i.e.
wall, roof) during winter and heat gains during summer. Good thermal insulation can reduce the
heating or cooling energy costs and improves indoor thermal comfort conditions by increasing
the interior surface wall temperature in winter and by reducing it in summer. Missing or
damaged insulation can be located when the thermography indicates a temperature difference of
about 10 C between the internal and external surface temperature (Residential Energy Services
Network, Inc. 2012; FLIR System AB. 2011). On a thermography, missing or poor insulation
area will appears to be a light/dark colored patch with distinct edges the outline the problematic
areas (Balaras and Argiriou 2002). Examples of missing insulation are shown in Figure 8.

27
Figure 8: Thermography of interior wall surface with missing insulation
Assessing the performance of insulation in building construction is a particular interest
topic as it can be used an important means to assess construction quality for new homes. ESNET
or the Residential Energy Services Network is recognized national standards-making body for
building energy efficiency rating and certification systems in the United States. In 2006,
RESNET published a major revision of the HERS Standards, officially named the 2006
Mortgage Industry National Home Energy Rating Systems Standards. One important new feature
in this standard was the grading of insulation installation quality. The rating result can be used
for seeking to qualify for a program’s label or certification, such as the ENERGY STAR new
homes program. The rating result usually includes all the information about the building
envelope, the heating and cooling systems, ventilation, water heating, lights, and appliances. The
R-value of the insulation in all the insulated building assemblies (walls, ceilings, floors) can have
a big effect on the rating result. Using a grade on the installation quality can help the rater
develop the energy model of the home in a more accurate way. The HERS Standard defines a
threshold, or boundary condition, that the installation must meet to be assigned to that level.
According to the HERS standard, the insulation installation quality can be split to two
criteria: Missing insulation and Compression and incompletely filled areas. Missing insulation

28
happens when a cavity in a building assembly has insulation installed in a way that leaves gaps,
which can affect the amount of heat that flows across the building envelope. The increasing
number of gaps led to a worse grade result in HERS. Description of Grade I, II and III and listed
in follow table, images taken from HERS Standards. Compression and incomplete fill are the
common problem with fiberglass batt insulation because the batts are often not cut to the proper
size for the cavity, the detail description of Compression and incomplete fill grades are listed in
Figure, information and images taken from HERS Standards.
Table 5: HERS Standard for missing insulation
Grade Grade I Grade II Grade III
Description Almost no gaps Up to 2% missing
insulation
2%-5% missing
insulation
Interpretatio
n
Grade I shall be used to
describe insulation that is
generally installed
according to manufactures
instructions and /or
industry standards.
To be graded as “Grade
I”, the insulation material
should uniformly fills
each cavity side-to-side
and top-to-bottom,
Grade II shall be used to
describe an installation
with moderate to frequent
installation defects: gaps
around wiring, electrical
outlets, plumbing and
other intrusions, rounded
edges. Gaps and spaces
running clear through the
insulation amounting to
no more than 2% of the
Grade III shall be used
to describe an
installation with
substantial gaps and
voids, with missing
insulation amounting to
greater than 2% of the
area, but less than 5% of
the surface area is
intended to occupy.
More than 5% missing

29
without substantial gaps
or voids around
obstruction (such as
blocking or bridging) and
is split, installed, and/or
fitted tightly around
wiring and other services
in the cavity.
total surface area covered
by the insulation.
insulation shall be
measured and modeled
as separate, uninsulated
surfaces.
Illustration
Occasional very small gas
are acceptable for “Grade
I”
No more than 2% of
surface area of insulation
missing is acceptable for
“Grade II”
The illustration
represents the boundary
conditions between
Grade III and the
situation whereby one
must measure the
uninsulated areas
The Grade III for missing insulation is designed as no more than 5% of the surface area
of insulation missing is acceptable. For an installation that is worse than Grade III, the procedure

30
specifies that the inspector must measure the insulated areas separately from the uninsulated
areas and input them separately in software (Harley 2005). For example, a wall area of 200
square feet has 20 square feet of no insulation, the 20 square feet must be assigned as uninsulated
cavity wall. In year 2010, RESNET adopted the guidelines for thermographic inspections of
buildings and published the standard “ RESNET Interim Guidelines for Thermographic
Inspection of Buildings”. This standard provides guidance on the use of infrared thermography
for the inspection. In this standard, the definition of each Grade is slightly adjusted to apply for
the use of infrared thermography. The following table shows the insulation grading standard for
infrared thermography. Figure 9 shows the method for converting anomalies to insulation
grading through infrared camera.
Table 6: HERS Standard for compression and incomplete fill
Grade Grade I Grade II
Description 2% or less 2%-10%
Interpretation Compression or incomplete fill
amounting to 2% or less, if the
empty spaces are less than 30% of
the intended fill thickness, are
acceptable for “Grade I”.
To explain it, using 1000 square
feet as example. No more than 20
square feet of each 1000 square feet
can have this problem, and those 20
Compression or incomplete fill
amounting to less than 10% of the area
with 70% or more of the intended
thickness (i.e., 30% compressed).

31
square feet must be filled to at least
70% of their intended insulation
depth.
Illustration
Compression or incomplete fill
amounting to 2% or less, if the
empty spaces are less than 30% of
the intended fill thickness, are
acceptable for “Grade I”.
No more than 10% of surface area of
insulation compressed or incomplete
fill, by up to 30% (70% or more of
intended thickness) is acceptable for
“Grade II”.

32
Table 7: RESNET Interim Guidelines for thermographic inspection of Building Insulation
Grading Standards
Grade Grade I Grade II Grade III
Description Grade I
insulation
installation
cannot be
verified
using this
infrared
standard
Grade II must be insulation
installed with anomalies found
to be between ½% and 2% for
all inspected walls, floors and
ceilings of the building
Grade III must be an insulation
installation having between 2%
and 5% anomalies found for an
inspected walls, ceilings and
floors of the building enclosure
Illustration NA

33
Figure 9: Grade II insulation grading example from RESNET Interim Guidelines for
thermographic inspection of Building Insulation Grading Standards
2.4.2 Infrared Thermography Based R Value Estimation
As two major factors for insulation and heat loss measurement, R-value and U-value are
widely used to describe the air-to-air behavior of a particular construction. The U-value, which is
also known as the overall thermal transmittance coefficient (Unit:W/m2K), is a measure of the
overall rate of heat transfer. An R-value (Unit:m2K/W) is a measure of the opposition to heat
transfer offered by a particular building element, such as a wall, or by parts of the element.
Although building regulations and codes (e.g. ASHRAE 90.1-2010, IECC 2012, IGCC 2012) use
R-values or U-values as one mechanism to specify targets and limits for thermal insulation, there
are other principal factor can also affect the rate of heat lost from a building. According to
McMullan (2012), the principal factors that affect the rate of heat lost from a building are:
Insulation of the building shell, exposed area of the building shell, temperature difference
between inside and outside, air change rate, exposure to external climate, efficiency of service in
the building and patterns of use of the building.
Extensive research effort has been devoted to estimate R (or U) value of building envelop
systems based on infrared thermographic data. For example, many studies have investigated

34
using point-based or 2D IR imaging for R value estimation (Haralambopoulos and Paparsenos
1998; Fokaides and Kalogirou 2011; Dall’o’ et al. 2013; Nardi et al. 2014; Albatici and Tonelli
2010). Recent studies have also sought to use 3D thermographic methods for R value estimation
(Ham and Golparvar-Fard 2014; Ham and Golparvar-Fard 2015). Based on the location of data
collected, there are two ways of R/U-value that can be estimated. The first is to use only outdoor
surface temperature of exterior walls (Dall’o’ et al. 2013; Nardi et al. 2014; Albatici and Tonelli
2010, Haralambopoulos and Paparsenos 1998). The other way is to use indoor and outdoor
surface temperature of exterior walls (Ham and Golparvar-Fard 2014, 2015; Fokaides and
Kalogirou 2011).
To correctly calculate R-value using infrared thermographic data, rigorous calibration
and estimation of parameters such as emissivity are of critical importance. Considering a steady
state condition of heat transfer in building environments, thermal resistances (R-value) can be
described with the following Equation (4-7). In the Eq. 4,
𝑑𝑄
𝑑𝑡=
𝐴×|𝑇𝑎𝑖𝑟,𝑖𝑛− 𝑇𝑎𝑖𝑟,𝑜𝑢𝑡|
𝑅 (4)
where 𝑑𝑄
𝑑𝑡 is the overall heat transfer rate through the area of a building surface (Area)A is the
area of target building surface, R is the thermal resistance of the target area, and|𝑇𝑎𝑖𝑟,𝑖𝑛 −
𝑇𝑎𝑖𝑟,𝑜𝑢𝑡| is the temperature difference between the air temperature inside and outside the
building. The overall heat transfer (Q) in the building environment can be described as the
combination of thermal convection and radiation. Eq. 5 describes the thermal convection
𝑄𝑐𝑜𝑛𝑣𝑒𝑐𝑡𝑖𝑣𝑒 = 𝛼𝑐𝑜𝑛𝑣𝑒𝑐𝑡𝑖𝑣𝑒 × 𝐴 × |𝑇𝑎𝑖𝑟,𝑖𝑛 − 𝑇𝑤𝑎𝑙𝑙,𝑖𝑛| (5)
where 𝛼𝑐𝑜𝑛𝑣𝑒𝑐𝑡𝑖𝑣𝑒 is the convective heat transfer coefficient. It can be calculated according to the
Jurges’ equation shown as Eq. 6. The equation calculates 𝛼𝑐𝑜𝑛𝑣𝑒𝑐𝑡𝑖𝑣𝑒 based on the wind velocity
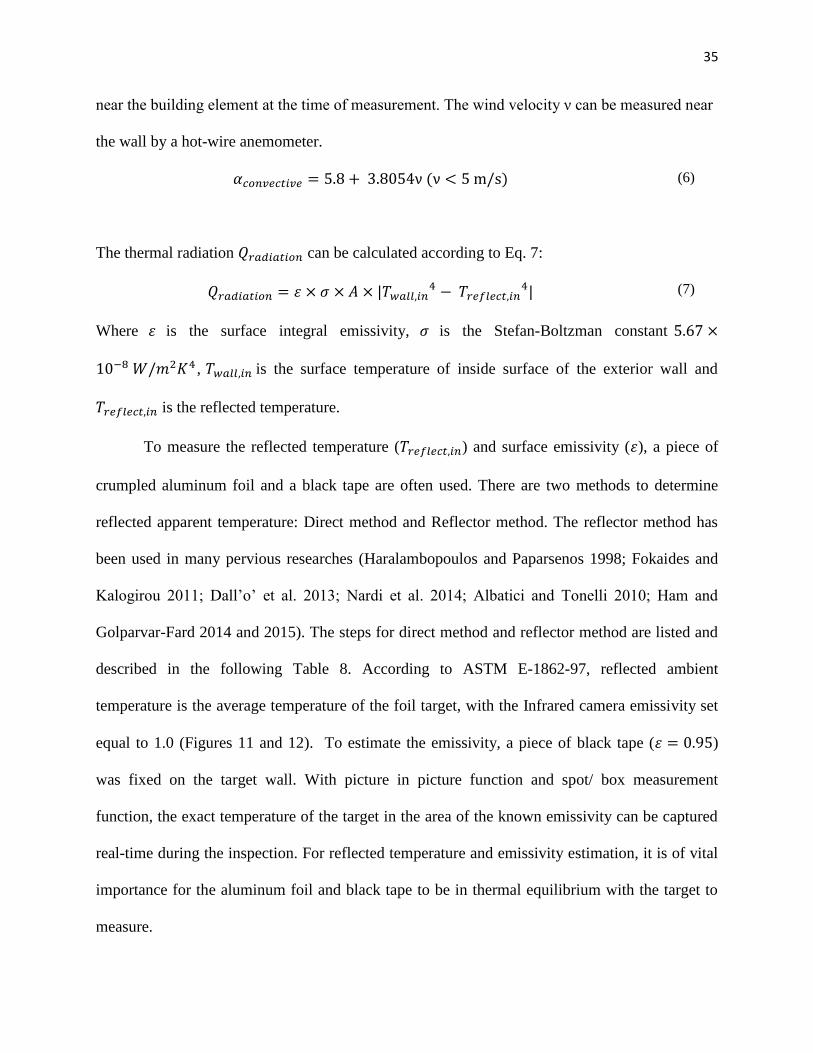
35
near the building element at the time of measurement. The wind velocity ν can be measured near
the wall by a hot-wire anemometer.
𝛼𝑐𝑜𝑛𝑣𝑒𝑐𝑡𝑖𝑣𝑒 = 5.8 + 3.8054ν (ν < 5 m/s) (6)
The thermal radiation 𝑄𝑟𝑎𝑑𝑖𝑎𝑡𝑖𝑜𝑛 can be calculated according to Eq. 7:
𝑄𝑟𝑎𝑑𝑖𝑎𝑡𝑖𝑜𝑛 = 𝜀 × 𝜎 × 𝐴 × |𝑇𝑤𝑎𝑙𝑙,𝑖𝑛4 − 𝑇𝑟𝑒𝑓𝑙𝑒𝑐𝑡,𝑖𝑛
4| (7)
Where 𝜀 is the surface integral emissivity, 𝜎 is the Stefan-Boltzman constant 5.67 ×
10−8 𝑊/𝑚2𝐾4 , 𝑇𝑤𝑎𝑙𝑙,𝑖𝑛 is the surface temperature of inside surface of the exterior wall and
𝑇𝑟𝑒𝑓𝑙𝑒𝑐𝑡,𝑖𝑛 is the reflected temperature.
To measure the reflected temperature (𝑇𝑟𝑒𝑓𝑙𝑒𝑐𝑡,𝑖𝑛) and surface emissivity (𝜀), a piece of
crumpled aluminum foil and a black tape are often used. There are two methods to determine
reflected apparent temperature: Direct method and Reflector method. The reflector method has
been used in many pervious researches (Haralambopoulos and Paparsenos 1998; Fokaides and
Kalogirou 2011; Dall’o’ et al. 2013; Nardi et al. 2014; Albatici and Tonelli 2010; Ham and
Golparvar-Fard 2014 and 2015). The steps for direct method and reflector method are listed and
described in the following Table 8. According to ASTM E-1862-97, reflected ambient
temperature is the average temperature of the foil target, with the Infrared camera emissivity set
equal to 1.0 (Figures 11 and 12). To estimate the emissivity, a piece of black tape (𝜀 = 0.95)
was fixed on the target wall. With picture in picture function and spot/ box measurement
function, the exact temperature of the target in the area of the known emissivity can be captured
real-time during the inspection. For reflected temperature and emissivity estimation, it is of vital
importance for the aluminum foil and black tape to be in thermal equilibrium with the target to
measure.

36
Table 8: Direct method and reflector method for apparent temperature estimation
Steps Direct Method Reflector Method
1 Look for possible reflection sources,
considering that the incident angle =
reflection angle.
Crumble up a large piece of aluminum foil and
uncrumble the aluminum foil to attach it to a
piece of cardboard of same size.
2 If the reflection source is a spot
source, modify the source by
obstructing it using a piece of
cardboard.
Put the piece of cardboard in front of the object
you want to measure, the side with aluminum
foil face the infrared camera.
3 Measure the radiation intensity (which
equals to apparent temperature) from
the reflecting source using the setting:
Emissivity = 1.0; Distance to Object =
0;
Set the emissivity to 1.0.
4 Measure the radiation intensity using
one of the methods show in Figure 10
(a)(b)
Measure the apparent temperature of the
aluminum foil and write down the result (Figure
10 (c) and Figure 11).
Note Using a thermocouple to measure the
reflected apparent temperature is not
recommended for two important
reasons:
A thermocouple does not
measure radiation intensity;
Method used by:
Haralambopoulos and Paparsenos
(1998)
Fokaides and Kalogirou (2011)
Dall’o’ et al. (2013)
Nardi et al. (2014)

37
A thermocouple requires a
good thermal contact to the
surface, usually by gluing and
covering the sensor by a
thermal isolator;
Albatici and Tonelli (2010)
Ham and Golparvar-Fard (2014 and
2015)
Figure 10: Ways to measure the radiation intensity
Figure 11: Measuring reflected temperature and emissivity

38
Table 9: Determining the emissivity of the target
Steps Determining the emissivity
1 Select a place to put the sample. Determine and set the reflected apparent
temperature according to the previous procedure (Table and Figure).
2 Put a piece of electrical tape with known high emissivity on the sample
3 Heat the sample as least 20K above room temperature. Heating must be reasonably
even.
4 Focus and auto-adjust the camera and freeze the image.
5 Adjust Level and Span for the best image brightness and contrast
6 Set emissivity to that of the tape (usually 0.97)
7 Measure the temperature of the tape using isotherm, spot or box avg measurement
functions.
8 Record the temperature and move your measurement function to the sample surface
9 Change the emissivity setting until you read the same temperature as recorded in
the previous measure step 8.
10 Record the emissivity.
Once 𝑄𝑟𝑎𝑑𝑖𝑎𝑡𝑖𝑜𝑛 and 𝑄𝑐𝑜𝑛𝑣𝑒𝑐𝑡𝑖𝑣𝑒 are calculated, R value can be calculated using the
following equation 8. It can be seen that most of the values involved in Equation 8can be
estimated using infrared thermography, temperature meter, and wind gauge.
𝑅 =|𝑇𝑎𝑖𝑟,𝑖𝑛− 𝑇𝑎𝑖𝑟,𝑜𝑢𝑡|
𝛼𝑐𝑜𝑛𝑣𝑒𝑐𝑡𝑖𝑣𝑒×|𝑇𝑎𝑖𝑟,𝑖𝑛− 𝑇𝑤𝑎𝑙𝑙,𝑖𝑛|+ 𝜀×𝜎×|𝑇𝑤𝑎𝑙𝑙,𝑖𝑛4− 𝑇𝑟𝑒𝑓𝑙𝑒𝑐𝑡,𝑖𝑛
4| (8)

39
2.4.3 Synthesis of Existing Studies
Thermal infrared imaging can detect and provide the visual displays of the amount of
infrared energy emitted, transmitted, and reflected by an object. As a useful tool, it has been used
for many professions since variations in emitted energy in the infrared spectrum provide
information concerning surface temperature and thermal properties of objects. In particular,
infrared thermography is well suited for detecting temperature abnormality caused by change of
material thermal property or the presence of latent moisture.
In the past few years, infrared thermography has emerged as a widely used method for
building inspection because of its potential for contributing to energy efficiency, occupant health
protection, occupant comfort, and green building development. Specifically, infrared
thermography has been successfully used for building material evaluation (Titman 2001,
Barreira and Freitas 2007; Meola 2007; Wyckhuyse and Maldague 2001; Forster 2007;
Maierhofer et al. 2003), detecting construction defects such as air infiltration, missing insulation,
and thermal bridges (Balaras and Argiriou 2002, Tony Colantonio 2007, Kalamees et al. 2008,
Bianchi et al. 2014; Wrobel and Kisilewcz 2008; Grinzato et al. 1998; Li et al. 2000), moisture
detection and mapping in building structures (Colantonio , Kominsky et al. 2007, Lerma et al.
2011, Gayo and De Frutos 1997; Grinzato et al. 1998; Jenkins et al. 1982; Ludwig et al. 2004;
Moropoulou et al. 2002; Tobiasson and Korhonen 1985; Wild et al. 1998, Kominsky et al.
2007), building energy diagnostics(Vavilov 2010, Ham and Golparvar-Fard 2014, Fokaides and
Kalogirou 2011), and pest detection in housing structures (Bruni 2004; Grossman 2005a;
Grossman 2005b). The advantage of infrared thermography over other building inspection
methods is mostly related to its ability of offering noncontact, non-destructive, and wide area

40
detection of subsurface defects which can be caused by moisture intrusion, construction quality,
and pest.
The effectiveness of infrared thermography can be further improved if reliable metrics of
measuring the extent of various defects can be developed as they allow quantitative assessment
of building performance or the quality of building construction. This has motivated extensive
studies on developing and validating different metrics that can be derived from infrared
thermography data. For example, Temperature Factor (TF) has been proposed and used to
measure the extent of thermal bridge (Heinrich and Dahlem 2000; Bianchi et al. 2014) and air
infiltration (Balaras and Argiriou 2002; Kalamees 2007; Heinrich and Dahlem 2000). Use of
infrared thermography scanning to estimate R or U value of building envelops is another
intriguing application and has attracted considerable attentions (Haralambopoulos and
Paparsenos 1998; Fokaides and Kalogirou 2011; Dall’o’ et al. 2013; Nardi et al. 2014; Albatici
and Tonelli 2010; Ham and Golparvar-Fard 2014 and 2015). Last but not the least, moisture
level has been used to diagnose moisture issues in buildings (Balaras and Argiriou 2002;
Kominsky et al. 2007), and insulation level has been proposed to evaluate missing insulation
problems (Balaras and Argiriou 2002).
Of particular interest is that the recently revised HERS standard (HERS 2006) also
provides detailed procedures for assessing insulation installation quality. According to the
standard, missing insulation can be classified into three grades including Grade I (Almost no
gaps), Grade II (Up to 2% missing), and Grade III (2%-5% missing). The Grade III for missing
insulation is designed as no more than 5% of the surface area of insulation missing is acceptable.
For an installation that is worse than Grade III, the procedure specifies that the inspector must
measure the insulated areas separately from the uninsulated areas and input them separately in

41
software (Harley 2005). In year 2010, RESNET adopted the guidelines for thermographic
inspections of buildings and published the standard “RESNET Interim Guidelines for
Thermographic Inspection of Buildings” (RESNET 2010). This standard provides guidance on
the use of infrared thermography for the inspection. In this standard, the definition of each
Grade is slightly adjusted to apply for the use of infrared thermography.
Despite the recent advance in standardizing infrared thermography based building
inspection, the effectiveness of infrared thermography still relies heavily on correct and rapid
interpretation of visual displays of thermal images. Correct and rapid interpretation of thermal
images requires considerable experience and can be assisted by a systems view of building
structures. For many building professionals, infrared thermography interpretation is a very
subjective process, and there are very few, if not none, software tools for automated
interpretation of thermal images. Furthermore, interpretation of thermal images often happens in
a context with limited geometric information on the building being investigated. As a result,
spatial patterns of surface temperature anomaly cannot be easily visualized to detect interrelated
building system defects. In many cases, accurate estimation of building defects and hazards often
requires multiple trips to carry out geometric survey of susceptible building areas (Alba et al.
2011; Laguela et al. 2012).
At the same time, reality capture technologies such as RGB-D cameras, Structure from
Motion (SFM), and laser scanners, have become main stream practices in interior and exterior
modeling. RGB-D cameras are novel sensing systems that can capture RGB images along with
per-pixel depth information. Originally developed for the purpose of gaming and human
computer interface, RGB-D cameras have also shown promises in mapping of small-scale
environments. Structure from Motion is the process of estimating three-dimensional structures

42
from 2D image sequences(Agarwal et al. 2011). Comparing to Structure from Motion, RGB-D
cameras allow the capture of reasonably accurate mid-resolution depth and appearance
information at high data rates and at a very low cost. Light Detection and Ranging (LiDAR) a
relatively new class of survey instrument that have been available on the market for about ten
years and has become a popular and increasingly used technology for providing as-built and
inventory data in building inspections. In principle, either of these reality capture technologies
can be combined with infrared thermography to produce 3D thermography data (Table 10).
Table 10: Current Building Point Cloud Generation Methods for 3D Thermal Building Model
RGB-D camera SFM Laser Scanner
Related
Studies
Vidas et al. 2013;
Weinmann et al.
2012;
Vidas and Moghadam
2013;
Golparvar-Fard and
Ham 2013;
Wang et al. 2012;
Costanzo et al. 2014;
Lagüela et al. 2012(a,b);
Demisse et al. 2015;
Alba et al. 2011;
Borrmann et al. 2012;
González-Aguilera et al. 2012
Infrared thermography analysis has become one of the most reliable tools for building
defects detection; however, the current IR inspection and assessment are primarily qualitative
and mainly rely on the energy auditor’s experience and knowledge. The identification and
interpretation of the hot spots or cold spots of numbers of unordered thermal images are time-
consuming and labor-intensive. Not to mention, without a proper benchmark or degree to judge
the quality of a building’s performance, the auditor’s subjective idea only may lead to an

43
inadequate refection of a building’s structure and energy performance. With reasons above, there
is a need of finding a way to level the condition of the building structure with all different types
of detects (e.g. moisture issue, insulation issue, thermal bridge, air leakage, R/U-value) and
building’s basic information gathered together for an integral building performance estimation.
Also, there is less research about the correlation between the defects inside the residential
building and how they impact the residents’ health and comfort in a systemic way. Starting from
pervious researches, this paper concerned using statistical methods to get a better understanding
of the effect of housing-related health and safety hazards on occupants’ health and the
relationship between building condition and human comfort.
Table 11 provides a quick summary of various studies in using infrared thermography for
building defect diagnosis. Various indicators have been used in these studies to quantify the
extent of building defects.
Table 11: A summary of infrared thermographic studies for building defect detection
Traditional 2D Infrared Building Envelope Inspection Variables
Moisture
Issue
Balaras, C. A., & Argiriou, A. A. (2002);
Kominsky, J. R., Luckino, J. S., & Martin, T. F. (2007).
Moisture Level
Thermal
Insulation
Problem
Balaras, C. A., & Argiriou, A. A. (2002). Insulation Level
Air leakages Balaras, C. A., & Argiriou, A. A. (2002);
Kalamees, T. (2007);
Heinrich, H., & Dahlem, K. (2000);
Temperature factor
for air leakage

44
Thermal
Bridge
Heinrich, H., & Dahlem, K. (2000);
Bianchi, F., Pisello, A. L., Baldinelli, G., & Asdrubali, F.
(2014)
Temperature factor
for thermal bridge
R-value or
U-value
Haralambopoulos and Paparsenos (1998)
Fokaides and Kalogirou (2011)
Dall’o’ et al. (2013)
Nardi et al. (2014)
Albatici and Tonelli (2010)
Ham and Golparvar-Fard (2014 and 2015)
Average R-value by
each apartment unit;
R-value by room;
It can be noted that many of the defects investigated in these studies have connections to
the hazards listed in the Healthy Home Rating System. More specifically, these connections are
described in Table 12.
Table 12: Connections between defects in building envelops and home hazards
Building Envelop Defects Connection to Home Hazards
Moisture Issue HHRS – Physiological: Dampness & Mold;
HHRS – Infection: Domestic Hygiene, Pests, and Refuse
Thermal Insulation Problem HHRS – Physiological: Excess Cold; Excess Heat
Air Infiltration HHRS – Physiological: Excess Cold; Excess Heat; Carbon
Monoxide; Volatile organic compounds
Thermal Bridge HHRS – Physiological: Excess Cold; Excess Heat
R-value or U-value HHRS – Physiological: Excess Cold; Excess Heat

45
2.4.4 Factors Affecting Validity of Infrared Thermography Results
Infrared thermography is a sophisticated technology which can be easily used incorrectly.
There are several major factors that could impact the validity of infrared thermography results.
First, environmental conditions including temperature differences between indoor and outdoor
environment, wind speed, high dew or rainy day, time of day, and reflection, can impact infrared
thermography results significantly. Table 13 listed detailed effects of various environmental
conditions on the validity of infrared thermography inspection results.
Table 13: Environmental conditions affecting the validity of infrared thermography
Environmental
Conditions
Effects on the Validity of Infrared Thermography Inspection Results
Temperature
Differences
between indoor
and outdoor air and
Season
Heat conducted through wall is related with the temperature differences
between external and internal wall. When indoor and outdoor
temperature difference is limited, defects area could not get enough
temperature differences to stand out from surrounding normal area, and
finally lead to a doubtful and inaccurate building diagnose result. To
keep the indoor environment in a comfort zone, the indoor temperature
will always stay around 75 F. As a result of this, a high temperature
differences between indoor and outdoor air will only occur during
summer (high outdoor temperature) and winter (low outdoor
temperature), which make summer and winter two best time for
infrared-based building inspection.
Wind Speed Convective heat losses depend on the wind velocity. High winds will

46
enhance heat transfer from the surface and higher convective heat losses
can reduce the surface temperature.
High dew or rainy
day
Water or ice on the surface of the envelope can mitigate temperature
variation and cause false reflection, so high dew, rain and snow should
be avoided during building inspection.
Time of day Defects beneath the surface usually have a different conduction rate and
react differently with surrounding area during the heating (morning) and
cooling (night) process. Usually, early morning inspections are best for
building inspection because too much sunlight may wreak havoc and
make feat refection on the building façade. Also, the inspection during
morning can assured the adequate temperature difference between indoor
and outdoor.
Reflection Refection from heat or cold source could create a false refection in the
infrared imaging.
It can be noted that the temperature difference between indoor and outdoor is another
important factor to consider as it is the power pushing heat flow through a building’s envelope
(wall or ceiling). Low Delta-temperatures lead to indiscernible thermal patterns. In general, when
there is larger temperature difference between indoor and outdoor environments, more accurate
thermography inspection results can be achieved. Due to this reason, summer and winter are
particularly suitable for infrared-based building inspection. Wind effects can also influence the
thermal imaging results by enhancing the heat transfer from the surface which leads to high
convective heat losses and reduces the temperature of structure surfaces. Rains and snows are

47
two common weather conditions that may occur during summer and winter. They can benefit or
impede infrared imaging based inspection. For example, infrared thermography should not be
applied immediately before or during rainy weather condition, while rain occurs one or two days
before the inspection is beneficial. Water migration in many buildings and roof leaks have short
resident times, therefore, there is always an optimum time window to detect leaks and moisture
problems in building envelops.
One of the most insidious limitations with infrared thermography is false reflection. Heat
signatures captured by an infrared camera could be the reflection of a warmer adjacent building,
surround trees or even the colder atmosphere. The reflections from these objects make it difficult
for operators to discern if the thermal pattern is from true surface reflection or it is just a false
reflection. This makes it challenging to locate true defects if they are masked by false reflection.
2.5 Conclusions
Extensive research effort has been devoted to using infrared thermography for detecting
defects and hazards in building systems. As a non-destructive and non-intrusive inspection
technology, it offers a compelling method to measure an array of hazard parameters related to
high performance building system and healthy homes. The potential of infrared thermography
methods for detecting home hazardous conditions has been further amplified with the rapid
development of data collection methods. The general outcomes from these improvements are
more data collected in less time, richer information, and automation in data interpretation.
Challenges remain in using the technology in an optimum setting and in data interpretation.
Future research on these directions would greatly benefit wider adoption of infrared
thermography technology, which will greatly reduce the cost of improving the performance
(energy efficiency and healthy homes) of a large number of existing building stocks.

48
Chapter 3
Spatially Resolved Infrared Imaging for Building Performance
Evaluation
3.1 Introduction
Understanding the interior workings of buildings has become an increasingly important
research topic as a growing population of people is living in urbanized environments. Building
deficiencies not only affect the energy performance but also the occupants and residents’ comfort
in a life-cycle. Despite the increasing attention has been paid to building performance, the
conventional process of building inspection and energy audit are time-consuming and requires
certain level of expertise and experience.
With the development of thermal infrared technologies, Infrared Thermography has been
increasingly used as a valuable tool for quick inspecting and performing non-destructive testing
for building elements, detecting where the building deficiencies are and monitoring how energy
is leaking from envelope. Problems that can be identified in a building through thermal infrared
imaging include cracks, lack of insulation, damage door and window seals, and the building-up
of moisture (Vidas and Moghadam 2013). Successful inspection may lead to addressing these
issues, along with achieving refinements in building design, which will ultimately improve
building environment and energy performance. However, due to the characteristic of 2D thermal
imaginings, the thermal data collected during building inspection are usually lack information in
geometry, location and orientation of objects and difficult to estimate precise dimension and
location the defects. Once combined with LiDAR data, 3D thermal model can be generated and
harnesses the advantages of both 2D thermal imaging and 3D point cloud. In a 3D thermal model

49
not only the building thermal defects can be visually detected and precisely located, the R-value
of the building envelope and heat losses can also be quantified give the availability of surface
measurements.
The proposed research explored the effectiveness of integration of infrared thermography
and spatial sensing methods for intelligent building hazard detection and evaluation. The
proposed research methodology involves several major components including design of data
collection protocols, data fusion and intelligent extraction of building hazard related attributes,
and field validation of proposed methods. The study was validated by surveying the health and
safety performance of two multi-family building in a densely populated city in the Northeastern
US., using this new appraisal method that integrate infrared thermography with 3D point cloud
data. The efficacy of integrated laser scanning and thermal imaging to determine housing-related
health and structure-related issue was assessed. It is important to note that the research results
reported in this study is part of a larger research effort aimed at developing quantitative
understanding on the correlation between the defects inside the residential building and how they
impact the residents’ health and comfort in a systemic way.
The paper starts with a review of relevant work followed by description of research
methodology used in this research. The research methodology includes design of data collection
protocols and fusion of thermographic and LiDAR data for intelligent hazard data extraction.
Field validations using two multi-story multi-family buildings are then described. Finally, the
paper presents result and discussion.
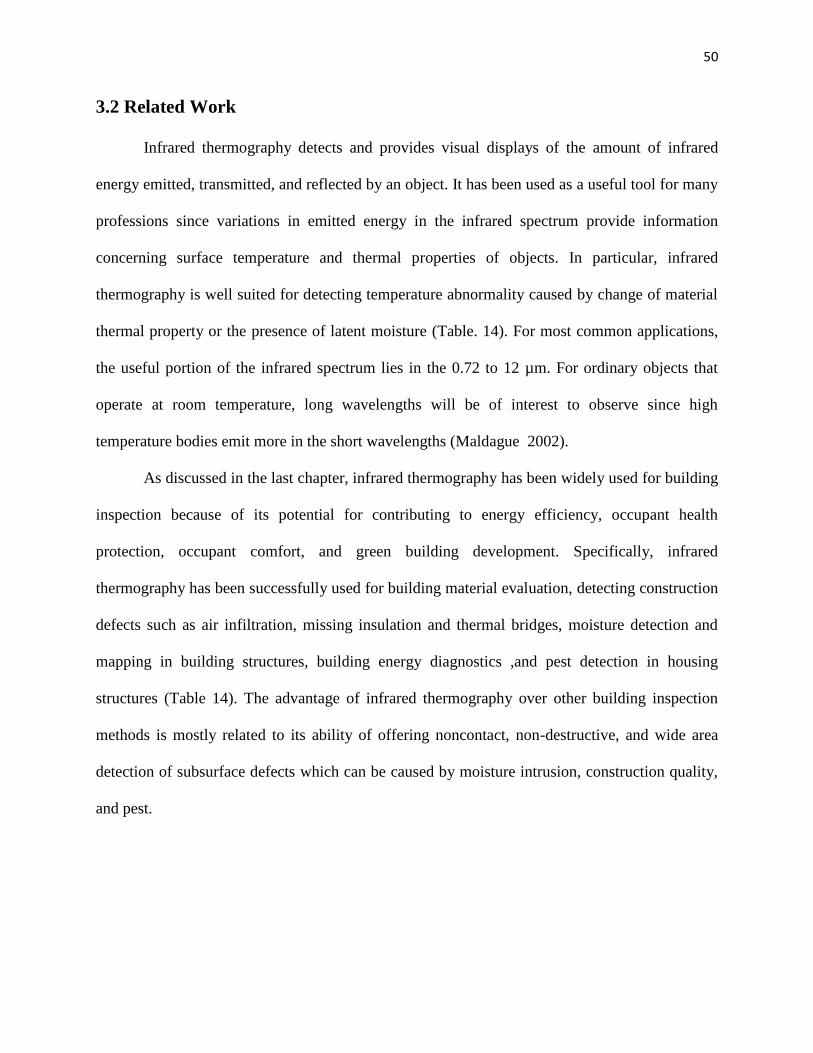
50
3.2 Related Work
Infrared thermography detects and provides visual displays of the amount of infrared
energy emitted, transmitted, and reflected by an object. It has been used as a useful tool for many
professions since variations in emitted energy in the infrared spectrum provide information
concerning surface temperature and thermal properties of objects. In particular, infrared
thermography is well suited for detecting temperature abnormality caused by change of material
thermal property or the presence of latent moisture (Table. 14). For most common applications,
the useful portion of the infrared spectrum lies in the 0.72 to 12 µm. For ordinary objects that
operate at room temperature, long wavelengths will be of interest to observe since high
temperature bodies emit more in the short wavelengths (Maldague 2002).
As discussed in the last chapter, infrared thermography has been widely used for building
inspection because of its potential for contributing to energy efficiency, occupant health
protection, occupant comfort, and green building development. Specifically, infrared
thermography has been successfully used for building material evaluation, detecting construction
defects such as air infiltration, missing insulation and thermal bridges, moisture detection and
mapping in building structures, building energy diagnostics ,and pest detection in housing
structures (Table 14). The advantage of infrared thermography over other building inspection
methods is mostly related to its ability of offering noncontact, non-destructive, and wide area
detection of subsurface defects which can be caused by moisture intrusion, construction quality,
and pest.

51
Table 14 : Application of Infrared Thermography for Building Diagnosis
Applications for Infrared
Thermography
Related Studies
building material
evaluation
Titman 2001;
Barreira and Freitas 2007;
Meola 2007;
Wyckhuyse and Maldague 2001;
Forster 2007;
Maierhofer et al. 2003
Detect construction defects Balaras and Argiriou 2002;
Tony Colantonio 2007;
Kalamees et al. 2008;
Bianchi et al. 2014;
Wrobel and Kisilewcz 2008;
Grinzato et al. 1998;
Li et al. 2000
moisture detection Colantonio ;
Kominsky et al. 2007;
Lerma et al. 2011;
Gayo and De Frutos 1997;
Grinzato et al. 1998;
Jenkins et al. 1982;

52
Ludwig et al. 2004;
Moropoulou et al. 2002;
Tobiasson and Korhonen 1985;
Wild et al. 1998;
Kominsky et al. 2007;
building energy diagnostics Vavilov 2010;
Ham and Golparvar-Fard 2014;
Fokaides and Kalogirou 2011;
pest detection Bruni 2004;
Grossman 2005a;
Grossman 2005b
The effectiveness of infrared thermography can be further improved if reliable metrics of
measuring the extent of various defects can be developed as they allow quantitative assessment
of building performance or the quality of building construction. This has motivated extensive
studies on developing and validating different metrics that can be derived from infrared
thermography data (Table 15). For example, Temperature Factor (TF) has been proposed and
used to measure the extent of thermal bridge (Heinrich and Dahlem 2000; Bianchi et al. 2014)
and air infiltration (Balaras and Argiriou 2002; Kalamees 2007; Heinrich and Dahlem 2000).
Use of infrared thermography scanning to estimate R or U value of building envelops is another
intriguing application and has attracted considerable attentions (Haralambopoulos and
Paparsenos 1998; Fokaides and Kalogirou 2011; Dall’o’ et al. 2013; Nardi et al. 2014; Albatici
and Tonelli 2010; Ham and Golparvar-Fard 2014 and 2015). Last but not the least, moisture

53
level has been used to diagnose moisture issues in buildings (Balaras and Argiriou 2002;
Kominsky et al. 2007), and insulation level has been proposed to evaluate missing insulation
problems (Balaras and Argiriou 2002).
Of particular interest is that the recently revised HERS standard (HERS 2006) also
provides detailed procedures for assessing insulation installation quality. According to the
standard, missing insulation can be classified into three grades including Grade I (Almost no
gaps), Grade II (Up to 2% missing), and Grade III (2%-5% missing). The Grade III for missing
insulation is designed as no more than 5% of the surface area of insulation missing is acceptable.
For an installation that is worse than Grade III, the procedure specifies that the inspector must
measure the insulated areas separately from the uninsulated areas and input them separately in
software (Harley 2005). In year 2010, RESNET adopted the guidelines for thermographic
inspections of buildings and published the standard “RESNET Interim Guidelines for
Thermographic Inspection of Buildings” (RESNET 2010). This standard provides guidance on
the use of infrared thermography for the inspection. In this standard, the definition of each
Grade is slightly adjusted to apply for the use of infrared thermography.
Despite the recent advance in standardizing infrared thermography based building
inspection, the effectiveness of infrared thermography still relies heavily on correct and rapid
interpretation of visual displays of thermal images. Correct and rapid interpretation of thermal
images requires considerable experience and can be assisted by a systems view of building
structures. For many building professionals, infrared thermography interpretation is a very
subjective process, and there are very few, if not none, software tools for automated
interpretation of thermal images. Furthermore, interpretation of thermal images often happens in
a context with limited geometric information on the building being investigated. As a result,

54
spatial patterns of surface temperature anomaly cannot be easily visualized to detect interrelated
building system defects. In many cases, accurate estimation of building defects and hazards often
requires multiple trips to carry out geometric survey of susceptible building areas
At the same time, reality capture technologies such as RGB-D cameras, Structure from
Motion (SFM), and laser scanners, have become main stream practices in interior and exterior
modeling. Light Detection and Ranging (LiDAR) as a relatively new class of survey instrument
has been increasingly used for providing as-built and inventory data in building inspections. In
principle, 3D thermography data can be generated once these reality capture technologies are
combined with infrared thermography.
Though Infrared thermography analysis has become one of the most reliable tools for
building defects detection, the current IR inspection and assessment are primarily qualitative and
mainly rely on the energy auditor’s experience and knowledge. The identification and
interpretation of the hot spots or cold spots of numbers of unordered thermal images are usually
time-consuming and labor-intensive. Not to mention, without a proper benchmark or degree to
judge the quality of a building’s performance, the auditor’s subjective idea only may lead to an
inadequate refection of a building’s structure and energy performance. With reasons above, there
is a need of finding a way to level the condition of the building structure with all different types
of detects (e.g. moisture issue, insulation issue, thermal bridge, air leakage, R/U-value) and
building’s basic information gathered together for an integral building performance estimation.
Also, there is less research about the correlation between the defects inside the residential
building and how they impact the residents’ health and comfort in a systemic way. Starting from
pervious researches, this paper concerned using statistical methods to get a better understanding

55
of the effect of housing-related health and safety hazards on occupants’ health and the
relationship between building condition and human comfort.
3.3 Research Methodology
The proposed research explored the effectiveness of integration of infrared thermography
and spatial sensing methods for intelligent building hazard detection and evaluation. The
proposed research methodology involves several major components including design of data
collection protocols, data fusion and intelligent extraction of building hazard related attributes,
and field validation of proposed methods. It is important to note that the research results reported
in this study is part of a larger research effort aimed at developing quantitative understanding on
the correlation between the defects inside the residential building and how they impact the
residents’ health and comfort in a systemic way (Figure 12).
Figure 12: An integrated approach for housing-related hazard detection and management

56
3.3.1 Design of Data Collection Protocols
To understand how infrared thermography and its variants can be used for detecting
building hazards, in particular those impacting occupants’ health, it is imperative to draw
connections between what can be measured from infrared thermography and what are considered
as hazards to healthy homes. As a century-old concept, “Healthy Homes”, promotes a safe,
decent, and sanitary housing for preventing disease and injury, has got increasing attention
nationally. HUD’s Healthy Home Rating System (HHRS) was developed based upon the
successful Housing Health and Safety Rating System (HHSRS), which can address key issues
affecting health and safety due to conditions in the home, provides analysis of how hazardous a
dwelling is and provides evidence and statistical information to assist assessors in making
judgments. The HHRS provides a method of grading the severity of threats to health and safety
in any dwelling, from house, self-contained flat/apartment, non-self-contained flat/apartment, a
room rented within a dwelling or house, to a room in a university hall or similar residential
building and the means of access and shared or common rooms and facilities. There are 29
summarized hazards listed in the HHRS Hazards Summary Chart across four categories
including Physiological, Psychological, Infection, and Safety (Table 15) (HUD, The Healthy
Homes Program Guidance Manual 2012).
Table 15: Healthy Home Rating System (HHRS) – Categorization of 29 Hazards
Physiological Psychological Infection Safety
1. Dampness
& Mold
2. Excess Cold
11. Crowding
and Space
12. Entry by
15. Domestic
Hygiene,
Pests, and
19. Falls in bath etc.
20. Falls on the level
21. Falls on stairs etc.

57
3. Excess Heat
4. Asbestos
and
manmade
fibers
5. Biocides
6. Carbon
Monoxide
7. Lead-based
paint
8. Radiation
9. Un-
combusted
fuel
10. Volatile
organic
compounds
Intruders
13. Lighting
14. Noise
Refuse
16. Food
Safety
17. Personal
Hygiene
18. Water
Supply
22. Falls from windows
etc.
23. Electrical hazards
24. Fire hazards
25. Hot surfaces etc.
26. Collision/Entrapment
27. Ergonomics
28. Explosions
29. Structural collapse
A close examination of the above table and the capabilities of infrared thermography as
reviewed in the Relevant Work section suggest several connections. These connections are
summarized in Table 16. These detectable defects are quantified using metrics proposed by
previous studies and building rating standards. In summary, a list of data to be collected or

58
computed is provided in Table 17. We assume the subjects of interest in this research are
apartments in multi-story buildings.
Table 16: Connections between defects in building envelops and home hazards
Detectable Building Defects Connection to Home Hazards
Moisture Issue HHRS – Physiological: Dampness & Mold;
HHRS – Infection: Domestic Hygiene, Pests, and Refuse
Thermal Insulation Problem HHRS – Physiological: Excess Cold; Excess Heat
Air Infiltration HHRS – Physiological: Excess Cold; Excess Heat; Carbon
Monoxide; Volatile organic compounds
Thermal Bridge HHRS – Physiological: Excess Cold; Excess Heat
R-value or U-value HHRS – Physiological: Excess Cold; Excess Heat
Table 17: Data attribute list
Attribute Type Variables Description Value/ Unit
Apartment
Location
Information
Floor The floor number of the
apartment unit and the total
floor number
(Number 1)/(Number
2)
Number 1: apartment
floor number
Number 2: total floor
number
Corner Describe the location of the
apartment unit
1: in the corner
0: other

59
Inner Garden Describe the location of the
apartment unit
1: face the inner garden
0: other
Thermal
Comfort
Real-time
indoor air
temperature
Describe the average indoor air
temperature taken from
moisture meter during data
collection
Unit: °F
Real-time
indoor air
relative
humidity
Describe the average indoor air
relative humidity taken from
moisture meter during data
collection
Unit: %
Real-time
thermal comfort
level
Real-time thermal comfort
level calculated from
ASHRAE Comfort Zone
1: for in the cold area
of comfort zone (Left
side of the Comfort
Zone)
2: for in the comfort
zone (Inside of the
Comfort Zone)
3: for in the hot area of
comfort zone (Right
side of the comfort
Zone)
Dew Point Dew point temperature
estimated from real-time
Unit: °F

60
average temperature and
relative humidity
Thermal
Infrared and
Scan Data
Temperature
Factor -
Thermal Bridge
The temperature factor of
thermal bridge area.
Unit: NA
Higher value stands for
better condition
Temperature
Factor- Air
Leakage
The temperature factor of air
leakage area
Unit: NA
Higher value stands for
better condition
Missing or poor
insulation area
Describe the area missing or
poor insulation in square feet
Unit: Square Feet
Missing or poor
insulation
percentage
Describe the percentage of the
area missing or poor insulation
out of the whole exterior wall
of the apartment.
Unit: %
Insulation
Grading
The insulation grading
calculated based on the
Insulation Grading Standard
designed by RESNET.
Insulation Grading
Standards designed by
RESNET
Grade I: not infrared
detectable anomalies;
Grade II: insulation
installed with
anomalies found to be
between 0.5 % and 2%

61
for all inspected walls
Grade III: An
insulation installation
having between 2% to
5% anomalies found
for all inspected walls
Worse than Grade III:
The condition that
insulation installation
having more than 5%
of the anomalies found
for all the inspected
walls
Insulation Level Describe the insulation level of
the apartment unit when the
temperature differences do not
meet the requirement for
RESNET Standard.
1: good condition
2: fair condition
3: poor condition
Average R-
value
The minimum R-value of the
exterior wall area in one room
in the apartment unit
Unit: W/m2K
Hot Water Riser
poor insulated
Whether or not the apartment
has hot water riser poor
1: Yes
0: No

62
insulated in the apartment
In Table 17 the temperature factor 𝑓𝑅𝑠𝑖 at the internal surface shows the relation of the
total thermal resistance of the building envelope (𝑅𝑇 , (m2 ∙ K)/W) to the thermal resistance of
the building envelope without the internal surface resistance (𝑅𝑠𝑖 , (m2 ∙ K)/W) and can be
calculated with measured internal surface temperature (𝑇𝑠,𝑖𝑛, °C), indoor temperature (𝑇𝑖𝑛, °C)
and outdoor temperature (𝑇𝑜𝑢𝑡, °C) according to following Equation 8 (Hugo 2012, Kalamees
2007)
𝑅𝑇 − 𝑅𝑠𝑖
𝑅𝑇= 𝑓𝑅𝑠𝑖
= 𝑇𝑠,𝑖𝑛 − 𝑇𝑜𝑢𝑡
𝑇𝑖𝑛 − 𝑇𝑜𝑢𝑡
(8)
For the temperature factor, several limit values or guidelines have been set. The following table
18 lists the guidelines for temperature factor for thermal bridge on wall base on the Finnish
instructions regarding housing health (Asumisterveysohje 2003).
Table 18: Guidelines for the temperature factor for thermal bridge on wall
Temperature Factor Range Description
𝑓𝑅𝑠𝑖<0.61 Includes healthy risks or hazards and should be repaired
𝑓𝑅𝑠𝑖 0.61 ~ 0.64 Possibility for health hazards or structure risks, the
details/structure must be checked and repairing necessity should
be classified
𝑓𝑅𝑠𝑖 0.65 ~0.69 Includes obvious hydrothermal defects or faults but fulfils the
requirements of the housing health

63
𝑓𝑅𝑠𝑖 0.70 ~0.74 Fulfils of the requirements of the good level, no risks in
dwellings with low occupancy
𝑓𝑅𝑠𝑖 0.75 ~0.80 Includes some risk in dwellings with high occupancy and low
occupancy
𝑓𝑅𝑠𝑖 over 0.81 Tolerable level
The R-value in Table 18 is estimated using Eq. (9). Its principle is that the overall heat transfer
(Q) in the building environment can be described as the combination of thermal convection and
radiation.
𝑅 =|𝑇𝑎𝑖𝑟,𝑖𝑛− 𝑇𝑎𝑖𝑟,𝑜𝑢𝑡|
𝛼𝑐𝑜𝑛𝑣𝑒𝑐𝑡𝑖𝑣𝑒×|𝑇𝑎𝑖𝑟,𝑖𝑛− 𝑇𝑤𝑎𝑙𝑙,𝑖𝑛|+ 𝜀×𝜎×|𝑇𝑤𝑎𝑙𝑙,𝑖𝑛4− 𝑇𝑟𝑒𝑓𝑙𝑒𝑐𝑡,𝑖𝑛
4| (9)
where 𝜀 is the surface integral emissivity, 𝜎 is the Stefan-Boltzman constant5.67 ×
10−8 𝑊/𝑚2𝐾4, 𝑇𝑤𝑎𝑙𝑙,𝑖𝑛 is the surface temperature of inside surface of the exterior wall and
𝑇𝑟𝑒𝑓𝑙𝑒𝑐𝑡,𝑖𝑛 is the reflected temperature.
3.3.2 Fusion of thermographic and LiDAR data and Intelligent Hazard Data Extraction
Figure 13 shows the detailed workflow for producing 3D thermographic data. Table 19 provides
further explanation of the steps shown in Figure 13.

64
Figure 13: 3D thermal model generation and anomalies detection
Table 19: 3D thermal model generation process and description
Steps Description
Infrared Scanning Infrared data (images or videos) collection through infrared camera.
Terrestrial Laser
Scanning
Collect raw terrestrial laser scans through laser scanner.
Infrared Image
Processing
Read raw infrared images with FLIR SDK and transfer images to
temperature matrix for temperature rescale and color palette
modification.
Terrestrial Laser Scan Register raw terrestrial laser scans into one point cloud file.

65
Registration
Output 3D Point
Clouds
Transfer the registration result to 3d point clouds.
Infrared Image
Panorama
Automatic infrared images stitching for the infrared images with
overlaps.
Infrared Panorama
Temperature-based
Segmentation
Automatic infrared panorama segmentation to segment areas with
different temperature into pieces.
Infrared Panorama
Projection
Project infrared panorama on the point cloud to generate a 3D point
cloud with temperature information.
Infrared Panorama
Segmentation
Projection
Project infrared segmentation result on the point cloud to generate a 3D
point cloud with segmentation information.
Infrared Scanning: In this research, the collected infrared data are images and videos. Infrared
images taken through FLIR infrared camera are special .jpg format images that not only have
color information but also temperature information for each point in the image. There are two
types of videos that can be collected by an infrared camera: (1) color only video (2) video with
pixel temperature information.
Terrestrial Laser Scanning: We used the FARO laser scanners for raw data collection. To
provide sufficient 3d information of the building, one or more scans were collected per room
(Figure 14).

66
Figure 14: 3D view of scanned living room and bathroom
Infrared Image Processing: This step involves converting infrared image data into data matrix
that preserve temperature information (Figure 15).
(a) (b) (c)
Figure 15: Same infrared image with different temperature scale and its temperature in matrix
(a: 23.2°F ~ 40.4°F; b: 31.8°F ~ 40.87°F)
Terrestrial Laser Scan Registration and output 3D point clouds: In this step, scan data are
registered and converted into a common point cloud format.
Infrared Image Stitching (Panorama): This step involves stitching infrared images into a
panoramic image that can later be used to project to point cloud data. The steps for RGB image
stitching include: (1) Feature Detection: identify image features (2) Feature Description: extract

67
feature descriptor for each feature (3) Feature Matching: find candidate matches between
features (4) Feature Correspondence: find consistent set of (inlier) correspondences between
features.
RGB image stitching usually have the problem with color correction and matching ( Tian
et al. 2002, Doutre and Nasiopoulos 2009, Xiong and Pulli 2009), while, infrared images do
not have this problem because the temperature of the same location usually stays constant during
the inspection. Infrared images of the same location usually can be easily adjusted to the same
color and can have a good match with each other even without color correction and matching.
However, as shown in the infrared image processing step, infrared images may loss texture and
pattern information with different temperature scales and temperature palettes. This could lead to
the difficulty to detect image features useful for image stitching (Figure 16).
Figure 16: The effect of temperature scale and color palette on infrared images

68
Figure 17: Feature points detected in three infrared images
To address this issue, our approach tries different temperature scales and finds the best
result in terms of number of feature points, matched points, and inliers. Once the transformation
between images with highest inliers was calculated, these images can be combined to form a
panoramic image which can be transferred to any color scale and color palette with a fixed
transformation (Figure 17).
Figure 18: Matched SURF points, including outliers
Table 20: The effect of temperature scale on the number of inliner points
Temperature
Scale
80°F ~100 °F
Temperature
Scale
80°F ~110 °F
Temperature
Scale
90°F ~110 °F
Inlier Points between First and
Second Image
30 34 36
Inlier Points between Second
and Third Image
77 48 51

69
The same approach can also be applied to indoor infrared images although interior
infrared images usually have fewer feature points and inlier points. Figure 19 shows an example
of combining several interior infrared images.
Figure 19: Automatic indoor infrared image stitching result
Infrared Temperature-based Segmentation: In this step, the result of temperature based
segmentation and threshold based segmentation is compared (Figure 20 and Figure 21).
Although several recent studies have used threshold methods to locate cold and hot spots in
infrared images (Vidas et al. 2013, Ham and Golparvar-Fard 2014), temperature based
segmentation can isolate the areas with different temperature easily and lead to a better result. In
this research, we applied the temperature based segmentation to both single infrared image and
panoramic images. The results are shown in Figure 22.

70
Figure 20: Infrared image and segmentation result
Figure 21: Infrared images with cold alarm
(blue area means temperature lower than threshold value)
Figure 22: Indoor infrared image stitching and segmentation results

71
Infrared and Infrared Segmentation Project to 3D Point Cloud: In this step, infrared images
and their temperature segmentation results are projected to the 3D point cloud. The principle
behind the projection is to identify common points in both infrared images and point cloud data
and compute the transformation between infrared images and point cloud data. Figures 23 and 24
show 3D thermal models of one building and an apartment as the result of data projection.
Furthermore, if the infrared images are already segmented, this projection will lead to quick
quantification of the size of different temperature areas (Figure 25).
Figure 23: 3D thermal model of building exterior area

72
Figure 24: Raw data and 3D thermal point cloud
(a)Infrared thermography and digital images, (b) LiDAR point cloud, (c) 3D thermal point cloud
Figure 25: 3D thermal model and their paired 3D temperature-segmentation model
Point Cloud Segmentation: The 3D thermography data analysis process can be further
facilitated by conducting segmentation of indoor scan data. The purpose is to divide scan data
into subsets corresponding to different structural elements. One segmentation method that can be
utilized is ransac based segmentation method. Figure 26 shows the segmentation results for one

73
sample living room. It can be seen that all the structure elements and furniture are clearly
segmented and marked out with different color.
Figure 26: 3D thermal model and segmented 3D point cloud
Based on the segmented 3D thermal model, all the attributes that are relevant to building
performances can be calculated and estimated. Table 21 lists all the data attributes collected from
infrared data and 3D thermal data in this research.
Table 21: List of data attributes collected from 3D infrared thermographic data
Attribute
Type
Variables Description Attribute Collection
Apartment
Location
Information
Floor The floor number of
the apartment unit and
the total floor number
of the building.
The floor number is collected base on
the room number. For example,
apartment 6E is located on 6th
floor.
The total floor number can be used to
know if one apartment is located on the
top floor of the building.

74
Corner Describe the location
of the apartment unit
This information is collected from
floor chart.
Orientation Describe the location
of the apartment unit
This information is collected from
floor chart.
Thermal
Comfort
Real-time
indoor air
temperature
Describe the average
indoor air temperature
taken from moisture
meter during data
collection
In each apartment, temperature data
were collected by room from moisture
meter during inspection. (Usually 8-20
values per apartment.)
Real-time
indoor air
relative
humidity
Describe the average
indoor air relative
humidity taken from
moisture meter during
data collection
Relative humidity data is collected
from moisture meter by room during
inspection. (Usually 8-20 values per
apartment.)
Real-time
thermal
comfort
level
Real-time thermal
comfort level
calculated from
ASHRAE Comfort
Zone
Real-time thermal comfort level
calculated from ASHRAE Comfort
Zone base on the indoor temperature
and relative humidity data. When the
value is locate in the comfort zone
chart, the apartment will be marked
with “Comfort”. When the value is
locate in the left side of comfort zone,
the apartment will be marked with

75
“Cold”. Right side will be marked as
“Hot”.
Dew Point Dew point temperature
estimated from real-
time average
temperature and
relative humidity
Dew point temperature estimated from
real-time average indoor temperature
and relative humidity. Dew point value
can be used to locate potential moisture
issue.
Thermal
Infrared and
Scan Data
Temperature
Factor-
Thermal
Bridge
The temperature factor
for thermal bridge area
Measure the temperature factor for
thermal bridge base on infrared data.
Temperature
Factor- Air
Leakage
The temperature factor
for air leakage area
Measure the temperature factor for air
leakage area base on infrared data.
Missing or
poor
insulation
area
Describe the area
missing or poor
insulation in square
feet
Measure the area missing or poor
insulation in square feet base on the 3d
thermal data.
Missing or
poor
insulation
percentage
Describe the
percentage of the area
missing or poor
insulation out of the
whole exterior wall
Calculate the percentage of the area
missing or poor insulation out of the
whole exterior wall base on 3d thermal
data.

76
Insulation
Level
Describe the insulation
level of the apartment
unit
Describe the insulation level of the
apartment unit.
Average R-
value
The average R-value
of the exterior wall
area in the apartment
unit
Measure the average R-value of the
exterior wall area in the apartment unit
base on 3d thermal data and real-time
environmental data.
Hot Water
Riser
Overheating
Whether or not the
apartment has hot
water riser detectable
by infrared camera.
Whether or not the apartment have hot
water riser that detectable by infrared
camera with temperature difference
over 5 F with surrounding wall.

77
3.4 Field Validation
The proposed methods in this study are validated with two multi-family apartment
buildings in Northeastern US. Building 1 was a historic building that transformed from an
abandoned hospital built in 1926. Building 2 is one of the largest multi-family, Energy Star
certified building. The building 2 was opened in 2009.
3.4.1 Data Collection Protocols
In this research, one infrared camera (FLIR T650sc) and one digital camera were used for
data collection. The specification of T650sc camera is shown in the Table 22. The terrestrial
laser scanner used to provide 3D data is a Faro Focus 3D scanner. The specification of the
scanner is listed in Table 23.
Table 22: Specification for FLIR T650sc
Characteristics Specifications
Thermal Imaging
Performance
Field of View/min. focus
distance
Spatial Resolution (IFOV)
Thermal Sensitivity
Image Frequency
Focus
Detector Type
Spectral Range
25º x 19º / 0.25m
0.68 mrad
<20 mK @ 30 °C
30 Hz
Continuous, one shot or manual
Focal Plane Array (FPA), Uncooled microbolometer 640x480
pixels
7.5 to 14 µm

78
Measurement
Temperature Range
Accuracy
Measurement Analysis
-40 °C to +150 °C
+100 °C to +650 °C
+300 °C to +2,000 °C
± 1 °C or ± 1% of reading
Area; Line Profile; Automatic hot/cold detection; Isotherm;
Image Storage
Type
File Formats
IR/visual images; simultaneous storage of visual and IR
images
Standard JPEG - including measurement data on memory card
Battery System Lithium-Ion (field replaceable)
Environmental Specifications
Operating Temperature Range
Storage Temperature Range
-15 to +50 °C
-40 °C to +70 °C
Data Communication
Interfaces
USB-mini, USB-A, Bluetooth, Wi-Fi, Digital Video Output
Table 23: The specification of Faro Focus 3D Scanner
Characteristics Specifications
Ranging Unit
Unambiguity interval
Range Focus 3DS 120
153.29 m (503.57ft)
0.6m- 120m indoor or outdoor with low ambient light and

79
Range Focus 3dS 20
Measurement Speed(Pts/Sec)
Ranging error
normal incident to a 90% reflective surface
0.6m – 20m at normal incidence on >10% matte reflective
surface
122,000/244,000/488,000/976,000
±2mm at 10m and 25m, each at 90% and 10% reflectivity
Colour Unit
Resolution:
Dynamic colour feature
Up to 70 megapixel colour
Automatic adaption of brightness
Deflection Unit
Field of view
(vertical/horizontal)
Step Size (vertical/horizontal)
Max. Vertical Scan Speed
300°/360°
0.009° (40,960 3D-Pixel on 360°) / 0.009° (40,960 3D-Pixel
on 360°)
5,820 rpm or 97 Hz
Laser (optical transmitter)
Laser power (cw Ø)
Wavelength
Beam divergence
Beam diameter at exit
20mW (Laser class 3R)
905nm
Typical 0.19 mrad (0.011°)
Typical 3.0 mm, circular
Data Handling and Control
Data storage
Scanner control
New WiFi (WLAN) access
SD, SDHCTM, SDXCTM; 32GB card included
Via touchscreen display and WiFi
Remote control, Scan Visualisation and download are
possible on mobile devices with Flash

80
Multi-Sensor
Dual axis compensator
Height sensor
Compass
Levels each scan; Accuracy 0.015°; Range ± 5°
Via an electronic barometer the height relative to a fixed
point can be detected and added to ascan. The electronic
compass gives the scan an orientation. A calibration feature
is included.
To record environmental condition data, one moisture meter and one wind speed meter
were used in this research. In this research, the moisture meter is used to provide data, including
the outdoor ambient air temperature, indoor ambient air temperature, relative humidity of
ambient air, and the relative humidity of building structures with possible moisture issues
detected by infrared camera. The specification of the FLIR MR77 is listed in the following Table
24.
Table 24: Specification for FLIR MR77
Technical Summary Range Basic Accuracy
Pinless Moisture 0-99.9 Relative
Pinless Moisture Depth Max 0.75 inch (19mm) -
Pin Moisture 0 to 99% WME -
Relative Humidity 0 to 99% RH ± 2.5% RH
Sensor Temperautre -19 to 170 °F, -28 to 77 °C ± 3.5 °F, 2 °C
IR Temperature -4 to 392 F, -20 to 200 °C ± 3.5%
IR Distance to Spot Ratio 8 inches away: 1 inch spot size -

81
IR Emissivity 0.95 (fixed) -
Vapor Pressure 0 to 20.0 kPa ± 2%
Other Data Sources: In order to get real-time environmental data during data collection and one
or two days before data collection, weather data from the closest weather station was
downloaded to provide necessary weather information. The distance between two buildings and
weather station are all within 2 miles. The following table displays the weather parameters
captured from the weather station.
Table 25: Weather data from weather station
Environmental Factor Factor Type Units
Weather Condition Daily NA
Rain in Past Two Days Daily NA
Outside Temperature Range Daily °F
Real-time Outside Temperature Real-time °F
Outside Humidity Range Daily %
Daily Average Outside Humidity Daily %
Real-time Outside Humidity Real-time %
Average Wind Speed Daily Mph
Real-time Wind Speed Real-time Mph

82
3.4.2 Field Data Collection
Six data collection trips to Building 1were made during summer season from 6/30/2014 to
8/15/2014 to collect data on 15 apartment units. Four data collection trips to Building 2 were
made during winter season from 3/14/2015 to 3/20/2015 to collect data on 16 apartment units.
Data collected include infrared images, terrestrial LiDAR data, digital images, indoor humidity
and temperature, interview data, indoor air quality data and real-time weather data from nearby
weather station.
Table 26: Data sheet for building 1
Data Type Equipment/ Data Source Data Collected
Infrared Imaging Infrared Camera: FLIR T650sc 500+ images
LiDAR Data LiDAR Scanner: Faro Laser Scanner 300+ scans
Digital Image Digital Camera: Sony NEX5r 1000+ digital images
Humidity and Temperature Moisture Meter: FLIR MR77 100+ data
Wind Speed Wind Speed Meter: Mastech MS6352A 15 units
Real-time Weather Data From Weather Station 15 units
Table 27: Data sheet for building 2
Data Type Equipment/Data Source Data Collected
Infrared Imaging Infrared Camera: FLIR T650sc 500+ images
LiDAR Data LiDAR Scanner: Faro Laser Scanner 300+ scans
Digital Image Digital Camera: Sony NEX5r 1000+ digital images
Humidity and Temperature Moisture Meter: FLIR MR77 100+ data

83
Wind Speed Wind Speed Meter: Mastech MS6252A 16 units
Real-time Weather Data From Weather Station 16 units
During post-processing, all the data are grouped into three categories: (1) Exterior Area; (2)
Common Area; and (3) Apartments.
(1) Exterior Area Data Collection
LiDAR data, infrared data, digital images that cover the whole exterior part of the building were
collected. This includes exterior walls and roofs. Figure 27 (a) is the point cloud after scan
registration. Figure (b) is the exterior wall of the building; the thermal image shows the heat loss
at floor slabs. Figure (c) is the digital image taken for the exterior wall area with possible Air
Conditioner water leakage issue. Figure (d) is the example of temperature and humidity data
collection on site during inspection.

84
Figure 27: Exterior area data collection
(2) Common Area Data Collection
In building 1, common areas are basement, corridor, electrical room, fire pump room, gas
meter room, head start room, commercial kitchen, laundry room, and stairs and telephone
equipment room. In building 2, common areas include boiler room, corridor, electrical room,
cellar garage, janitors closet, laundry, mechanical room, recycle room, and stairs and
telephone communication room. Figure 28 shows the example of different types of collected
data. Figure (a) is the raw scan data taken in head-start room. Figure (b) is infrared image of
laundry room showing water leakage inside of the wall. Figure (c) is the digital image taken

85
in the head-start room. Figure (d) is the example of temperature and humidity data collection
in the corridor during inspection. During post-analysis these temperature and humidity data
are extracted and input into excel.
Figure 28: Common area data collection: (a) The raw scan data taken in head-start room; (b)
Infrared image of laundry room showing water leakage inside of the wall; (c) Digital images
taken in the head-start room; and (d) Examples of temperature and humidity data collection in
the corridor during inspection.

86
(3) Apartment Data Collection
31 apartment units were selected for detail analysis in building 1 and building 2. Apartment types
include studio, one bedroom, two-bedroom, and three-bedroom apartments.
Figure 29: Example of apartment data: (a) Registered point cloud of six raw scans for one
apartment; (b) Infrared images of bedroom showing poor/lost insulation in the exterior wall; (c)
Using moisture meter to verify the moisture issue detected by infrared camera; (d) Temperature
and humidity data collected in one apartment during inspection.
For each apartment, 8-30 groups of moisture data were collected randomly. During post-
analysis, these temperature and humidity data are extracted and inputted into Excel by

87
apartment to generate average temperature, average humidity and temperature variation
information.
(4) Environmental Condition Data Collection
Environmental condition data were captured from moisture meter, wind speed meter and
weather station nearby. Available data from weather station includes: temperature, relative
humidity, wind speed and wind speed direction for every 4 minutes (Figure 30).
Figure 30: Real-time outdoor temperature and humidity captured from weather station and
moisture meter

88
3.5 Results and Discussion
3.5.1 Defect Detection Results
A total of 1609 infrared images were captured for 31 apartments in two buildings after field data
collection. These infrared images are integrated with LIDAR data to generate 3D thermography
data. The integrated data are used to identify defects and locate these defects in 3D thermal
model. The major types of defects detected from this process are described in the following. As
discussed previously, there are many different types of defects that can be identified and located
through thermal imaging. These defects include poor or missing insulation, moisture issue, air
leakage or air infiltration, thermal bridge, and hot water riser overheating.
Poor or missing insulation: Poor or missing insulation can impair the thermal performance of
building components significantly. Through infrared cameras, improperly installed or damaged
insulation will appear as a patch with well-defined edges that outline the problematic areas
(Balaras and Argiriou 2002) (Figure 31). In this case study, almost one half of 31 apartments
have this type of issue. In order to obtain sufficient poor insulation information, a minimum
temperature difference is required during inspection. According to the RESNET Interim
Guidelines for thermographic inspections of building and FLIR thermal imaging guidebook, the
minimum inside and outside temperature difference of the wall surface is 10°C/18°F and for a
period of 4 hours is recommended.
The field data collection for building 1 and building 2 were done during 6/30/2014 to 8/15/2014
and 3/14/2015 to 3/20/2015. There is a challenge for obtaining sufficient temperature difference
during spring and summer inspection with only half of target apartments equipped with unit air
conditioner. This results in inadequate temperature differences. Because of this situation, there

89
may be potential poor insulation areas that cannot be detected during field trips. After all the
missing and poor insulation areas are detected and located, 3D thermal point cloud was used to
calculated the areas of anomalies. The RESNET Insulation Grading Standard was used to grade
the insulation condition of each apartment.
Figure 31: Poor or missing insulation issues
(Sections with missing or poor insulation are indicated by the cooler colors)
Moisture Issue: Moisture is the most common form of deterioration detected in a building.
Locating moisture through infrared thermography is relatively straightforward since water has
high thermal conductivity and heat capacity. Moisture in building envelop systems could be the
result of air infiltration. This is because air infiltration allows warm moisture air going through
wall assembly systems and condensing and accumulating at cold spots. These condensations can
lead to reduced insulation value, mold growth, and structure element deterioration. The
following shows examples of moisture issues detected in the studied buildings (Figure 32).

90
Figure 32: Moisture issues
Air infiltration: Air infiltration can lead to high energy consumption and condensation in
building envelop systems. Although adequate air exchange is essential for occupants’ health,
many buildings have a far greater rate of air exchange than what is necessary. Air infiltration is
usually caused by poor design and/or construction which allows air to move across thermal
perimeters. It is recommended that air infiltration inspection works better when indoor air flow is
controlled. This can be achieved using a blow door device or controlling air flow settings in
HAVC systems. In the context of this project, both are not feasible. In this study, air leakage
issues are detected mostly in wall assembly systems (Figure 33). In building 2, some of power
outlet on the exterior wall became a point of cold-air entry in apartments. In the worst case, it
was observed that an outlet has a temperature of 55°F while the indoor and outdoor temperatures
are 75°F and 40.5°F, respectively (Figure 34).

91
Figure 33: Air infiltration examples
Figure 34: Cold air infiltration through wall sockets
Thermal bridge: Thermal bridges are the elements or areas that are characterized by high
thermal conductance with respect to the homogeneous multilayer envelope structure. Thermal
bridges can lead to an increase of energy requirement for heating up to 30% of the extra-thermal
losses through building envelope during winter season (Theodosiou and Papadopoulos 2008). In
the context of this research, numerous examples of thermal bridge were detected and evaluated
(Figure 35).

92
Figure 35: Thermal bridge issues with two buildings
Hot water riser poor insulated: During field data collection for building 2, we noticed some of
the hot water riser pipes are not well insulated (Figure 36). The highest temperature difference
between the wall cover the riser and surrounding wall in a same room can reach to 13.2 °F. In
this particular building, three out of fifteen apartments had a temperature difference of 10°F in
this case, and seven of fifteen apartments had the temperature difference higher than 5°F, and 66%
of apartments had the temperature difference higher than 4°F. Insulating the pipes that carry hot
water can help reduce the convective heat loss from pipes and increasing the delivered water
temperature for end use apartments. On the other side, if the heat gain from poor insulated hot
water pipes cannot be controlled, it may lead to overheating issue in the room.
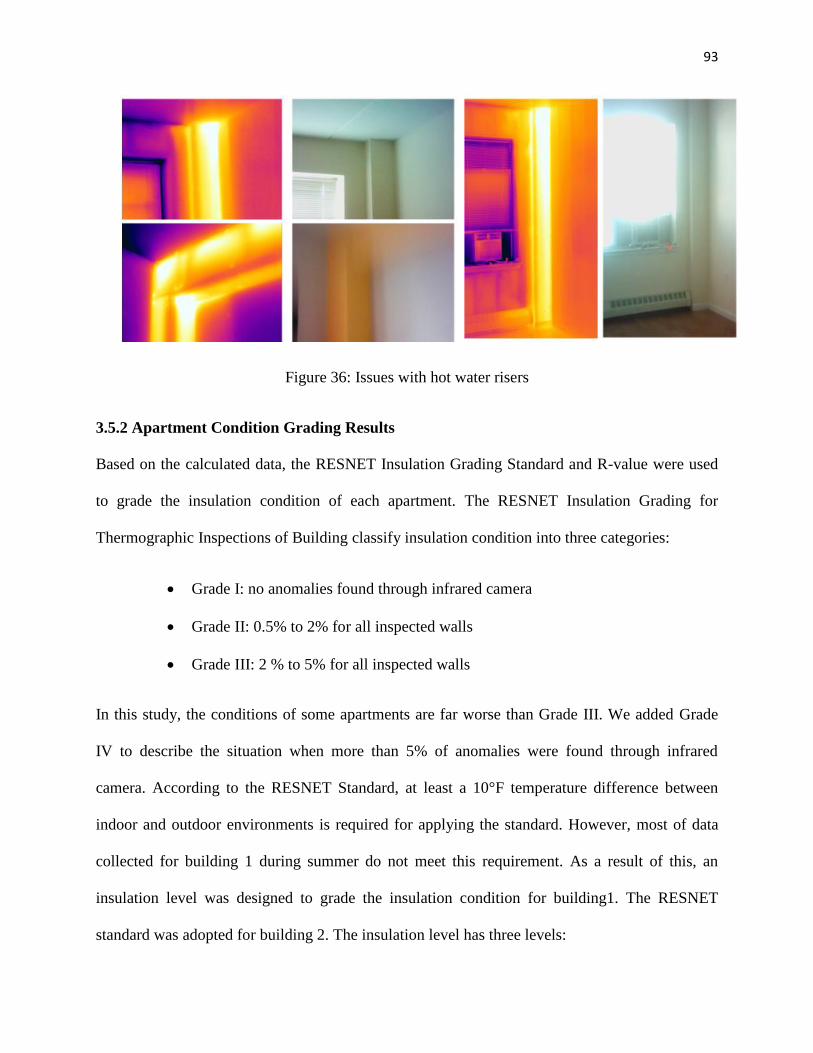
93
Figure 36: Issues with hot water risers
3.5.2 Apartment Condition Grading Results
Based on the calculated data, the RESNET Insulation Grading Standard and R-value were used
to grade the insulation condition of each apartment. The RESNET Insulation Grading for
Thermographic Inspections of Building classify insulation condition into three categories:
Grade I: no anomalies found through infrared camera
Grade II: 0.5% to 2% for all inspected walls
Grade III: 2 % to 5% for all inspected walls
In this study, the conditions of some apartments are far worse than Grade III. We added Grade
IV to describe the situation when more than 5% of anomalies were found through infrared
camera. According to the RESNET Standard, at least a 10°F temperature difference between
indoor and outdoor environments is required for applying the standard. However, most of data
collected for building 1 during summer do not meet this requirement. As a result of this, an
insulation level was designed to grade the insulation condition for building1. The RESNET
standard was adopted for building 2. The insulation level has three levels:

94
Level 1: for good condition that no insulation anomalies is detectable;
Level 2 for fair condition with small insulation issue;
Level 3 for poor condition with large detectable insulation issue;
3.5.3 Summary of Apartment Attributes
The conditions of studied apartments are summarized in the following tables.
Table 28: Extracted attributes for building 1(part one)
Attribute Apartment Unit Information
Apartment List Top Floor Corner
H1 0 1
H2 0 1
H3 1 1
H4 0 0
H5 1 1
H6 0 0
H7 0 0
H8 1 1
H9 0 1
H10 0 1
H11 0 1
H12 0 1
H13 1 1

95
H14 0 1
H15 0 1
Table 29: Extracted attributes for building 1 (part two)
Attribute Thermal Comfort Thermal Infrared Data
Apartment
List
Real-time
Indoor Air
Temperature
Real-time
Indoor Air
Relative
Humidity
Real-time
Thermal
Comfort
Level
Indoor Air
Temperature
Variation
Insulation
Level
Moisture
Level
H1 81.5 56.47 3 1.08 1 1
H2 82.28 50.09 3 3.78 2 1
H3 82.87 54.83 3 2.34 3 2
H4 82.9 56.22 3 7.56 1 1
H5 82.46 50.03 3 7.92 2 2
H6 84.02 50.19 3 4.5 1 1
H7 81.14 46.7 3 10.26 1 1
H8 80.66 47.578 2 3.96 2 2
H9 81.2 46.43 3 0.18 1 1
H10 81.56 44.53 2 6.84 1 1
H11 79.34 50.5875 2 4.32 2 2
H12 82.9 56.22 3 2.88 1 1
H13 83.876 48.52 3 0.36 3 1
H14 78.14 43.66 2 1.08 2 2

96
H15 77.68 43.56 2 3.24 1 1
Table 30: Attribute descriptions for building 1
Type Attribute Value Description
Apartment
Unit
Information
Top Floor Top (1);
Other (0);
The apartment unit is on the top floor
or not
Corner Corner (1);
Other (0);
The apartment unit is in the corner of
the building or not
Thermal
Comfort
Real-time Indoor
Air Temperature
Number (°F) Average indoor air temperature from
the moisture meter during inspection
Real-time Indoor
Air Relative
Humidity
Number (%) Average indoor air relative humidity
from the moisture meter during
inspection
Real-time Thermal
Comfort Level
Cold (1);
Normal (2);
Hot (3)
Thermal Comfort of the indoor
environment base on the real-time
indoor air temperature and relative
humidity
Indoor Air
Temperature
Variation
Number (°F) The variation of the indoor air
temperature in one apartment unit
Thermal
Infrared
Insulation Level
1 = good condition;
2 = fair condition;
Describe the insulation condition of
the apartment unit

97
Data
3=poor condition;
Level 1: for good condition that no
insulation anomalies is detectable
through infrared camera
Level 2 for fair condition with small
insulation issue;
Level 3 for poor condition with large
detectable insulation issue;
Moisture Level 1 = good condition;
2 = fair condition;
3=poor condition;
Describe the moisture condition of
the apartment unit
Level 1: for good condition that no
moisture anomalies is detectable
through infrared camera
Level 2 for fair condition with small
moisture or non-structure element
issue;
Level 3 for poor condition with large
detectable moisture issue;
Note: the temperature factor for thermal bridge and air leakage, R-value and RESNET Insulation
Grading can only be calculated with a temperature difference below 10°F between indoor and
outdoor
Although the RESNET Insulation Grading cannot be used for building1, an insulation level was
applied in this case.
Insulation Level defined here has three levels:

98
Level one for poor insulation condition:
Level two for fair insulation condition:
Level three for good insulation condition:
Table 31: Apartment information for building 2 – Exterior wall area
Attribute Room Type Bedroom 1 Bedroom2 Bedroom3 Living
Room
Total Area
H1 1 81.1176 80.666 NA 93.524 255.3076
H2 1 81.1176 80.666 NA 93.524 255.3076
H3 2 64.4907 71.991 NA 111.033 247.5147
H4 3 72.7393 94.847 NA 84.574 252.1603
H5 1 81.1176 80.666 NA 93.524 255.3076
H6 1 81.1176 80.666 NA 93.524 255.3076
H7 1 81.1176 80.666 NA 93.524 255.3076
H8 5 70.1334 71.543 84.14 91.421 317.2374
H9 1 81.1176 80.666 NA 93.524 255.3076
H10 4 82.6608 NA NA 102.316 184.9768
H11 1 81.1176 80.666 NA 93.524 255.3076
H12 3 72.7393 94.847 NA 84.574 252.1603
H13 4 82.6608 NA NA 102.316 184.9768
H14 1 81.1176 80.666 NA 93.524 255.3076
H15 1 81.1176 80.666 NA 93.524 255.3076
H16 1 81.1176 80.666 NA 93.524 255.3076

99
Room Type:
Type 1: Typical two-bedroom apartment
Type 2: Corner two-bedroom apartment
Type 3: Other Type of two-bedroom apartment
Type 4: One-bedroom apartment
Type 5: Three-bedroom apartment
Unit: Square Feet
All the dimension information was collected from point cloud data.
Table 32: Attribute list for building 2 (part one)
Attribute Apartment Unit Information
Apartment list Top Floor Corner Face Inner Garden
H1 1 0 1
H2 0 0 0
H3 0 1 1
H4 0 0 0
H5 0 0 1
H6 1 0 1
H7 0 0 0
H8 1 1 0
H9 1 0 1
H10 1 1 1

100
H11 0 0 0
H12 0 0 0
H13 0 0 0
H14 1 0 1
H15 0 0 1
H16 0 0 1
Table 33: Attribute list for building 2 (part two)
Attribute Thermal Comfort
Apartment
list
Real-time
Indoor Air
Temperature
Real-time Indoor
Air Relative
Humidity
Real-time
Outdoor Air
Temperature
Real-time
Thermal
Comfort Level
Indoor Air
Temperature
Variation
H1 76.1 37.68 45.8 2 4.68
H2 76.865 39.21 45.65 2 0.72
H3 78.91077 46.45 46.8 3 3.78
H4 77.846 30.33 39 2 8.64
H5 75.38 42.26 40.45 2 7.74
H6 81.905 29.55 43.75 3 3.96
H7 75.66286 35.01 45.6 2 2.7
H8 78.815 36.47 47.2 3 3.78
H9 75.09714 31.9 39.1 2 6.3
H10 77 24.9 39.85 2 0.9
H11 71.672 25.06 40.75 2 4.32

101
H12 75.74 29.13 44.85 2 2.88
H13 78.26 27.98 45.6 2 1.98
H14 85.03 24.57 33.2 3 7.02
H15 76.82 30.82 33.95 2 2.34
H16 75.92 41.7 32.4 2 5.76
Table 34: Thermal infrared data for building 2 (part one)
Attribute Dew Point
Dew Point
Warning
Thermal
Bridge
Temperature
Thermal
Bridge-
temperature
factor
Air Leakage
Temperature
Air Leakage
Temperature
Factor
H1 53.7 0 64.5 0.6 61.5 0.5
H2 55 0 68.3 0.7 67 0.7
H3 59.6 0 67.2 0.6 66.7 0.6
H4 52.8 0 74.3 0.9 67.2 0.7
H5 54.6 1 64.3 0.7 55.1 0.4
H6 56.5 0 75.2 0.8 64.3 0.5
H7 52.3 0 66.8 0.7 64.5 0.6
H8 55.9 0 66.9 0.6 58.4 0.4
H9 50.6 0 73.4 1 63.7 0.7
H10 50 0 67.7 0.7 58.1 0.5
H11 44.7 0 73.4 1.1 73.3 1.1

102
H12 50.2 0 74 0.9 70.9 0.8
H13 52.3 0 74.5 0.9 72.6 0.8
H14 57.9 0 79.7 0.9 68.5 0.7
H15 51.9 0 71.2 0.9 64.3 0.7
H16 54.9 0 71.1 0.9 66 0.8
Table 35: Thermal infrared data for building 2 (part two)
Attribute
Missing
Insulation
Area (sf)
Missing
Insulation
Area (%)
Insulation
Grading
R-value
Hot Water
Riser
Temperature
Difference
Hot Water
Riser poor
insulated
H1 1.4 0.55% 2 0.53 5.2 1
H2 3.6 1.41% 2 0.67 4.1 0
H3 13 5.25% 4 1.97 0 0
H4 0.65 0.26% 1 0.9 13.2 1
H5 36.5 14.30% 4 0.3 5.9 1
H6 1.79 0.70% 2 1.21 1.2 0
H7 0.99 0.39% 1 0.54 0 0
H8 2.63 0.83% 2 0.85 12.6 1
H9 4.21 1.65% 2 1.13 0 0
H10 36.3 19.62% 4 0.31 0 0
H11 9.32 3.65% 3 4.06 10.2 1

103
H12 9.018 3.58% 3 2.01 6.2 1
H13 1.13 0.61% 2 1.52 0 0
H14 0.45 0.18% 1 2.7 7.2 1
H15 5.89 2.31% 3 1.68 4.3 0
H16 3.3 1.29% 2 2.09 3.9 0
Table 36: Attribute description for building 2
Attribute Value Description
Top Floor Top (1);
Other (0);
The apartment unit is on the top floor or not
Corner Corner (1);
Other (0);
The apartment unit is in the corner of the building
or not
Face Inner
Garden
Face Inner Garden (1);
does not (0)
The apartment unit faces the inner garden or not
Real-time Indoor
Air Temperature
Number (°F) Average indoor air temperature from the moisture
meter during inspection
Real-time Indoor
Air Relative
Humidity
Number (%) Average indoor air relative humidity from the
moisture meter during inspection
Real-time
Outdoor Air
Temperature
Number (°F) Average outdoor air temperature during
inspection from local weather station

104
Real-time
Thermal
Comfort Level
Cold (1);
Normal (2);
Hot (3);
Thermal Comfort of the indoor environment base
on the real-time indoor air temperature and
relative humidity.
ASHRAE Comfort Zone was used for Standard.
Indoor Air
Temperature
Variation
Number (°F) The variation of the indoor air temperature in one
apartment unit
Dew Point
Number (°F) Dew point temperature calculated from air
temperature and humidity
Dew Point
Warning
Yes (1);
No (0);
Exterior wall temperature under dew point or not
Thermal Bridge
Temperature
Number (°F) Minimum thermal bridge temperature in the
apartment unit
Thermal Bridge
Temperature
Factor
Number (0-1) Describe the Thermal bridge condition; the
higher the better
Air Leakage
Temperature
Number (°F) Minimum air leakage area temperature in the
apartment unit
Air Leakage
Temperature
Factor
Number (0-1) Describe the Air Leakage; the higher the better
Missing
Insulation Area
Number (Square Feet) Describe the accumulated area of missing
insulation in one apartment unit

105
(sf)
Missing
Insulation Area
(%)
Number (%) Describe the percentage of accumulated area of
missing insulation in one apartment unit out of
total exterior wall area
Insulation
Grading
Grade I;
Grade II;
Grade III;
Worse than Grade III;
Insulation Grading Standards designed by
RESNET
Grade I: not infrared detectable anomalies;
Grade II: insulation installed with anomalies
found to be between 0.5 % and 2% for all
inspected walls
Grade III: An insulation installation having
between 2% to 5% anomalies found for all
inspected walls
Worse than Grade III: The condition that
insulation installation having more than 5% of
the anomalies found for all the inspected walls
(Note: in this case the total inspected exterior
wall area was used as denominator instead of all
the inspected walls, ceiling and floors of the
building enclosure, because for multi-family
building the only enclosure is the exterior wall)
R-value Value (W/m2K) The calculated R-value for one apartment’s worst
condition room

106
Hot Water Riser
Temperature
Difference
Value (°F) The temperature difference between hot water
riser and surrounding wall
Hot Water Riser
poor insulated
Yes (1);
No (0)
Infrared detectable hot water riser under the wall
with a temperature over 5° compare to
surrounding wall
Note: the temperature factor for thermal bridge and air leakage can only be calculated with a
high temperature difference between indoor and outdoor
The extracted building condition data show there are large variations in apartment conditions
(Figure 37 and Figure 38 ). Some apartments have significant deficiency in building insulation,
which could impact occupants’ thermal comfort and lead to other building hazards such as
indoor quality issues. These quantified building performance attributes form the basis to
correlate with other data streams. Statistical analyses can be applied on these data streams to
understand their correlations.

107
Figure 37: Summary of insulation condition for building 2
Figure 38: Summary of R-Value and NESNET Insulation Grade for building 2
0
5
10
15
20
25
1 2 3 4 5 6 7 8 9 10 11 12 13 14 15 16
Missing Insulation Percentage and NESNET
Insulation Grade
Insulation Issue Percentage
NESNET Insulation Grade
0
0.5
1
1.5
2
2.5
3
3.5
4
4.5
1 2 3 4 5 6 7 8 9 10 11 12 13 14 15 16
R-value and NESNET Insulation Grade
NESNET Insulation Grade
R-value

108
3.6 Conclusions and Future Research
This study explored the integration of infrared thermography and laser scanning for
building hazard detection. The integration allows quick and objective measurement of common
building defects that are relevant to healthy home. A systematic method that consists of infrared
and laser scan data collection, data fusion, and data analysis was developed. The proposed
approach was validated on two large multi-family multi-story buildings. A total of 31 apartments
were surveyed and analyzed according to several quantitative metrics including moisture issue,
thermal bridge, air infiltration, and missing insulation. The evaluation shows varied conditions in
these apartments, some of them having alarming concerns on thermal performance and
hazardous conditions. The field study shows the proposed method can generate systematic
measures that can be used to gauge the performance of the apartments and potentially these data
can be correlated with other condition data such as indoor air quality data to gain better
understanding how these factors correlate with each other. Future research can be devoted to
integrating with other data streams to evaluate the predictive power of the features quantified in
this research. Also, the question on how to scale the algorithms used in this research to other
lower quality sensors, such as those smart phone based infrared sensors, would be another
promising direction.

109
Appendix A
Building Defects Example in Building 1
Apartment
Number
Insulation Moisture Thermal
Bridge
Electric
Wire
Example
H1
H2
H3
H4
H5
H6

110
H7
H8
H9
H10
H11
H12
H13
H14
H15

111
Appendix B
Building Defects Example in Building 2
Apartment
Number
Insulation Air leakage
And Air infiltration
Thermal
Bridge
Hot Water Riser
Example
H1
H2
H3
H4
H5
H6

112
H7
H8
H9
H10
H11
H12
H13
H14

113
H15
H16

114
References
Agarwal, S., Furukawa, Y., Snavely, N., Simon, I., Curless, B., Seitz, S. M. and Szeliski, R.
(2011).Building Rome in a day. Communications of the ACM 54(10): 105.
Alba, M. I., Barazzetti, L., Scaioni, M., Rosina, E. and Previtali, M. (2011).Mapping infrared
data on terrestrial laser scanning 3D models of buildings. Remote Sensing 3(9): 1847-
1870.
Albatici, R., & Tonelli, A. M. (2010). Infrared thermovision technique for the assessment of
thermal transmittance value of opaque building elements on site. Energy and
Buildings, 42(11), 2177-2183.
ASHRAE, A. S. (2010). Standard 90.1-2010, Energy standard for buildings except low rise
residential buildings. American Society of Heating, Refrigerating and Air-Conditioning
Engineers, Inc.
Balaras, C. A., and Argiriou, A. A. (2002). Infrared thermography for building diagnostics.
Energy and Buildings, 34(2), 171-183.
Barreira, E., and Freitas, V. P. D. (2007). Evaluation of Building Materials using Infrared
Thermography. Construction and Building Materials, 21, 218-224.
Bianchi, F., Pisello, A. L., Baldinelli, G., & Asdrubali, F. (2014). Infrared Thermography
Assessment of Thermal Bridges in Building Envelope: Experimental Validation in a Test
Room Setup. Sustainability, 6(10), 7107-7120.

115
Borrmann, D., et al. (2012). Mutual calibration for 3D thermal mapping. Proceedings of the 10th
International IFAC Symposium on Robot Control (SYROCO’12).
Brady,J. (2008). Thermographic Inspection of Building and Roof Water Intrusion in the State of
Florida, Retrieved from http://bradyinfrared.com/news/NEWS21195.pdf (accessed 2
December 2015)
Bruni, B. (2004) Three Ways the Pest Professional Can use Infrared Thermography.
InfraMation.
Colantonio, A. Detection of Moisture and Water Intrusion Within Building Envelopes by Means
of Infrared Thermographic Inspections. Retrieved from:
https://c.ymcdn.com/sites/www.nibs.org/resource/resmgr/BEST/BEST1_001.pdf
Costanzo, A., Minasi, M., Casula, G., Musacchio, M. and Buongiorno, M. F. (2014). Combined
Use of Terrestrial Laser Scanning and IR Thermography Applied to a Historical
Building. Sensors 15(1): 194-213.
Clark, M. R., McCann, D. M., & Forde, M. C. (2003). Application of infrared thermography to
the non-destructive testing of concrete and masonry bridges.Ndt & E International, 36(4),
265-275.
Council, I. C. (2012). International Energy Conservation Code (IECC).Retrieved from :
http://publicecodes.cyberregs.com/icod/iecc/2012/
Council, I. C. (2012). International Green Construction Code (IECC).Retrieved from :
http://publicecodes.cyberregs.com/icod/igcc/2012/

116
Dall'O, G., Sarto, L., & Panza, A. (2013). Infrared screening of residential buildings for energy
audit purposes: results of a field test. Energies, 6(8), 3859-3878.
De Luca, V., Mastroberti, R. P., & Pallarda, A. (1996, June). Thermal–moisture testings and
practical methods for re-use of rural buildings. In Proceedings of the International
Seminar of the Second Technical Section of CIGR, Piacenza.
Demisse, G. G., Borrmann, D. and Nüchter, A. (2015). Interpreting thermal 3D models of indoor
environments for energy efficiency. Journal of Intelligent & Robotic Systems 77(1): 55-
72.
FLIR System AB.(2011). Thermal Imaging Guidebook for Building and Renewable Energy
Applications. Retrieved from: http://www1.flir.com/e/5392/nspections-and-energy-
handbook/2YDPW/1007767441
Fokaides, P. A., & Kalogirou, S. A. (2011). Application of infrared thermography for the
determination of the overall heat transfer coefficient (U-Value) in building
envelopes. Applied Energy, 88(12), 4358-4365.
Forster, A. (2007). Binder loss in traditional mass masonry: a cause for concern? Structural
Survey, 25(2), 148-170.
Gayo, E., and De Frutos, J. (1997). Interference filters as an enhancement tool for infrared
thermography in humidity studies of building elements. Infrared Physics & Technology,
38(4), 251-258.

117
GhaffarianHoseini, A., Dahlan, N. D., Berardi, U., GhaffarianHoseini, A., Makaremi, N., &
GhaffarianHoseini, M. (2013). Sustainable energy performances of green buildings: A
review of current theories, implementations and challenges. Renewable and Sustainable
Energy Reviews, 25, 1-17.
Golparvar-Fard, M. and Y. Ham (2013). Automated diagnostics and visualization of potential
energy performance problems in existing buildings using energy performance augmented
reality models. Journal of Computing in Civil Engineering 28(1): 17-29.
González-Aguilera, D., et al. (2012). Novel approach to 3D thermography and energy efficiency
evaluation. Energy and Buildings 54: 436-443.
Grinzato, E., Vavilov, V., and Kauppinen, T. (1998). Quantitative infrared thermography in
buildings. Energy and Buildings, 29(1), 1-9.
Grossman, J. L. (2005a). IR thermography as a tool for the pest management professional.
Society of Photo-Optical Instrumentation Engineers (SPIE) Conference Series, 195-209.
Grossman, J. L. (2005b) Advanced techniques in IR thermography as a tool for the pest
management professional. Proceedings of SPIE, the International Society for Optical
Engineering, 620512.1-620512.15.
Ham, Y. and M. Golparvar-Fard (2014). Three-dimensional thermography-based method for
cost-benefit analysis of energy efficiency building envelope retrofits. Journal of
Computing in Civil Engineering.

118
Ham, Y. and M. Golparvar-Fard (2014). 3D Visualization of thermal resistance and
condensation problems using infrared thermography for building energy diagnostics.
Visualization in Engineering 2(1): 1-15.
Ham, Y. and M. Golparvar-Fard (2015). Mapping actual thermal properties to building elements
in gbXML-based BIM for reliable building energy performance modeling. Automation in
construction 49: 214-224.
Harley, B.(2005). Insulation inspections for home energy rating. Home energy. Retrieved from :
http://www.bestofbuildingscience.com/pdf/Insulation%20inspections%20for%20home%
20energy%20ratings%20HEM_22-1_p20-23.pdf
Haralambopoulos, D. A., & Paparsenos, G. F. (1998). Assessing the thermal insulation of old
buildings—The need for in situ spot measurements of thermal resistance and planar
infrared thermography. Energy conversion and management, 39(1), 65-79.
Heinrich, H., & Dahlem, K. (2000). Thermography of low energy buildings. Qirt.Retrieved from:
http://qirt.org/archives/qirt2000/papers/022.pdf
Hens, H. (2007). Building Physics–Heat, Air and Moisture, Fundamentals and Engineering
Methods with Examples and Exercises, Ernst & Sohn A Wiley. ISBN 978-3-433-01841-5.
Hugo S.L.Hens. (2012). Building Physics – Heat, Air and Moisture: Fundamentals and
Engineering Methods with Examples and Exercises. Berlin. Germany: Ernst & Sohn

119
Infrared Thermometry: Understanding and using the infrared thermometer, Calex Electronics
Limited, Retrieved from http://www.calex.co.uk/site/wp-
content/uploads/2015/07/understanding-and-using-ir.pdf
Jenkins, D. R., Knab, L. I., & Mathey, R. G. (1982). Laboratory studies of infrared thermography
in roofing moisture detection. Moisture Migration in Buildings, 779, 207-220.
Kalamees, T. (2007). Air tightness and air leakages of new lightweight single-family detached
houses in Estonia. Building and environment, 42(6), 2369-2377.
Kalamees, T., Korpi, M., Eskola, L., Kurnitski, J., & Vinha, J. (2008, June). The distribution of
the air leakage places and thermal bridges in Finnish detached houses and apartment
buildings. In Proceedings of the 8th Symposium on Building Physics in the Nordic
Countries (NSB2008), Copenhagen, Denmark (pp. 16-18).
Kalamees, T., Korpi, M., Eskola, L., Kurnitski, J. and Vinha, J. (2008). The distribution of the air
leakage places and thermal bridges in Finnish detached houses and apartment buildings.
Proceedings of the 8th Symposium on Building Physics in the Nordic Countries
(NSB2008), Copenhagen, Denmark.
Kominsky, J. R., Luckino, J. and Martin, T. (2007). Passive infrared thermography—a
qualitative method for detecting moisture anomalies in building envelopes. Tedford and
Pond.
Kylili, A., Fokaides, P. A., Christou, P., & Kalogirou, S. A. (2014). Infrared thermography (IRT)
applications for building diagnostics: A review. Applied Energy, 134, 531-549.

120
Kominsky, J. R., Luckino, J. S., & Martin, T. F. (2007). Passive infrared thermography—a
qualitative method for detecting moisture anomalies in building envelopes. Tedford and
Pond.
Lagüela, S., Díaz-Vilariño, L., Armesto, J., Arias, P. and Vigo, C. L. M. (2012 a).Thermographic
3D models as the foundation for Building Information Models. 11th International
Conference on Quantitative Infrared Thermography.
Lagüela, S., Armesto, J., Arias, P. and Herráez, J. (2012 b). Automation of thermographic 3D
modelling through image fusion and image matching techniques. Automation in
construction 27: 24-31.
Lerma J. L., Cabrelles, M. and Portalés, C. (2011). Multitemporal thermal analysis to detect
moisture on a building façade. Construction and Building Materials 25(5): 2190-2197.
Li, Z., Yao, W., Lee, S., Lee, C., and Yang, Z. (2000). Application of infrared thermography
technique in building finish evaluation. Journal of Nondestructive Evaluation, 19(1), 11-
19.
Little, J., & Arregi, B. (2011). Thermal bridging. Understanding its critical role in energy
efficiency. Construct Ireland, 5(6), 1-14.
Ludwig, N., Redaelli, V., Rosina, E., and Augelli, F. (2004). Moisture detection in wood and
plaster by IR thermography. Infrared Physics & Technology, 46(1), 161-166.

121
Maierhofer, C., Brink, A., Röllig, M., and Wiggenhauser, H. (2003). Detection of shallow
voids in concrete structures with impulse thermography and radar. NDT& E
International, 36(4), 257-263.
Maldague, X. P. (2002). Introduction to NDT by active infrared thermography. Materials
Evaluation 60(9): 1060-1073.
McMullan, R. (2012). Environmental science in building. Palgrave Macmillan.
Meola, C. (2007). Infrared thermography of masonry structures. Infrared Physics &Technology,
49(3), 228-233.
Moropoulou, A., Avdelidis, N. P., Haralampopoulos, G., and Anagnostopoulou, S. (2002).
Detection of moisture in porous materials by infrared thermography.
Thermosense.XXIV.
Nardi, I., Sfarra, S., & Ambrosini, D. (2014, November). Quantitative thermography for the
estimation of the U-value: state of the art and a case study. In Journal of Physics:
Conference Series (Vol. 547, No. 1, p. 012016). IOP Publishing.
Residential Energy Services Network, Inc. (2013). Mortgage Industry National Home Energy
Rating Systems Standards (HERS Standard). Retrieved from:
http://www.resnet.us/standards/RESNET_Mortgage_Industry_National_HERS_Standard
s.pdf
Residential Energy Services Network, Inc. (2012). RESNET Interim Guidelines for
Thermographic Inspection of Building. Retrieved from:

122
http://www.resnet.us/board/Results_of_Electronic_Ballot_of_RESNET_Board_on_Adop
ting_IR_Interim_Guidelines.pdf
Simonson, C. J., Salonvaara, M., & Ojanen, T. (2002). The effect of structures on indoor
humidity–possibility to improve comfort and perceived air quality.Indoor Air, 12(4), 243-
251.
U.S. Census Bureau. (2010). State & county Quickfacts: USA. Retrieved September 30, 2015,
from http://quickfacts.census.gov/qfd/states/00000.html
U.S. Department of Energy .(2012). Building Technologies Program: Air Leakage Guide.
U.S. Department of Housing and Urban Development. (2012). The Healthy Homes Program
Guidance Manual. Retrieved from:
http://portal.hud.gov/hudportal/documents/huddoc?id=hhpgm_final_ch1.pdf
U.S. Department of Housing and Urban Development. HHRS Hazards Chart-HUD. Retrieved
from: http://portal.hud.gov/hudportal/documents/huddoc?id=hhrschart.pdf
Rode, C., Grau, K., & Mitamura, T. (2001). Hygrothermal conditions in the envelope and indoor
air of buildings. Performance of the Exterior Envelopes of Whole Buildings: Integration
of Building Envelopes VIII.
Schoc Isokorb, (2015). Thermal Bridging Guide, Retrieved from
http://www.schoeck.co.uk/upload/files/download/Thermal_Bridging_Guide_Schoeck_Iso
korb_%5B5993%5D.pdf

123
Theodosiou, T. and Papadopoulos, A. (2008). The impact of thermal bridges on the energy
demand of buildings with double brick wall constructions. Energy and Buildings 40(11):
2083-2089.
Titman, D. (2001). Applications of thermography in non-destructive testing of structures. NDT
& E International 34(2): 149-154.
Tobiasson, W., and Korhonen, C. (1985). Roof moisture surveys: Yesterday, today and
tomorrow.
Tony Colantonio, P. (2007). Commissioning of exterior building envelopes of large buildings for
air leakage and resultant moisture accumulation using infrared thermography and other
diagnostic tools.
Vavilov, V. (2010). A pessimistic view of the energy auditing of building structures with the use
of infrared thermography. Russian Journal of Nondestructive Testing 46(12): 906-910.
Vidas, S. and Moghadam, P. (2013).HeatWave: A handheld 3D thermography system for energy
auditing. Energy and Buildings 66: 445-460.
Wang, C., Cho, Y. K., & Gai, M. (2012). As-is 3D thermal modeling for existing building
envelopes using a hybrid LIDAR system. Journal of Computing in Civil Engineering.
Wild, W., Buscher, K. A., and Wiggenhauser, H. (1998) Amplitude sensitive modulation-
thermography to measure moisture in building materials. Proceedings of SPIE, 156-163.

124
Wróbel, A., & Kisilewicz, T. (2008, July). Detection of thermal bridges-aims, possibilities and
conditions. In 9th International Conference on Quantitative InfraRed Thermography (pp.
2-5).
Wyckhuyse, A., and Maldague, X. (2001). A study of wood inspection by infrared
thermography, part I: Wood pole inspection by infrared thermography. Research in
Nondestructive Evaluation, 13(1), 1-12.


