2/9/2009 1 Binary Analysis and Rewriting Arvind Ayyangar Niranjan Hasabnis Alireza Saberi Tung Tran R. Sekar Stony Brook University Min Gyung Kang Stephen McCamant Pongsin Poosankam Dawn Song UC, Berkeley
Transcript
2/9/2009 1
Binary Analysis and Rewriting
Arvind AyyangarNiranjan Hasabnis
Alireza SaberiTung TranR. Sekar
Stony Brook University
Min Gyung KangStephen McCamantPongsin Poosankam
Dawn SongUC, Berkeley
2/9/2009 2
Binary Rewriting for Protecting ApplicationsBasic approach: Instrument OS+application to
enforce policies that protect an application from a hostile OS
Why binary rewriting? Versatile: enforce a wide range of properties
isolation, policies on callable functions and parameters,…Global: information flow, control-flow integrity,…
Wide applicability:COTS and legacy applications available only in binary form
Application and all library code can be analyzed/rewrittenWorks across programs in many high-level languagesAbility to handle low-level code written in assembly
2/9/2009 3
Binary Rewriting TodayRelies on dynamic rewriting
Each basic block rewritten just before first executionBenefit: Side-steps challenges of static rewriting, e.g., accurate disassembly
Drawbacks High overheads for problems of our interest
400% to 4000% for taint-tracking
Difficulty in reasoning about higher level propertiesLimited visibility (single basic block) constrains the
classes of properties that can be reasoned aboutTargets a single instruction set (usually x86)
2/9/2009 4
Our ApproachDevelop novel static analysis based methods to
overcome the drawbacks of today’s techniquesMany research challenges:
Robust and scalable static analysis of low-level code produced by different compilers (or hand-written
assembly)Accurate disassembly of binary code
Indirect control-flow transfers, non-standard call/return conventions, mingling of data and code, …
Accurate reasoning about key properties Dynamic taint analysis
2/9/2009 5
Robust and scalable Static analysis of low-level code
2/9/2009 6
Static analysis of low-level codeScalability relies on modularity
Analyze functions individually, compose resultsAvoids repeated analysis of same code (esp. libraries)
Strength comes from accurate treatment of local variables
Challenges in low-level binary codeDifficult to identify parameter passing in optimized
codeMissing pushes, parameter passing via registers,…
Difficult to distinguish local variables from other accesses
Static analysis of low-level codeTo solve these challenges, previous approaches
make optimistic assumptions, or rely on compiler idiomsoften fail on optimized code and/or large programsdon’t work for other compilers, or hand-written assembly
Our solution: Develop a new static analysis thatUses systematic analysis to avoid
assumptions/heuristicsParameters, passing conventions, caller/callee save regs,…
Verifies assumptions that it needs to makepreservation of stack pointer across callswhether return goes back to caller, etc.
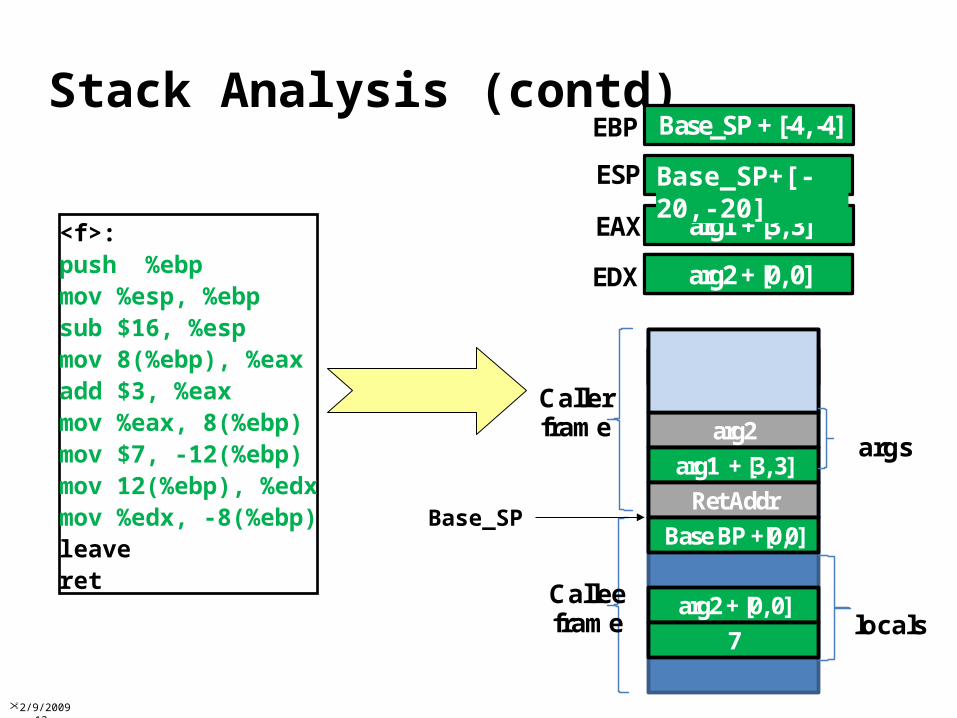
Accurately tracks local variables by analyzing values held in registers and on the stack
2/9/2009 8
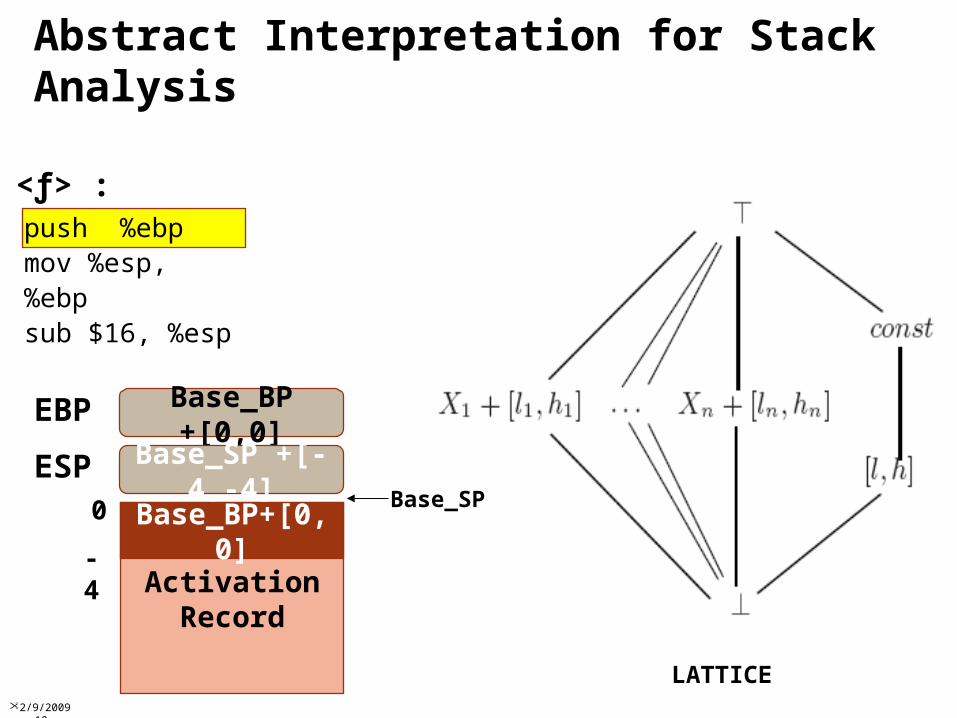
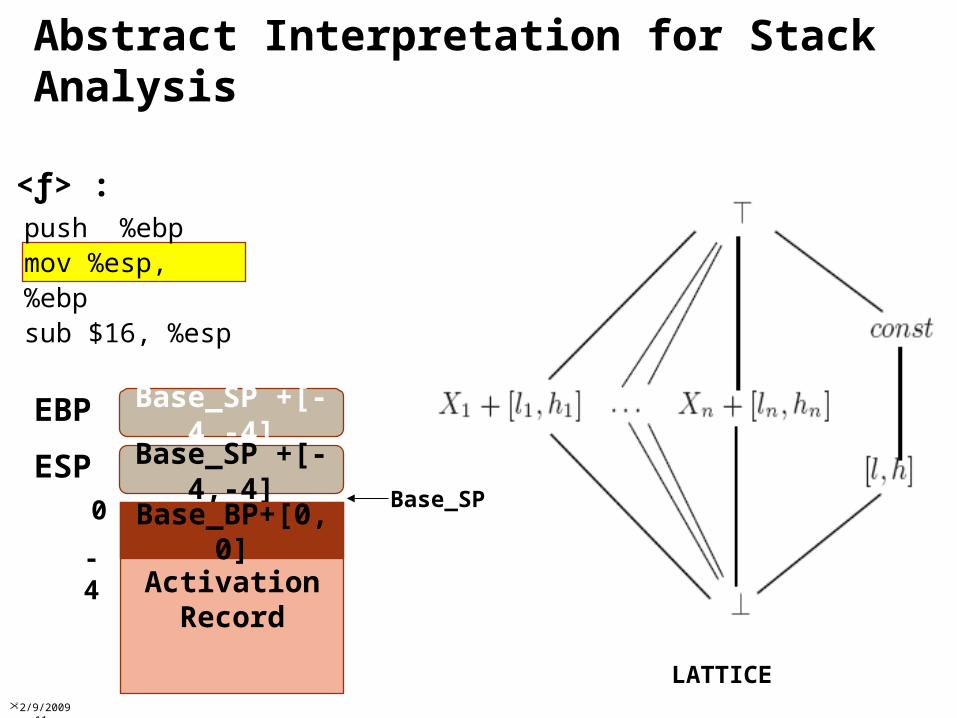
Stack AnalysisIdentify well-formed functionsAssociate with it scope, activation recordNo assumptions about
Parameters & Return valuesCaller & Callee SavesUse of base pointers
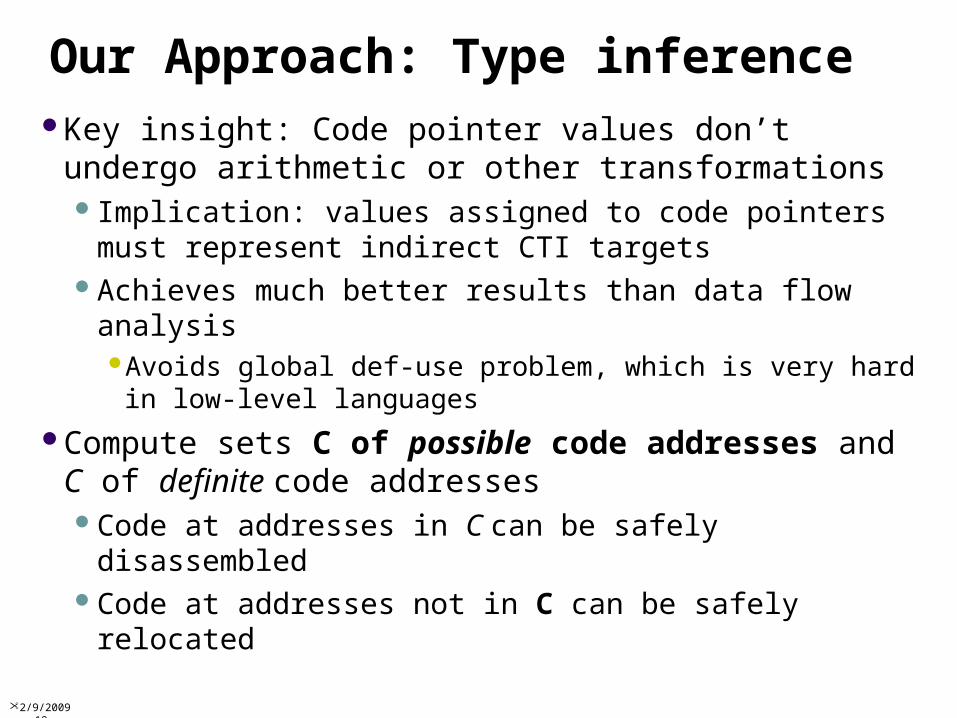
arithmetic or other transformationsImplication: values assigned to code pointers must
represent indirect CTI targetsAchieves much better results than data flow
analysisAvoids global def-use problem, which is very hard in low-level languages
Compute sets C of possible code addresses and C of definite code addressesCode at addresses in C can be safely disassembledCode at addresses not in C can be safely relocated
2/9/2009 20
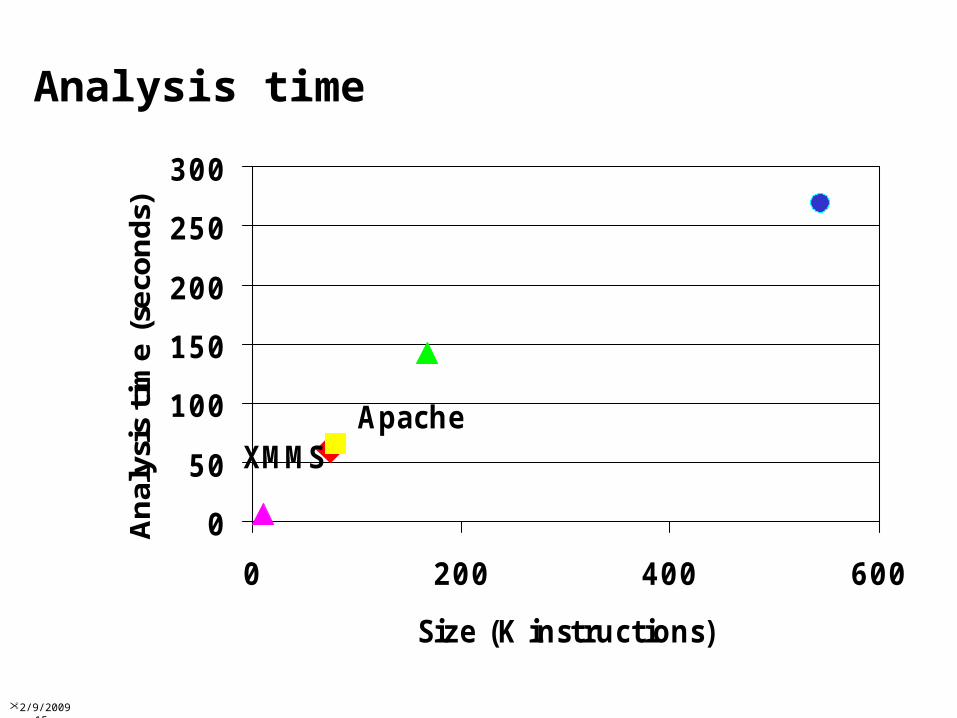
Static Disassembly: Preliminary Results
Analysis of disassembler on 'ls' binary
Analysis Disassembled code Reachable code not disassembled
Recursive Traversal 2.7% 85%
Compiler idioms and heuristics 87% 1%
Function pointer analysis 88% 0%
2/9/2009 21
Static Disassembly: Preliminary Results
Gap in dhclient due to incomplete implementation, dealing with global arrays
Application Size (KB)
Disassembled code
Reachable code not disassembled
pdftops 14 97% 0%
chroot 26 85% 0%
chmod 39 87% 0%
cat 43 92% 0%
ls 96 88% 0%
dhclient 411 81% 4%
2/9/2009 22
DTA++: Improving accuracy of Dynamic Taint Analysis
2/9/2009 23
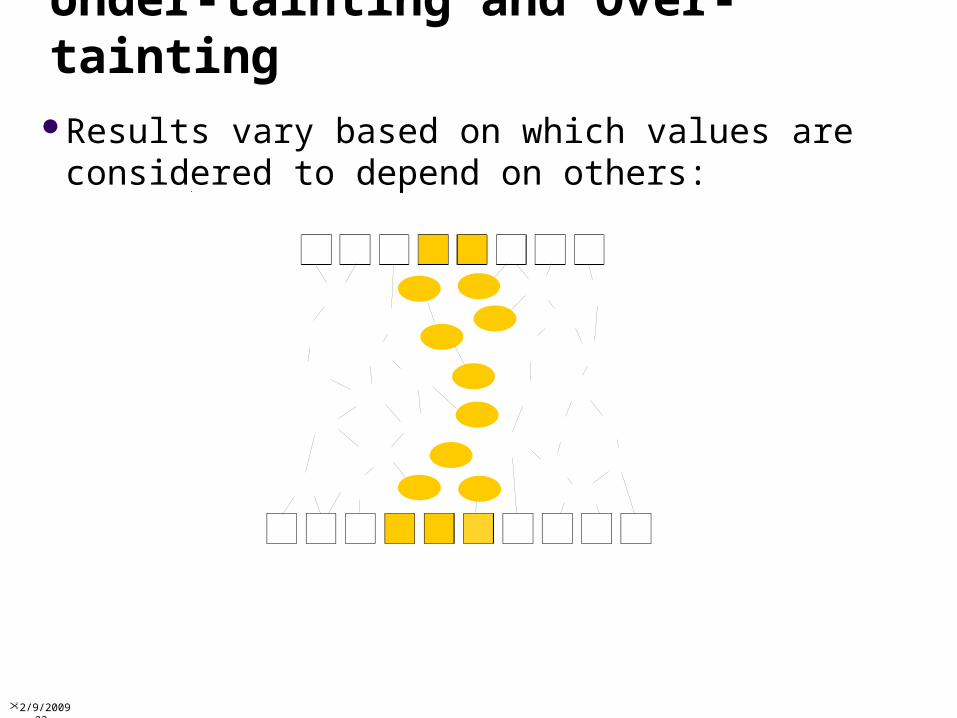
Under-tainting and Over-taintingResults vary based on which values are
considered to depend on others:
2/9/2009 24
Under-tainting and Over-taintingResults vary based on which values are
considered to depend on others:
• Too few dependencies lead to under-tainting
2/9/2009 25
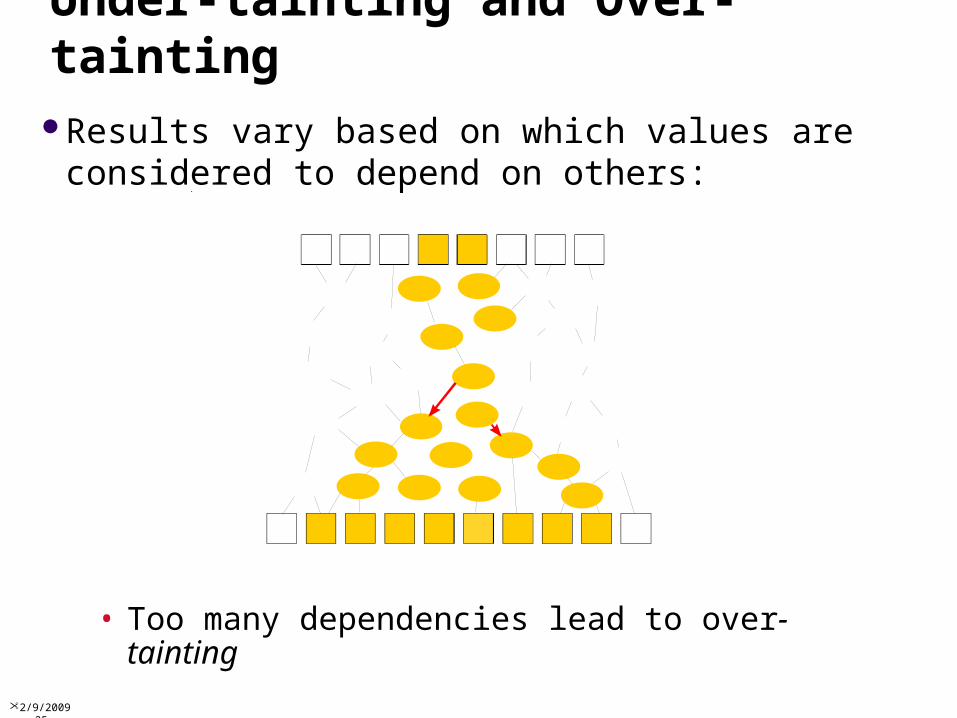
Under-tainting and Over-taintingResults vary based on which values are
considered to depend on others:
• Too many dependencies lead to over-tainting
2/9/2009 26
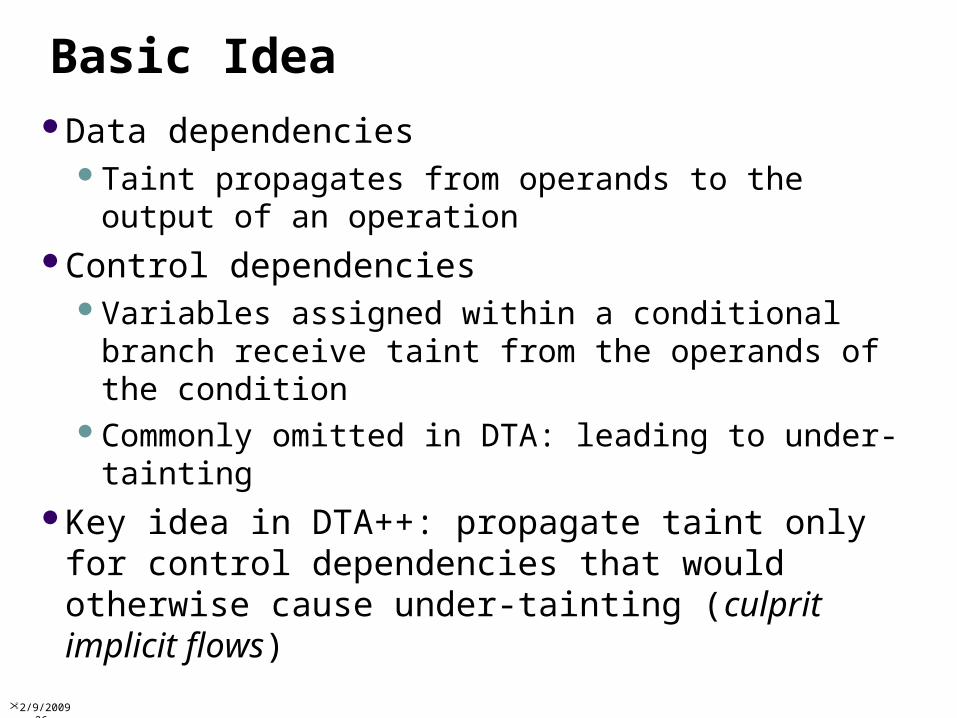
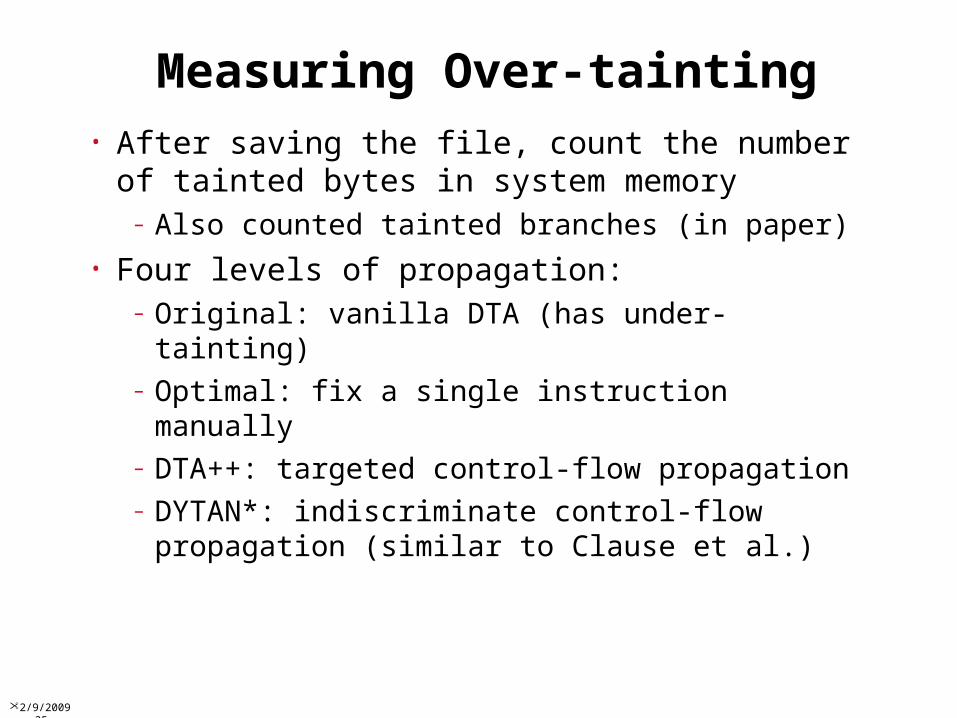
Basic IdeaData dependencies
Taint propagates from operands to the output of an operation
Control dependenciesVariables assigned within a conditional branch
receive taint from the operands of the conditionCommonly omitted in DTA: leading to under-
taintingKey idea in DTA++: propagate taint only for
control dependencies that would otherwise cause under-tainting (culprit implicit flows)
2/9/2009 27
Under-tainting occurs when control flow state represents (almost) all of the information in inputs
Intuition: Information Flow
2/9/2009 28
Under-tainting occurs when control flow state represents (almost) all of the information in inputs
Intuition: Information Flow
1 char output[256];2 char input = next_in();3 long len = 0;4 if (input == '{') {5 output[0] = '\\';6 output[1] = '{';7 len = 2;8 }
2/9/2009 29
Offline Rule GenerationHypothesis: under-tainting occurs at just a few
locations in a program (culprit branches)Approach: find these locations in advance, and
construct new taint propagation rules form themAssumption: we are given test inputs that
demonstrate the under-tainting
2/9/2009 30
Architecture Overview
Extra Propagation
Conventional DTA
Extra Propagation
Conventional DTA
Under-taintingDiagnosis
Rule Generation
correct propagationinformation
sampletainted input execution
traceimplicit flow
branches
DTA++ propagation rules
Offline Analysis
generaltainted input
trace(or other analysis)
2/9/2009 31
Under-tainting Detection PredicateGiven a (partial) execution trace t, φ(t) holds if t
contains a culprit implicit flowImplementation: count how many other inputs
could take the same execution path as t (using symbolic execution)Few or none →φ(t) = true
2/9/2009 32
Search for Culprit BranchesSearch through prefixes of a trace to find the
shortest satisfying φ: the last instruction in the prefix is the culprit
To minimize calls to φ, use binary searchAfter finding one culprit, remove it and repeat
the search to find others
2/9/2009 33
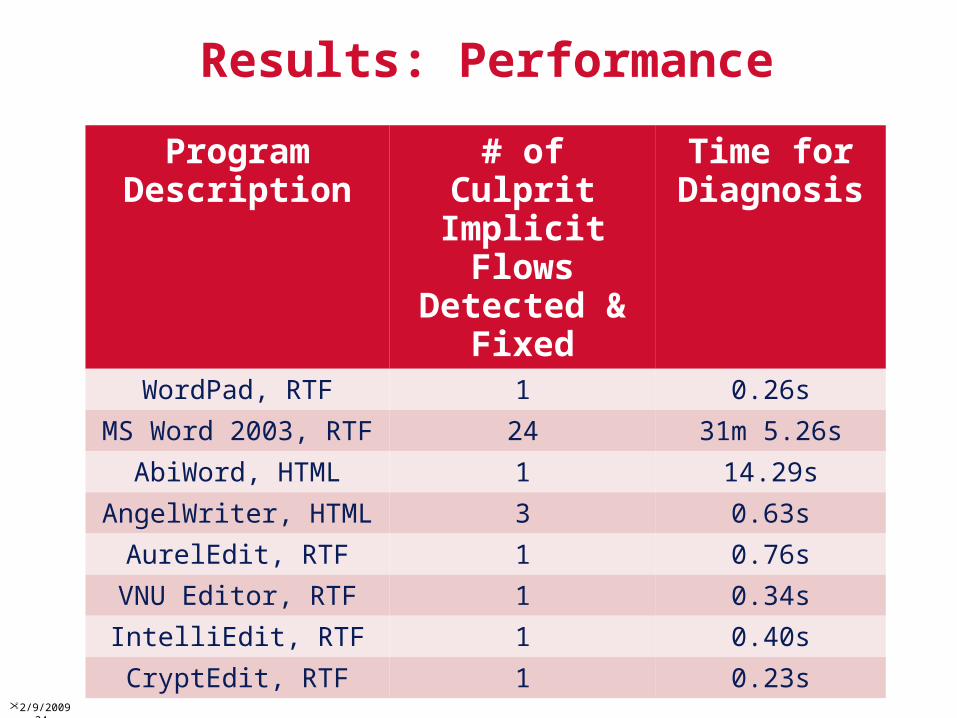
Experiment Setup• Subject programs are 8 Windows word-
processing applications in binary form• Input tainted plain text from virtual
keyboard• Convert and save the text in RTF or HTML