12
Nicklas Garemo Head of Infrastructure and Capital Projects Role of PPPs in addressing global infrastructure challenges
| Date post: | 17-Jul-2015 |
| Category: |
Environment |
| Upload: | mosurban |
| View: | 420 times |
| Download: | 0 times |
Nicklas GaremoHead of Infrastructure and Capital Projects
Role of PPPs in addressing global infrastructure challenges

1. The global infrastructure pipe-line
2. Financing challenging but PPPs only part of the answer
3. Infrastructure system peformance and productivity - the real problem
4. Opportunities to significantly boost productivity by replicating best-practices across countries
5. Primary benefit of PPP often not lower cost of capital but ratherbetter execution
Role of PPPs in addressing global infrastructure challenges

1,100700400
400Transport
TelecomPower and water
Infrastructure spend USD billions2, 2012
1 Represents 12% of global GDP2 Nominal investment in Infrastructure in 2012
SOURCE: Global Insight; Euroconstruct; IMF; McKinsey; World Bank; OECD
4,150 4,150
2,300
2,600
TotalReal estate
750
1,200350
Social infra-structure
Oil, gas and mining
1Real estate
Narrow Infrastructure definition
Broad Infrastructure definitionThe world spends USD 9 trillion each year across infrastructure assets
SOURCE: IMF, Bloomberg, Infrastructure Journal, Public Works Financing newsletter, Infrastructure Investor magazine; McKinsey Global Institute analysis
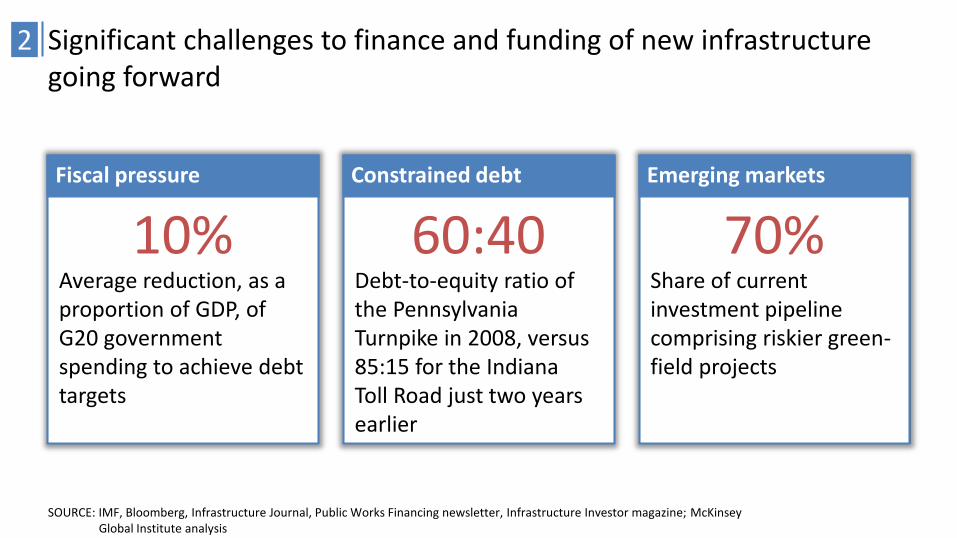
2
10%Average reduction, as a proportion of GDP, of G20 government spending to achieve debt targets
Fiscal pressure
60:40Debt-to-equity ratio of the Pennsylvania Turnpike in 2008, versus 85:15 for the Indiana Toll Road just two years earlier
Constrained debt
70%Share of current investment pipeline comprising riskier green-field projects
Emerging markets
Significant challenges to finance and funding of new infrastructure going forward

While some countries have successfully used PPPs to finance as much as 20-25% of spend………
76
10
35
100
100
11
58
90
13
7
21
4
20
118
89
36
20
100
96
18
84
56
64
28
16
44
4
52
82
47
81
66
156
26
10
9
Planned public, PPP, and private investment in core infrastructure Ratio per sectorUnited Kingdom
2011–15100% = $257 billion
India2007–11100% = $485 billion
64%(164)
23%(59)
13%(33)
17%(82)
19%(92)
64%(310)
Transport
Energy
Communications
Waste
Water
Electricity
Roads
Telecom
Rail
Water
Ports
Airports
Percentage. $ billion
SOURCE: HM Treasury, United Kingdom; Planning Commission, India; McKinsey Global Institute analysis
Private
Public
Public-private partnership2

2.01.4
0.9
1.2
0.6
0.6
0.4
0.4
High case
3.8
Base case
2.4
’As is’ case
1.6
0.3
Total investment capital available for infrastructure investment
Pension funds
Sovereign wealth
Life insurance
All investors at target allocation
Infra allocation in line with private equity
All investors maintain current allocation
US$ trillions of financing available over 2012 – 2030
SOURCE: McKinsey Global Banking Pools; McKinsey Global Insurance Pools; SWF Institute; TheCity UK; Preqin
…..PPPs will only be part of the answer at the global level2

SOURCE: OECD Labour Productivity by Industry (ISIC Rev. 3 & Rev. 4); McKinsey Global Institute analysis
Delivery system challenges
Poor project delivery
Biased project selection
Bias towards new investments
Sub-par labor productivity growth
Value added per hour workedIndex: 100 = 1989 for the US, 1991 for Germany
0
09052000951989
Rest of economy
Construction
140
80
120
100
160
2013
Infrastructure delivery system performance and productivity3

SOURCE: McKinsey Global Institute analysis
Strong infrastructure governance & capabilities
D E
Robust funding & finance framework
Optimizedspend
Infra-structurespend
Fact-basedproject selection
A Stream-lineddelivery
B Making the most of existing infrastructure
C
~8%~15%
~15%-38%
Percent
Proven best practices rolled out globally could save about 40% of spend
4

Cost and time overruns historically
Example: Mega project construction cost$ billion
Seoul-Busanhigh-speed rail
Incheon Inter-national airport
18
5
7
3
AdjustedPlanned
46 54
97
After ’99
Before ’99 341
122
After ’99Before‘99
Overrun
..were reduced…
Cost overrunPercent
Between 1999 and 2006, ~60 $ billion saved (~1% of GDP) and allocated for other uses
Rejected
1 Private Infrastructure Investment Center of Korea; 2 Public Investment Management Center; 3 Public & Private Infrastructure Management Center
SOURCE: IEEE Transactions on Engineering Management, KDI, Construction & Economy Research Institute of Korea, APA Journal
… and project screening significantly improved
Projects rejectedPercent
Korea enhanced the efficiency and transparency in infrastructure development by establishing an objective supervisory organization
4

SOURCE: McKinsey analysis
Effective Governance
Commitment
Executional excellence
Robust and trans-parent pipeline of viable PPP projects
Clear vision for role of PPP in infrastructure delivery
Positive perception of PPP by all key stakeholders
21 3
Standardized PPP-models with clear parameters for project selection
Robust legal and institutional framework and regulations
Effective, capable government institutions
54 6
Transparent and robust tender process
Robust business plans with attrac-tive and stable risk allocation
Effective controlling and feedback processes
87 9
Effective approach to PPPs4

… primary benefit is improved project performance due to better aligned incentives and risk allocation
Lower financing costs in some countries but…
Financing costs 2011-12Percentage
4.5
India6.4
8.2
Portugal9.3
12.9
2.6
Brazil5.9
5.6UK
Project Finance
Public Debt
2008 Findings in UK on performance of PPPsComparison 114 PPPs in 11 sectors vs. conventional projects
OTHER BENEFITSDesign for operations Design f. maintenanceLevel playing fieldBetter TCO optimizationetc
30
100 -70%
Budget over-runs1
Percent of projectsMeeting budgets
Meeting schedules
Reducing overall costs
35
100 -65%
Time over-runsPercent of projects
80100
-20%
Project costs2
Indexed to 100
Traditional PPP
Primary benefits of PPPs often not lower cost of capital but rather improved execution
5
Note. Similar study in Australia showed 52.4 percent of conventional projects having cost overruns whereas only 27.8 percent of PPPs did
SOURCE: McKinsey Global Institute analysis; UK National Audit report on “Private Finance Projects”, 2009

• USD 60 trillion needed until 2030 for Transport, Power and water alone
• Severe headwinds to funding and finance and PPPs are only a part of the answer
• Poor infrastructure system performance and productivity is the real challenge for the industry
• Replicating existing best-practices at the global scale could help get significantly more and better infrastructure out of every dollar spent
• Primary benefit of PPP often not lower cost of capital but rather improved execution due to better aligned incentives
Summary of key messages


