22
© A Very Good Teacher 2007 Exit Level TAKS Preparation Unit Objective 1
| Date post: | 16-Jan-2016 |
| Category: |
Documents |
| Upload: | neil-shelton |
| View: | 228 times |
| Download: | 0 times |

© A Very Good Teacher 2007
Exit LevelTAKS Preparation Unit
Objective 1
© A Very Good Teacher 2007
Independent and Dependent Quantities
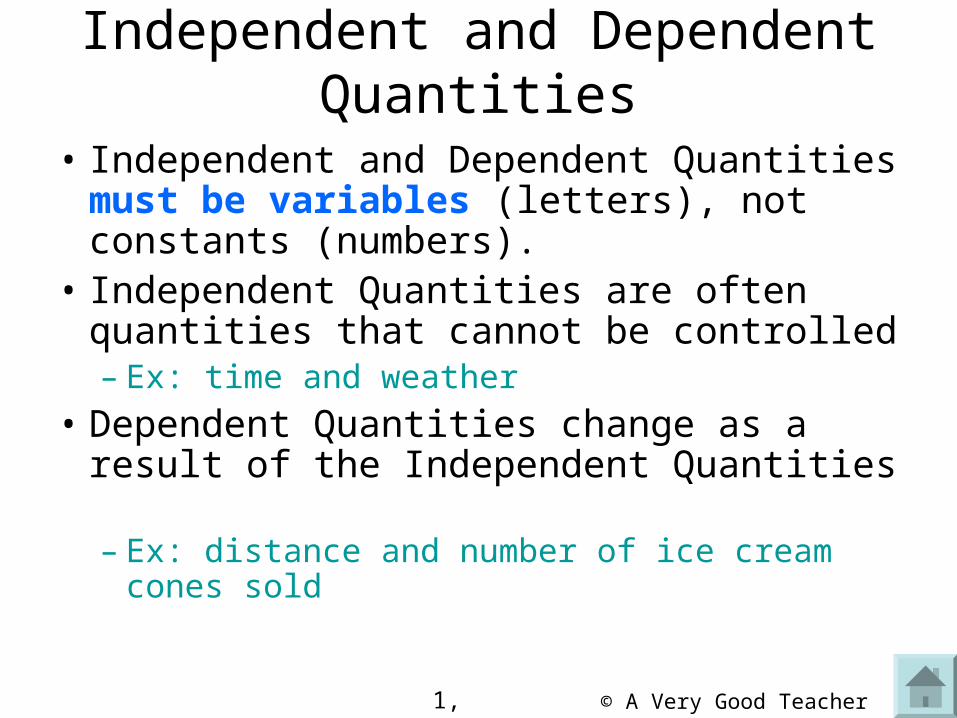
• Independent and Dependent Quantities must be variables (letters), not constants (numbers).
• Independent Quantities are often quantities that cannot be controlled– Ex: time and weather
• Dependent Quantities change as a result of the Independent Quantities – Ex: distance and number of ice cream cones
sold
1, Ab1A
© A Very Good Teacher 2007
Independent and Dependent Quantities, continued…
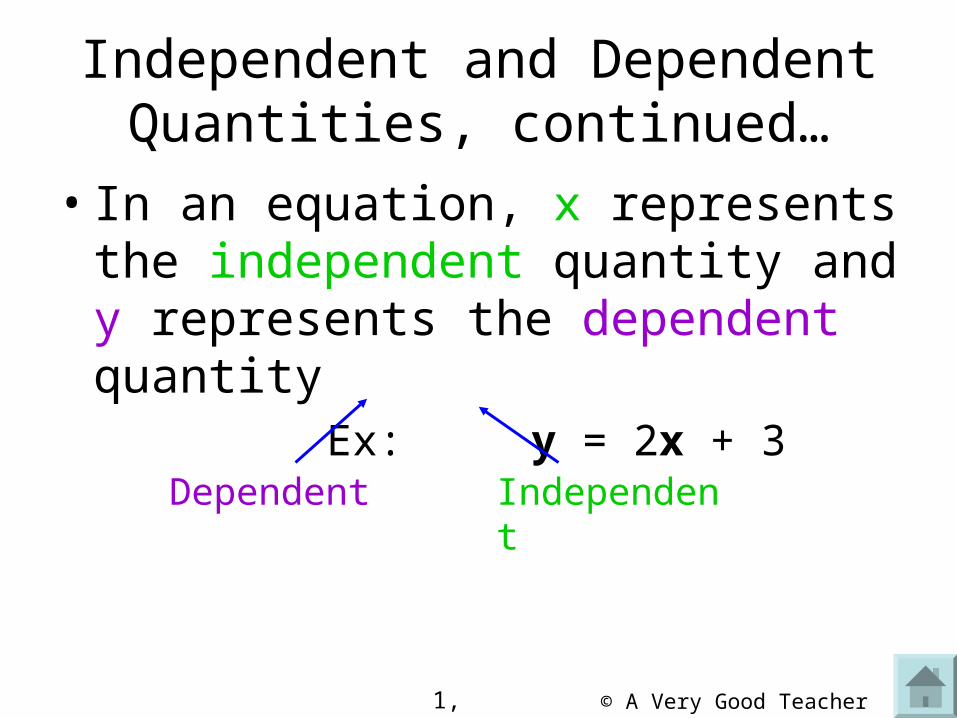
• In an equation, x represents the independent quantity and y represents the dependent quantity
Ex: y = 2x + 3
1, Ab1A
Dependent Independent
© A Very Good Teacher 2007
Independent and Dependent Quantities, continued…
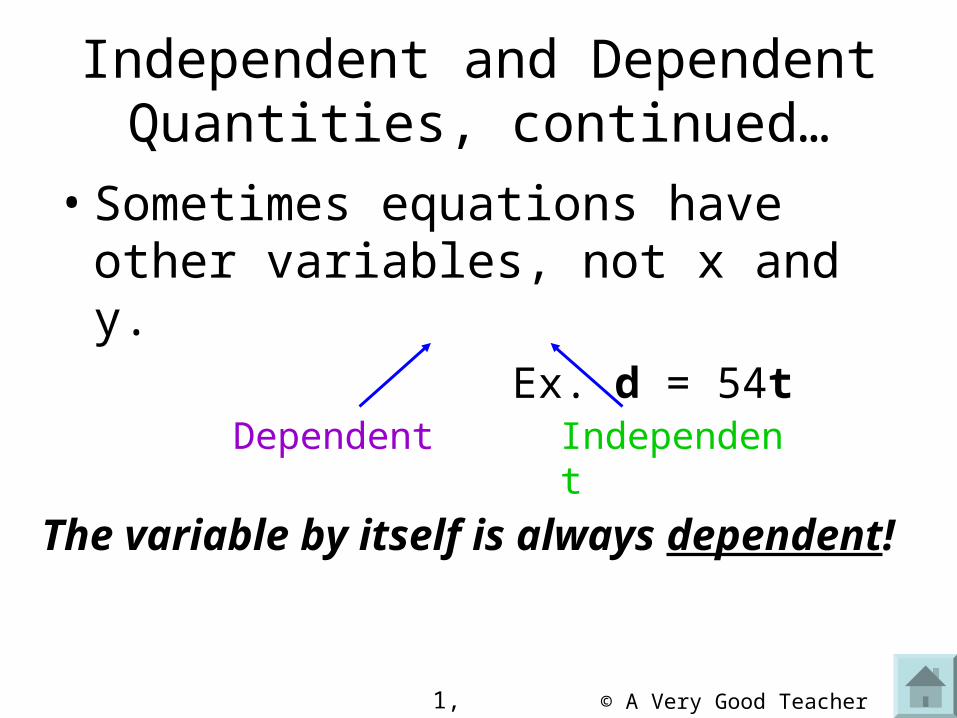
• Sometimes equations have other variables, not x and y.
Ex. d = 54t
Dependent Independent
The variable by itself is always dependent!
1, Ab1A
© A Very Good Teacher 2007
Independent and Dependent Quantities, continued…
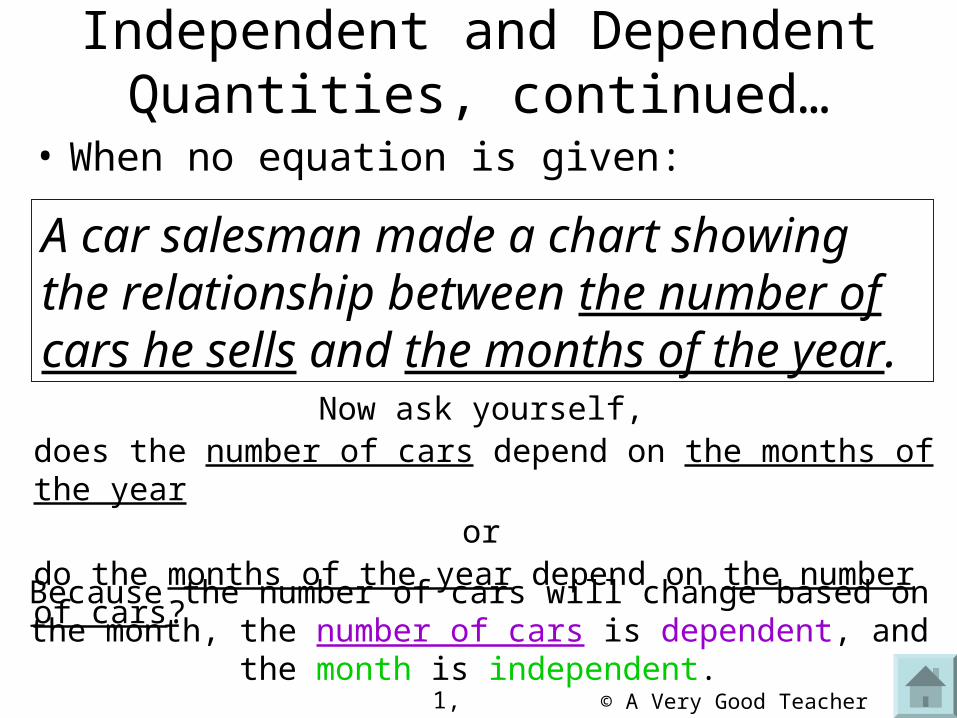
• When no equation is given:
1, Ab1A
A car salesman made a chart showing the relationship between the number of cars he sells and the months of the year.
Now ask yourself, does the number of cars depend on the months of the year
or do the months of the year depend on the number of cars?
Because the number of cars will change based on the month, the number of cars is dependent, and the month is independent.
© A Very Good Teacher 2007
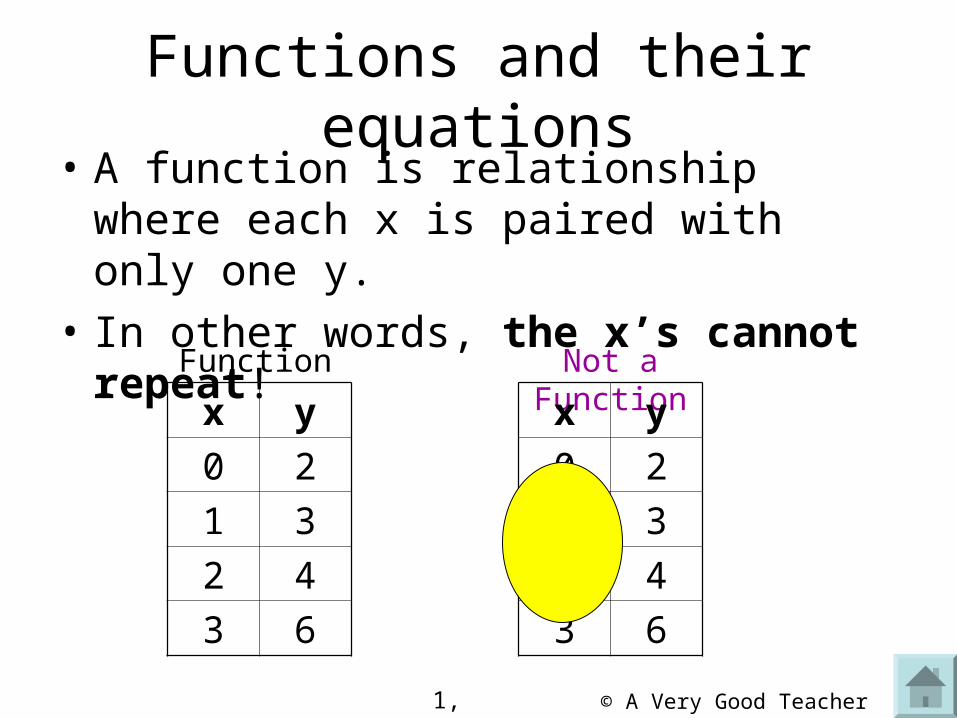
Functions and their equations• A function is relationship where each x is
paired with only one y.
• In other words, the x’s cannot repeat!
1, Ab1B
x y
0 2
1 3
2 4
3 6
Function Not a Function
x y
0 2
1 3
1 4
3 6
© A Very Good Teacher 2007
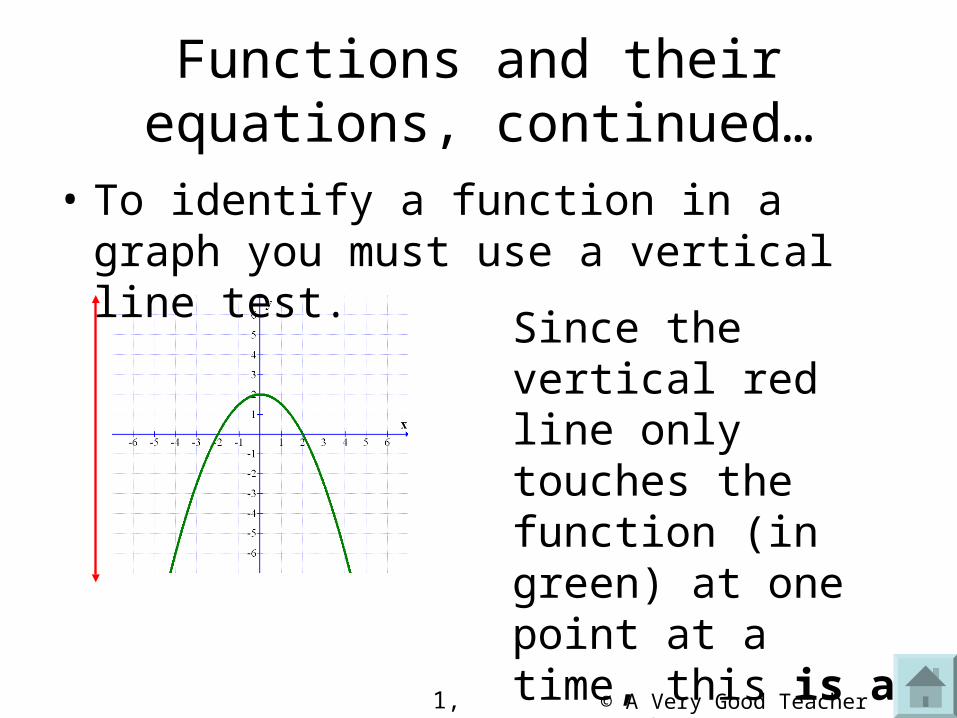
Functions and their equations, continued…
• To identify a function in a graph you must use a vertical line test.
1, Ab1B
Since the vertical red line only touches the function (in green) at one point at a time, this is a function.
© A Very Good Teacher 2007
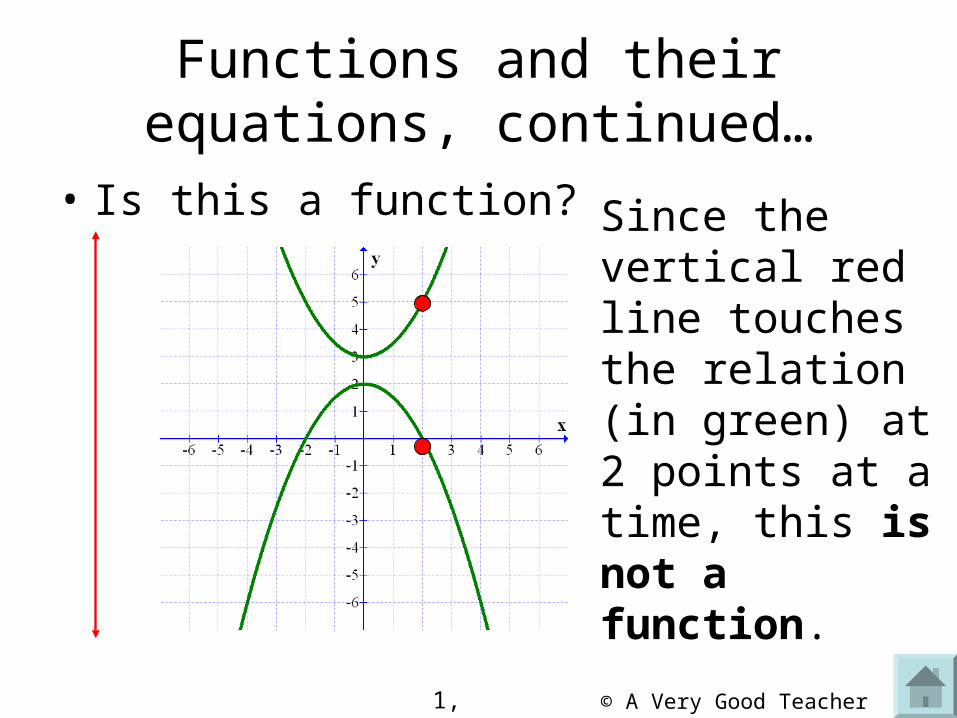
Functions and their equations, continued…
• Is this a function?
1, Ab1B
Since the vertical red line touches the relation (in green) at 2 points at a time, this is not a function.
© A Very Good Teacher 2007
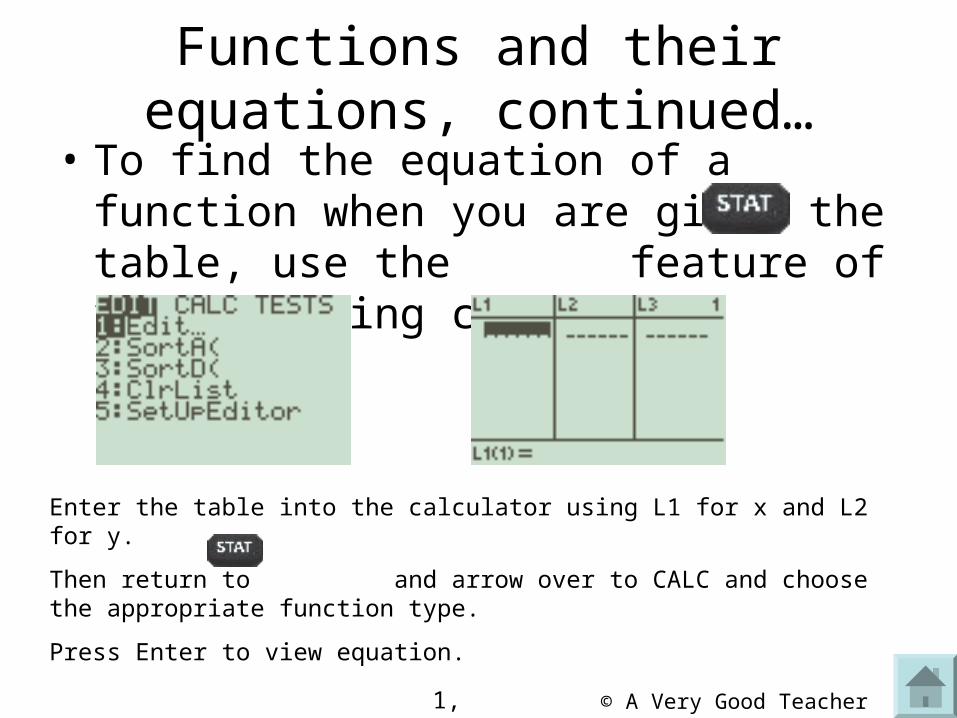
Functions and their equations, continued…
• To find the equation of a function when you are given the table, use the feature of your graphing calculator.
Enter the table into the calculator using L1 for x and L2 for y.
Then return to and arrow over to CALC and choose the appropriate function type.
Press Enter to view equation.
1, Ab1B
© A Very Good Teacher 2007
Functions and their equations, continued…
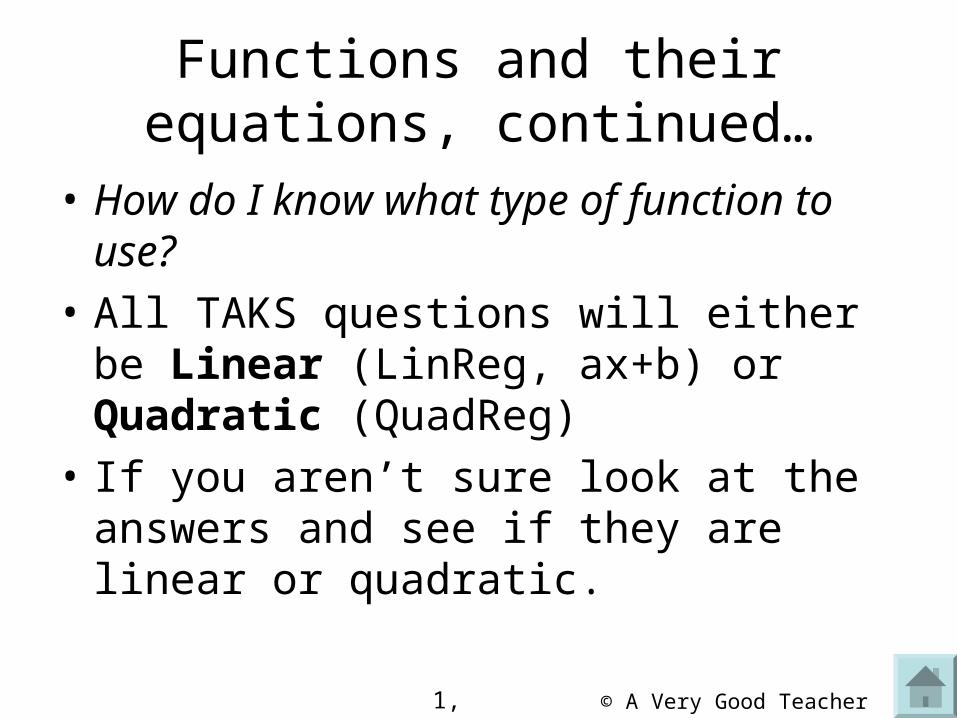
• How do I know what type of function to use?
• All TAKS questions will either be Linear (LinReg, ax+b) or Quadratic (QuadReg)
• If you aren’t sure look at the answers and see if they are linear or quadratic.
1, Ab1B
© A Very Good Teacher 2007
Functions and their equations, continued…
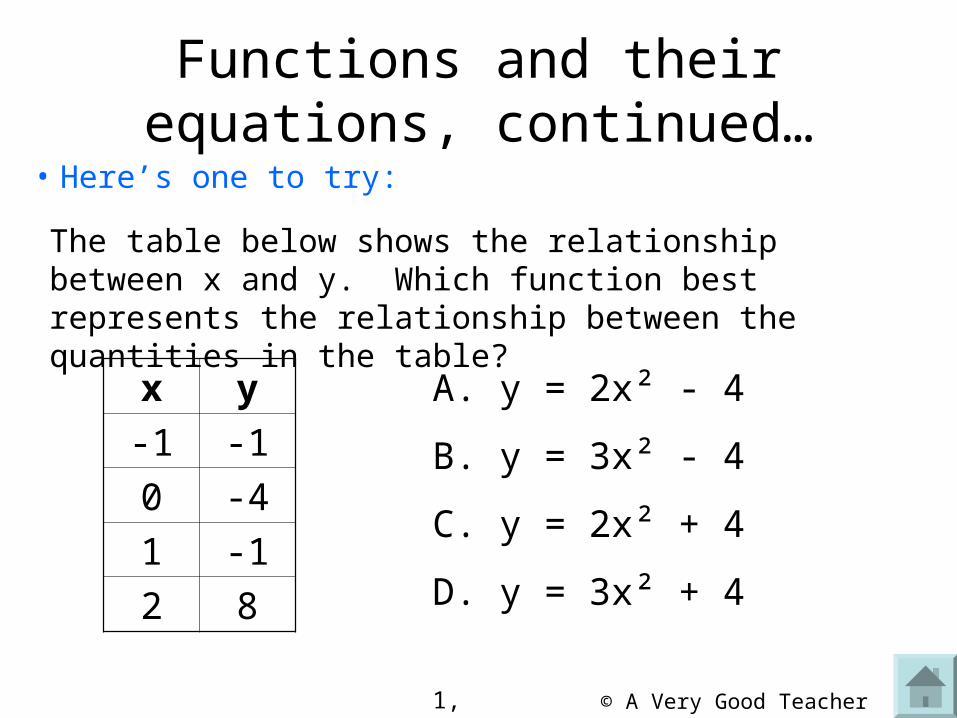
• Here’s one to try:The table below shows the relationship between x and y. Which function best represents the relationship between the quantities in the table?
x y
-1 -1
0 -4
1 -1
2 8
1, Ab1B
A. y = 2x² - 4
B. y = 3x² - 4
C. y = 2x² + 4
D. y = 3x² + 4
© A Very Good Teacher 2007
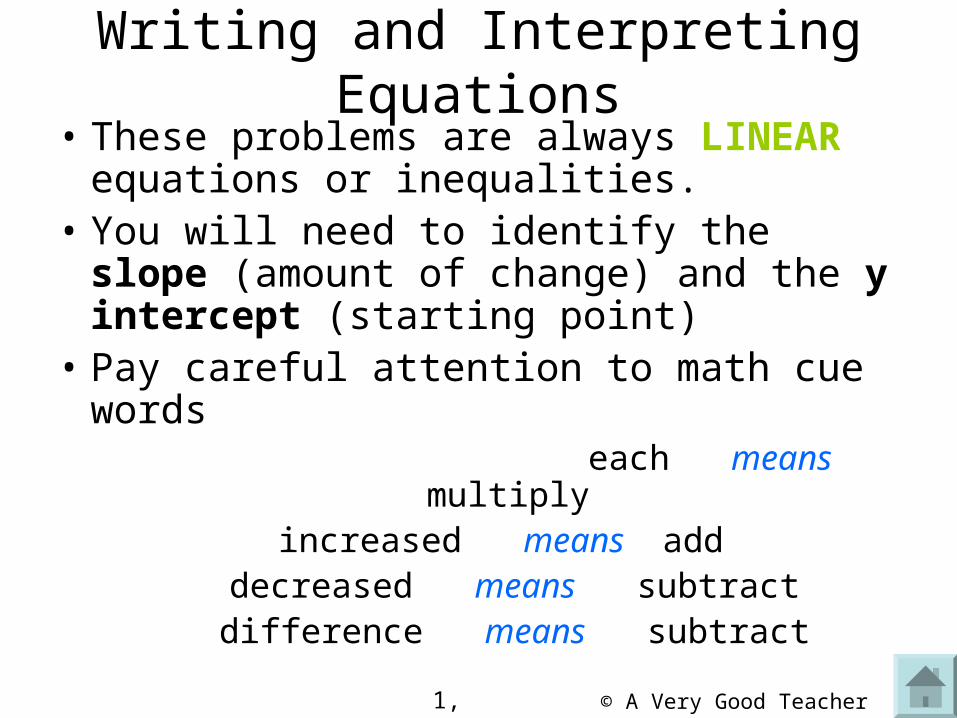
Writing and Interpreting Equations• These problems are always LINEAR
equations or inequalities. • You will need to identify the slope
(amount of change) and the y intercept (starting point)
• Pay careful attention to math cue words each means multiply
increased means adddecreased means subtractdifference means subtract
1, Ab1C
© A Very Good Teacher 2007
Writing and Interpreting Equations, continued…
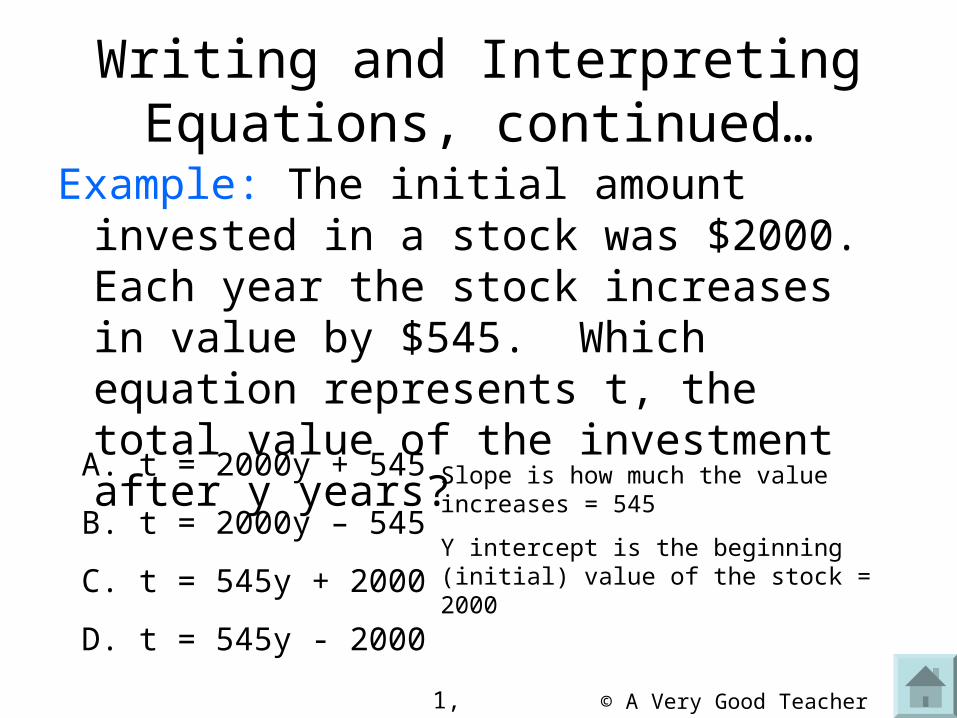
Example: The initial amount invested in a stock was $2000. Each year the stock increases in value by $545. Which equation represents t, the total value of the investment after y years?
A. t = 2000y + 545
B. t = 2000y – 545
C. t = 545y + 2000
D. t = 545y - 2000
1, Ab1C
Slope is how much the value increases = 545
Y intercept is the beginning (initial) value of the stock = 2000
© A Very Good Teacher 2007
Graphs of Functions
• You will be asked to match an equation or table to a graph.
• Your graphing calculator can assist you in these problems.
1, Ab1D
© A Very Good Teacher 2007
Graphs of Functions, continued…
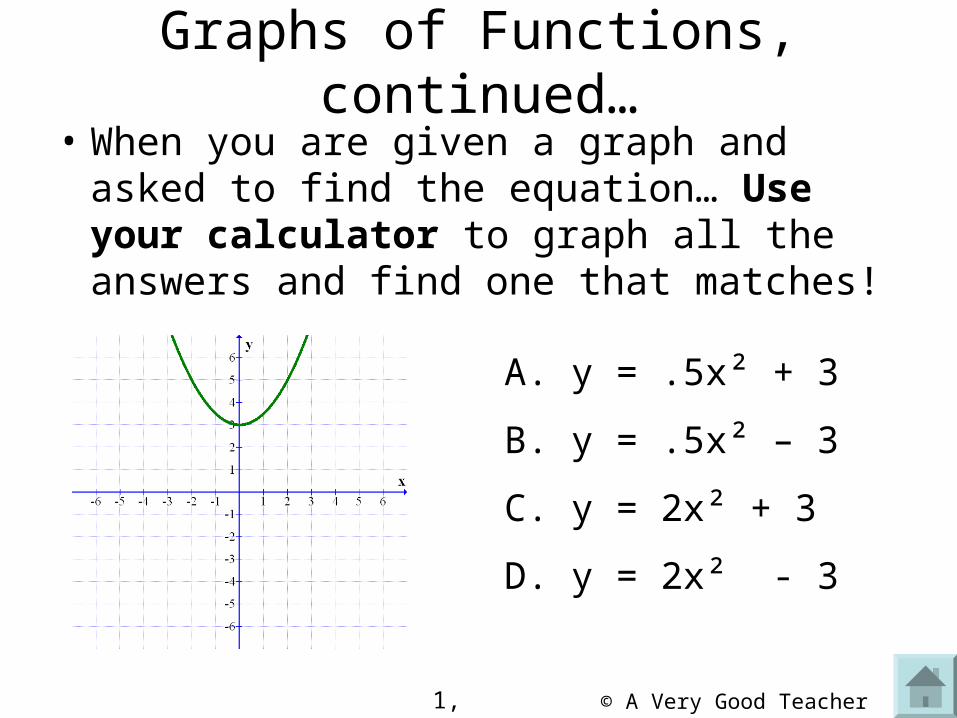
• When you are given a graph and asked to find the equation… Use your calculator to graph all the answers and find one that matches!
1, Ab1D
A. y = .5x² + 3
B. y = .5x² – 3
C. y = 2x² + 3
D. y = 2x² - 3
© A Very Good Teacher 2007
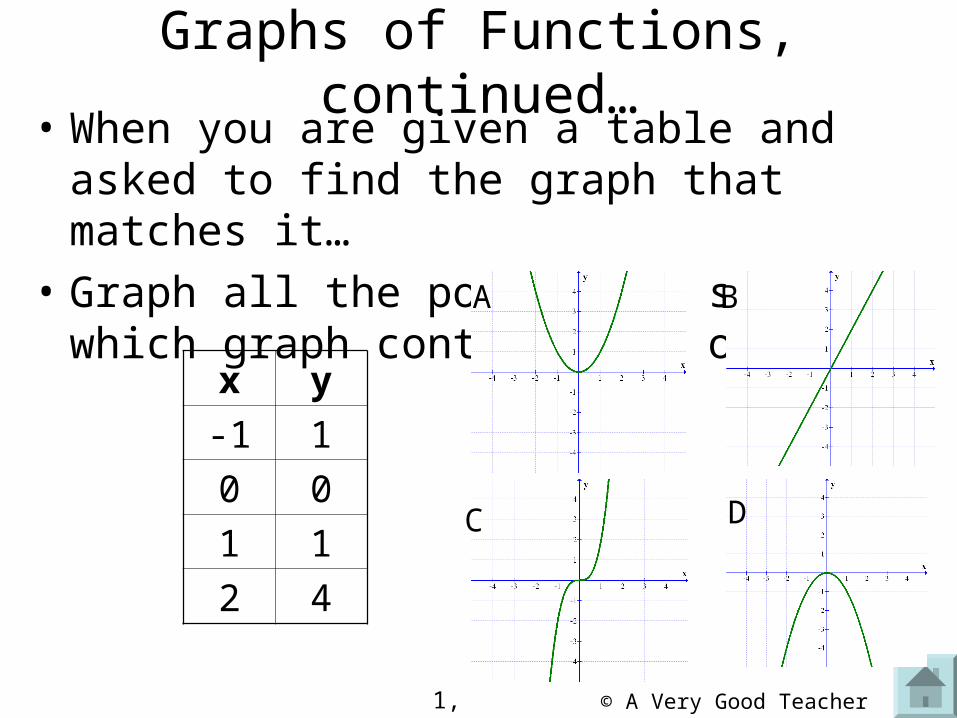
Graphs of Functions, continued…• When you are given a table and asked to
find the graph that matches it…
• Graph all the points and see which graph contains all of them
1, Ab1D
x y
-1 1
0 0
1 1
2 4
A B
C D
© A Very Good Teacher 2007
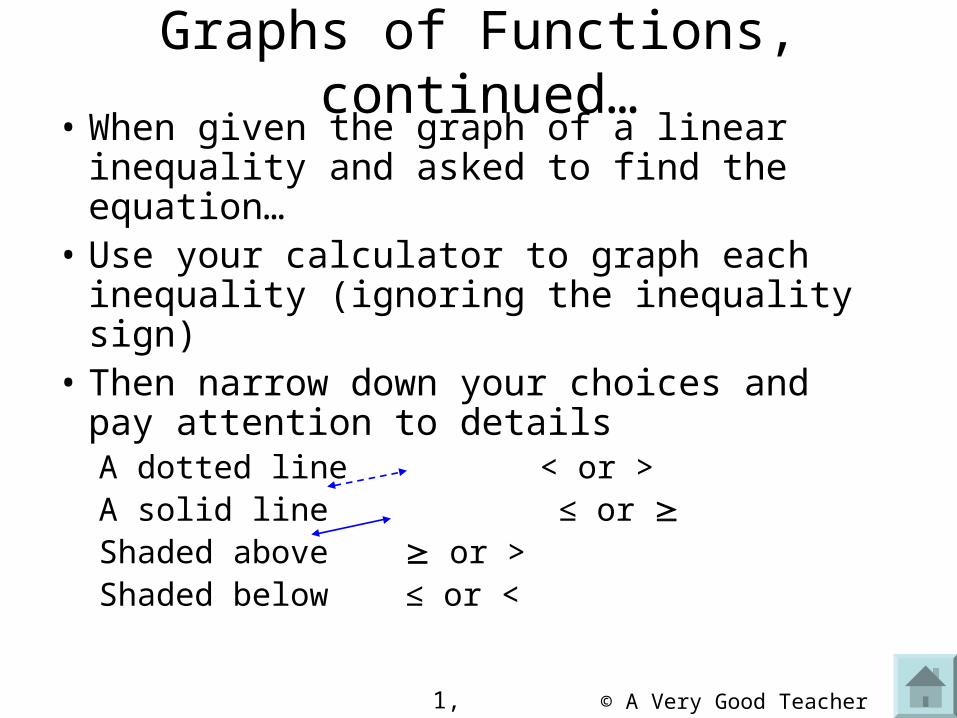
Graphs of Functions, continued…• When given the graph of a linear inequality
and asked to find the equation…• Use your calculator to graph each
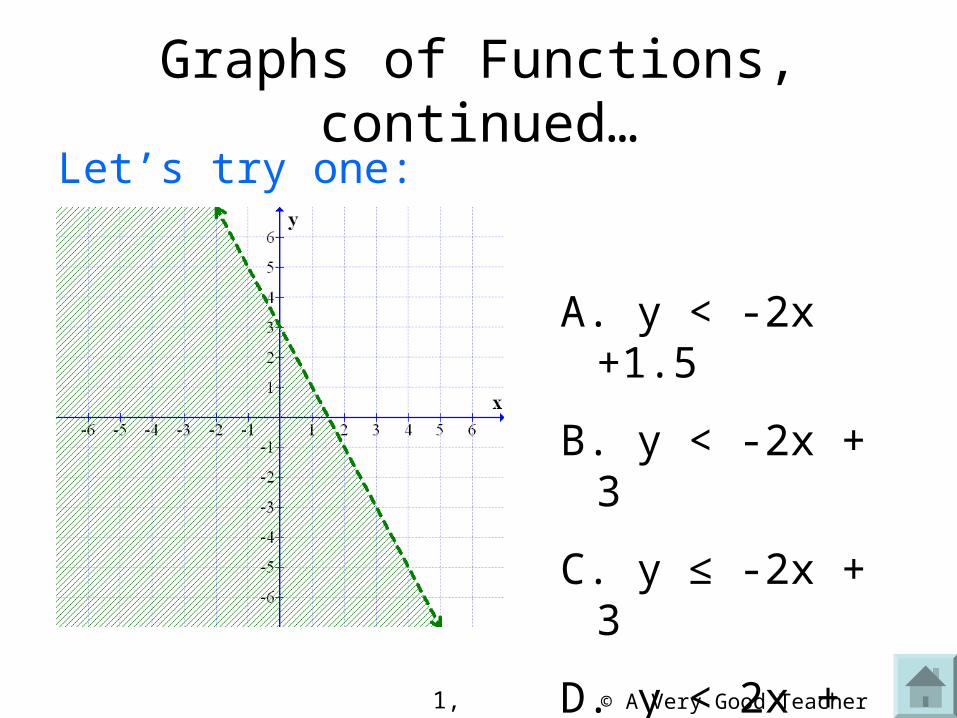
inequality (ignoring the inequality sign)• Then narrow down your choices and pay
attention to detailsA dotted line < or >A solid line ≤ or Shaded above or >Shaded below ≤ or <
1, Ab1D
© A Very Good Teacher 2007
Graphs of Functions, continued…Let’s try one:
1, Ab1D
A. y < -2x +1.5
B. y < -2x + 3
C. y ≤ -2x + 3
D. y < 2x + 3
© A Very Good Teacher 2007
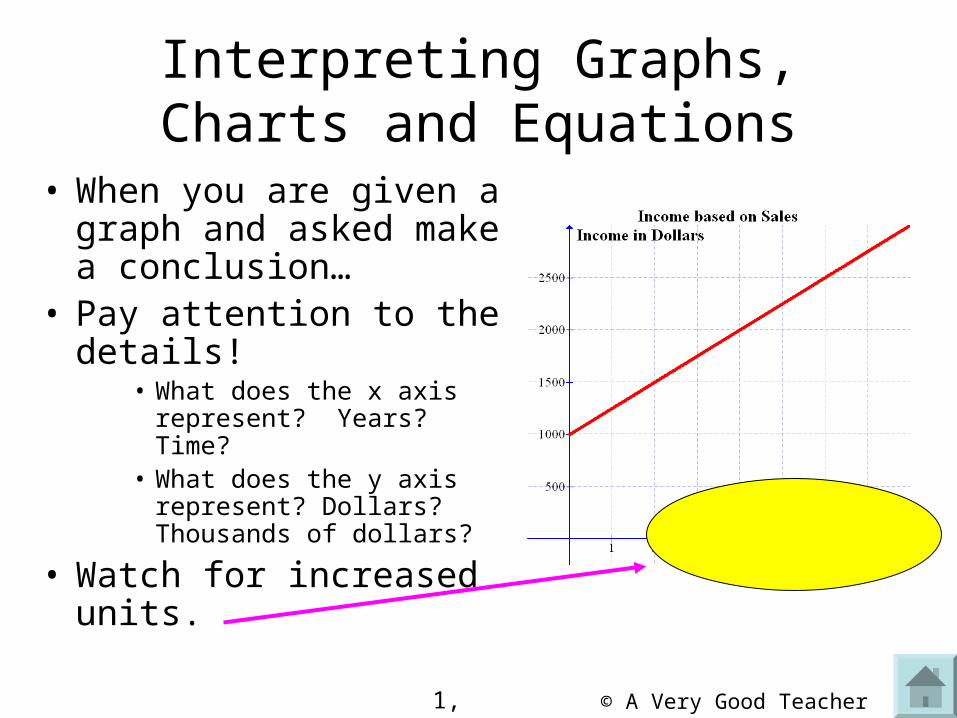
Interpreting Graphs, Charts and Equations
• When you are given a graph and asked make a conclusion…
• Pay attention to the details!
• What does the x axis represent? Years? Time?
• What does the y axis represent? Dollars? Thousands of dollars?
• Watch for increased units.
1, Ab1E
© A Very Good Teacher 2007
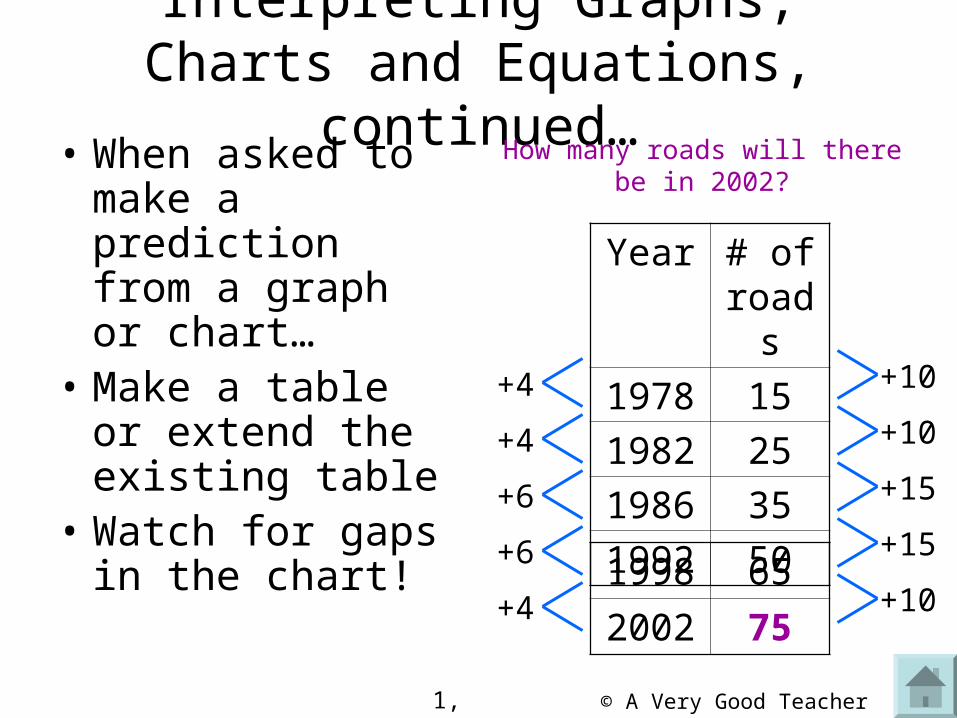
Interpreting Graphs, Charts and Equations, continued…
• When asked to make a prediction from a graph or chart…
• Make a table or extend the existing table
• Watch for gaps in the chart!
1, Ab1E
Year # of roads
1978 15
1982 25
1986 35
1992 50
+4
+4
+6
+10
+10
+15
How many roads will there be in 2002?
1998
2002 75
65+15
+10
+6
+4
© A Very Good Teacher 2007
Interpreting Graphs, Charts and Equations, continued…
• When interpreting equations remember that they are LINEAR situations
• Identify the slope (rate of change) and the y intercept (beginning value)
• Pay close attention to the details like decimals that represent percents
1, Ab1E
© A Very Good Teacher 2007
Interpreting Graphs, Charts and Equations, continued…
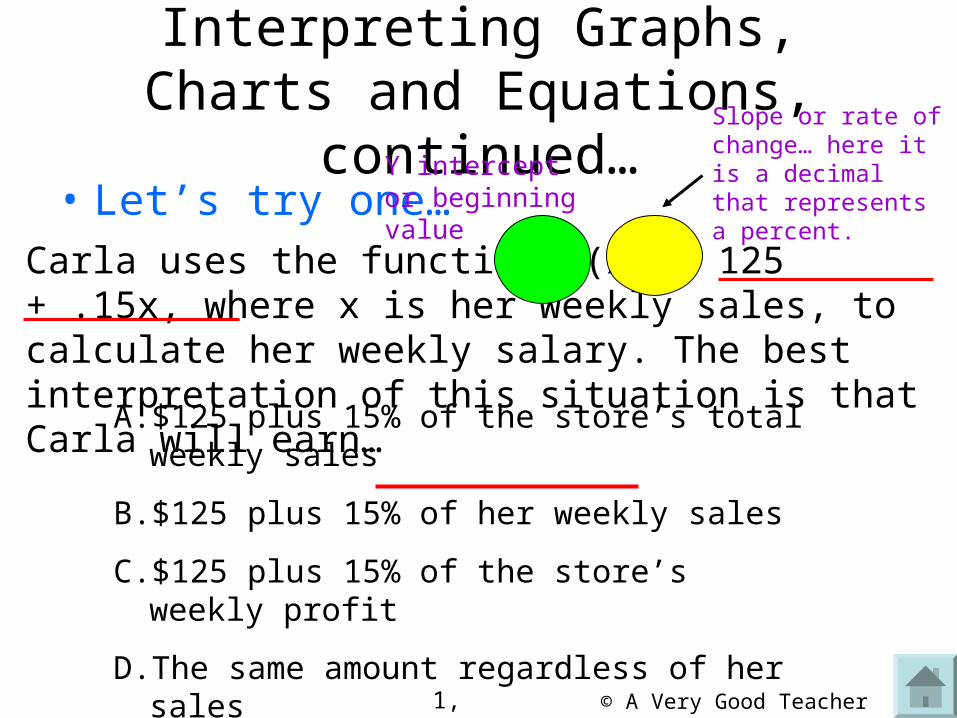
• Let’s try one…
1, Ab1E
Carla uses the function f(x) = 125 + .15x, where x is her weekly sales, to calculate her weekly salary. The best interpretation of this situation is that Carla will earn…
A. $125 plus 15% of the store’s total weekly sales
B. $125 plus 15% of her weekly sales
C.$125 plus 15% of the store’s weekly profit
D.The same amount regardless of her sales
Slope or rate of change… here it is a decimal that represents a percent.
Y intercept or beginning value


