108
| Date post: | 24-Dec-2015 |
| Category: |
Documents |
| Upload: | moses-barnett |
| View: | 213 times |
| Download: | 0 times |


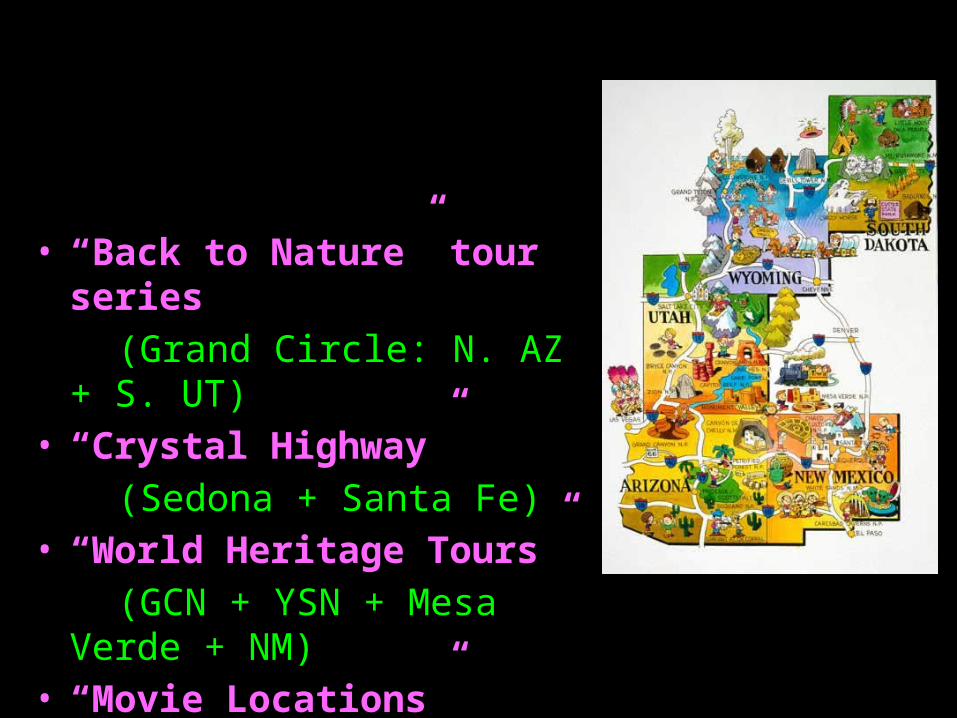
• “Back to Nature” tour series (Grand Circle: N. AZ + S. UT)
• “Crystal Highway”(Sedona + Santa Fe)
• “World Heritage Tours”(GCN + YSN + Mesa Verde +
NM)• “Movie Locations”
(WY + UT + Arizona)

FY 1996 FY 1997 FY 1998 FY 1999 FY 2000 FY 2001 FY 2002 FY 2003
Total # of Tours Featuring Arizona
305 527 464 566 1,010 1,202 1,037 1,271
Change in % to previous year
- +73% -12% +22% +78% +19% -14% +22%
FY 2004
FY 2005 FY 2006 FY 2007 FY 2008 FY 2009 FY 2010
Total # of Tours Featuring Arizona
1,546 1,710 2,364 807 1,559 1,705 1,750
Change in % to previous year
+22% +11% +38% -193% +93% +9% +3%
Summary of Tour Product Inventory since FY1996
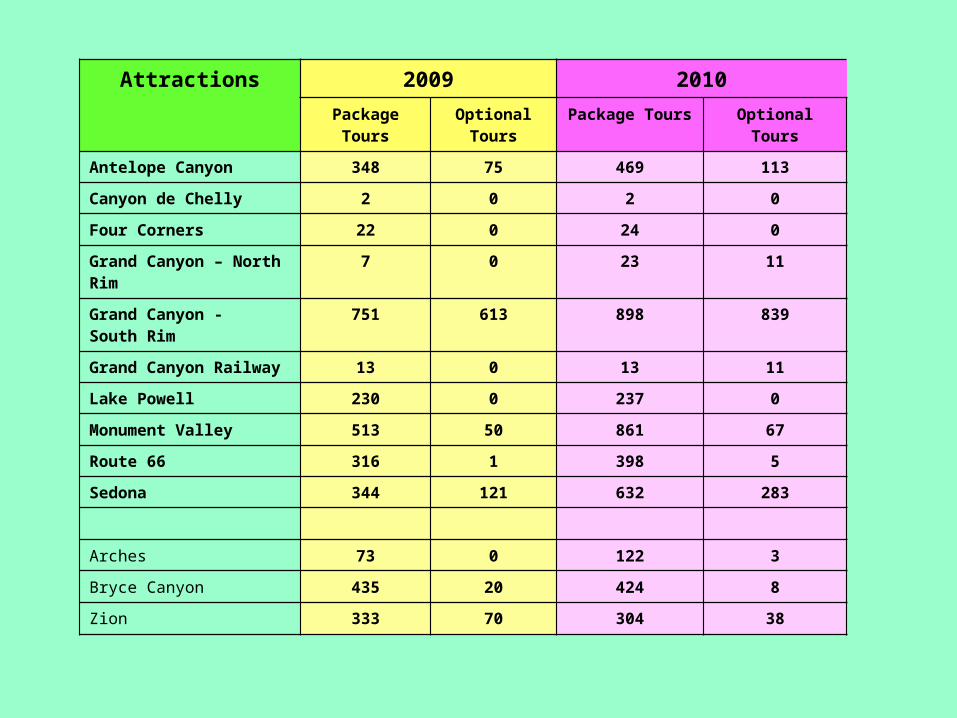
Attractions 2009 2010Package Tours Optional Tours Package Tours Optional Tours
Antelope Canyon 348 75 469 113
Canyon de Chelly 2 0 2 0
Four Corners 22 0 24 0
Grand Canyon – North Rim 7 0 23 11
Grand Canyon -South Rim
751 613 898 839
Grand Canyon Railway 13 0 13 11
Lake Powell 230 0 237 0
Monument Valley 513 50 861 67
Route 66 316 1 398 5
Sedona 344 121 632 283
Arches 73 0 122 3
Bryce Canyon 435 20 424 8
Zion 333 70 304 38


Arizona Office of TourismCoconino County District 5Flagstaff Convention & Visitors BureauMetropolitan Tucson Convention & Visitors BureauNorthern Arizona Council of Government (NACOG)Page Lake Powell TourismPrescott TourismPrescott Valley Sedona Chamber of CommerceThe Navajo Nation Parks & Recreation Department
Antelope Canyon ToursGrand Canyon RailwayLake Powell Resort & Marinas


1. LA Sales Mission
2. Las Vegas Sales Mission
3. Japan Sales Mission
4. Conducting Destination Development Seminars
5. Initiating & Arranging Familiarization Tours
* Participation fee for sales missions will be waived for the Coalition members.

Destination Development seminar in Tokyo
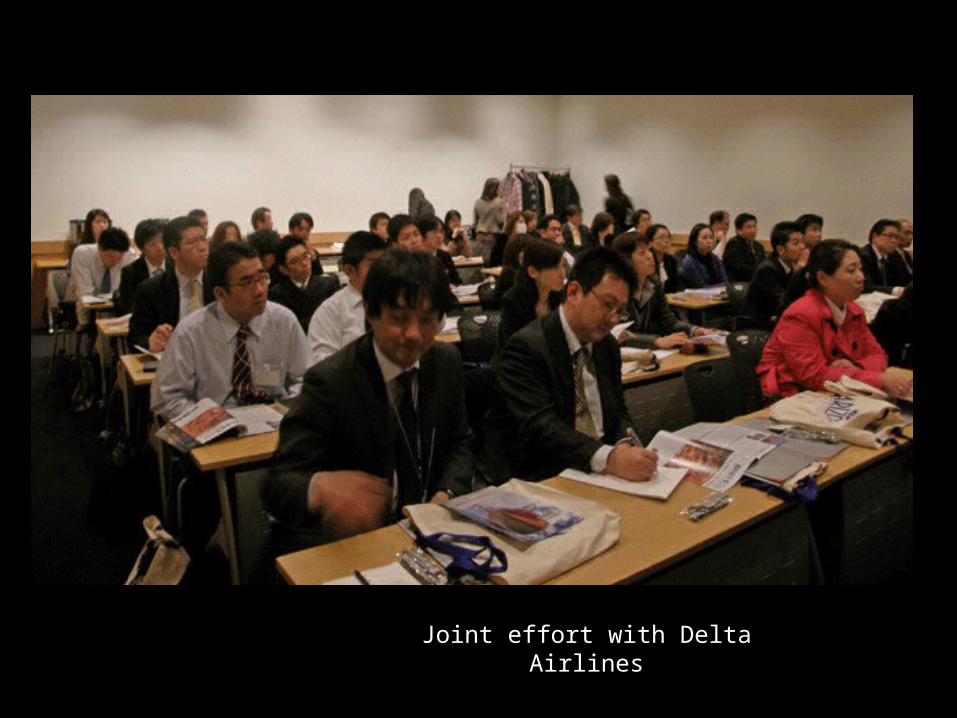
Joint effort with Delta Airlines
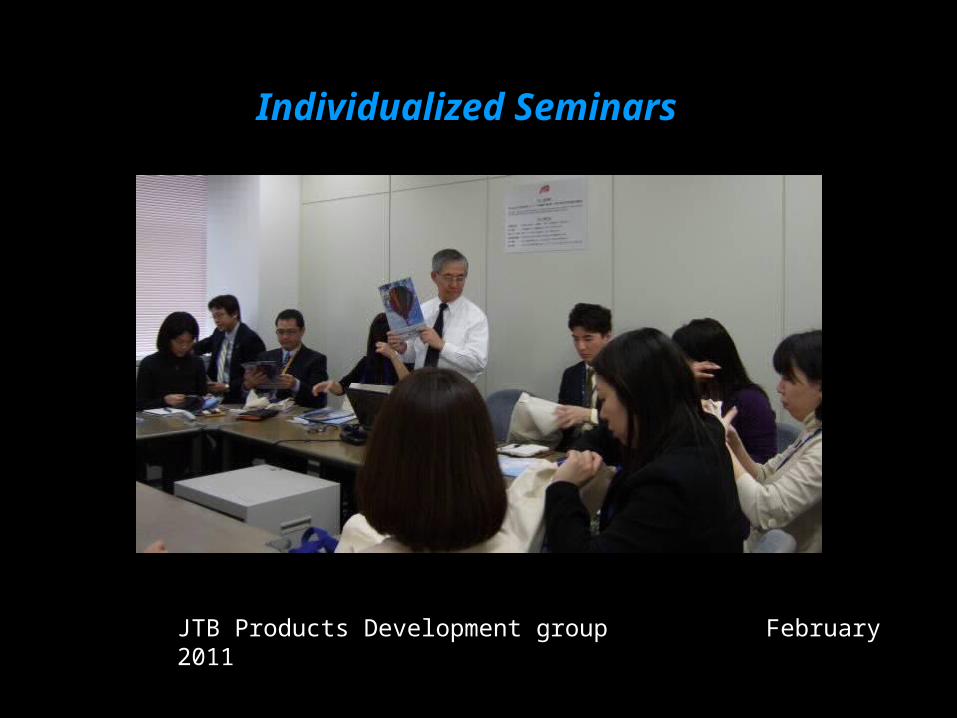
Individualized Seminars
JTB Products Development group February 2011
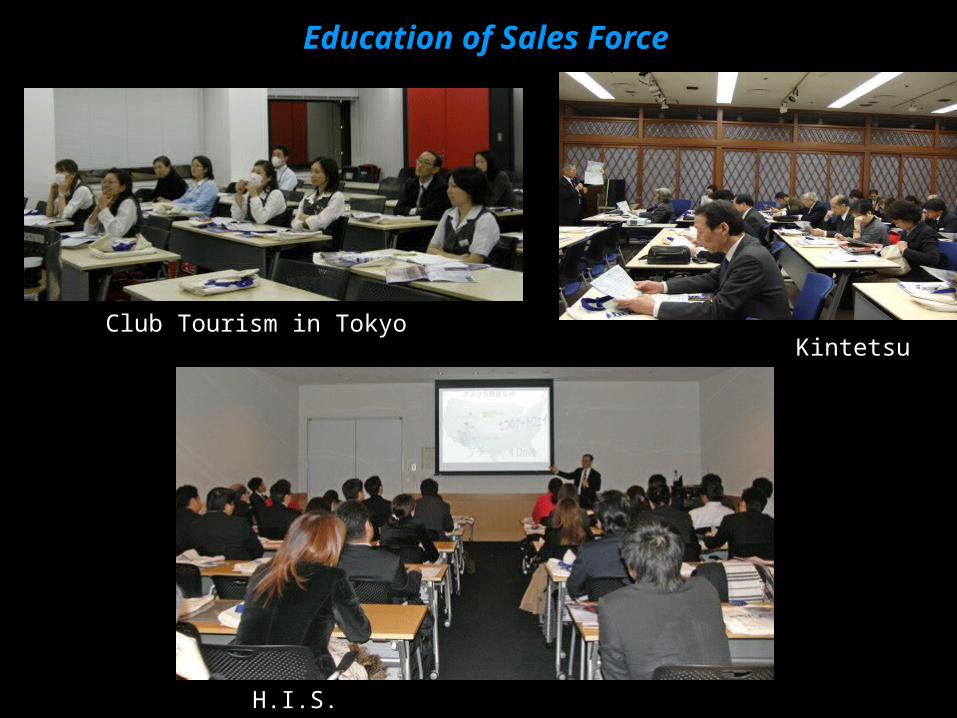
H.I.S.
Club Tourism in TokyoKintetsu
Education of Sales Force
• Hiking: 110,000 steps to conquer the Grand Circle
• Photography: Picture perfect locations
• Movie Locations: Popular movies
• Power Spot: Healing & Spiritual Experiences
• Astrotourism: Star gazing & Night sky photography

Hike in the Grand
Canyon
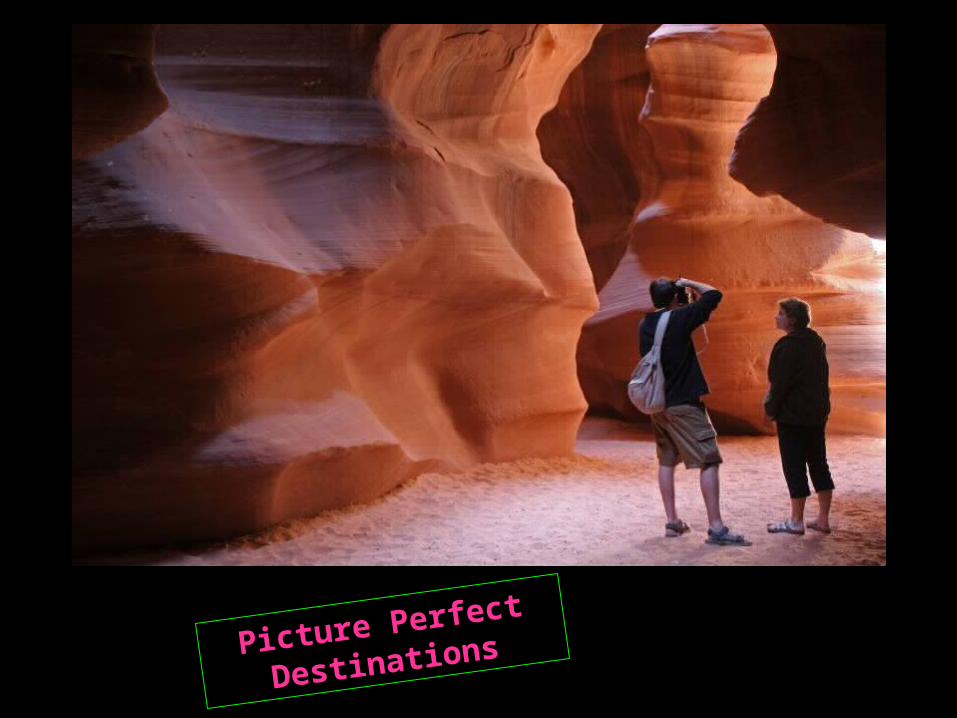
Picture Perfect
Destinations
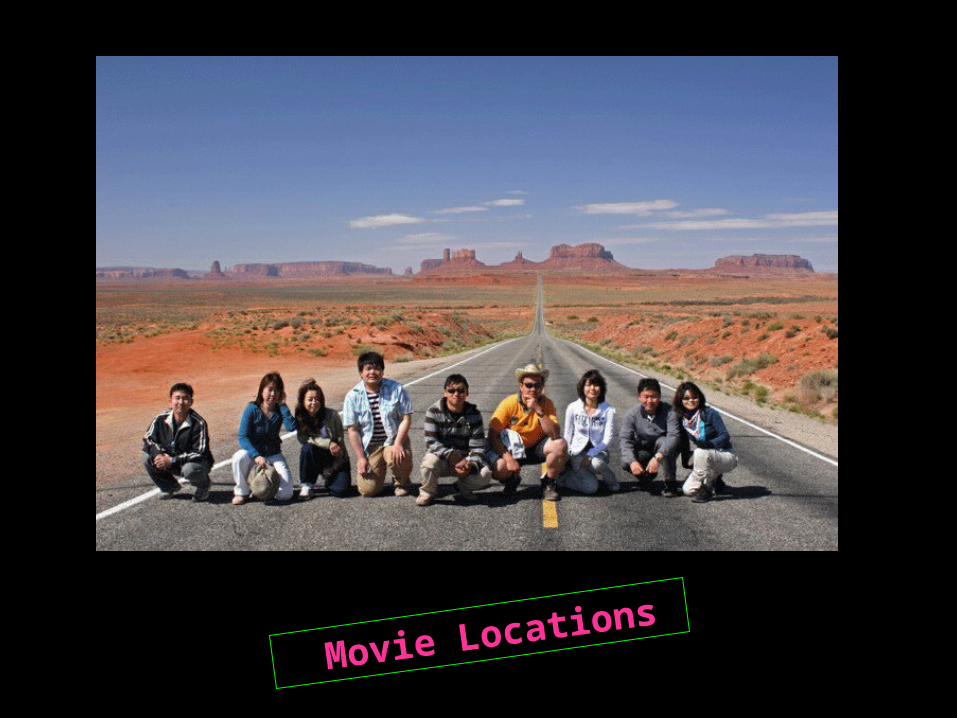
Movie Locations

Healing & Power
Spot

Astrotourism


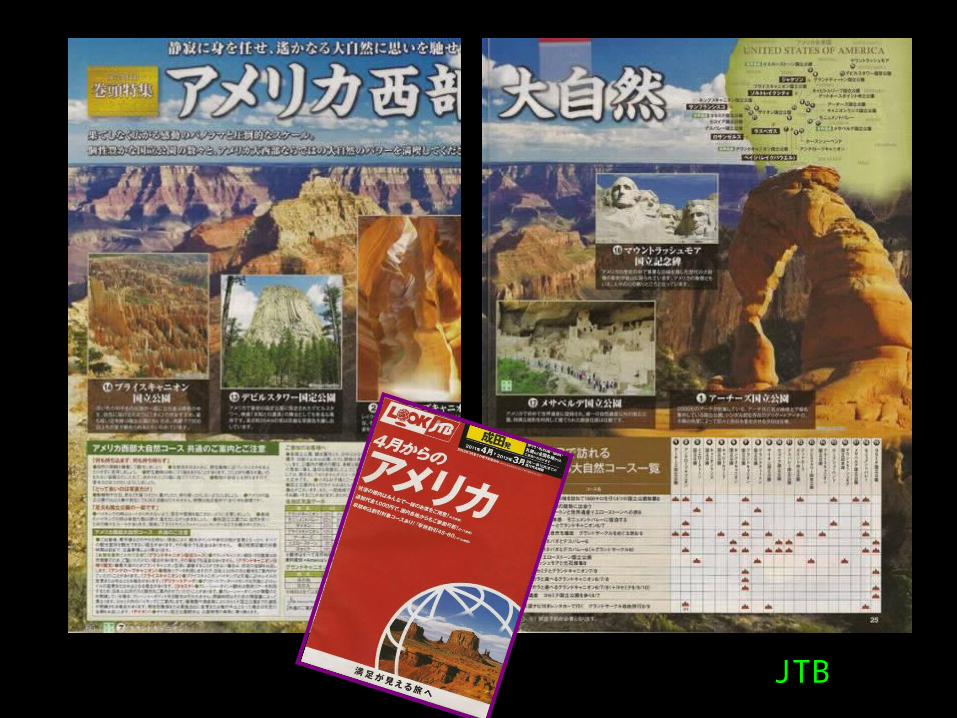
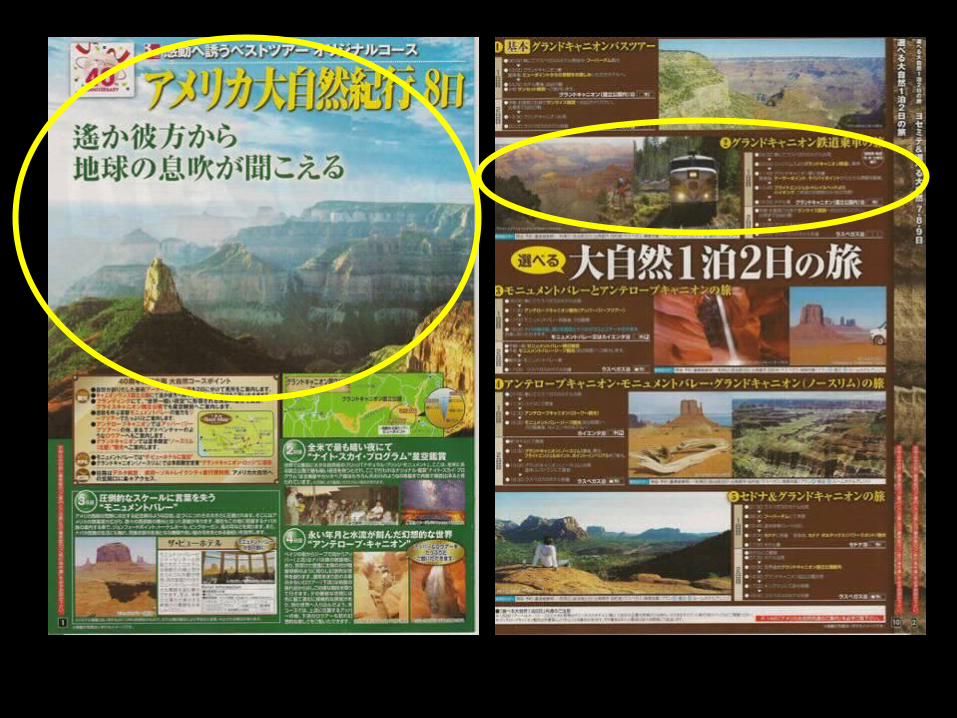
JTB
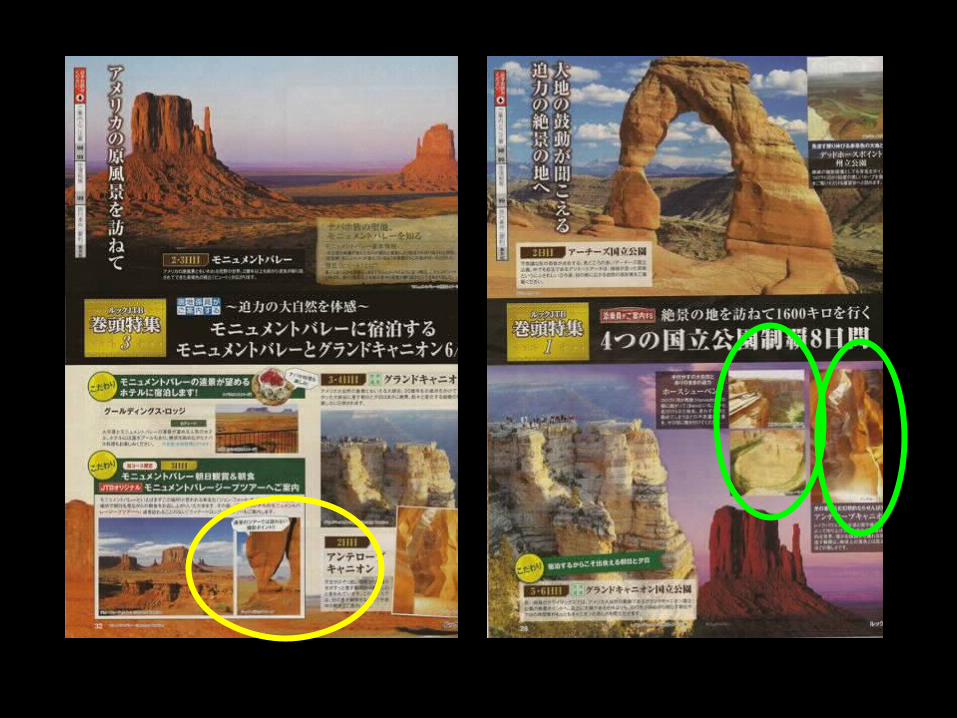


JTB Media


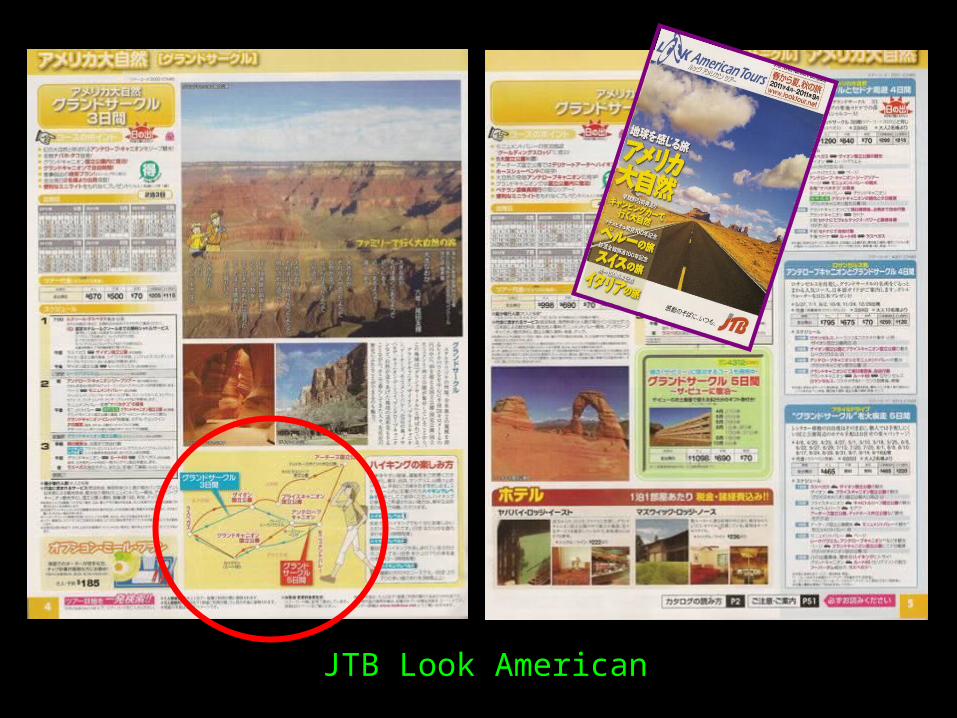
JTB Look American


Kintetsu International Express

NTA (Nippon Travel Agency)

Kintetsu Luxe Collections

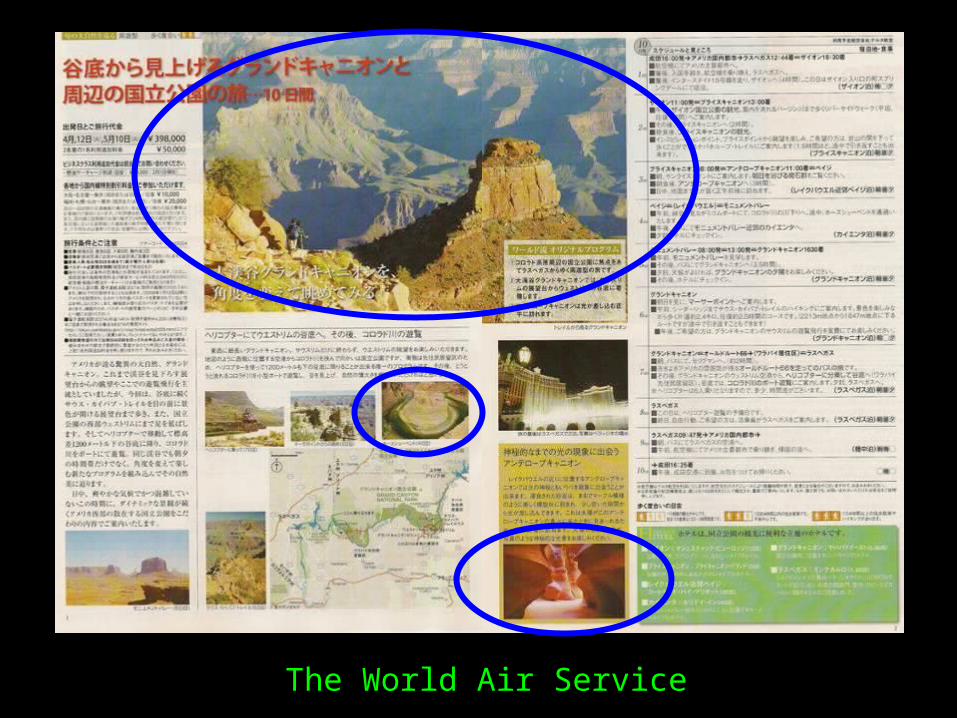
The World Air Service
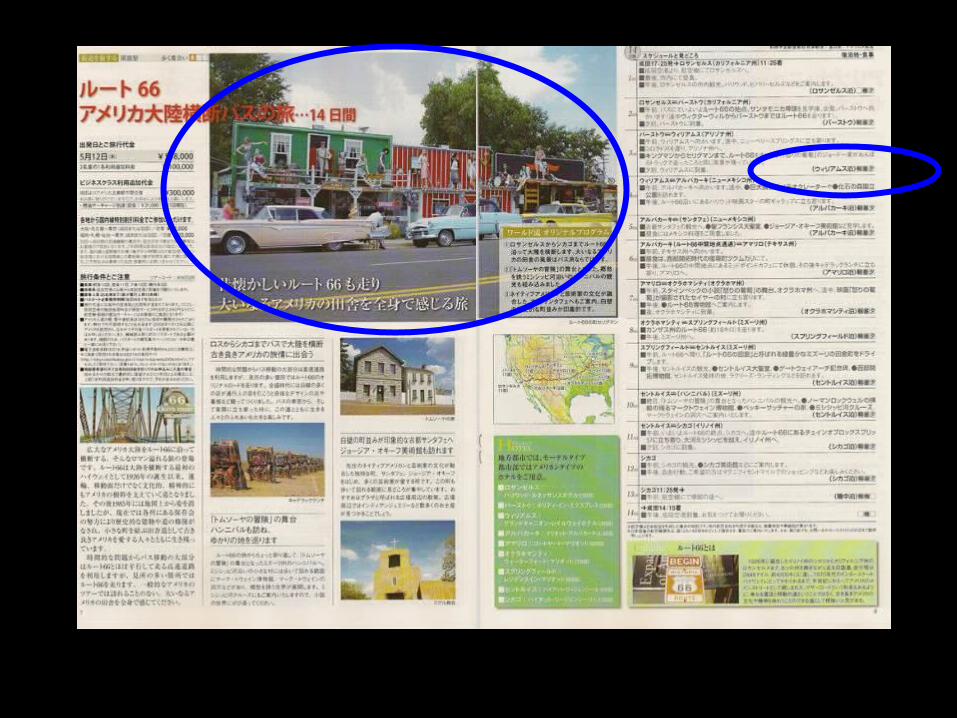
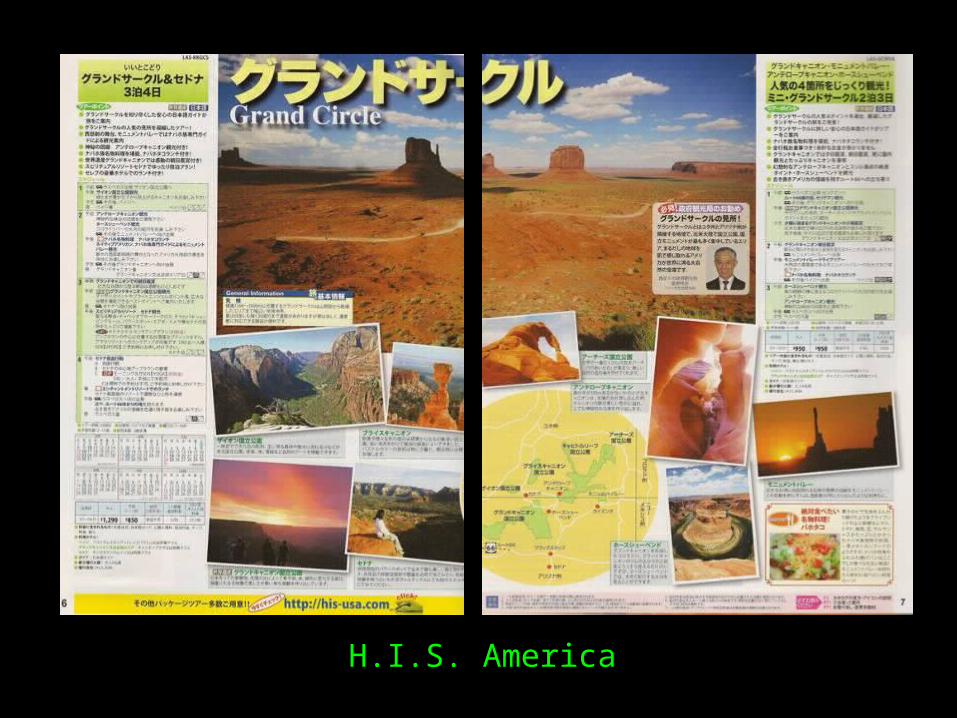
H.I.S. America


1. Initiating & Arranging Press Tours
2. The W’est Publication

Publication: WING TRAVEL
Circulation: 70,000
Coverage: 2 pages


Publication: Globe Trotters Travel
Guide
Circulation: 80,000
Coverage: 93 pages

• A 128 page publication
• 20,000 Circulation
• Sold in Nationwide Bookstores

Publication: HERS
Circulation: 80,000
Coverage: 10 pages


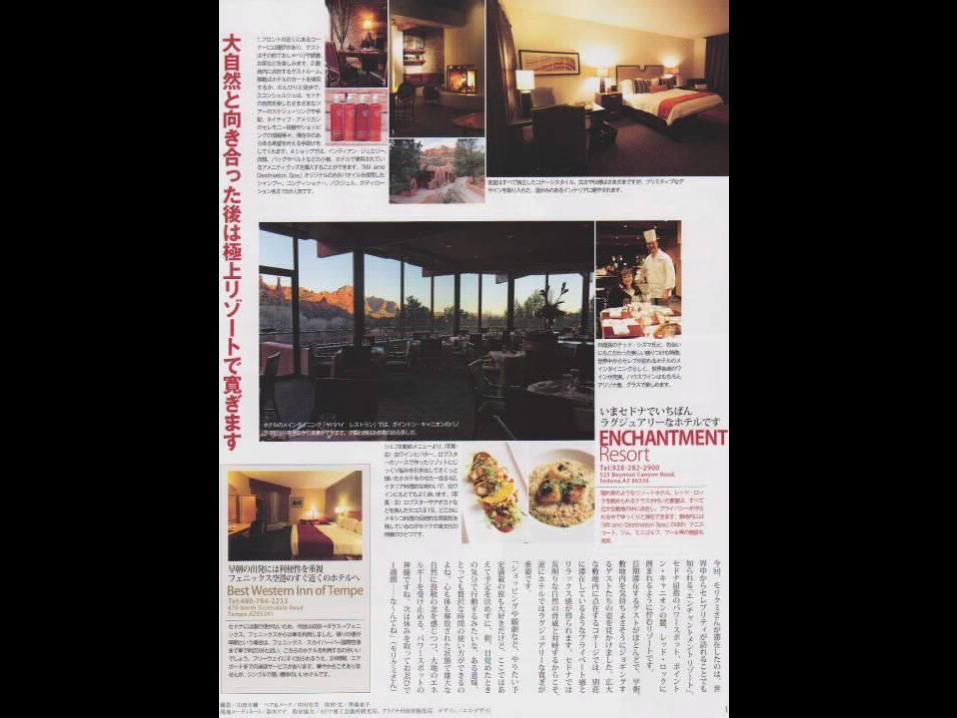
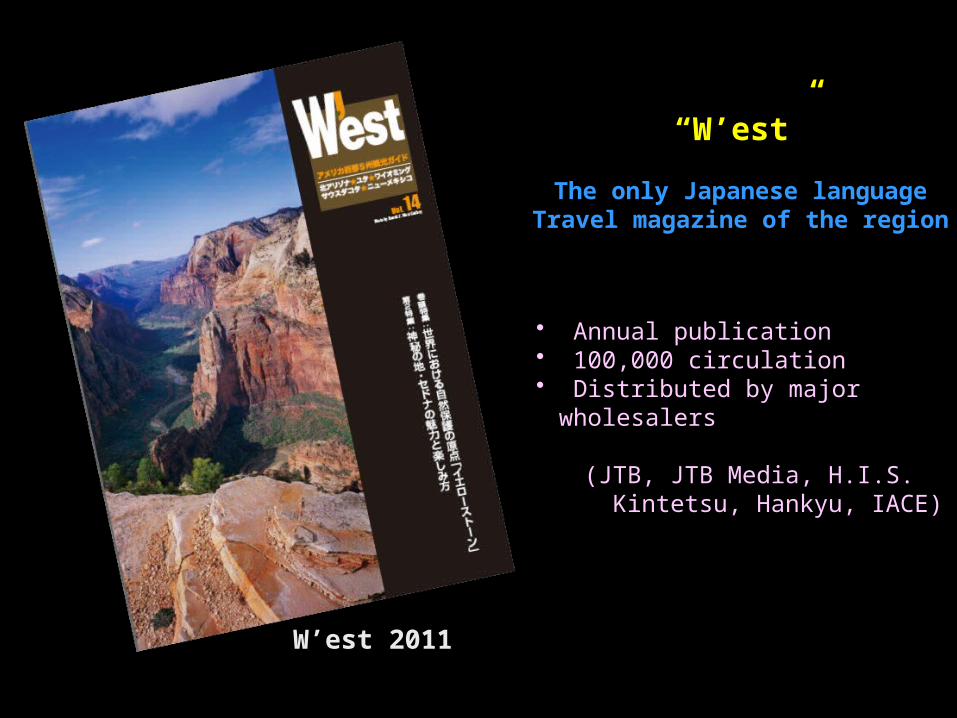
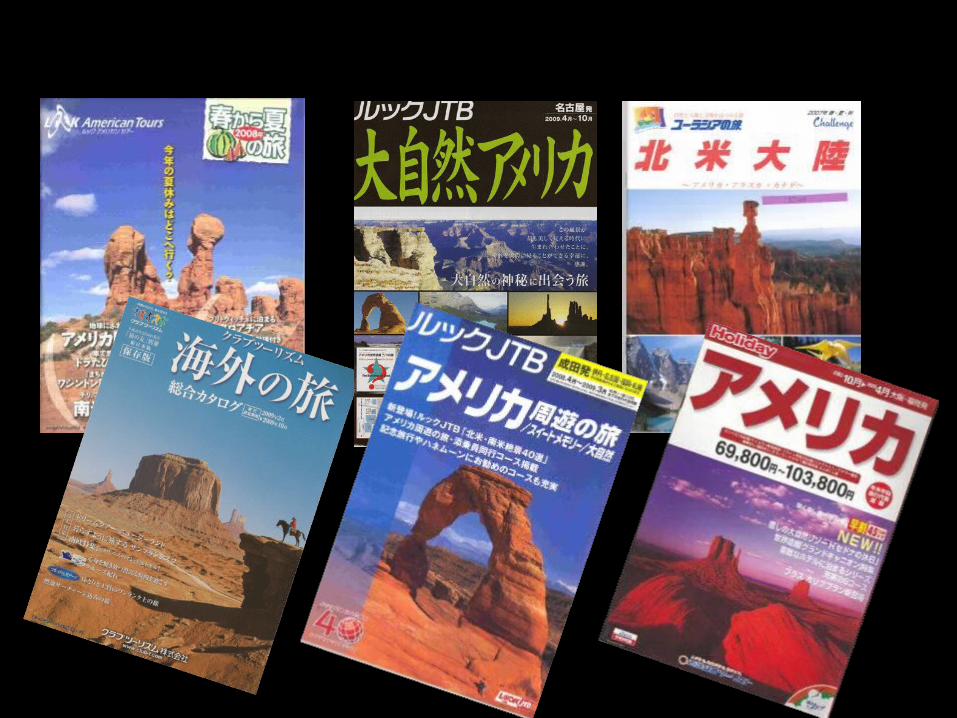
W’est 2011
“W’est”
The only Japanese languageTravel magazine of the region
• Annual publication• 100,000 circulation• Distributed by major wholesalers
(JTB, JTB Media, H.I.S. Kintetsu, Hankyu, IACE)


CY 2010 Unique Users 189,302
Page View 502,740
Total Hits6,330,594

1. Response to Inquiries
2. Sending Response Pieces

1. Send Monthly Report
2. Provide Product Inventory

日本Japan

6,000 miles away

Total Land Area:
1/25 of the United States
Equivalent to Germany & Switzerland combined.
Or
Slightly smaller than California.
Or
About the same as Montana
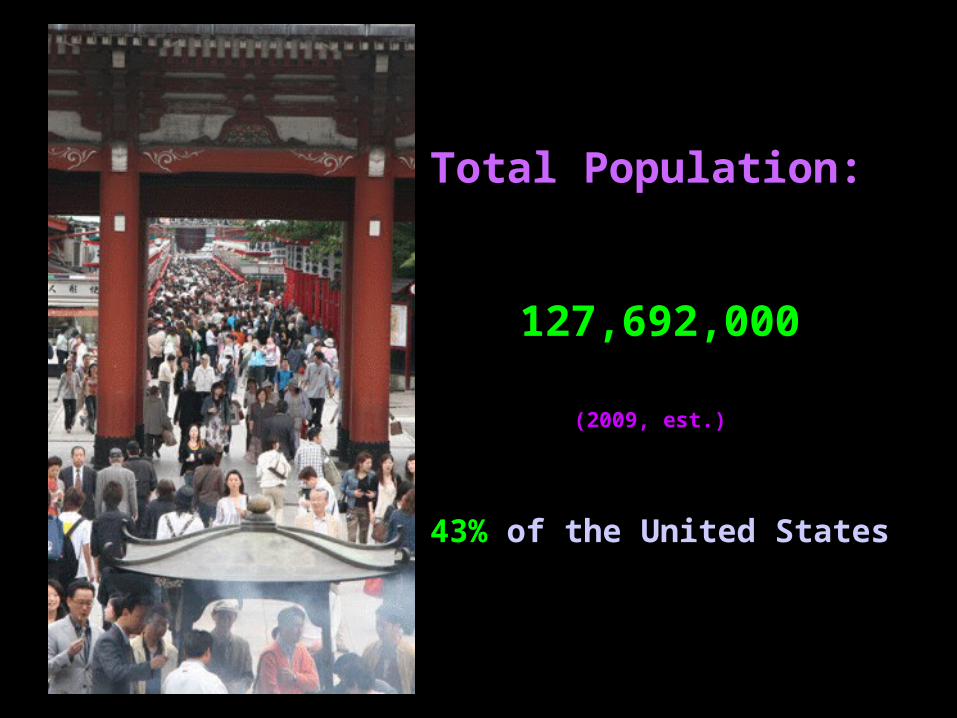
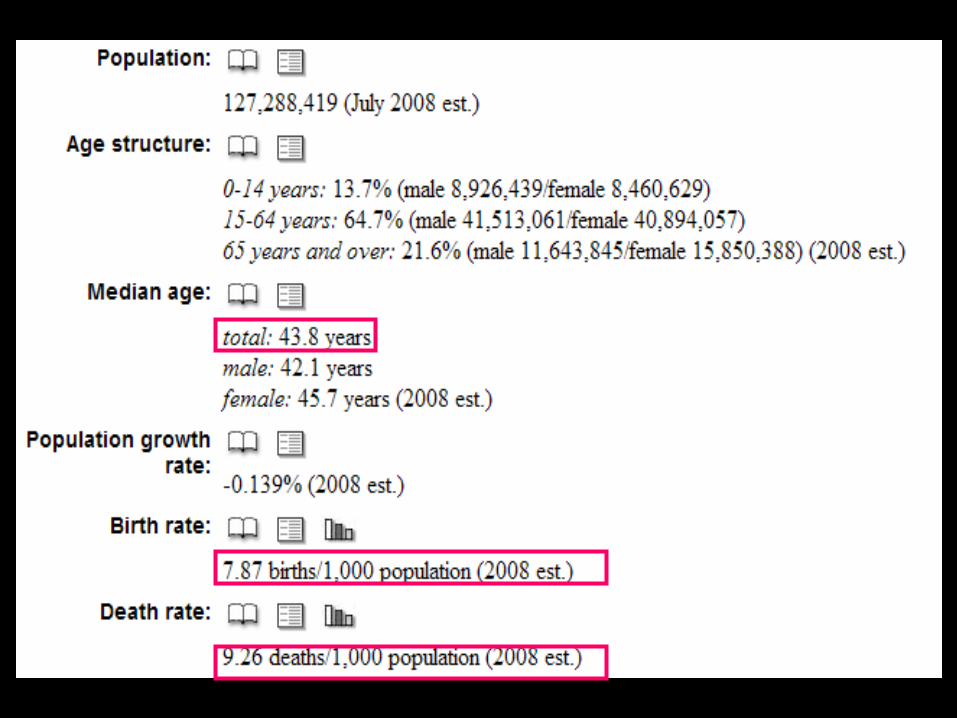
Total Population:
127,692,000
(2009, est.)
43% of the United States
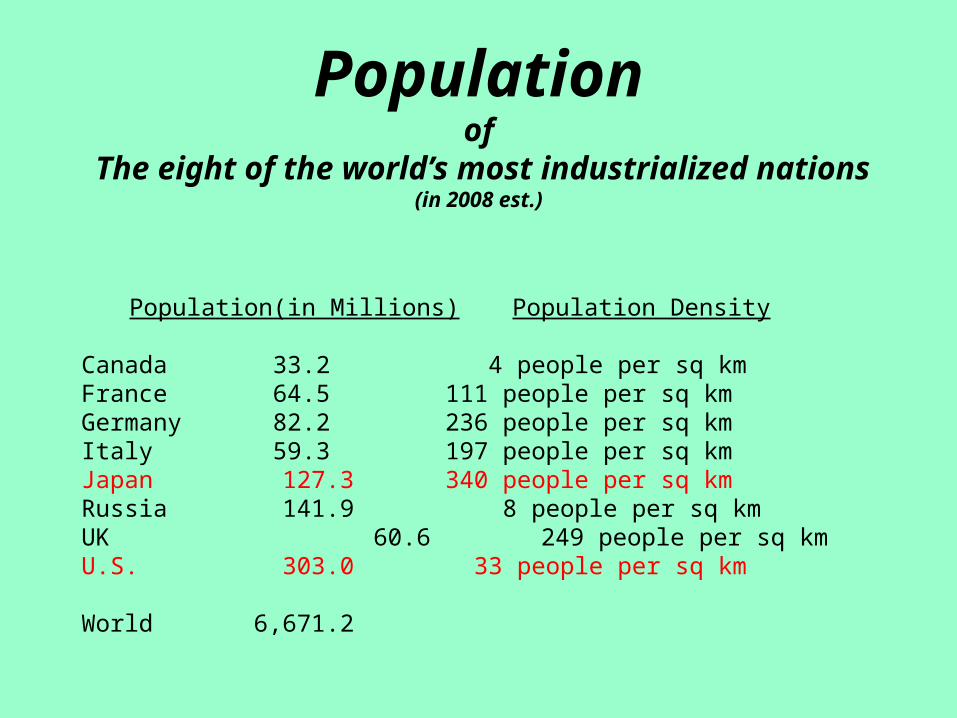
Populationof
The eight of the world’s most industrialized nations(in 2008 est.)
Population(in Millions) Population Density
Canada 33.2 4 people per sq kmFrance 64.5 111 people per sq kmGermany 82.2 236 people per sq kmItaly 59.3 197 people per sq kmJapan 127.3 340 people per sq kmRussia 141.9 8 people per sq kmUK 60.6 249 people per sq kmU.S. 303.0 33 people per sq km
World 6,671.2


HOUSEHOLD INCOME--------------------------------------------------
Average HH Income $83,000
≤ $40,000 19.4%
$40,000 ~ $79,999 38.0%
$80,000 ~ $119,999 18.1%
$120,000 + 24.6%
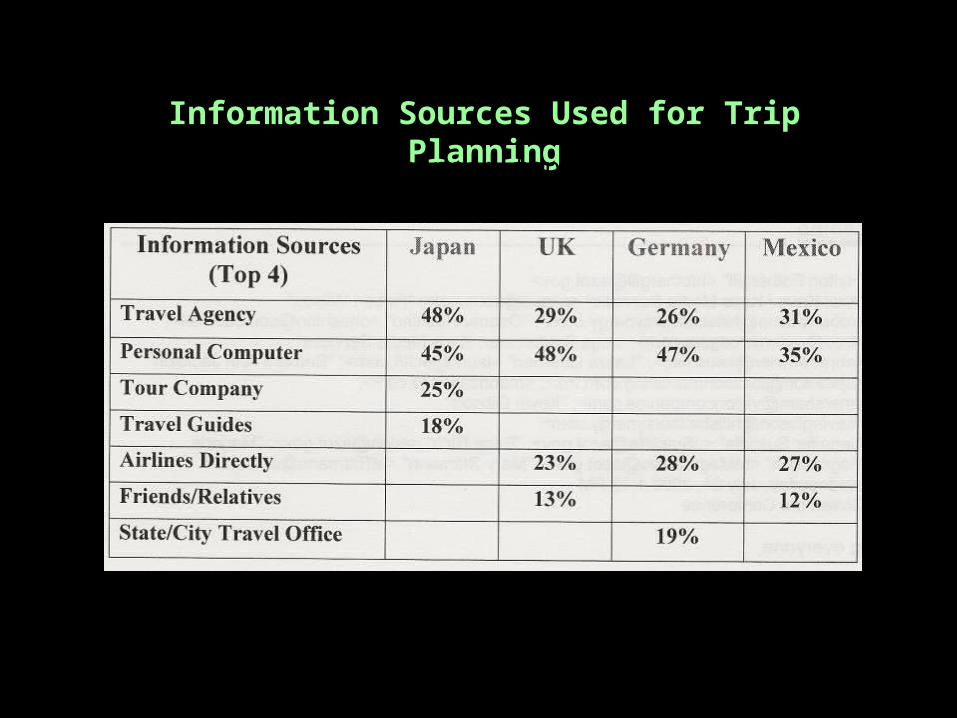
Information Sources Used for Trip Planning
(Multiple response: top 4 of 12)


International Visitor Spending in the U.S.
Arrivals by Country
1 Canada 17.96 Million
2 Mexico 13.16 Million
3 United Kingdom 3.90 Million
4 Japan 2.92 Million
5 Germany 1.69 Million
6 France 1.20 Million
7 Brazil 893,000
8 Italy 753,000
9 South Korea 744,000
10 Australia 724,000
2009 Spending
Spending by Country
1 Canada $16.2 Billion
2 Japan 12.9 Billion
3 United Kingdom 12.1 Billion
4 Mexico 8.3 Billion
5 Germany 5.6 Billion
6 France 4.2 Billion
7 Brazil 4.2 Billion
8 India 3.6 Billion
9 China 3.5 Billion
10 Australia 3.3 Billion
International Visitation to the U.S.
2009 Arrivals
Canada: $900 per capita per visitJapan: $4,450 per capita per visitUK: $3,100 per capita per visitMexico: $630 per capita per visitGermany:$3,300 per capita per visit
Average Expenditures by a Visitor

1. Grand Canyon – South Rim2. Monument Valley3. Antelope Canyon4. Lake Powell5. Horseshoe Bend6. Route 667. Flagstaff8. Sedona
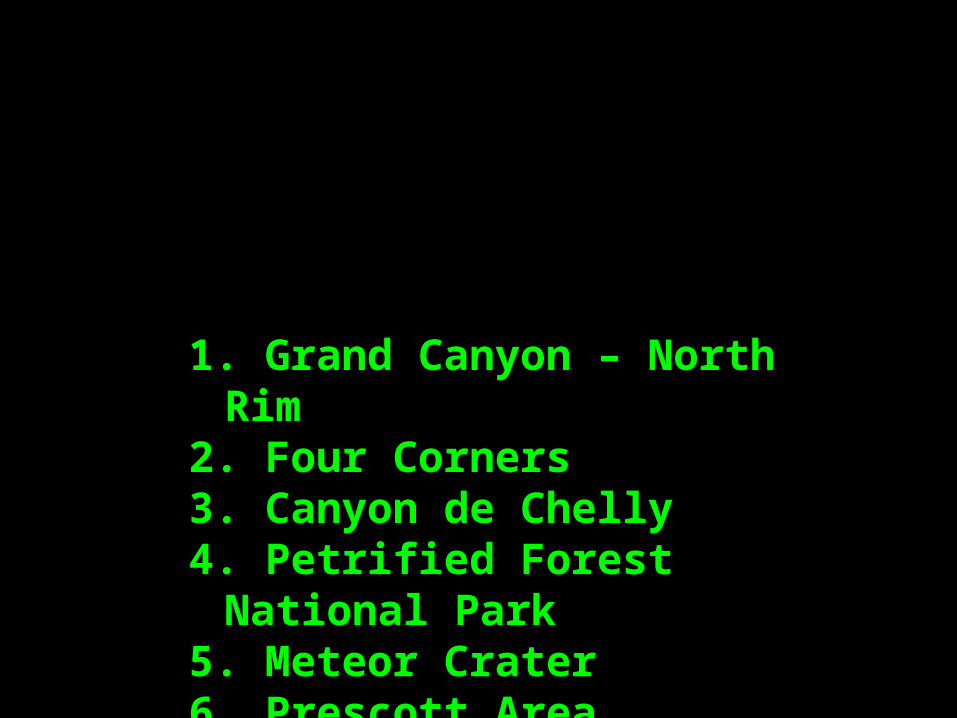
1. Grand Canyon – North Rim2. Four Corners3. Canyon de Chelly4. Petrified Forest National Park5. Meteor Crater6. Prescott Area
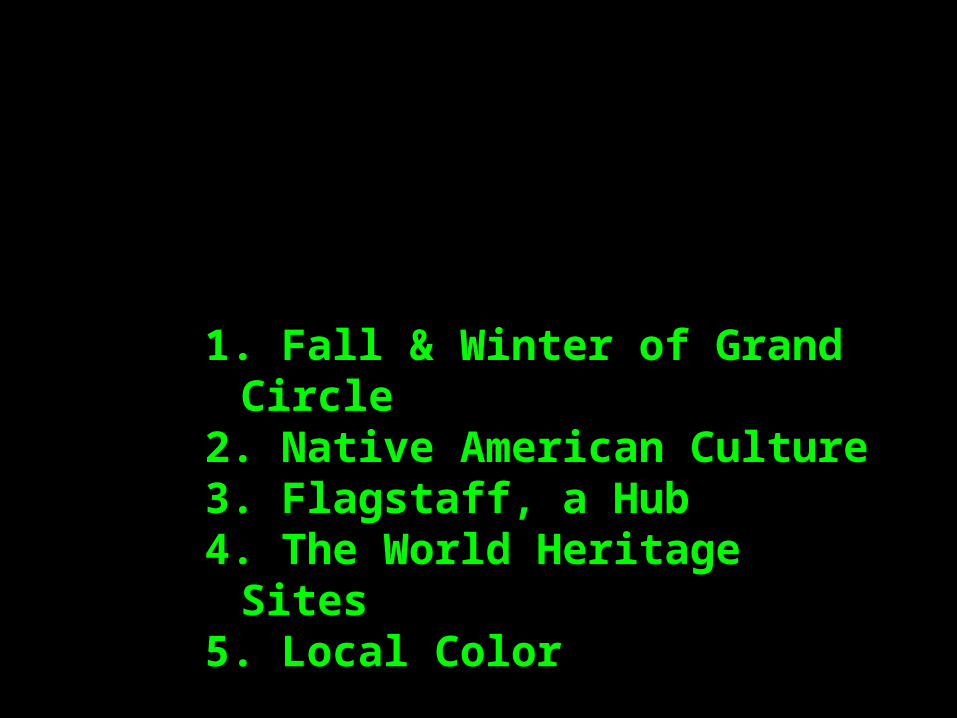
1. Fall & Winter of Grand Circle2. Native American Culture3. Flagstaff, a Hub 4. The World Heritage Sites5. Local Color

Opportunities
• The Grand Circle being ranked No. 1
By Nikkei Busienss
• The Baby Boomers Market
With Time & Money
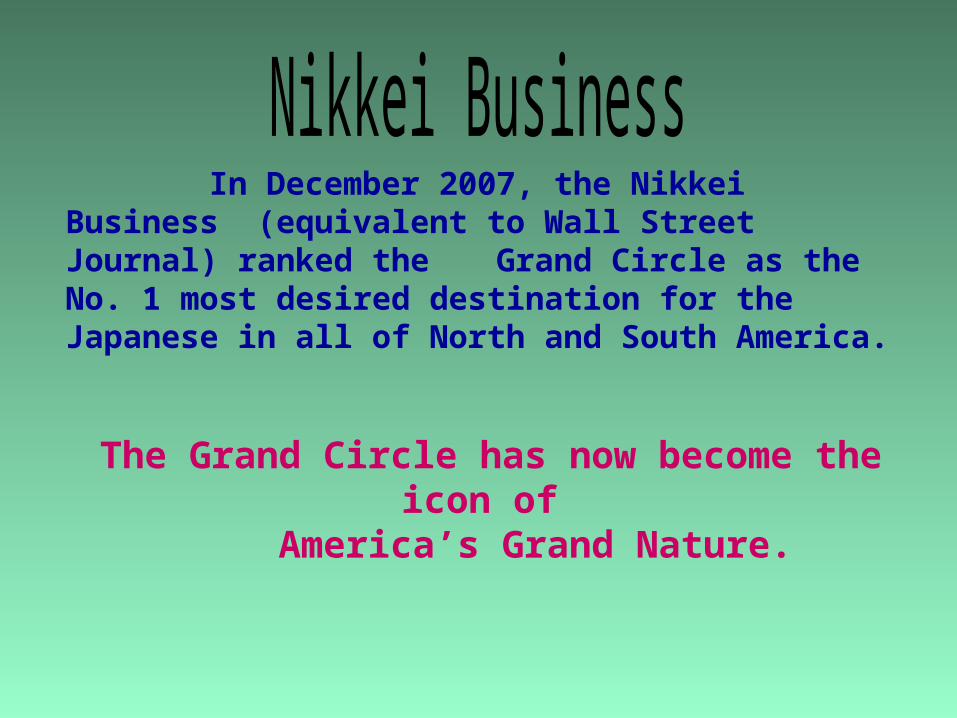
In December 2007, the Nikkei Business (equivalent to Wall Street Journal) ranked the Grand Circle as the No. 1 most desired destination for the Japanese in all of North and South America.
The Grand Circle has now become the icon of America’s Grand Nature.

2. Walt Disney World (680)3. Niagara Falls (570)4. San Francisco (450 ) 5 . Las Vegas (400 )6. New York (390 )7. Yosemite (350 )7. The Caribbean (350 )9. Canadian Rockies (310)10. Washington D.C . (260)11. Boston (250 )12. Cancun (240 )13. Disney Cruise (230 )14. Yellowstone & Grand Teton (220)15. Machu Picchu (170)
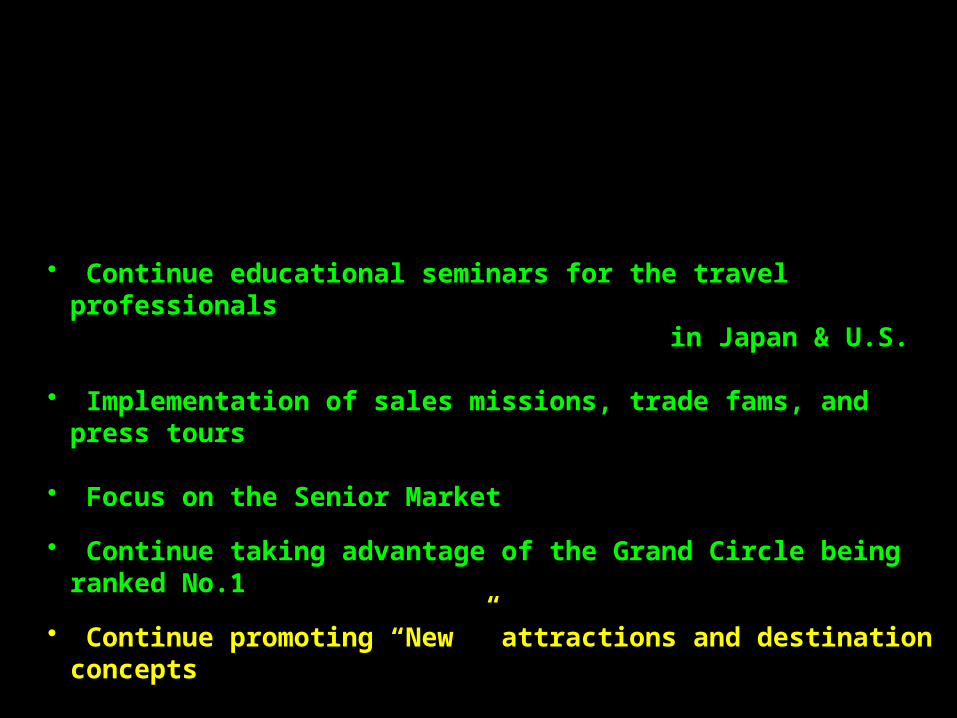
• Continue educational seminars for the travel professionals
in Japan & U.S.
• Implementation of sales missions, trade fams, and press tours
• Focus on the Senior Market
• Continue taking advantage of the Grand Circle being ranked No.1
• Continue promoting “New ” attractions and destination concepts

Planned Sales Missions & Trade Shows in 2011
(1) LA Solo-Sales Mission: January 10~15, 2011(2) Go West Summit: February 7~9, 2011 (3) Solo-Sales Mission to Japan: February 21~March 5, 2011 (4) East Coast Sales Mission: March 24~26, 2011 (5) Las Vegas Sales Mission: April 16, 2011 (6) West Coast/LA Sales Mission: August 3~4, 2011(7) USTA Media Marketplace in Tokyo: September 21, 2011(8) Japan Sales Mission: November 14~18, 2011
These are the CY 2011 planned sales missions and trade show.Any suppliers and DMO can join in (2), (5), (6), (8) and (9).
We will welcome your participation!!


The Disaster struck
Our Targeted Markets
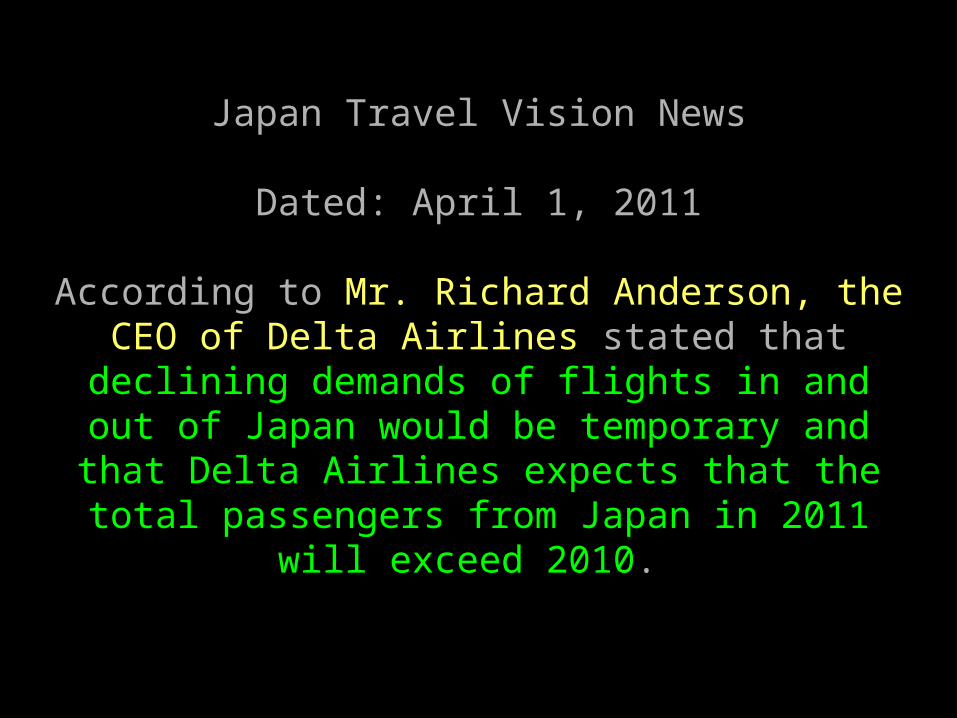
Japan Travel Vision News
Dated: April 1, 2011
According to Mr. Richard Anderson, the CEO of Delta Airlines stated that declining demands of
flights in and out of Japan would be temporary and that Delta Airlines expects that the total passengers
from Japan in 2011 will exceed 2010.
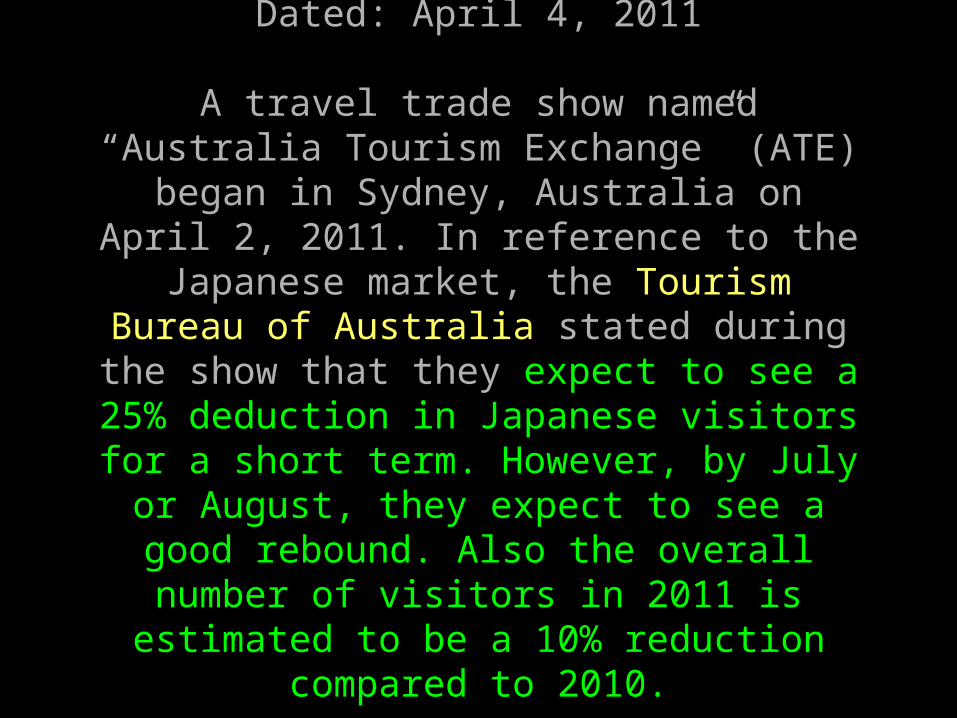
Japan Travel Vision News Dated: April 4, 2011
A travel trade show named “Australia Tourism Exchange” (ATE) began in Sydney, Australia on April 2, 2011. In reference to the Japanese market, the Tourism Bureau of Australia stated during the show that they expect to see a 25%
deduction in Japanese visitors for a short term. However, by July or August, they expect
to see a good rebound. Also the overall number of visitors in 2011 is estimated to be a
10% reduction compared to 2010.


Best Behaved Tourists
Japanese
Canadian
British
German
Swiss
BEST : WORST :
American
Chinese
Russian
French
Indian
By Expedia

Politeness
Japanese
Australian
British
Canadian
Dutchman
American
German
French
Russian
Italian
BEST : WORST :
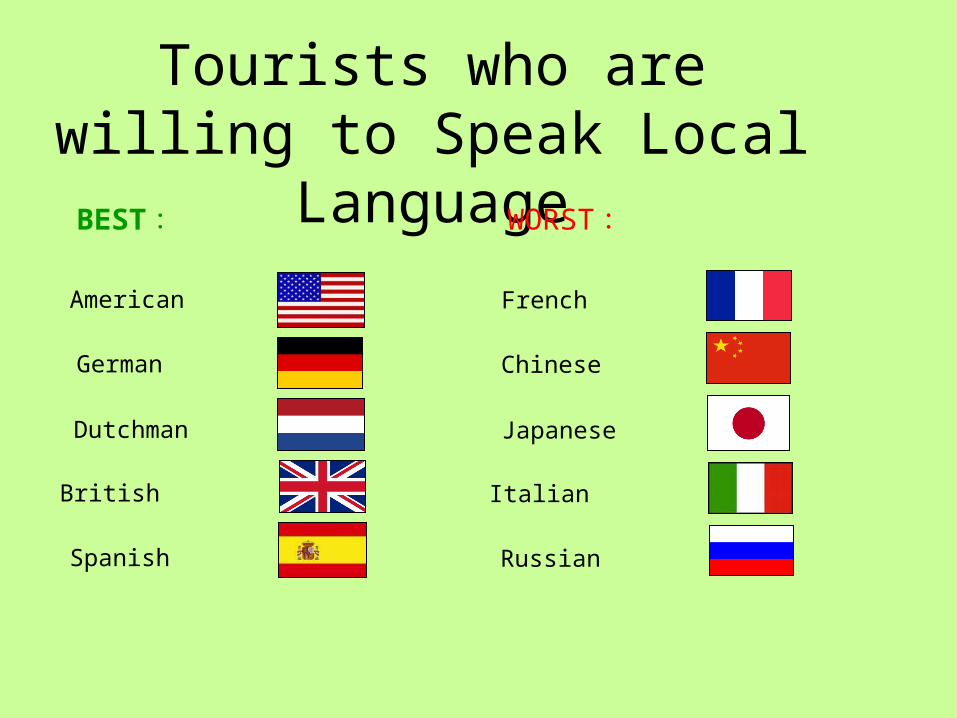
Tourists who are willing to Speak Local Language
American
British
German
Dutchman
Spanish
French
Italian
Chinese
Japanese
Russian
BEST : WORST :

Tourists who are generous with money
American
Japanese
British
Russian
Italian
German
Indian
Chinese
French
Canadian
BEST : WORST :

Tipping
American
Australian
Candian
Russian
Swiss
French
Chinese
German
British
Spanish
BEST : WORST :
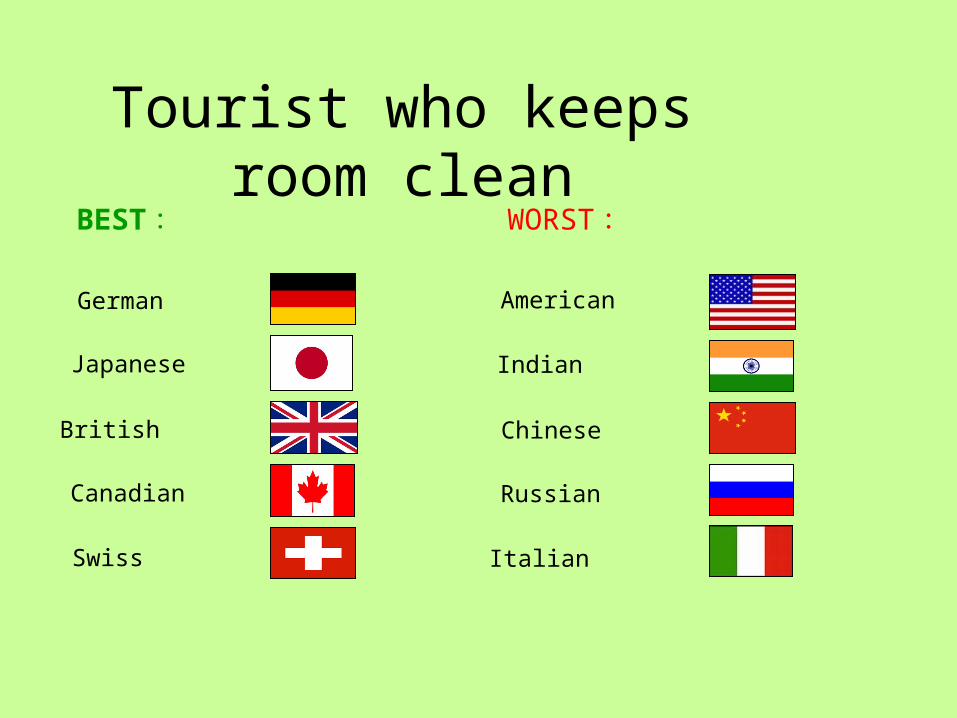
Tourist who keeps room clean
German
Canadian
Japanese
British
Swiss
American
Russian
Indian
Chinese
Italian
BEST : WORST :

Quiet Tourists at Hotel
Japanese
Frenchman
Chinese
German
Canadian
Americn
Spanish
Italian
British
Russian
BEST ( Quiet ): WORST ( Noisy ):
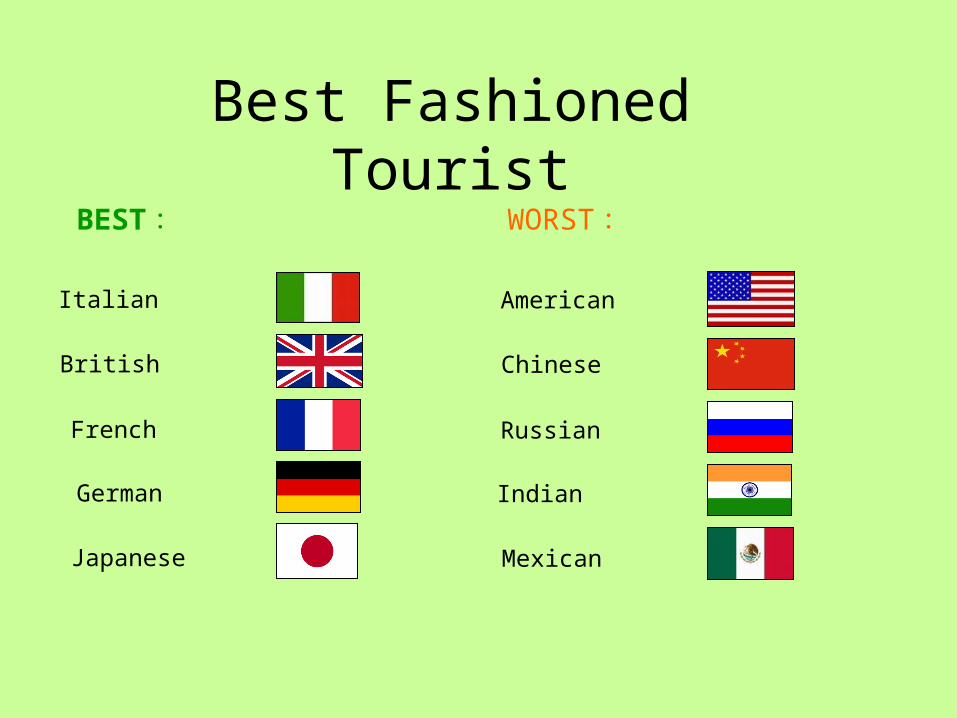
Best Fashioned Tourist
Italian
German
British
French
Japanese
American
Indian
Chinese
Russian
Mexican
BEST : WORST :

Most Complainers / Least Complainers
American
British
German
French
Spanish
Japanese
Dutchman
Chinese
Canadian
Australian
MOST ( Complainers ): LEAST ( Complainers ):

World Best Tourist Ranking 2008
1. Japanese
2. British & German4. Canadian
5. Swiss
Rank
6. Dutch
By Expedia