Energy y Efficienc cy and Co Re Ca o-Benefits efinery Sec alifornia Ai Stationary Issued Assessm ctor Publi ir Resourc y Source D d June 6, 20 ment of La ic Report ces Board Division 013 arge Indus strial Sour rces
Transcript
Energy
y Efficienccy and Co
Re
Ca
o-Benefits
efinery Sec
alifornia AiStationary
Issued
Assessm
ctor Publi
ir Resourcy Source Dd June 6, 20
ment of La
ic Report
ces BoardDivision
013
arge Indus
strial Sourrces
IS‐1
Introduction and Summary
This report summarizes the data provided to the Air Resources Board (ARB or Board) by transportation-fuel refineries (refineries) subject to the Energy Efficiency and Co-Benefits Assessment of Large Industrial Facilities Regulation (EEA Regulation or regulation).1 In this section, we provide background information on the EEA Regulation and a short summary of the data provided by refineries. Following the “Introduction and Summary,” are two sections which provide a compilation of the information submitted by the refineries. This information is aggregated in a manner consistent with ARB regulations. The first section “Part I” is a sector-wide summary of all of the energy efficiency improvement projects identified by all of the refineries, along with estimated emission reductions and costs. The second section “Part II” summarizes refinery-specific information consistent with the public disclosure requirements under CCR §95610. Emission inventories, both on a sector-wide and facility-specific bases, are also provided for the 2009 base reporting year. Based on the information provided to ARB, we have the following preliminary summary statistics:
The 12 refineries subject to the EEA Regulation identified over 400 energy efficiency improvement projects.
The total greenhouse gas (GHG) reductions associated with these projects is estimated to be approximately 2.8 million metric tonnes carbon-dioxide equivalent (MMTCO2e) per year.2
Approximately 78 percent of the estimated GHG reductions (2.2 MMTCO2e) are from completed projects, with 63 percent (1.4 MMTCO2e) of these reductions from projects completed before 2010 (and therefore already accounted for in the 2009 emissions inventories) and 37 percent (0.8 MMTCO2e) of those reductions from projects completed during or after 2010.
Approximately 22 percent of the estimated GHG reductions (0.6 MMTCO2e) are from projects that are scheduled (7 percent) or under investigation (15 percent).
Corresponding reductions of oxides of nitrogen (NOx) and particulate matter (PM) are 2.5 tons per day (tpd) and 0.6 tpd, respectively, with approximately 50 to 60 percent of the reductions from projects completed before 2010 and 40 to 50 percent of the reductions from projects completed during or after 2010, scheduled, or under investigation.
1 Title 17 California Code of Regulations, subarticle 9 sections 95600 to 95612. 2 About half of the estimated reductions are from completed projects and already accounted for in the 2009 GHG Mandatory Reporting emissions inventory. The total does not included estimated emission reductions from projects identified as “Not Implementing.”
IS‐2
EEA Regulation Background
On July 22, 2010, the Board approved the EEA Regulation. The regulation requires operators of California‘s largest industrial facilities to conduct a one-time energy efficiency assessment. The regulation was approved by the Office of Administrative Law and became effective on July 16, 2011. All California facilities with 2009 GHG emissions equal to or greater than 0.5 MMTCO2e are subject to the regulation. Also subject to the requirements are cement plants and transportation-fuel refineries that emitted at least 0.25 MMTCO2e in 2009.
The regulation requires facility managers to conduct a one-time assessment of fuel and energy consumption, and provide estimates of GHG, criteria pollutants, and toxic air contaminant (TAC or toxics) emissions. Facilities are further required to identify potential energy efficiency improvements for equipment, processes, and systems that cumulatively account for at least 95 percent of the facility's total GHG emissions. Energy Efficiency Assessment Reports (EEA Reports) were to be filed with ARB by December 15, 2011. A total of 45 facilities were required to provide an EEA Report. 3
To fulfill ARB’s public disclosure requirements in the EEA Regulation, ARB staff is developing five separate “Public Reports” for the following sectors: Refinery, Oil and Gas Production/Mineral Processing, Cement Manufacturing, Power Generation, and Hydrogen Production. The Public Reports summarize, by sector, the information provided in the EEA Reports submitted by the facilities. The reports strike a balance between full public disclosure of the information provided to ARB and our responsibility to protect confidential business information pursuant to CCR§95610. This report is the Public Report for the Refinery Sector.
The Public Reports do not present ARB staff’s findings, conclusions, or recommendations. These will be presented in a subsequent report that will include all sectors. We intend to release this subsequent report once we have completed our review and analysis of the information provided in the EEA Report, the reports from the third party reviewer, and other applicable information. We anticipate releasing this subsequent report in 2013.
3 The San Francisco State University Industrial Assessment Center is also under contract to provide a third-party review of a subset of the EEA Reports. Nine facility reports were provided to them to evaluate. Information from the third-party review will not be available until the latter part of 2013, and therefore are not reflected in this report.
IS‐3
Summary of EEA Report Data for the Refinery Sector
Twelve refineries submitted EEA Reports to the ARB. Below staff provides a summary of the 2009 GHG emissions from the Refinery Sector, followed by a summary of the potential GHG, criteria pollutant (CP), and toxic air contaminant (TAC or toxics) emission reductions from Completed/Ongoing, Scheduled, and Under Investigation energy efficiency improvement projects identified in the EEA Reports. Also presented are the estimated total one-time capital costs, annual costs, and annual savings associated with the projects. As indicated earlier, additional details are provided in Parts I and II which follow this summary.
GHG Emissions
Table IS-I shows the 2009 GHG emissions in MMTCO2e from the 12 refineries subject to the EEA Regulation. This estimate comes from ARB’s Mandatory GHG Reporting for 2009. The GHG emission estimates do not include any off-site emissions such as those associated with the production of electricity, steam, or hydrogen which is not produced on-site, thus, emissions may not be directly comparable between refineries. As shown in the table, the Refinery Sector total GHG emissions in 2009 were 31.4 MMTCO2e per year.
Table IS- I: 2009 Greenhouse Gas Emissions for Refineries Subject to EEA Regulation
*While separately owned, the refinery and hydrogen plant are permitted to operate under a single permit, and their emissions are therefore reported as a single facility, Shell - Martinez.
Source: Facility EEA Reports
Refinery 2009 GHG Emission (MMTCO2e) BP – Carson 4.4 Chevron – El Segundo 3.2 Chevron – Richmond 4.5 Phillips66 – Carson 0.8 Phillips66 – Wilmington 1.8 Phillips66 – San Francisco 2.0 ExxonMobil – Torrance 2.7 Shell – Martinez * 4.3 Tesoro – Los Angeles 1.5 Tesoro – Martinez 2.3 Valero Ultramar – Wilmington 1.0 Valero – Benicia 2.9
Total 31.4
IS‐4
Energy Efficiency Projects and Estimated Potential Emission Reductions The facility operators of California’s 12 refineries subject to the EEA Regulation identified over 400 energy efficiency improvement projects and designated the project status as:
Completed/Ongoing, Scheduled, Under Investigation, or Not Implementing.
For the Refinery Sector, many of the projects identified by the different refineries were similar in terms of the equipment impacted and the approach used to improve energy efficiency. Similar projects have been grouped and placed in one of the six “Equipment Category” listed in Table IS-2. Equipment Category refers to the equipment (i.e. boilers) or a grouping of equipment (i.e. steam system) that are associated with a refinery process. Table IS-2 summarizes, by “Equipment Category,” the number of projects and the estimated GHG, NOx, and PM emission reductions associated with the projects identified in the EEA Reports. The estimated GHG emission reductions are approximately 2.8 MMTCO2e annually. Approximately half of the GHG emission reductions identified were completed before 2010 and are reflected in the 2009 GHG totals shown in Table IS-1. The other half of the GHG emission reductions are from projects that were completed during or after 2010, scheduled, or under investigation and are not reflected in the 2009 GHG values shown in Table IS-1.
Table IS-2: Estimated GHG and Criteria Pollutants Emission Reductions from Energy Efficiency Improvement Projects Identified in EAA Reports*
Equipment Category Number
of Projects
GHG (MMTCO2e)
NOx (tons per day)
PM (tons per day)
A. Boiler 116 0.67 0.49 0.12 B. Electrical Only Equipment 70 0.09 0.05 0.009 C. Other Equipment (included refinery-wide processes)
47 1.01 1.14 0.30
D. Stationary Combustion 8 0.04 0.008 0.002 E. Steam Only System 26 0.24 0.22 0.04
F. Thermal Equipment 134 0.73 0.62 0.10
Total 401 2.78 2.52 0.57 *Includes all reported projects except those identified as Not Implementing.
The estimates in Table IS-2 assume that all of the energy efficiency improvement projects identified in the EEA Reports would be implemented, except for those identified
IS‐5
as “Not Implementing.” However, implementation of some projects may preclude the implementation of other projects that deal with the same equipment or processes. Therefore, these estimated reductions do not necessarily represent readily achievable on-site emission reductions. Costs Table IS–3 provides a summary of the estimated total one-time capital costs, annual costs, and annual savings for the approximately 400 energy efficiency improvement projects identified in the Refinery Sector EEA Reports. The total estimated one-time costs for all of these projects (except for those identified as “Not Implementing”) are estimated at about $2.6 billion with annual costs of about $17 million. These projects would also result in net annual savings of approximately $200 million. These estimates are preliminary. They are not based on detailed engineering and cost analysis that would be required to accurately estimate emission reductions, costs, and timing of the projects.
Table IS-3 Summary of Estimated Costs and Savings for Energy Efficiency Improvement Projects*
Number of
Projects
One Time Cost (million $)
Annual Cost (million $/year)
Annual Savings (million $/year)
401 $2,600 $17 $200 * Includes all projects identified as Completed/Ongoing, Scheduled, or Under Investigation. Does not include project identified as “Not Implementing.” All values rounded.
In the next two parts of this “Public Report,” we provide more details on the information contained in the Refinery Sector EEA Reports. The information is presented consistent with the public disclosure requirements under §95610.
Part I provides sector-wide information on the 12 transportation-fuel refineries subject to the EEA Regulation including background information on the refining sector; estimates of the GHG, criteria pollutant, and toxic air contaminant (TAC or toxics) emissions from the 12 refineries; and information on State, federal, and district regulations affecting refinery operations in California. Part I provides, on a sector-wide basis, the energy efficiency improvement projects identified by the refineries in their EEA Reports and the estimated GHG, criteria pollutant, and TAC emission reductions associated with these projects. All information provided, including inventory data as well as identified project costs and benefits, is as reported by the facilities in their EEA Reports. Inventory data may not agree with other published data due to the inclusion of more recent data provided by the facility.
Part II provides refinery-specific information about each of the 12 refineries submitting EEA Reports. Within each refinery-specific section, there is information on the current (2009) emissions for GHG, criteria pollutants, and TACs from the specific facility. There
IS‐6
is also a summary of the energy efficiency improvement projects that refinery staff identified in their EEA Report. The projects are categorized by Equipment Category and Equipment Sub-type. Equipment Sub-type provides a general description of the types of equipment but does not provide a detailed explanation of each of the 400 projects identified or refinery-specific variations from the general description. Information about cost and potential emission reductions of GHG, criteria pollutants, and TACs, summed for all the projects (by Equipment Category and Equipment Sub-type), is provided. In compliance with CCR§95610, the specific details about the individual projects were not presented. While it is not possible to identify the specific details for each project a refinery has identified, it is possible to get a good indication of what equipment, what action, and what timeframe for action were considered by referring back to the sector-wide project information in Part I.
1
Part I –Refinery Sector Summary
I.0 Introduction
The information presented in this sector-wide summary is based on EEA Reports submitted by the 12 transportation-fuel refineries subject to the EEA Regulation. All information provided, including inventory data as well as identified project costs and benefits, is as reported by the facilities in their EEA Reports. Inventory data may not agree with other published data due to the inclusion of more recent data provided by the facility. The format and level of detail of the information presented strikes a balance between full public disclosure of the information provided to ARB and our responsibility to protect confidential business information in a manner consistent with ARB regulations. This report does not present ARB staff’s findings, conclusions, or recommendations. These will be presented in a subsequent report that will include all sectors. We intend to release this subsequent report once we have completed our review and analysis of the information provided in the EEA Reports, the reports from the third party reviewer, and other applicable information.4 We anticipate releasing this subsequent report in 2013.
I.1 Refinery Sector Description The 12 California refineries that were required to provide information under the EEA Regulation are identified in Table I-1 along with the local air district in which they are located. Table I-1: Refineries Submitting EEA Reports and the Air Districts in Which They
are Located Refinery Air District
Chevron – Richmond
Bay Area Air Quality Management District Phillips66 – San Francisco Shell – Martinez Tesoro – Martinez Valero – Benicia BP – Carson
South Coast Air Quality Management District
Chevron – El Segundo ExxonMobil – Torrance
Phillips66 – Carson
Phillips66 – Wilmington
Tesoro – Los Angeles
Valero Ultramar – Wilmington
4 EEA Reports submitted by three of the refineries were provided to staff of the Industrial Assessment Center of San Francisco State University. This group was contracted by ARB to provide a third-party review of a subset of the EEA reports. We anticipate that these third party reviewer reports will be completed later this year.
2
California Refining Capacity Table I-2 provides the daily refining capacity of the refineries subject to the EEA Regulation. As shown in the table, the total refining capacity of these 12 refineries is approximately 1.9 million barrels of oil per day (bbls/day). Most of the petroleum products produced by these refineries are supplied to the California market.
Table I-2: Refining Capacity of California Refineries Refinery Daily Refining Capacity (bbls/day)
BP – Carson 265,000 Chevron – El Segundo 290,000 Chevron – Richmond 245,000 ExxonMobil – Torrance 150,000 Phillips66 – Carson N/A* Phillips66 – Wilmington 139,000 Phillips66 – San Francisco 120,000 Shell – Martinez 155,000 Tesoro – Los Angeles 100,000 Tesoro – Martinez 165,000 Valero Ultramar – Wilmington 80,000 Valero – Benicia 145,000
Total 1,850,000 2009 EIA data, values have been rounded *Not applicable - linked facility with Phillips66 - Wilmington
Overview of Refining Processes This section provides a brief overview of the California refining industry and the factors impacting their energy usage. It provides background information on crude oil refining in California and the underlying reasons why refining in California is complex and requires significant energy. California refining capacity represents about 10 percent of the United States’ (U.S.) crude distillation unit capacity (Worrell and Galitsky, 2005). California refineries are typically more complex than refineries in the rest of the U.S. The design and processing configuration of a complex refinery is based on the product mix that the refinery produces, the types of crude oil feedstock that the refinery was designed to process, and the additional hydrotreating necessary to produce products that meet stringent California environmental quality standards. The type of crude oil, the feedstock for California’s refineries, can be described by several characteristics. The most important of these characteristics are density and sulfur content. These two characteristics each have a unique impact on a refinery’s energy usage. The American Petroleum Institute (API) gravity is a measure of the relative densities of different petroleum liquids. API gravity is used to evaluate how heavy or light a petroleum product is. Fluids with the lowest specific gravity have the highest API
3
gravity. API gravity values are dimensionless, but are referred to in “degrees.” An API gravity value greater than 10 means the product is lighter than water and will float.
Heavy crude oil has an API gravity of 18 degrees or less, Intermediate crude has an API gravity greater than 18 and less than 36 degrees,
and Light crude has an API gravity greater than or equal to 36.
Generally speaking, the lower the API, the heavier the crude and the more processing required to produce high quality (i.e., “light”) products. The weighted average API gravity for the crude oil produced by California oil fields was approximately 18 in 2005. Sulfur content is another factor that impacts energy required for processing. Crude oil is considered “sweet” if the sulfur content is less than 0.5 percent by weight and “sour” if greater than 1.0 percent. Since gasoline and diesel fuels are required by ARB and U.S. Environmental Protection Agency (U.S.EPA) regulations to have very low sulfur content, a significant amount of energy is required to remove the sulfur from the crude oil feedstocks processed by California refineries. The 2005 Lawrence Berkeley National Laboratory (LBNL) study referenced above found that the crude oil produced in California, on a weighted average, is relatively heavy (18) and sour (1.3%).5 This means that additional energy would be required to process this type of crude oil into fuels that can be legally provided to the California market. Specific processing equipment is required to refine these types of crudes, and additional equipment is required to produce cleaner California fuels. Generally, most California refineries have been designed to process heavier, more sour crudes, which require more energy intensive processes. In 2010, California crude oils accounted for approximately 38 percent of the crudes processed by California refineries, Alaskan North Slope crudes 14 percent, and foreign crude 48 percent. Regardless of the origin of crude oils, it is anticipated that the properties of the overall crude slate processed by California refineries will not change appreciably in the foreseeable future. (EIA, 2012) Typical Refinery Processes
Figure I-1 is a schematic of a “typical” refinery and the equipment utilized in processing crude oil into final petroleum products. The crude oil is initially heated in the distillation units (shown on the left side of the figure) to separate the different components in the oil. Different components have different boiling temperatures and can be separated by heating the crude oil through a series of temperatures, collecting the different components at their specific boiling temperatures. These components are then further refined through other processes to make the different petroleum products. These refining processes are described in more detail in the text following the figure.
5 Although the average API of crude produced at California oil fields may be 18, some of the heavy crude is blended with diluent (e.g. NGL) to increase the API prior to transporting it to the refinery by pipeline.
4
Figure I-1. Schematic of “Typical” Refinery
California refineries utilize refining techniques to maximize the production of products needed for the California market. This means producing a high percentage of “light” products including gasoline, diesel, and aviation fuels. Maximizing the production of these products given the heavy/sour crude oil feedstock used by California’s refineries and stringent environmental requirements for both the facility and the products produced necessitate processes that are complex and energy intensive. The following section provides a generic overview of the key processes used at California refineries to
To fluid
coking unit
To
hydrocracker
5
split long-chain hydrocarbons in crude oil into smaller hydrocarbon compounds needed for gasoline, diesel, and aviation fuels. Petroleum Refining Processes
The following is a more detailed description of some of the key processes used at California refineries.
1) Crude Oil Distillation (fractionation): Fractionation, either at low atmospheric pressures or in a vacuum, is the separation of crude oil into different fractions by boiling point through successive evaporation and condensation. The fractions have specific boiling-point ranges and include gases, light distillates, middle distillates, gas oils, and residual products.
2) Hydrogen Production: Hydrogen is required for a number of refining processes. Small amounts of hydrogen are produced during catalytic reforming and steam reforming of liquid hydrocarbon feedstocks, but those amounts are insufficient to meet a typical refinery’s needs. Refinery processes that require additional hydrogen include hydrocracking, hydrotreating, and aromatic saturation as well as processes that need hydrogen to reduce catalyst deactivation. In California, hydrogen is primarily produced by using the process of steam methane reforming (SMR). SMR is a process in which a preheated hydrocarbon feed source (e.g. methane or natural gas) is introduced with steam under 3-25 bar pressure across a catalyst. The resulting chemical reaction produces a synthesis gas composed primarily of hydrogen and carbon monoxide. The synthesis gas then enters the water-gas shift which converts the carbon monoxide and steam to hydrogen and carbon dioxide. The final step is to purify the hydrogen gas using either a monoethanolamine scrubber or a pressure swing adsorption unit.
3) Hydrocracking is a two-staged process that combines catalytic hydrotreating and
cracking. Hydrotreating is used on feedstocks that contain elevated amounts of sulfur and nitrogen compounds. These reactions require the use of high pressures and high temperatures in the presence of hydrogen and a catalyst. Cracking and hydrogenation is a process in which heavier feedstocks are broken down(cracked) in the presence of a catalyst and hydrogen to produce smaller chain molecules Additional hydrogen reduces the formation of polycyclic aromatic compounds, reduces tar formation, and prevents the buildup of coke on the catalyst.
6
4) Catalytic hydrotreating is performed by refineries to remove sulfur primarily from the naphtha, jet, and diesel feedstocks. Sulfur and nitrogen compounds are converted in a reactor to hydrogen sulfide and ammonia. The hydrogen sulfide is removed in a gas treating unit.
5) Heavy Oil Catalytic Hydrotreating: This process is a hydrogenation process used
to remove contaminants such as nitrogen, sulfur, oxygen, and metals from liquid petroleum fractions. These contaminants can have detrimental effects on equipment, catalysts, and the quality of the finished products.
6) Catalytic Reforming: This endothermic process uses a catalyst to induce a
reaction which converts low-octane naphthas into high-octane gasoline blending components called reformate. Hydrogen is a significant by-product of this process. It is separated from the reformate and used in other processes, such as hydrocracking and hydrodesulfurization. Precious metal catalysts are typically used in this process.
7) Thermal Cracking: The heaviest crude petroleum fractions are composed of large
complex hydrocarbon molecules. These molecules are heated under pressure until the larger molecules are broken into smaller, simpler carbon-chained fractions.
8) Fluid Catalytic Cracking: This process circulates a powdery catalyst at high
temperature and low pressure. The carbon that builds up on the catalyst after converting heavy oils to other products is burned using air in a regenerator. The hot regenerated catalyst contacts the heavy oil stream in a vertical pipe called a riser where most of the cracking reaction occurs. Cyclones are used to separate the fluidized (suspended) catalyst from the products which are completely vaporized. Spent catalyst then enters the regenerator which completes the fluid catalytic cracking process. The powdered catalyst are solids including aluminum hydrosilicate, treated bentonite clay, bauxite, silica-alumina, rare earth metals and zeolite.
9) Alkylation: This process combines low-molecular-weight olefins with isobutane in
the presence of a catalyst, either sulfuric acid or hydrofluoric acid. The product called “alkylate.” is a premium California gasoline blending stock because it has excellent antiknock properties and burns cleanly.
10) Isomerization: This process is used to convert straight chain paraffins such as n-
butane or n-pentane, to their respective branched isoparaffins. The conversion is desirable for two reasons. Usually, a refinery produces more normal butane than it can blend into gasoline due to its high vapor pressure. This additional n-sobutane is converted to isobutene for alkylation. Normal pentane has a very low octane (about 60), thus more prone to premature ignition, with a vapor pressure similar to isopentane. When n-pentane is isomerized to isopentane,
7
this results in an octane over 90. A higher octane number reduces the occurrence of premature ignition known as engine knock.
11) Amine Treating: This process uses aqueous solutions of amines to remove
hydrogen sulfide and carbon dioxide from refinery process gases. When the amine solution is thermally regenerated the hydrogen sulfide and carbon dioxide is then routed to a Claus sulfur plant (see number 12 below) for further processing.
12) Claus Sulfur Process: This process converts hydrogen sulfide into liquid
elemental sulfur from the gaseous hydrogen sulfide found in raw natural gas and the by-product gases of refinery processes.
13) MeroxTreaters: Merox stands for mercaptan oxidation. Merox units treat
liquefied petroleum gas, kerosene, or jet fuel by oxidizing mercaptans to organic sulfides.
14) Delayed Coker: This process is a thermal cracking process that reduces long-
chain hydrocarbons of residual oil to sour fuel gas, naphtha, jet, diesel, heavy coker gas oil and petroleum coke. Petroleum coke is essentially carbon. Calcined coke is 98 to 99.5 percent fixed carbon. Petroleum coke is generally used for fuel.
Relative Energy Intensity of Refinery Processes As discussed earlier, the California crude oil feedstock and the requirements for low sulfur levels for clean burning California transportation fuels generally require extensive hydrotreating. Hydrotreating includes processes such as hydrodesulfurization and hydrocracking. All of these processes require hydrogen. While hydrogen is a by-product of some refining processes, specifically catalytic reforming and steam reforming, the amounts of hydrogen produced are generally not sufficient to meet the refinery’s hydrogen needs to make cleaner fuels. As a result, refineries generally have to produce additional hydrogen. For those refineries that produce their own hydrogen, hydrogen production accounted for approximately 20 percent of the refinery’s energy usage. (Worrell and Galitsky, 2005). Other highly energy intensive processes at refineries include atmospheric distillation, vacuum distillation, hydrotreating, and reforming. These four processes combined accounted for approximately 50 percent of the energy used in California refineries (Worrell and Galitsky, 2005). Thermal cracking, catalytic cracking, hydrocracking, and alkylate and isomer production all require similar amounts of energy and together account for about 25 percent of the energy used by California refineries (Worrell and Galitsky, 2005). All total, the ten processes identified, account for about 95 percent of the energy requirements at California refineries.
8
I.2 Emissions and Fuel Use Emissions The estimated GHG emissions from the 12 refineries subject to the EEA Regulation are provided below. Table I-3 shows that the total GHG emissions from these 12 refineries in 2009 were 31.4 MMTCO2e. This estimate comes from ARB’s Mandatory GHG Reporting for 2009. The GHG emission estimates do not include off-site emissions associated with the production of electricity, steam, or hydrogen which is not produced on-site.
Table I-3: Refinery GHG Emissions (2009)
Refinery 2009 GHG Emissions
(MMTCO2e) BP – Carson 4.4 Chevron – El Segundo 3.2 Chevron – Richmond 4.5 ExxonMobil – Torrance 2.7 Phillips66 – Carson 0.8 Phillips66 – Wilmington 1.8 Phillips66 –San Francisco 2.0 Shell – Martinez and Air Products - Martinez 4.3 Tesoro – Los Angeles 1.5 Tesoro – Martinez 2.3 Valero Ultramar – Wilmington 1.0 Valero – Benicia 2.9
Total 31.4 Source: Facility EEA Reports
Table I-4 provides the estimated criteria pollutant emissions from the 12 refineries subject to the EEA Regulation. The emission estimates were provided by the refineries and are primarily based on emissions estimation methodologies used by the local air district in which the refinery is located. The reporting of criteria pollutants may vary with local air district. Some refineries reported total organic gases and reactive organic gases and others reported just one or the other. These totals represent the totals of the reported values.
Table I-5 shows the estimated toxic air contaminate (TAC or toxic) emissions for the 12 refineries subject to the EEA Regulation. The emission estimates were provided by the
9
refineries and are primarily based on emissions estimation methodologies used by the local air district in which the refinery is located. The TACs reported may vary by local air district such that not all TACs were reported by all the refineries. Also, the Air Toxics "Hot Spots" Information and Assessment Act (AB 2588), enacted in 1987, requires stationary sources to periodically provide more comprehensive reporting, resulting in variations in the TACs reported. These totals represent the totals of the reported values. The TACs are ranked according to potential public health impact based on the combination of mass emissions and cancer potency. The cancer potency factors (CPF) used are approved by California’s Office of Environmental Health Hazard Assessment and can be found on the web at http://www.oehha.ca.gov/air/hot_spots/tsd052909.html (OEHHA, 2009) To identify the TACs of greatest potential concern, the TACs for each facility were ranked using the reported emissions for each pollutant and their cancer potency factor. Pound for pound, not all pollutants are equal in terms of potential health impacts to the public. Specifically, the ranking (R) for each pollutant is determined by multiplying the reported emissions (E) and the pollutant-specific inhalation cancer potency factor (CPF). The equation for ranking each pollutant is: R = E x CPF. This method for ranking pollutants is a simplistic tool used to rank the reported emissions according to potential health impacts. All of the pollutants reported for the sector were ranked using the equation above. The ten pollutants with the highest ranking are listed in the table. The location of a pollutant on the list in the table is a combination of the reported emissions and the presence and/or relative magnitude of the CPF. The pollutant with the highest ranking is listed first. While the CPF is typically used in health risk assessments to estimate potential cancer risk, this ranking is not a risk assessment. The list in Table I-5 simply provides a method for placing the reported pollutants in a relative ranking based on mass and the cancer potency of the pollutant.
Table I-5: Refinery Toxic Air Contaminant Emissions (2009)
Toxic Air Contaminant* Total mass emissions (pounds/year)
Chromium, hexavalent (& compounds) 57 Polycyclic Aromatic Hydrocarbons (total) 2,589 Benzene 49,498 Cadmium 173 Formaldehyde 117,241 1,3-Butadiene 3,413 Nickel 1,354 Arsenic 77 Naphthalene 3,422 Diesel, particulate matter 166 *Listed in rank order based on mass times cancer potency
10
Fuel Use
The energy required for the various refinery processes described earlier is supplied from fuel combustion, process heat, and electricity. On-site fuel combustion is used to provide steam, process heat, and to produce electricity. Fuels used include process gas and natural gas. The process gas, also referred to as fuel gas, is produced on-site as a by-product of the refining process. All refinery units produce some amount of process gas, butane, and/or lighter hydrocarbons (methane, ethane, and propane) (Leffler, 1979). Natural gas is purchased from local utilities. In addition, refineries conserve fuel by capturing “waste” heat from refining processes. This process heat is energy that would otherwise be lost to the environment. The majority of GHG emissions associated with refineries are the result of combustion processes. All of the processes listed in Section I.1 above, use a combination of process gas/natural gas, process heat, steam, or electricity to provide the energy needed to refine crude oil. Each process and each refinery uses a different combination of these sources of energy to produce the products for the California market. The energy consumed by these facilities is shown in Table I-6 by fuel type. As shown in the table, most of the energy for refinery operations comes from process gas which is produced on-site during the refining process. The electrical energy includes both electricity produced on-site and electricity provided from off-site sources. Other feedstocks include low Btu gases, propane, liquid petroleum gas, and butane.
Table I-6: 2009 Refinery Sector Energy Consumption, by Fuel Type
Fuel Type Energy Consumed
(MMBtu) Percent Total Energy
Consumed Process (Fuel) Gas 298,000,000 70 Natural Gas 65,000,000 15 Petroleum Coke 17,000,000 4 Electricity* 16,000,000 4 Other Feedstocks 27,000,000 7
Total 423,000,000 100 * includes both purchased and internally produced electricity
I.3 Regulatory Requirements Refineries subject to the EEA Regulation are also subject to a variety of State, local, and federal air pollution control regulations and emissions reduction programs. These regulations and programs are mainly designed to reduce criteria and toxic air emissions from refineries. Three State regulations focusing on GHG emission reductions that refineries are subject to are the Low Carbon Fuel Standard (LCFS) Regulation, the Cap and Trade (C&T) Regulation, and the Mandatory Reporting of GHG Emissions Regulation. California’s air quality management and air pollution control districts develop, implement, and enforce specific criteria and toxics regulations and programs at the local level. The U.S. EPA develops criteria and toxic regulations and programs at the federal level. Below is a brief summary of the LCFS, C&T, and the Mandatory Reporting Regulations. Also
11
provided is a table of local air district regulations for the districts in which the reporting refineries are located as well as weblinks to federal refinery regulations. The discussion below focuses on some of the key air-related regulations and program impacting refineries. However, it is not a complete listing of all of the state, local, and federal air regulations or programs that refineries are required to meet. California GHG Regulations Low Carbon Fuel Standard Regulation The Low Carbon Fuel Standard regulation (LCFS) is designed to reduce greenhouse gas emissions associated with the lifecycle of transportation fuels used in California. The lifecycle includes the emissions associated with producing, transporting, distributing, and using the fuel. The regulation reduces lifecycle greenhouse gas emissions by assessing a “carbon intensity” score to each transportation fuel based on that fuel’s lifecycle assessment. For more information about the LCFS regulation, please go to http://www.arb.ca.gov/fuels/lcfs/lcfs.htm Cap-and-Trade Program Cap-and-Trade is one of the strategies California will use to reduce GHG emissions. The program will help California meet its goal of reducing GHG emissions to 1990 levels by 2020. Under cap-and-trade, an overall limit on GHG emissions from capped sectors will be established by the cap-and-trade program and facilities subject to the cap will be able to trade compliance instruments (allowances and offsets) to emit GHGs. Refineries are subject to the Cap-and-Trade regulation and will have to either reduce on-site GHG emissions or obtain GHG allowances sufficient to meet its annual compliance cap. For more information about the Cap-and-Trade Program, please go to http://www.arb.ca.gov/cc/capandtrade/capandtrade.htm Mandatory Reporting of GHG Emissions (title 17, CCR, sections 95100 to 95157) In January 2012, amendments to the Mandatory Reporting of GHG Emissions regulation became effective. In the revised regulation, hydrogen plants are identified as a source category that is subject to the regulation (section 95114). The revised regulation affects all hydrogen production facilities in California where GHG emissions equal or exceed 10,000 MTCO2e annually, whether stand-alone merchant facilities or production units with larger facilities. Operators are required to report stationary combustion and process emissions as well as amounts of carbon dioxide captured and transferred off-site. Operators are required to sample feedstocks (other than natural gas) daily, but solid and liquid samples can be composited to produce a monthly sample for carbon content analysis. (ARB, 2012b) For more information about the Mandatory Reporting of GHG Emissions regulation, please go to http://www.arb.ca.gov/cc/reporting/ghg-rep/ghg-rep.htm/
12
Bay Area and South Coast Districts Criteria and Toxic Pollutant Regulations Table I-7 below lists the key district criteria regulations affecting refineries. In addition, refineries are subject to district permitting regulations and air toxics programs, such as New Source Review Rules for criteria pollutants, as well as toxics, and AB2588 (Air Toxics Hot Spots). Table I-7 District-specific Rules Affecting Refineries Bay Area AQMD ‐ Rule 6‐1 General Requirements General Requirements
Rule 8‐1 Organic Compounds General Provisions
Rule 8‐6 Terminals and Bulk Tanks
Rule 8‐8 Wastewater (Oil‐Water) Separators
Rule 8‐9 Vacuum Producing Systems
Rule 8‐10 Process Vessel Depressurization
Rule 8‐18 Equipment Leaks
Rule 8‐28
Episodic Releases From Pressure Relief Valves at Petroleum Refineries and Chemical Plants
Rule 8‐33 Gasoline Bulk Terminals and Gasoline Cargo Tanks
Rule 1149 Storage Tank and Pipeline Cleaning and Degassing
Rule 1158 Storage, Handling, and Transport of Petroleum Coke
Rule 1173
Control of Volatile Organic Compound Leaks and Releases of Components at Petroleum Facilities and Chemical Plants
Rule 1176 Sumps and Wastewater Separators
Rule 1178
Further Reductions in VOC emissions From Storage Tanks at Petroleum Refineries
Rule 1189 Emission from Hydrogen Plant Process Vents
Rule 2000 Regional Clean Air Incentives
Market (RECLAIM) General
Rule 2001 Applicability
Rule 2002 Allocations for Oxides of Nitrogen (NOx) and Oxides of Sulfur
(SOx)
Rule 2004 Requirements
Rule 2005 New Source Review for RECLAIM
Rule 2006 Permits
Rule 2007 Trading Requirements
Rule 2008 Mobile Source Credits
Rule 2009 Compliance Plan for Power Producing Facilities
Rule 2009.1 Compliance Plans for Forecast Reports for Non Power
Producing Facilities
Rule 2010 Administrative Remedies and Sanctions
Rule 2011 Requirements for Monitoring, Reporting, and Recordkeeping
for Oxides of Sulfur (SOx) Emissions
Rule 2012 Requirements for Monitoring, Reporting, and Recordkeeping
for Oxides of Nitrogen (NOx) Emissions
Rule 2015 Backstop Provisions
Rule 2020 RECLAIM Reserve
14
Federal Regulations Following are federal regulations affecting refineries: Title 40 CFR 60 Subpart A New Source Performance Standards - General Provisions Title 40, Part 60, Subpart J - Standards of Performance for Petroleum Refineries Title 40, Part 60 Subpart Ja - Standards of Performance for Petroleum Refineries for
Which Construction, Reconstruction, or Modification Commenced After May 14, 2007
Subpart CC- National Emission Standards for Hazardous Air Pollutants From Petroleum Refineries
Title 40 CFR 60 Subpart Db Steam Generating Units >100 mmbtu Title 40 CFR 60 Subpart XX Bulk Gasoline Terminals Title 40 CFR 60 Subpart GG NSPS for Gas Turbines Title 40 CFR 60 Subpart Ka and Kb Standards for Volatile Organic Liquid Vessels Title 40 CFR 60 Subpart VV Standards for Equipment Leaks for VOCs Title 40 CFR 60 Subpart IIII Stationary Compression Ignition Internal Combustion
Engines Title 40 CFR 60 Subpart GGG & GGGa Equipment Leaks at Refineries Title 40 CFR 60 Subpart QQQ Wastewater Treatment for Refineries Title 40 CFR 61 Subpart A NESHAP - General Provisions Title 40 CFR 61 Subpart FF NESHAP for Benzene Waste Operations Title 40 CFR 63 Subpart A NESHAP for Source Categories - General Provisions Title 40 CFR 63 Subpart R for Gasoline Distribution Facilities Title 40 CFR 63 Subpart Y NESHAP for Marine Tank Vessel Operations Title 40 CFR 63 Subpart UUU NESHAP for Petroleum Refineries Catalytic Cracking,
Catalytic Reforming, and Sulfur Plants Title 40 CFR 63 Subpart DDDDD NESHAP for Industrial/Commercial/Institutional
Boilers and Process Heaters Title 40 CFR 63 Subpart EEEE NESHAP for Organic Liquids Distribution (non-
gasoline) Title 40 CFR 63 Subpart ZZZZ NESHAP for Stationary Reciprocating Internal Combustion Engines Title 40 CFR 68 Accidental Release Prevention Title 40 CFR 79 Registration of Fuels and Fuel Additives Title 40 CFR 80 Regulation of Fuels and Fuel Additives
15
I.4 Energy Efficiency Improvement Opportunities The information provided in the Tables I-9 through I-14 was compiled by staff using information provided in the EEA Reports prepared by the 12 refineries subject to the EEA Regulation. All projects that were identified as Completed/Ongoing, Scheduled, or Under Investigation are included in the tables. Projects that were identified as Not Implementing were not included. Each table covers a broad category of equipment or processes identified by the table title and referred to as “Equipment Category”. Table I-8 lists the “Equipment Category” for tables I-9 though I-14 along with a brief description of the type of projects in each specific category. As noted in Section I.5 discussed later in the report, nearly 80% of the projects identified in this section have already occurred or will occur over the next few years. Additionally, approximately 50% of the reductions occurred prior to 2010. Table I-8: Listing of Equipment Categories and Projects Descriptions of Types of
Projects
Table Number Equipment Category
Description of Types of Projects
Table I-9 Boilers Projects associated with cogeneration, steam, and combined cycle plants
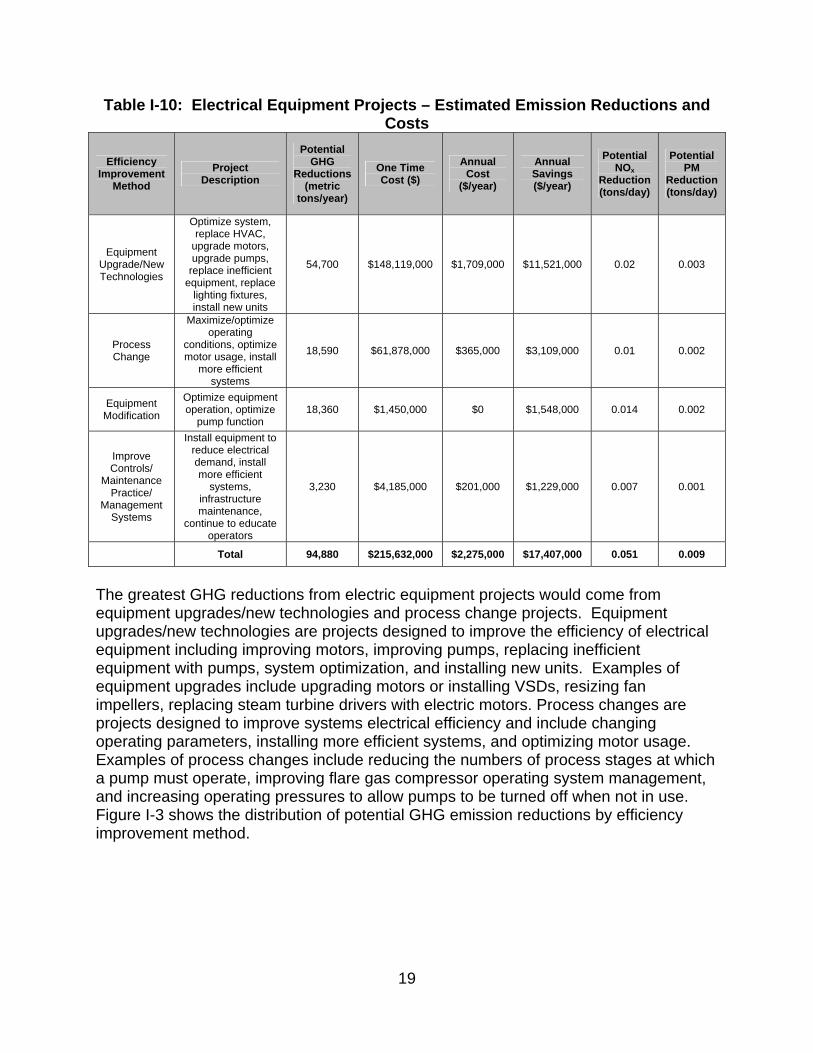
Table I-10 Electrical Equipment Projects dealing with electric motors powering air compressors, HVAC equipment, refrigeration equipment, pumps, fans, and other types of equipment
Table I-11 Other (refinery-wide) Projects that did not fall into another category including refinery-wide projects and flare system projects
Table I-12 Stationary Engines Projects involving stationary gas turbines
Table I-13 Steam Equipment Projects dealing with steam motors powering air compressors, fans, or pumps
Table I-14 Thermal Equipment Projects dealing with furnaces and heat exchangers
Within each table, the projects are assigned to an “Efficiency Improvement Method” group (column 1). The Efficiency Improvement Method is the approach, action or mechanism that would result in energy efficiency improvements, and are as follows:
Equipment modification Equipment upgrade Investment in new technologies Process change Improve monitoring Change in maintenance practices Change in management systems Research investment Other
The information associated with each “Efficiency Improvement Method” represents numerous identified projects. A more detailed description of the types of projects associated with the “Efficiency Improvement Method” is provided in Tables I-9 through
16
I-14 under the column entitled “Project Description.” The emissions and cost data provided are a summation of the data provided for all the projects under the specific “Efficiency Improvement Method” grouping. The estimated GHG emission reductions associated with the projects, capital costs, annual costs, and annual savings estimated by the refineries are also provided. These estimated benefits were usually based on the fuel savings realized. Where projects have been grouped, the reported values are a summation of all the projects represented by the listing. In addition, estimates of the NOx and PM co-benefits are provided. These estimates provide a general idea of what co-benefits might be achieved by implementing the reported projects. The information is arranged so as to provide the maximum transparency of the information reported and at the same time protect the confidential business information the facilities provided. The information provided in Tables I-9 through I-14 is preliminary and not based on detailed engineering and economic analyses for all the projects. Boiler Projects Table I-9 provides information on energy efficiency improvement projects related to boilers at refineries. A total of 117 boiler-related projects were identified by the refineries. The total GHG emission reductions for these projects -provided in the third column of the table- are about 0.7 MMTCO2e annually. The total NOx and PM reductions associated with these projects would be 0.5 tons/day for NOx and 0.1 tons/day PM. Total one-time capital costs, associated annual costs, and associated annual savings are also presented in this table. The total one-time costs for all of these projects are over $365 million and annual costs estimated at about $7 million. These projects would also result in a net annual saving of approximately $54 million.
17
Table I-9: Boiler Projects – Estimated Emission Reductions and Costs
Efficiency Improvement
Method
Project Description
Potential GHG
Reductions (metric
tons/year)
One Time Cost ($)
Annual Cost
($/year)
Annual Savings ($/year)
Potential NOx
Reduction (tons/day)
Potential PM
Reduction (tons/day)
Equipment Upgrade/New Technologies
Improve heat exchange,
improve turbine efficiency,
upgrade heat plant recovery, upgrade steam
system, upgrade motors, upgrade distillation units, upgrade valves, install new units
Total 670,280 $365,711,000 $6,989,500 $53,614,000 0.49 0.12
The largest GHG reductions from boiler-related projects have resulted or would result from equipment upgrades and new technologies, process changes, and enhanced maintenance practices. Equipment upgrades are projects designed to improve boiler efficiency including: replacing steam turbine drives with electric motors, installing new boilers, adding additional heat exchangers, upgrading motors, or installing variable speed drive (VSD) motors. Process changes are projects designed to improve boiler energy efficiency include reducing steam usage, improving boiler function, and changing equipment duty cycles. Examples of process changes include turning off steam-heated equipment when it is not being used, optimizing steam injection rates,
and reroongoingto maintinspectiocleaningfor boile
Fig
Electric Table I-1related telectricathird coland PM tons/dayover $21result in
outing produ projects thtain or impron and repag boilers. Fr projects b
gure I-2. B
Equipment
10 providesto electricalal equipmenumn in Tabreductions
y respective15 million aa net annu
uct to reduchat go beyoove boiler eair program
Figure I-2 shby efficiency
oiler ProjeEff
t Projects
s informatiol equipmennt. The totable I-9, are a associated
ely. The totand annual ual saving o
ce heat lossond the stanefficiency.
m, installing hows the diy improvem
ects – Distrficiency Im
on on identit at refinerieal estimatedabout 0.1 Md with thesetal estimatecosts of ab
of approxim
18
ses. Enhanndard maintEnhanced and maintastribution o
ment method
ribution of mprovemen
fied energyes. A total d GHG emiMMTCO2e ae projects wed one-timebout $ 2.3 mmately $17 m
nced maintetenance pramaintenanaining insulof potential d.
f Potential nt Method
y efficiency of 70 proje
ission reducannually. Twould be 0.e costs for amillion. Themillion.
enance praactices andce practicelation, and GHG emis
GHG Redu
improvemeects were idctions, prov
The total es05 tpd for Nall of these ese projects
ctices are d are designes include: regularly sion reduct
uctions by
ent projectsdentified forvided in thestimated NONOx and 0.0projects ar
pump function 18,360 $1,450,000 $0 $1,548,000 0.014 0.002
Improve Controls/
Maintenance Practice/
Management Systems
Install equipment to reduce electrical demand, install more efficient
systems, infrastructure maintenance,
continue to educate operators
3,230 $4,185,000 $201,000 $1,229,000 0.007 0.001
Total 94,880 $215,632,000 $2,275,000 $17,407,000 0.051 0.009
The greatest GHG reductions from electric equipment projects would come from equipment upgrades/new technologies and process change projects. Equipment upgrades/new technologies are projects designed to improve the efficiency of electrical equipment including improving motors, improving pumps, replacing inefficient equipment with pumps, system optimization, and installing new units. Examples of equipment upgrades include upgrading motors or installing VSDs, resizing fan impellers, replacing steam turbine drivers with electric motors. Process changes are projects designed to improve systems electrical efficiency and include changing operating parameters, installing more efficient systems, and optimizing motor usage. Examples of process changes include reducing the numbers of process stages at which a pump must operate, improving flare gas compressor operating system management, and increasing operating pressures to allow pumps to be turned off when not in use. Figure I-3 shows the distribution of potential GHG emission reductions by efficiency improvement method.
Figure I
Other Eq Table I-1related tequipmereductio1.0 MMTthese prcapital cpresentebillion anannual s
I-3. Electri
quipment P
11 providesto other equent categorns for theseTCO2e annrojects woucosts, assoced in this tand annual csaving of ne
ic Equipmeby E
Projects
s informatiouipment proized as “Ote projects, ually. The ld be 1.1 tociated annuable. The tocosts of aboearly $42 m
ent ProjectEfficiency I
on on identiojects at refther Equipmprovided intotal poten
ons/day for ual costs, aotal one-timout $1.8 mi
million.
20
ts- DistribuImproveme
fied energyfineries. Th
ment”. The n the third ctial NOx anNOx and 0nd associa
me costs forllion. Thes
ution of Poent Method
y efficiency here are 46total estim
column of thnd PM redu.3 tons/dayted annual r all of thesese projects w
otential GHd
improveme6 projects idated GHG he table, aructions assoy PM. Tota
savings are projects awould also
HG Reduct
ent projectsdentified foremission
re about ociated withal one-time re also are over $1result in a
tions
s r
h
.3 net
21
Table I-11: Other Equipment Projects – Estimated Emission Reductions and Costs
Total 1,012,740 $1,349,666,000 $1,832,000 $41,824,000 1.14 0.30
The greatest GHG reductions from other equipment-related projects would come from equipment upgrades, new technologies/research investment/other, and process change projects. Equipment upgrades are projects designed to increasing system efficiency through upgrading equipment such as building lighting or HVAC systems. New technologies include the purchase of state-of-the-art equipment to replace old or outdated equipment. Process change are projects designed for optimizing process efficiency and includes more effective hydrogen recovery from process gas or optimizing hydrogen flow. Figure I-4 shows the distribution of potential GHG emission reductions by efficiency improvement method.
Figur
Stationa Table I-1related tidentifiedreductio0.04 MMthese prone-timepresenteand annsaving o
re I-4. Othe
ary Combus
12 providesto stationard for stationns for these
MT CO2e anrojects woue capital coed in this ta
nual costs oof approxim
r EquipmenE
stion Projec
s informatioy combustinary enginee projects, nnually. Thld be 0.01 t
osts, associable. The toof about $0.
mately $3.8
nt Projects -Efficiency Im
cts
on on idention projects
e equipmenprovided in
he total estimton/day for ated annuaotal one-tim4 million. Tmillion.
22
- Distributiomprovemen
fied energys at refinerient. The totan the third cmated NOx
NOx and leal costs, andme costs forThese proje
on of Potent Method
y efficiency es. A total al estimatedcolumn of thx and PM reess than 0.0d associater all of theseects would
ntial GHG Re
improvemeof eight pro
d GHG emihe table, areductions a01 ton/day ed annual se projects aalso result
The sole identified area for potential GHG reductions from stationary combustion projects would come from equipment upgrade projects. Equipment upgrade projects would focus on installing more efficient systems such as power recovery turbines. Steam Equipment Projects Table I-13 provides information on identified energy efficiency improvement projects related to steam equipment at refineries. A total of 26 projects were identified in the steam equipment category. The total estimated GHG emission reductions for these projects, provided in the third column of the table, are over 0.2 MMTCO2e annually. The total estimated NOx and PM reductions associated with these projects would be 0.2 tons/day for NOx and 0.04 tons/day PM. Total one-time capital costs, associated annual costs, and associated annual savings are also presented in this table. The total one-time costs for all of these projects are over $220 million and annual costs of about $2.1 million. However, these projects would also result in a net annual saving of approximately $22 million.
Change pipe size, install new parts, improve by modification
13,250 $6,725,000 $0 $1,526,000 0.003 0.002
Improve Controls/ Process Change/
Maintenance Practice
Optimize equipment operation, improve system
efficiency, maximize equipment
efficiency, use excess steam to drive other equipment, implement
regular repair schedule
14,255 $3,864,000 $15,000 $5,556,000 0.025 0.002
Total 236,305 $222,744,000 $2,083,000 $21,975,000 0.22 0.044
The greatest GHG reductions from steam equipment-related projects would come from equipment upgrade projects/new technologies. Equipment upgrade projects include replacing inefficient equipment and installing new systems. Examples of equipment upgrades include resizing compressor piping to reduce pressure drops and installing new flow meters, control valves, or process control systems. Figure I-5 shows the distribution of potential GHG emission reductions by efficiency improvement method.
Figure
Thermal Table I-1related tidentifiedthese prannuallywould beassociattable. Tcosts of approxim
e I-5. Steam
l Equipmen
14 providesto thermal ed for thermrojects, provy. The totale 0.6 tons/dted annual
The total onabout $3.5
mately $65
m Equipmeby E
nt Projects
s informatioequipment al equipmevided in thel estimated day for NOx
costs, and e-time cost
5 million. Tmillion.
ent ProjectEfficiency I
on on identiprojects at
ent. The tote third colum
NOx and Px and 0.1 toassociated
ts for all of these projec
25
ts-DistribuImproveme
fied energyrefineries. tal estimatemn of the taPM reductioons/day PMd annual savthese projects would a
tion of Potent Method
y efficiency A total of 1
ed GHG emable, are ovons associa
M. Total onevings are a
ects are ovealso result in
tential GHGd
improveme134 projects
missions redver 0.7MMTated with thee-time capitalso presener $385 milln a net ann
G Reductio
ent projectss were ductions forTCO2e ese projectal costs, ted in this lion and an
Total 730,410 $385,783,000 $3,479,100 $64,909,000 0.62 0.10
The largest GHG reductions from thermal equipment-related projects would occur due to process changes, improved controls, equipment upgrades, and enhanced maintenance practices. Process changes include improving heat recovery, changing a process element, and changing a system element. Examples of process changes include: improving heat recovery from unit air coolers, switching product from one process loop to a more energy efficient process loop, and shutting down inefficient system units. Improving controls include: installing oxygen monitoring systems, improving overall system controls, and improving process efficiencies. Examples of improving controls include: installing additional oxygen analyzers, upgrading a process to reduce firing, and optimizing system operating temperatures. Equipment upgrades include: improving heat exchange equipment, installation of more efficient equipment (i.e., replacing turbines with electric motors), and improving system insulation.
g older equw heat conveed. Enhancce schedulenace mainttial GHG em
Distributiorovement M
uipment, insection systeced maintees and revistenance anmission red
n of PotenMethod
stalling ems, and
enance sing cleanind cleaning
ductions by
ntial GHG
ng
28
Summary Table I-15 summarizes, by “Equipment Category,” the number of projects and the estimated GHG, NOx, and PM emission reductions associated with the energy efficiency improvement projects identified in the EEA Reports. The estimated GHG emission reductions are approximately 2.8 MMTCO2e annually.
Table I-15: Estimated GHG and Criteria Pollutants Emission Reductions from Energy Efficiency Improvement Projects Identified in EAA Reports*
Equipment Category Number
of Projects
GHG (MMTCO2e)
NOx (tons per day)
PM (tons per day)
A. Boiler 117 0.67 0.49 0.12 B. Electrical Only
Equipment 70 0.09 0.05 0.009
C. Other Equipment (included refinery-wide processes)
46 1.01 1.14 0.30
D. Stationary Combustion 8 0.04 0.008 0.002
E. Steam Only System 26 0.24 0.22 0.04
F. Thermal Equipment 134 0.73 0.62 0.10
Total 401 2.78 2.52 0.57 *Includes all reported projects except those identified as “Not Implementing.”
Figure 1-7 shows pictorially the relative contribution of each equipment category to the total GHG reductions. As shown in the figure, the equipment categories with the greatest potential GHG emission reduction are “Other Equipment,” “Thermal Equipment,” and “Boiler.”
Figure
Table I-1costs, animprovefor all of$2.6 billia net anThey areaccurate
Tab
Number oProjects
401 * Includes a“Not Implem
I-7 Potenti
16 providesnd annual sment projef these projeion with an
nnual savinge not basedely estimate
ble I-16 Sum
of s
On
ll projects identifmenting”
ial Refinery
s a summarsavings for cts identifieects (excepannual cos
g of approxd on detailee emission
mmary of E
ne Time Cost(million $)
$2,607 ied as Complete
y GHG Em
ry of the esthe approx
ed in the EEpt for those st of about $ximately $20ed engineerreductions,
Estimated Improve
t
d/Ongoing, Sche
29
missions Re
stimated totaximately 400EA Reports
identified a$17 million00 million. ring and cos, costs, and
Costs andement Proje
Annual C(million $/y
$17.1eduled, or Under
eductions
al one-time0 potential
s. The totalas “Not Imp. These prThese estist analysis d timing of t
d Savings fects*
Cost year)
r Investigation. D
by Equipm
e capital cosenergy effi potential o
plementing”rojects woumates are that would
the projects
for Energy
Annua(millio
$Does not include
ment Categ
sts, annual ciency
one-time co”) are ld also resupreliminarybe require
s.
y Efficiency
l Savings n $/year)
$203 project identified
gory
osts
ult in y. d to
y
d as
30
I.5 Implementation Status of Energy Efficiency Improvement Opportunities Many of the projects identified in Section I-4 have already occurred or will occur over the next few years. Refineries subject to the EEA Regulation identified over 400 energy efficiency improvement projects and assigned these projects to one of four categories:
Completed/Ongoing Scheduled Under Investigation or Not Implementing
Only 15 of the over 400 projects were identified as not being implemented. Table I-17 shows the estimated GHG, NOx, and PM emission reductions associated with the energy efficiency improvement projects identified in the EEA Reports as either completed, ongoing, scheduled, or under investigation, by project status. The reductions associated with the Completed/Ongoing projects were divided into two subcategories based on if the projects were completed before 2010 or during/after 2010. This was done to avoid double counting of GHG emission reductions since reductions occurring before 2010 should already be reflected in the 2009 GHG Mandatory Reporting.
Table I-17: Estimated GHG, NOx, and PM Emission Reductions by Project Status Project Status GHG Reductions
MMTCO2e /year (% of total)
NOx Reductions tons/day
(% of total)
PM Reductions tons/day
(% of total) Complete/Ongoing Pre-2010
1.37 1.36 0.33
Complete/Ongoing 2010+
0.81 0.8 0.12
Completed/Ongoing Total
2.18 (78%) 2.2 (88%) 0.45 (80%)
Scheduled 0.20 (7%) 0.1 (4%) 0.05 (9%) Under Investigation 0.40 (15%) 0.2 (8%) 0.06 (11%) Subtotal Pre-2010 1.37 (49%) 1.3 (52%) 0.33 (59%) Subtotal 2010+ 1.41 (51%) 1.2 (48%) 0.23 (41%) Total 2.78 2.5 0.56 Two things of note in Table I-17 are that nearly 80 percent of the estimated GHG reductions come from Completed/Ongoing projects and that about 50 percent of all estimated GHG reductions occurred before 2010. This is shown pictorially in Figure I-8. Similarly, 80 to 90 percent of the identified NOx and PM emission reductions are associated with projects that are either completed or ongoing, however, only an estimated 50 to 60 percent of the identified emission reductions are thought to be reflected in the reported 2009 emissions inventories. Approximately half of the identified NOx and PM reductions will further reduce the emissions reported for 2009, if completed.
It shouldimprovethose idwere repestimatereportedprojects reductioAs statereport thhave cothe repoanticipat
Figu
d be noted, ment projeentified as ported as Ced GHG, NOd as Schedu
that deal wns do not n
ed in the Inthat will inclumpleted ou
orts from thete releasing
ure I-8. Est
that the escts identifie“Not Implem
Completed/OOx, and PMuled or Undwith the samnecessarily roduction a
ude all sectur review ane third partyg this subse
timated GH
stimated reded in the EEmenting.” TOngoing, w
M reductionsder Investigme equipmerepresent r
and Summaors. We in
nd analysis y reviewer, equent repo
31
HG Reduct
ductions asEA ReportsThis assum
which make s. Howevegation may ent or procereadily achary, ARB statend to releof the inforand other a
ort in the lat
tion by Pro
ssume that s will be impmption is acc
up about 8r, implemepreclude thesses. Theievable on-aff will be dease this surmation proapplicable tter part of
oject Statu
all of the enplemented, curate for p
80 to 90 perntation of s
he implemeerefore, the-site emissideveloping ubsequent rovided in thinformation2013.
s
nergy efficieexcept for
projects tharcent of thesome projecntation of o
ese estimateon reductioa subsequereport oncee EEA Rep
n. We
ency
at e cts other ed ons. ent e we ports,
32
References 1) (Worrell and Galitsky, 2005), Energy Efficiency Improvement and Cost Saving Opportunities
for Petroleum Refineries, Ernest Orlando Lawrence Berkeley National Laboratory, February, 2005.
2) (Sheridan, 2006), California Crude Oil Production and Imports, California Energy
Commission, April, 2006.
3) (Leffler, 1979), Petroleum Refining for the Nontechnical Person, 1979.
4) (EIA, 2009), U.S. Energy Information Administration, 2009.
5) (EIA, 2012), U.S. Energy Information Administration, 2012, http://www.eia.gov/dnav/pet/pet_pnp_crq_dcu_r50_a.htm
7) (OEHHA, 2009) Technical Support Document for Cancer Potency Factors: Methodologies for derivation, listing of available values and adjustments to allow for early life stage exposures, California Environmental Protection Agency Office of Environmental Health Hazard Assessment Air Toxicology and Epidemiology Branch, May 2009.
33
Part II – Facility Specific Information for Refineries II.0 Introduction Part II of this report provides refinery-specific information about each of the 12 refineries submitting EEA Reports. Each refinery has a separate section that provides information on the current (generally 2009, 2010 in a few cases) emissions for GHG, criteria pollutants, and TACs from the specific facility and a summary of the potential energy efficiency improvement projects that refinery staff identified in their EEA Report. The projects are grouped by timing (Completed/Ongoing, Scheduled, or Under Investigation). The projects are then listed by Equipment Category and Equipment Sub-type. All information provided, including inventory data as well as identified project costs and benefits, is as reported by the facilities in their EEA Reports. Inventory data may not agree with other published data due to the inclusion of more recent data provided by the facility. Equipment Sub-type provides a general description of the types of equipment affected by the improvement project but does not provide a detailed explanation of each of the 400 projects identified or refinery-specific variations from the general description. Information about cost and potential emission reductions of GHG, criteria pollutants, and TACs, summed for all the projects (by Equipment Category and Equipment Sub-type), is provided. In compliance with the confidentiality requirement under CCR§95610, he specific details about the individual projects were not presented. While it is not possible to release the specific details for each project a refinery has identified, it is possible to get a good indication of what equipment, what action(s), and timeframe were considered by referring back to the sector-wide project information in Part I and specifically Tables I-9 through I-14.
34
II.1 BP - Carson General Information BP – Carson is located in the South Coast Air Quality Management District (SCAQMD). The refinery started production in 1923. It covers 630 acres and employs approximately 1,100 employees and 600 contractors. The refinery can process 275,000 barrels of crude oil daily, a large part of which comes from the Alaskan North Slope. Approximately 90 percent of the crude oil that enters the BP - Carson refinery emerges as transportation fuel, supplying roughly 25 percent of Southern California’s gasoline and 40 percent of its diesel fuel demand. Other products produced by the BP – Carson refinery include jet fuel, fuel gas, propylene, and petroleum coke. Emissions Table II-1 provides the 2009 GHG emissions reported by BP - Carson in compliance with ARB’s GHG Mandatory Reporting Regulation. BP - Carson is the second largest GHG emitter of the 12 refineries subject to the EEA Regulation and contributes 14 percent of the total GHG emissions in this sector.
Table II-1: BP - Carson 2009 Greenhouse Gas Emissions Pollutant 2009 Annual Emissions (MMTCO2e)
GHG 4.4 In addition, the facility reported the following emissions of criteria pollutants as shown in Table II-2.
Reactive Organic Gases (ROG) 540 Carbon monoxide (CO) 710 Oxides of Nitrogen (NOx) 650 Oxides of Sulfur (SOx) 580 Particulate Matter (PM) 310 Table II-3 lists the top ten TACs ranked according to the combined mass TAC emissions and cancer potency factor, as described in Section 1.2.
35
Table II-3: BP – Carson 2009 Top Ten Prioritized Toxic Air Contaminant Emissions
Toxic Air Contaminant* 2009 Emissions (pounds/year)
Polycyclic Aromatic Hydrocarbons (total) 1,250
Chromium, hexavalent (& compounds) 1
1,3-Butadiene 310
Benzene 1,115
Formaldehyde 5,200
Cadmium 6
Arsenic 6
Nickel 17
Beryllium <1
Perchloroethylene 137
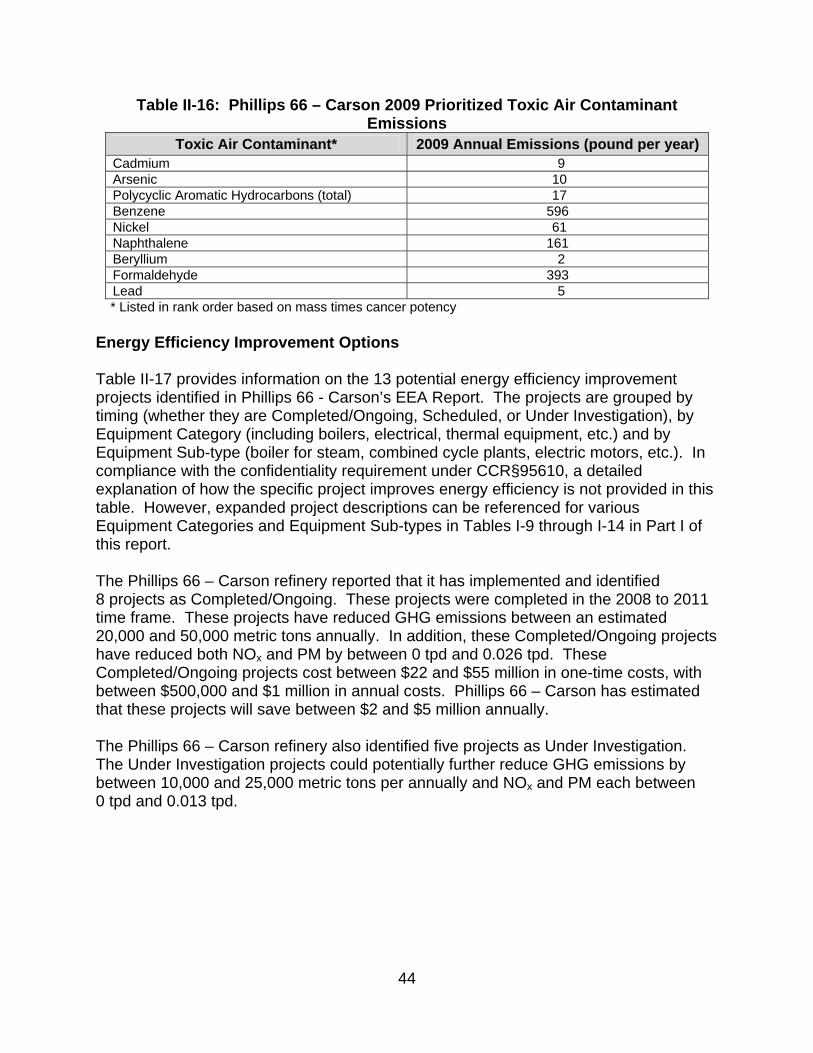
Ethylene dibromide 3 * Listed in rank order based on mass times cancer potency Energy Efficiency Improvement Options Table II-4 provides information on the 41 potential energy efficiency improvement projects identified in BP - Carson’s EEA Report. The projects are grouped by timing (whether they are Completed/Ongoing, Scheduled, or Under Investigation), by Equipment Category” (including boilers, thermal equipment, other equipment, etc.) and by equipment sub-type (boiler for steam, combined cycle plants, dryers, etc.). A detailed explanation of how the specific project improves energy efficiency is not provided in this table in compliance with the confidentiality requirements under CCR §95610.. However, expanded project descriptions can be referenced for various Equipment Categories and Equipment Sub-types in Tables I-9 through I-14 in Part I of this report. The BP – Carson refinery reported that it has implemented and identified 21 projects as Completed/Ongoing. These projects, completed in the 2009 to 2011 time frame, have reduced GHG emissions an estimated 152,000 metric tons annually. In addition, these projects have reduced NOx and PM by approximately 0.064 and 0.015 tons per day (tpd), respectively. The Completed/Ongoing projects cost approximately $175 million in one-time costs, with an additional $500,000 in annual costs. BP – Carson has estimated that these projects will save approximately $11 million annually. The BP – Carson refinery also identified 7 projects as Scheduled and 13 projects as Under Investigation. The Scheduled projects will further reduce GHG emissions by an estimated 25,000 metric tons annually and NOx and PM by 0.014 tpd and 0.004 tpd, respectively. The projects under investigation could potentially reduce GHG emissions by another 38,000 metric tons annually and NOx and PM by 0.019 tpd and 0.005 tpd, respectively.
36
Table II-4: BP – Carson Energy Efficiency Options Reported as Completed/Ongoing, Scheduled, or Under Investigation
Totals for All Projects 41 215,000 201,929,000 1,051,000 19,523,000 0.097 0.024
The BP – Carson refinery also identified six projects as not being implemented due to the cost effectiveness. These projects are listed in Table II-5. The Equipment Category, Equipment Sub-type, number of projects, and a brief description of the reason the projects were not being implemented are listed in Table II-5.
Table II-5: BP - Carson Energy Efficiency Options Not Being Implemented Timing Equipment Category Equipment Sub-type
Number of Projects
Reason Why Project Not Being Implemented
Not Being Implemented
Boilers/Other Boiler for steam/Other 4 Not cost effective
Thermal Equipment Other 2 Not cost effective
37
II.2 Chevron - El Segundo General Information Chevron – El Segundo is located in the South Coast Air Quality Management District (SCAQMD). The refinery started production in 1911. It covers 1,000 acres and employs approximately 1,200 employees and 500 contractors. The refinery can process 290,000 barrels of crude oil daily. The majority of the crude oil is refined as transportation fuel, supplying Southern California with gasoline and diesel fuel. Other products produced by the Chevron – El Segundo refinery include jet fuel, fuel oil, liquid petroleum gas (LPG), and petroleum coke. Emissions Table II-6 provides the 2009 GHG (C02e) emissions reported by Chevron – El Segundo in compliance with ARB’s GHG Mandatory Reporting Regulation. The Chevron – El Segundo refinery contributes 10 percent of the total GHG emissions from this sector.
Table II-6: Chevron – El Segundo 2009 Greenhouse Gas Emissions Pollutant 2009 Annual Emissions (MMTCO2e)
GHG 3.2 In addition, the facility reported the following emissions of criteria pollutants as shown in Table II-7.
Table II-7: Chevron – El Segundo 2010 Criteria Pollutant Emissions Criteria Pollutant 2010 Annual Emissions (tpy)
Reactive Organic Gases (ROG) 550 Carbon monoxide (CO) 1,050 Oxides of Nitrogen (NOx) 640 Oxides of Sulfur (SOx) 430 Particulate Matter (PM) 210* * SCAQMD reported value of 270 tpy Table II-8 lists the top ten TACs ranked according to the combined mass TAC emissions and cancer potency factor, as described in Section 1.2.
38
Table II-8: Chevron – El Segundo 2010 Top Ten Prioritized Toxic Air Contaminant Emissions
Toxic Air Contaminant* 2010 Annual Emissions (pounds per year)
Cadmium 37
Nickel 195
Polychlorinated Dibenzofurans <1
Benzene 916
Arsenic 7
Formaldehyde 3,282
Naphthalene 360
Polycyclic Aromatic Hydrocarbons (total) 7
1,3-Butadiene 37
Beryllium <1 * Listed in rank order based on mass times cancer potency Energy Efficiency Improvement Options Table II-9 provides information on the 28 potential energy efficiency improvement projects identified in Chevron - El Segundo’s EEA Report. The projects are grouped by timing (whether they are Completed/Ongoing, Scheduled, or Under Investigation), by Equipment Category (including boilers, electrical only, thermal equipment, etc.) and by equipment sub-type (a boiler for steam, combined cycle plants, dryers, etc.). In compliance with the confidentiality requirement under CCR§95610, a detailed explanation of how the specific project improves energy efficiency is not provided in this table. However, expanded project descriptions can be referenced for various Equipment Categories and equipment sub-types in Tables I-9 through I-14 in Part I of this report. The Chevron – El Segundo refinery reported that it has implemented 27 projects identified as Completed/Ongoing. These projects were completed in the 2007 to 2011 time frame. The 27 projects have reduced GHG emissions between an estimated 74,000 and 196,000 metric tons annually. In addition, these Completed/Ongoing projects have reduced NOx and PM by a total of approximately 0.054 tpd to 0.088 tpd and 0.011 tpd to 0.029 tpd, respectively. These Completed /Ongoing projects cost approximately $320 to $520 million in one-time costs, with an additional $2.5 to $2.7 million in annual costs. Chevron - El Segundo has estimated that these projects will save approximately $3.8 to $5.1 million annually. No specific cost or GHG benefit data are provided in this public report for the one project listed as Under Investigation. These data could not be aggregated in such a way as to protect the confidentiality of the data. However, this project was included in the full list of possible projects in Tables I-9 through I-14 in Part I of this report
39
Table II-9: Chevron – El Segundo Energy Efficiency Options Reported as Completed/Ongoing, Scheduled, or Under Investigation
Timing Equipment Category
Equipment Sub-type Number
of Projects
Estimated GHG
Reduction (Metric
tons per year)
One Time Cost ($)
Annual Cost ($)
Annual Savings
($)
Potential NOx
Reduction (tons/day)
Potential PM
Reduction (tons/day)
Completed/ Ongoing
Boilers/ Steam Only Equipment
Boiler for steam /Combined cycle plant/Steam motors - air compressors
9 16,200 – 57,000
107,797,000 –
177,017,000
843,000 – 908,000
1,783,000 –
2,783,000
0.006 - 0.0134
0.0014 - 0.0068
Electrical Only
Equipment
Electric motors - pumps and fans/Electric motors - HVAC and refrig equipment/ Other
10 11,600 – 36,200
61,310,000 – 161,550,000
769,998 – 829,998
935,000 – 1,125,000
0 0
Thermal Equipment
Dryer/ Furnace/ Other
8 46,300 – 103,000
153,683,000 –
184,933,000
917,000 – 957,000
1,067,000 –
1,217,000
0.048 - 0.074
0.0093 - 0.022
Under Investigation
Other Other 1 CBI CBI CBI CBI CBI CBI
Totals for All Completed / Ongoing Projects 27 74,100 – 196,200
322,790,000 –
523,500,000
2,530,000 –
2,695,000
3,785,000 –
5,125,000
0.054 - 0.088
0.011 - 0.029
CBI - Confidential Business Information pursuant to CCR§95610
40
II.3 Chevron – Richmond General Information Chevron – Richmond is located in the Bay Area Air Quality Management District (BAAQMD). The refinery started production in 1902. It is located on 2,900 acres and employs approximately 1,200 employees and 450 contractors. The refinery can process 245,000 barrels of crude oil daily. The majority of the crude oil is refined as transportation fuel, supplying Northern California with gasoline and diesel fuel. Other products produced by the Chevron – Richmond refinery include jet fuel, fuel oil, liquid petroleum gas (LPG), and lubricants. The refinery also produces hydrogen for its own use. Emissions Table II-10 provides the 2009 GHG emissions reported by Chevron - Richmond in compliance with ARB’s GHG Mandatory Reporting Regulation. The emissions include on-site hydrogen production which accounts for approximately one-third of the total emissions. Chevron - Richmond contributed 14 percent of the total GHG emissions in this sector for 2009.
Total Organic Gases (TOG) 1,010 Carbon monoxide (CO) 380 Oxides of Nitrogen (NOx) 840 Oxides of Sulfur (SOx) 370 Particulate Matter (PM) 460 Table II-12 lists the 2010 top ten TACs as calculated by the BAAQMD ranked according to the combined mass TAC emissions and cancer potency factor, as described in Section 1.2. These TAC emissions estimates are made by the BAAQMD for the purpose of assessing fees and in some instances, e.g. benzene and PAHs, may significantly overstate emissions.
41
Table II-12: Chevron – Richmond 2010 Top Ten Prioritized Toxic Air Contaminant Emissions
Toxic Air Contaminant* 2010 Annual Emissions (pounds per year)
Perchloroethylene 23 * Listed in rank order based on mass times cancer potency Energy Efficiency Improvement Options Table II-13 provides information on the 76 potential energy efficiency improvement projects identified in Chevron - Richmond’s EEA Report. The projects are grouped by timing (whether they are Completed/Ongoing, Scheduled, or Under Investigation), by Equipment Category (including boilers, electrical, thermal equipment, etc.) and by Equipment Sub-type (boiler for steam, combined cycle plants, electric motors, etc.). In compliance with the confidentiality requirement under CCR§95610, a detailed explanation of how the specific project improves energy efficiency is not provided in this table. However, expanded project descriptions can be referenced for various Equipment Categories and Equipment Sub-types in Tables I-9 through I-14 in Part I of this report. The Chevron – Richmond refinery reported that it has implemented 57 Completed/Ongoing projects. These projects have reduced GHG emissions an estimated 250,000 to 500,000 metric tons annually. Two of the reported projects were completed in 1992 and 1995. The remaining projects were completed in the 2006 to 2011 time frame. The Completed/Ongoing projects have reduced NOx and PM by approximately 0.16 tpd to 0.29 tpd and 0.04 tpd to .11 tpd, respectively. These Completed/Ongoing projects cost approximately $140 to $490 million in one-time costs, with an additional $1.6 to $3.3 million in annual costs. Chevron – Richmond has estimated that these projects will save approximately $10 to $15 million annually. The Chevron – Richmond refinery also identified 10 projects as Scheduled and 9 projects as Under Investigation. The Scheduled projects will further reduce GHG emissions by 70,000 to 115,000 metric tons annually and NOx and PM by 0.034 tpd to 0.046 tpd and 0.029 tpd to 0.034 tpd, respectively. GHG Emission benefits and costs for the projects identified as Under Investigation are yet to be determined.
42
Table II-13: Chevron – Richmond Energy Efficiency Options Reported as Completed/Ongoing, Scheduled, or Under Investigation
Timing Equipment Category
Equipment Sub-type
Number of
Projects
Estimated GHG
Reduction (Metric
tons per year)
One Time Cost ($)
Annual Cost ($)
Annual Savings
($)
Potential NOx
Reduction (tons/day)
Potential PM
Reduction (tons/day)
Completed/Ongoing
Boilers / Steam Only
Equipment
Boiler for steam / Combined cycle plant /
Steam motors - other
29 215,700 - 387,100
135,930,000 -
445,900,000
1,150,000 -
2,160,000
6,280,000 - 8,485,000
0.14 - 0.24 0.033 -
0.09
Electrical Only Equipment
Electric motors - air compressors / Electric motors
- pumps and fans / Electric motors - other
14 3,700 - 22,400
3,280,000 - 24,750,000
100,000 - 380,000
1,305,000 - 2,205,000
0 0
Other Other 3 5,100 - 11,100
1,600,000 - 11,500,000
60,000 - 135,000
510,000 - 535,000
0.005 - 0.014
0.0014 - 0.0027
Stationary Combustion
Engines
Stationary gas turbine - electricity
4 1,300 - 8,000
80,000 - 250,000
0 - 40,000 475,000 - 1,050,000
0 0
Thermal Equipment
Furnace 7 24,000 - 65,000
1,360,000 - 3,650,000
280,000 - 605,000
1,500,000 - 2,600,000
0.017- 0.04 0.005 - 0.015
Scheduled
Boilers Boiler for steam 3 1,200 - 7,000
10,100,000 - 100,200,000
0 - 30,000 135,000 - 325,000
0.0019 - 0.005
0.0008 - 0.004
Electrical Only Equipment /
Other
Electric motors - other/Other
4 50,300 - 53,000
111,010,000 -
210,050,000 0 - 40,000
625,000 - 750,000
>0.027 >0.027
Stationary Combustion
Engines / Thermal
Equipment
Stationary gas turbine –
electricity / Stationary
reciprocating - other /Furnace
3 21,000 - 55,000
12,000,000 - 120,000,000
10,000 - 45,000
1,500,000 0.0054- 0.014
0.0014 - 0.0027
Under Investigation
Boilers / Steam Only
Equipment / Thermal
Equipment
Boiler for steam / Steam motors
– other / Furnace
6 TBD TBD TBD TBD TBD TBD
Electrical Only Equipment
Electric motors - pumps and fans
3 TBD TBD TBD TBD TBD TBD
Totals for All Projects 76 322,300 - 608,600
275,360,000 -
916,300,000
1,600,000 -
3,435,000
12,330,000 -
17,450,000 0.20 - 0.34
0.069 - 0.14
43
II.4 Phillips 66 – Carson General Information Phillips 66 – Carson, part of the Phillips 66 Los Angeles Refinery, is located in the SCAQMD. Phillips 66 assumed ownership of the Los Angeles Refinery from ConocoPhillips on May 1, 2012. The refinery processes mainly heavy, high-sulfur crude oil. It receives domestic crude via pipeline from California, and both foreign and domestic crude by tanker through a third-party terminal in the Port of Long Beach. The refinery produces a high percentage of transportation fuels, such as gasoline, diesel, fuel and jet fuel. Other products include fuel-grade petroleum coke. The Phillips 66 Los Angeles Refinery is composed of two linked facilities located roughly five miles apart in Carson and Wilmington, California, about 15 miles southeast of Los Angeles International Airport. Carson serves as the front-end of the refinery by processing crude oil and Wilmington serves as the back-end by upgrading the intermediate products to finished products. Emissions Table II-14 provides the 2009 GHG emissions reported by Phillips 66 - Carson in compliance with ARB’s GHG Mandatory Reporting Regulation. Phillips 66 - Carson emits 2.5 percent of the total GHG emissions from the Refinery Sector.
Total Organic Gases (TOG) 160 Reactive Organic Gases (ROG) 110 Carbon monoxide (CO) 280 Oxides of Nitrogen (NOx) 340 Oxides of Sulfur (SOx) 320 PM 2.5 50 PM 10 50 Table II-16 lists the top ten TACs ranked according to the combined mass TAC emissions and cancer potency factor, as described in Section 1.2.
Toxic Air Contaminant* 2009 Annual Emissions (pound per year) Cadmium 9 Arsenic 10 Polycyclic Aromatic Hydrocarbons (total) 17 Benzene 596 Nickel 61 Naphthalene 161 Beryllium 2 Formaldehyde 393 Lead 5
* Listed in rank order based on mass times cancer potency Energy Efficiency Improvement Options Table II-17 provides information on the 13 potential energy efficiency improvement projects identified in Phillips 66 - Carson’s EEA Report. The projects are grouped by timing (whether they are Completed/Ongoing, Scheduled, or Under Investigation), by Equipment Category (including boilers, electrical, thermal equipment, etc.) and by Equipment Sub-type (boiler for steam, combined cycle plants, electric motors, etc.). In compliance with the confidentiality requirement under CCR§95610, a detailed explanation of how the specific project improves energy efficiency is not provided in this table. However, expanded project descriptions can be referenced for various Equipment Categories and Equipment Sub-types in Tables I-9 through I-14 in Part I of this report. The Phillips 66 – Carson refinery reported that it has implemented and identified 8 projects as Completed/Ongoing. These projects were completed in the 2008 to 2011 time frame. These projects have reduced GHG emissions between an estimated 20,000 and 50,000 metric tons annually. In addition, these Completed/Ongoing projects have reduced both NOx and PM by between 0 tpd and 0.026 tpd. These Completed/Ongoing projects cost between $22 and $55 million in one-time costs, with between $500,000 and $1 million in annual costs. Phillips 66 – Carson has estimated that these projects will save between $2 and $5 million annually. The Phillips 66 – Carson refinery also identified five projects as Under Investigation. The Under Investigation projects could potentially further reduce GHG emissions by between 10,000 and 25,000 metric tons per annually and NOx and PM each between 0 tpd and 0.013 tpd.
45
Table II-17: Phillips 66 – Carson Energy Efficiency Options Reported as Completed/Ongoing, Scheduled, or Under Investigation
Timing Equipment Category
Equipment Sub-type
Number of
Projects
Estimated GHG
Reduction (Metric
tons per year)
One Time Cost ($)
Annual Cost ($)
Annual Savings
($)
Potential NOx
Reduction (tons/day)
Potential PM
Reduction (tons/day)
Completed/ Ongoing
Boilers/Thermal Equipment
Boiler for steam/Furnace
5 10,000 - 25,000
2M - 5M
- 1M - 2.5M
0 – 0.013 0 – 0.013
Electrical Only Equipment/Other
Electric motors - other/Other
3 10,000 - 25,000
20M -
50M
500K - 1M
1M - 2.5M
0 – 0.013 0 – 0.013
Under Investigation
Thermal Equipment
Furnace/Other 5 10,000 - 25,000
10M -
20M -
1M - 2.5M
0 – 0.013 0 – 0.013
Totals for All Projects 13
60,000 - 100,000
20M -
50M
500K - 1M
5M - 10M
0 – 0.039 0 – 0.039
46
II.5 Phillips 66 – Wilmington General Information Phillips 66 – Wilmington, part of the Phillips 66 Los Angeles Refinery, is located in the SCAQMD. The refinery has a capacity of 139,000 barrels of crude oil daily, and produces a high percentage of transportation fuels, such as gasoline, diesel fuel, and jet fuel. Phillips 66 assumed ownership of the Los Angeles Refinery from ConocoPhillips on May 1, 2012. As mentioned in section II.4, the Phillips 66 – Wilmington refinery is linked to the Phillips 66 – Carson facility and serves as the final processing facility for products initially processed at the Phillips 66 – Carson facility. Emissions Table II-18 provides the 2009 GHG emissions reported by Phillips 66 - Wilmington in compliance with ARB’s GHG Mandatory Reporting Regulation. Phillips 66 - Wilmington emits about 6 percent of the total GHG emissions from the Refinery Sector.
Table II-18: Phillips 66 – Wilmington 2009 Greenhouse Gas Emissions
Pollutant 2009 Annual Emissions (MMTCO2e) GHG 1.8
In addition, the facility reported the following emissions of criteria pollutants as shown in Table 11-19.
Total Organic Gases (TOG) 510 Reactive Organic Gases (ROG) 260 Carbon monoxide (CO) 460 Oxides of Nitrogen (NOx) 630 Oxides of Sulfur (SOx) 110 Particulate Matter (PM) 120 Table II-20 lists the top ten TACs ranked according to the combined mass TAC emissions and cancer potency factor, as described in Section 1.2.
47
Table II-20: Phillips 66 – Wilmington 2009 Top Ten Prioritized Toxic Air Contaminant Emissions
Toxic Air Contaminan*t 2009 Annual Emissions (pounds per year)
1,3-Butadiene 2,263
Cadmium 11
Nickel 123
Arsenic 8
Benzene 854
Naphthalene 553
Formaldehyde 2,876
Polycyclic Aromatic Hydrocarbons (total) 15
Beryllium 2
Lead 25 * Listed in rank order based on mass times cancer potency Energy Efficiency Improvement Options Table II-21 provides information on the 19 potential energy efficiency improvement projects identified in Phillips 66 - Wilmington’s EEA Report. The projects are grouped by timing (whether they are Completed/Ongoing, Scheduled, or Under Investigation), by Equipment Category (including boilers, electrical, thermal equipment, etc.) and by equipment sub-type (boiler for steam, combined cycle plants, electric motors, etc.). In compliance with the confidentiality requirement under CCR§95610, a detailed explanation of how the specific project improves energy efficiency is not provided in this table. However, expanded project descriptions can be referenced for various Equipment Categories and Equipment Sub-types in Tables I-9 through I-14 in Part I of this report. The Phillips 66 – Wilmington refinery reported that it has implemented and identified 7 projects as either Completed/Ongoing. These projects were completed in the 2009 to 2011 time frame. These projects have reduced GHG emissions between an estimated 35,000 and 85,000 metric tons annually. In addition, these Completed/Ongoing projects have reduced NOx and PM by a total between 0 tpd and 0.013 tpd, each. These Completed/Ongoing projects cost between $3 and $7 million in one-time costs, with less than $100,000 in annual costs. Phillips 66 - Wilmington has estimated that these projects will save between $3.5 and $7.5 million annually. The Phillips 66 – Wilmington refinery also identified 3 projects as Scheduled and 9 projects as under investigation. The Scheduled projects will further reduce GHG emissions by between an estimated 10,000 and 25,000 metric tons annually and no NOx and PM reductions. The projects Under Investigation could potentially reduce GHG emissions by between 70,000 and 125,000 metric tons annually and NOx and PM by between 0 tpd and 0.013 tpd and 0.013 tpd and 0.027 tpd, respectively.
48
Table II-21: Phillips 66 – Wilmington Energy Efficiency Options Reported as Completed/Ongoing, Scheduled, or Under Investigation
Timing Equipment Category Equipment Sub-
type
Number of
Projects
Estimated GHG
Reduction (Metric
tons per year)
One Time Cost ($)
Annual Cost ($)
Annual Savings
($)
Potential NOx
Reduction (tons/day)
Potential PM
Reduction (tons/day)
Completed/ Ongoing
Boilers Boiler for
steam/Boiler for cogeneration
3 25,000 - 60,000
1M - 2M
<100,000 2.5M -
5M 0 0 – 0.013
Thermal Equipment/Other/
Electrical only Equipment
Furnace/Other/ Electrical motors -
other 4
10,000 - 25,000
2M - 5M
- 1M - 2.5M
0 0
Scheduled Boilers/Steam Only
Equipment
Boiler for steam/Steam motors - air
compressors
3 10,000 - 25,000
2M - 5M
200,000 - 500,000
1M - 2.5M
0 0
Under Investigation
Boilers/Steam Only Equipment
Boiler for steam/Steam motors - other
4 60,000 - 100,000
50M - 75M
<100,000 5M - 10M
0 – 0.013 0.013 – 0.027
Thermal Equipment/Electrical
Only Equipment
Furnace/ Electric motors - pumps and fans
5 10,000 - 25,000
5M - 10M
- 1M - 2.5M
0 0
Totals for All Projects 19
100,000 - 150,000
50M - 75M
200,000 - 500,000
10M - 20M
0.013 – 0.027
0.027 – 0.055
49
II.6 Phillips 66 - San Francisco Refinery General Information Phillips 66 – San Francisco Refinery is located in the BAAQMD. It covers 1,100 acres and employs approximately 450 employees and 200 contractors. The refinery can process 125,000 barrels of crude oil daily. The majority of the crude oil is refined to produce transportation fuels such as gasoline and diesel fuel. Emissions Table II-22 provides the 2009 GHG emissions reported by Phillips 66 - San Francisco in compliance with ARB’s Energy Efficiency Assessment Regulation. Phillips 66 - San Francisco emits 6 percent of the total GHG emissions from the Refinery Sector. The emissions totals include the nearby Phillips 66 Contra Costa Carbon Plant.
Table II-22: Phillips 66 – San Francisco 2009 Greenhouse Gas Emissions Pollutant 2009 Annual Emissions (MMTCO2e)
GHG 2.0
In addition, the facility reported the following emissions that were compiled by BAAQMD of criteria pollutants as shown in Table II-23.
Table II-23: Phillips 66 – San Francisco 2009 Criteria Pollutant Emissions Criteria Pollutant 2009 Annual Emissions (tpy)
Total Organic Gases (TOG) 260 Reactive Organic Gases (ROG) 190 Carbon monoxide (CO) 330 Oxides of Nitrogen (NOx) 830 Oxides of Sulfur (SOx) 1,670 Particulate Matter (PM) 120 Table II-24 lists the top ten TACs as calculated by BAAQMD and then ranked according to the combined mass TAC emissions and cancer potency factor, as described in Section 1.2.
50
Table II-24: Phillips 66 – San Francisco Top 2009 Ten Prioritized Toxic Air Contaminant Emissions
Toxic Air Contaminant* 2009 Annual Emissions (pounds per
Acetaldehyde 76 * Listed in rank order based on mass times cancer potency Energy Efficiency Improvement Options Table II-25 provides information on the 39 potential energy efficiency improvement projects identified in Phillips 66 - San Francisco’s EEA Report. The projects are grouped by timing (whether they are Completed/Ongoing, Scheduled, or Under Investigation). In compliance with the confidentiality requirement under CCR§95610, a detailed explanation of how the specific project improves energy efficiency is not provided in this table. However, expanded project descriptions can be referenced for various Equipment Categories and sub-types in Tables I-9 through I-14 in Part I of this report. Project impacts estimate savings in avoided costs, greenhouse gas and co-pollutant reductions for Phillips 66 as well as other parties. The Phillips 66 – San Francisco refinery reported that it has implemented and identified 29 projects as Completed/Ongoing. These projects were completed in the 2007 to 2011 time frame. These projects have either avoided or reduced GHG emissions to be estimated between 110,000 and 250,000 metric tons annually. In addition, these Completed/Ongoing projects have avoided or reduced NOx and PM by between 0.15 tpd and 0.315 tpd and 0.013 tpd and 0.053 `tpd, respectively. These Completed/Ongoing projects cost between $120 and $240 million in one-time costs, with between $100,000 and $200,000 in annual costs. Phillips 66 – San Francisco has estimated that these projects will save or avoid between $12.5 and $25 million annually. The Phillips 66 – San Francisco refinery also identified 10 projects as under investigation. The projects under investigation could potentially reduce GHG emissions by between 100,000 and 200,000 metric tons annually and NOx and PM by between 0.027 tpd and 0.137 tpd and 0.013 tpd and 0.027 tpd, respectively.
51
Table II-25: Phillips 66 – San Francisco Energy Efficiency Options Reported as Completed/Ongoing, Scheduled, or Under Investigation
Totals for All Under Investigation 10 100-200k $100-200M - $10-20M 0.027 – 0.137 0.013 – 0.027
Totals for All Projects 39 210-450k $220-$440M $100-200k $20-50M 0.18-0.45 .026-0.08
Notes: 1. Some of the completed projects are part of a new unit installation where savings are calculated as avoided. 2. Some of the projects energy savings are calculated as a net California impact. 3. k = 1,000, M = 1,000,000
52
II.7 ExxonMobil – Torrance General Information ExxonMobil – Torrance is located in the SCAQMD. The refinery started production in 1929. It covers 750 acres and employs approximately 800. The refinery can process 150,000 barrels of crude oil daily, a large part of which comes from the San Joaquin Valley. The ExxonMobil – Torrance refinery primarily produces transportation fuel, gasoline and diesel fuel for Southern California, Arizona, and Nevada. Other products produced by the ExxonMobil – Torrance include jet fuel, LPG, petroleum coke, and sulfur. Emissions Table II-26 provides the 2009 GHG (C02e) emissions reported by ExxonMobil - Torrance in compliance with ARB’s GHG Mandatory Reporting Regulation. ExxonMobil-Torrance emits approximately 9 percent of the total GHG emissions from the Refinery Sector. Table II-26: ExxonMobil – Torrance 2009 Greenhouse Gas Emissions
Pollutant 2009 Annual Emissions (MMTCO2e) GHG 2.7
In addition, the facility reported the following emissions of criteria pollutants as shown in Table II-27. Table II-27: ExxonMobil – Torrance 2009 Criteria Pollutant Emissions
Table II-28 lists the top ten TACs ranked according to the combined mass TAC emissions and cancer potency factor, as described in Section 1.2.
53
Table II-28: ExxonMobil – Torrance 2009 Top Ten Prioritized Toxic Air Contaminant Emissions
Toxic Air Contaminant* 2009 Annual Emissions (pounds per year)
Polycyclic Aromatic Hydrocarbons (total) 418
Cadmium 49**
Benzene 5,054**
Nickel 243**
Arsenic 18**
Formaldehyde 3,958**
Beryllium 10**
1,3-Butadiene 127
Perchloroethylene 1,835
Lead 94 * Listed in rank order based on mass times cancer potency * These values are as reported by ExxonMobil. They are 10% to 30% lower than the values reported to SCAQMD. According to ExxonMobil the difference is due to previously over-stated emissions for combustion of a low Btu gas. ExxonMobil indicated that they would be submitting these revisions to SCAQMD within the next 60 days. Energy Efficiency Improvement Options Table II-29 provides information on the 30 potential energy efficiency improvement projects identified in ExxonMobil - Torrance’s EEA Report. The projects are grouped by timing (whether they are Completed/Ongoing, Scheduled, or Under Investigation), by Equipment Category (including boilers, electrical, thermal equipment, etc.) and by equipment sub-type (boiler for steam, combined cycle plants, electric motors, etc.). In compliance with the confidentiality requirement under CCR§95610, a detailed explanation of how the specific project improves energy efficiency is not provided in this table. However, expanded project descriptions can be referenced for various Equipment Categories and Equipment Sub-types in Tables I-9 through I-14 in Part I of this report. The ExxonMobil – Torrance refinery reported that it has implemented and identified 25 projects as Completed/Ongoing. These projects, completed in the 2008 to 2011 time frame, result in estimated GHG emissions reductions of 112,000 metric tons annually based on 2009 as the operating base year.6 In addition, these Completed/Ongoing projects have reduced NOx and PM by a total of approximately 0.207 tpd and 0.017 tpd, respectively, using 2009 as the baseline operating year. These Completed/Ongoing projects cost approximately $11 million in one-time costs, with an
6 Emissions reductions were estimated using 2009 as the baseline operating year. Estimates are based on best available data including site-specific information for operating year 2009 and/or publically available industry standards for sources evaluated. Estimates of emissions reduction for certain projects were based on energy efficiencies assumed from corresponding reduction of energy (i.e., natural gas and electricity) previously provided by offsite providers, which are not owned, operated, or affiliated with the ExxonMobil Torrance Refinery or any ExxonMobil parent, subsidiary, or affiliate.
54
additional $4.6 million in annual costs. ExxonMobil - Torrance has estimated that these projects will save approximately $16 million annually.7 The ExxonMobil - Torrance refinery also identified 5 projects as Scheduled. The Scheduled projects will further reduce GHG emissions by an estimated 20,000 metric tons annually and NOx and PM by 0.061 tpd and 0.006 tpd, respectively.1
Table II-29: ExxonMobil – Torrance Energy Efficiency Options Reported as Completed/Ongoing, Scheduled, or Under Investigation
Electric motors - air compressors/ electric motors - other/Electric motors - pumps and fans
3 2,030 3,740,000 100,000 1,028,000 0.009 0
Other Other 8 48,700 390,000 0 4,791,000 0.049 0.005
Thermal Equipment
Furnace/ Other
7 27,300 1,300,000 950,000 2,846,000 0.058 0.006
Scheduled
Electrical Only
Equipment/ Other/
Steam Only Equipment/
Thermal Equipment
Electric motors - air compressors/ Other/Steam motors - pumps
5 20,000 6,380,000 135,100 2,387,000 0.036 0.004
Totals for All Projects 30 131,530 17,493,000 4,685,000 18,356,000 0.241 0.023
7 Cost and savings estimates are based on best available data at the time of assessment submittal and 2010 Torrance Refinery pricing for natural gas and electricity.
55
II.8 Shell - Martinez
General Information Shell – Martinez is located in the BAAQMD. The refinery started production in 1915. It covers 1,000 acres and employs approximately 700 employees. The refinery can process 155,000 barrels of crude oil daily, primarily transportation fuel, gasoline and diesel fuel for northern California. Other products produced by the Shell - Martinez include jet fuel, residual fuel oils, LPG, sulfur, and petroleum coke. The Air Products - Martinez Shell Hydrogen Facility is operated by Air Products but this hydrogen facility’s permit to operate from the BAAQMD is held by the Shell - Martinez refinery. The following facility emissions and identified projects include input from the entire facility, including the hydrogen plant. Emissions Table II-30 provides the 2009 GHG emissions reported by Shell – Martinez and Air Products - Martinez Shell Hydrogen Facility in compliance with ARB’s GHG Mandatory Reporting Regulation. Shell – Martinez and Air Products - Martinez Shell Hydrogen Facility is the third largest GHG emitter of the 12 refineries subject to the EEA Regulation and contributes about 14 percent of the total GHG emissions in this sector.
Table II-30: Shell - Martinez and Air Products - Martinez Shell Hydrogen Facility 2009 Greenhouse Gas Emissions
Pollutant 2009 Annual Emissions (MMTCO2e)GHG 4.3
In addition, the Shell - Martinez and Air Products - Martinez Shell Hydrogen Facility reported, in the energy efficiency assessment report, the following emissions of criteria pollutants as shown in Table II-31.
Table II-31: Shell - Martinez and Air Products - Martinez Shell Hydrogen Facility 2009 Criteria Pollutant Emissions
Criteria Pollutant 2009 Annual Emissions (tpy)Total Organic Gases (TOG) 1,390 Carbon monoxide (CO) 1,310 Oxides of Nitrogen (NOx) 1,080 Oxides of Sulfur (SOx) 1,220 Particulate Matter (PM) 350 Note: The criteria pollutant emissions were compiled, calculated, or estimated by BAAQMD and these numbers may not agree with the facility estimates.
Table II-32 lists the top TACs ranked according to the combined mass emissions and cancer potency factor, as described in Section 1.2.
56
Table II-32: Shell - Martinez and Air Products - Martinez Shell Hydrogen Facility 2009 Top Ten Prioritized Toxic Air Contaminant Emissions
Toxic Air Contaminant* 2009 Annual Emissions (pound per year)
Cadmium <1 * Listed in rank order based on mass times cancer potency
Energy Efficiency Improvement Options Table II-33 provides information on the 44 potential energy efficiency improvement projects identified in the Shell - Martinez and the Air Products - Martinez Shell Hydrogen Facility EEA Reports. The Shell - Martinez refinery and the Air Products - Martinez Shell Hydrogen Facility projects are grouped by timing (whether they are Completed/Ongoing, Scheduled, or Under Investigation), by Equipment Category (including boilers, electrical, thermal equipment, etc.) and by equipment sub-type (boiler for steam, combined cycle plants, electric motors, etc.). In compliance with the confidentiality requirement under CCR§95610, a detailed explanation of how the specific project improves energy efficiency is not provided in this table. However, expanded project descriptions can be referenced for various Equipment Categories and Equipment Sub-types in Tables I-9 through I-14 in Part I of this report. The Shell Martinez refinery and Air Products - Martinez Shell Hydrogen Facility reported that they have implemented and identified 33 projects as Completed/Ongoing. These projects, completed in the 2004 to 2011 time frame, have reduced GHG emissions an estimated 170,000 metric tons annually. In addition, these Completed/Ongoing projects have reduced NOx by a total of approximately 0.15 tpd. Only very small (approximately <0.01 tpd) PM reductions were identified with these projects. These Completed/Ongoing projects cost approximately $37 million in one-time costs, with an additional $62,000 in annual costs. The Shell - Martinez refinery and Air Products - Martinez Shell Hydrogen Facility have estimated that these projects will save approximately $15 million annually. The Shell - Martinez refinery and Air Products - Martinez Shell Hydrogen Facility also identified 3 projects as Scheduled and 8 projects as Under Investigation. The Scheduled projects will further reduce GHG emissions by an estimated 18,000 metric tons annually, NOx by an estimated 0.003 tpd, and PM by an estimated 0.001 tpd. The projects Under Investigation could potentially reduce GHG emissions by another
57
estimated 26,000 metric tons annually, NOx by an estimated 0.02 tpd, and PM by an estimated 0.001 tpd.
Table II-33: Shell - Martinez Energy and Air Products - Martinez Shell Hydrogen Facility Efficiency Options Reported as Completed/Ongoing, Scheduled, or Under
Investigation
Timing Equipment Category
Equipment Sub-type
Number of
Projects
Estimated GHG
Reduction (Metric tons
per year)
One Time Cost ($)
Annual Cost ($)
Annual Savings ($)
Potential NOx
Reduction (tons/day)
Potential PM
Reduction (tons/day)
Completed/ Ongoing
Boilers/ Steam Only Equipment
Boiler for steam/Other
10 28,020 2,750,000 5,000 2,092,000 0.02 0.0014
Electrical Only
Equipment
Electric motors - compressors/Electric motors -
other/Other
3 55 2,473,000 1,000 328,000 0 0
Other Other 8 50,860 5,133,000 4,000 4,003,000 0.04 0.0027
Thermal Equipment
Furnace/ Other 12 93,400 26,599,000 52,000 8,925,000 0.09 0.0046
Scheduled Thermal
Equipment/Other
Furnace/ Other 3 17,940 8,620,000 16,000 1,750,000 0.003 0.0009
Under Investigation
Boilers/Electrical Only
Equipment/Thermal
Equipment
Boilers for steam/ Electric
motors - compressors/Fu
rnace/ Other
8 26,100 11,020,000 90,000 2,572,000 0.02 0.0013
Totals for All Projects 44 216,375 56,595,000 168,000 19,670,000 0.18 0.0109
Note: Numbers may not add due to rounding
58
II.9 Tesoro – Los Angeles
General Information Tesoro – Los Angeles is located in the SCAQMD. It covers 300 acres and employs approximately 500 employees. The refinery can process 95,000 barrels of crude oil daily, a large part of which comes from the San Joaquin Valley and the Los Angeles Basin. The Tesoro – Los Angeles refinery primarily produces transportation fuel, gasoline and diesel fuel for Southern California. Other products produced by the Tesoro – Los Angeles refinery include heavy fuel oils, LPG, and petroleum coke. Emissions Table II-34 provides the 2009 GHG emissions reported by Tesoro – Los Angeles in compliance with ARB’s GHG Mandatory Reporting Regulation. Tesoro – Los Angeles emits 5 percent of the total GHG emissions from the Refinery Sector.
Table II-34: Tesoro – Los Angeles 2009 Greenhouse Gas Emissions Pollutant 2009 Annual Emissions (MMTCO2e)
GHG 1.5
In addition, the facility reported the following emissions of criteria pollutants:
Table II-35: Tesoro – Los Angeles 2009 Criteria Pollutant Emissions Criteria Pollutant 2009 Annual Emissions (tpy)
* SCAQMD reported value of 650 tpy Table II-36 lists the top ten TACs ranked according to the combined mass emissions and cancer potency factor, as described in Section 1.2.
59
Table II-36: Tesoro – Los Angeles 2009 Top Ten Prioritized Toxic Air Contaminant Emissions
* Listed in rank order based on mass times cancer potency Energy Efficiency Improvement Options Table II-37 provides information on the 17 potential energy efficiency improvement projects identified in Tesoro – Los Angeles’s EEA Report. The projects are grouped by timing (whether they are Completed/Ongoing, Scheduled, or Under Investigation), by Equipment Category (including boilers, electrical, thermal equipment, etc.) and by Equipment Sub-type (boiler for steam, combined cycle plants, electric motors, etc.). In compliance with the confidentiality requirement under CCR§95610, a detailed explanation of how the specific project improves energy efficiency is not provided in this table. However, expanded project descriptions can be referenced for various Equipment Categories and sub-types in Tables I-9 through I-14 in Part I of this report. The Tesoro – Los Angeles refinery reported that it has implemented and identified 11 projects as Completed/Ongoing. These projects, completed in the 2009 to 2011 time frame, have reduced GHG emissions an estimated 62,000 metric tons annually. In addition, these Completed/Ongoing projects have reduced NOx and PM by a total of approximately 0.221 tpd and 0.01 tpd, respectively. These Completed/Ongoing projects cost approximately $6 million in one-time costs, with an additional $1 million in annual costs. Tesoro – Los Angeles has estimated that these projects will save approximately $6 million annually. The Tesoro – Los Angeles refinery also identified 6 projects as under investigation. The projects under investigation could potentially reduce GHG emissions by another 23,000 metric tons annually and NOx and PM by 0.049 tpd and 0.006 tpd respectively.
60
Table II-37: Tesoro – Los Angeles Energy Efficiency Options Reported as
Completed/Ongoing, Scheduled, or Under Investigation
Totals for All Projects 17 85,000 16,114,000 1,074,000 8,566,000 0.271 0.017
61
II.10 Tesoro – Martinez General Information Tesoro – Martinez is located in the BAAQMD. It covers 2,200 acres and employs approximately 700 employees. The refinery can process 165,000 barrels of crude oil daily, a large part of which comes from the Alaskan North Slope, California, and foreign sources. The Tesoro – Martinez refinery primarily produces transportation fuel, gasoline and diesel fuel, for northern California. Other products produced by the Tesoro – Martinez refinery include fuel oil, LPG, petroleum coke, sulfur, and ammonia. Emissions Table II-38 provides the 2009 GHG (C02e) emissions reported by Tesoro - Martinez in compliance with ARB’s GHG Mandatory Reporting Regulation. Tesoro – Martinez emits 7 percent of the total GHG emissions from the Refinery Sector.
Reactive Organic Gases (ROG) 650 Carbon monoxide (CO) 370 Oxides of Nitrogen (NOx) 1,000 Oxides of Sulfur (SOx) 590 Particulate Matter (PM) 90 Table II-40 lists the top ten TACs, as estimated by BAAQMD, ranked according to the combined mass TAC emissions and cancer potency factor, as described in Section 1.2. The BAAQMD administers the AB2588 program because they received delegation from the ARB.
62
Table II-40: Tesoro – Martinez 2009 Top Ten Prioritized Toxic Air Contaminant Emissions
Toxic Air Contaminant* 2009 Annual Emissions (pounds per year) Polycyclic Aromatic Hydrocarbons (total) 130
Perchloroethylene <1 * Listed in rank order based on mass times cancer potency Energy Efficiency Improvement Options- Table II-41 provides information on the 30 potential energy efficiency improvement projects identified in Tesoro – Martinez’s EEA Report. The projects are grouped by timing (whether they are Completed/Ongoing, Scheduled, or Under Investigation), by Equipment Category (including boilers, electrical, thermal equipment, etc.) and by Equipment Sub-type (boiler for steam, combined cycle plants, electric motors, etc.). In compliance with the confidentiality requirement under CCR§95610, a detailed explanation of how the specific project improves energy efficiency is not provided in this table. However, expanded project descriptions can be referenced for various Equipment Category’s and Equipment Sub-types in Tables I-9 through I-14 in Part I of this report. The Tesoro – Martinez refinery reported that it has implemented and identified 15 projects as Completed/Ongoing. These projects, completed in the 2008 to 2011 time frame, have reduced GHG emissions an estimated 595,000 metric tons annually. In addition, these Completed/Ongoing projects have reduced NOx and PM by a total of approximately 0.768 tpd and 0.235 tpd, respectively. These Completed/Ongoing projects cost approximately $621 million in one-time costs, with an additional $685,000 in annual costs. Tesoro – Martinez has estimated that these projects will save approximately $13 million annually. The Tesoro – Martinez refinery also identified 5 projects as Scheduled and 10 projects as Under Investigation. The Scheduled projects will further reduce GHG emissions by an estimated 27,000 metric tons annually and NOx and PM by 0.009 tpd and 0.006 tpd respectively. The projects Under Investigation could potentially reduce GHG emission by another 72,000 metric tons annually and NOx and PM by 0.054 tpd and 0.012 tpd respectively.
63
Table II-41: Tesoro – Martinez Energy Efficiency Options Reported as Completed/Ongoing, Scheduled, or Under Investigation
The Tesoro – Martinez refinery also identified nine projects as not being implemented due to cost effectiveness. These projects are listed in Table II-42. The Equipment Category, Equipment sub-type, number of projects, and a brief description of the reason the projects were not being implemented are listed in Table II-42.
Table II-42: Tesoro – Martinez Energy Efficiency Option Reported as Not Implementing
Timing Equipment Category
Equipment Sub-type Number of Projects Reason Why Project Not Being Implemented
Not Being Implemented
Steam Only Equipment/Other
Steam motors - other/Other
3 Not cost effective
Thermal Equipment
Furnace/Other 6 Not cost effective
Timing Equipment Category
Equipment Sub-type
Number of
Projects
Estimated GHG
Reduction (Metric
tons per year)
One Time Cost ($)
Annual Cost ($)
Annual Savings ($)
Potential NOx
Reduction (tons/day)
Potential PM
Reduction (tons/day)
Completed/ Ongoing
Boilers/ Steam Only
Equipment
Boiler for steam/Steam motors – other
5 83,000 9,331,000 414,000 7,931,000 0.027 0.016
Electrical Only
Equipment
Electric motors - air compressors/Electric motors - pumps and fans/Other
5 2,600 7,620,000 126,000 1,023,000 0.0006 0.0001
Thermal Equipment/
Other Other 5 509,000 604,380,000 425,000 5,219,000 0.74 0.219
Scheduled
Boilers/ Steam Only
Equipment/ Thermal
Equipment
Boiler for steam/Steam motors - air compressor/ Other
Totals for All Projects 30 693,600 727,176,000 2,916,000 28,050,000 0.831 0.25
64
II.11 Valero Ultramar – Wilmington
General Information Valero Ultramar – Wilmington is located in the SCAQMD. The refinery was commissioned in 1969. It covers 120 acres and employs approximately 440 employees. The refinery can process 80,000 barrels of crude oil daily, a large part of which comes from the California and foreign sources. The Valero Ultramar – Wilmington refinery primarily produces transportation fuel, gasoline and diesel fuel, for Southern California, Arizona, and Nevada. Other products produced by the Valero Ultramar – Wilmington refinery include jet fuel, propane, sulfur, and petroleum coke. Emissions Table II-43 provides the 2009 GHG emissions reported by Valero Ultramar - Wilmington in compliance with ARB’s GHG Mandatory Reporting Regulation. Valero Ultramar - Wilmington emits 3 percent of the total GHG emissions from the Refinery Sector.
Oxides of Nitrogen (NOx) 240 Oxides of Sulfur (SOx) 230 Particulate Matter (PM) 70
Table II-45 lists the top ten TACs ranked according to the combined mass TAC emissions and cancer potency factor, as described in Section 1.2.
65
Table II-45: Valero Ultramar – Wilmington 2010 Top Ten Prioritized Toxic Air Contaminant Emissions
Toxic Air Contaminant* 2010 Annual Emissions (pounds per year)Polycyclic Aromatic Hydrocarbons (total) 227
Benzene 881
Arsenic 5
Polychlorinated Dibenzofurans <1
Formaldehyde 2,276
1,3-Butadiene 70
Nickel 42
Cadmium 1
Beryllium <1
Perchloroethylene 32 * Listed in rank order based on mass times cancer potency
Energy Efficiency Improvement Options - Table II-46 provides information on the 13 potential energy efficiency improvement projects identified in Valero Ultramar – Wilmington’s EEA Report. The projects are grouped by timing (whether they are Completed/Ongoing, Scheduled, or Under Investigation), by Equipment Category (including boilers, electrical, thermal equipment, etc.) and by Equipment Sub-type (boiler for steam, combined cycle plants, electric motors, etc.). In compliance with the confidentiality requirement under CCR§95610, a detailed explanation of how the specific project improves energy efficiency is not provided in this table. However, expanded project descriptions can be referenced for various Equipment categories and Equipment Sub-types in Tables I-9 through I-14 in Part I of this report. The Valero Ultramar – Wilmington refinery reported that it has implemented and identified 13 projects as Completed/Ongoing or Scheduled. These projects, completed in the 2007 to 2010 time frame, or currently scheduled, have or will reduce GHG emissions an estimated 55,000 metric tons annually. In addition, these Completed/Ongoing/Scheduled projects have or will reduce NOx and PM by a total of approximately 0.056 tpd and 0.008 tpd, respectively. These Completed/Ongoing/Scheduled projects incurred one-time costs of approximately $16.6 million and annual costs of approximately $644,000. Valero Ultramar – Wilmington has estimated that these projects will produce an annual cost savings of approximately $4.2 million. The Valero Ultramar – Wilmington Refinery has also reported that it has projects listed as Under Investigation. These data could not be aggregated in such a way as to protect the confidentiality of the data. However, these projects were included in the full list of possible projects in Tables I-9 through I-14 in Part I of this report.
66
Table II-46: Valero Ultramar – Wilmington Energy Efficiency Options Reported as Completed/Ongoing, Scheduled, or Under Investigation
CBI - Confidential Business Information pursuant to CCR§95610
67
II.12 Valero – Benicia Refinery
General Information Valero – Benicia is located in the BAAQMD. The refinery was commissioned in 1968. It covers 800 acres and employs approximately 480 employees. The refinery can process 145,000 barrels of crude oil daily, a large part of which comes from the Alaskan North Slope, the San Joaquin Valley, and foreign sources. The Valero – Benicia refinery primarily produces transportation fuel, gasoline and diesel fuel, for northern California. Other products produced by the Valero – Benicia refinery include jet fuel, residual oil, fuel oil, asphalt, and petroleum coke. Emissions Table II-47 provides the 2009 GHG emissions reported by Valero - Benicia in compliance with ARB’s GHG Mandatory Reporting Regulation. Valero - Benicia emits 3 percent of the total GHG emissions from the Refinery Sector.
In addition, the facility reported the following emissions of criteria pollutants as shown in Table II-48. Table II-48: Valero – Benicia 2010 Criteria Pollutant Emissions
Criteria Pollutant 2010 Annual Emissions (tpy)Volatile Organic Compounds (VOC) 410 Carbon monoxide (CO) 1,010 Oxides of Nitrogen (NOx) 1,400 Oxides of Sulfur (SOx) 2,650 Particulate Matter (PM) 210 Note: Values are based on a study conducted as a response to an Information Collection Request (ICR) issued by the EPA in March 2011 under the provisions of Section 114 of the Clean Air Act (CAA). These values differ from the BAAQMD’s most recent emission estimates.
Table II-49 lists the top ten TACs ranked according to the combined mass TAC emissions and cancer potency factor, as described in Section 1.2.
68
Table II-49: Valero – Benicia 2009 Top Ten Prioritized Toxic Air Contaminant Emissions
Toxic Air Contaminant* 2009 Annual Emissions (pounds per year) Nickel 438
Cadmium 23
Polycyclic Aromatic Hydrocarbons (total) 30
Formaldehyde 4,250
Benzene 307
Acetaldehyde 280
Arsenic <1
Perchloroethylene 36
Lead <1 * Listed in rank order based on mass times cancer potency
Energy Efficiency Improvement Options Table II-50 provides information on the approximately 50 potential energy efficiency improvement projects identified in Valero – Benicia’s EEA Report. The projects are grouped by timing (whether they are Completed/Ongoing, Scheduled, or Under Investigation), by Equipment Category (including boilers, electrical, thermal equipment, etc.) and by equipment sub-type (boiler for steam, combined cycle plants, electric motors, etc.). In compliance with the confidentiality requirement under CCR§95610, detailed explanation of how the specific project improves energy efficiency is not provided in this table. However, expanded project descriptions can be referenced for various Equipment Categories and Equipment Sub-types in Tables I-9 through I-14 in Part I of this report. The Valero – Benicia refinery reported that it has implemented and identified 43 projects as Completed/Ongoing or Scheduled. These projects, completed in the 2002 to 2011 time frame, or currently scheduled, have reduced GHG emissions an estimated 202,000 metric tons annually. In addition, these Completed/Ongoing/Scheduled projects have reduced NOx and PM by a total of approximately 0.177 tpd and 0.029 tpd, respectively. These Completed/Ongoing/Scheduled projects cost approximately $32 million in one-time costs, with an additional $182,000 in annual costs. Valero – Benicia has estimated that these projects will save approximately $16 million annually. The Valero – Benicia Refinery has also reported that it has 7 projects identified as Under Investigation. These projects could potentially reduce GHG emissions by another 10,000 metric tons annually. However it was flagged that these projects would result in a net increase in NOx and PM by 0.013 tpd and 0.001 tpd, respectively.
69
Table II-50: Valero – Benicia Energy Efficiency Options Reported as Completed/Ongoing, Scheduled, or Under Investigation
Timing Equipment Category
Equipment Sub-type
Number of
Projects
Estimated GHG
Reduction (Metric tons
per year)
One Time Cost ($)
Annual Cost ($)
Annual Savings ($)
Potential NOx
Reduction (tons/day)
Potential PM
Reduction (tons/day)
Completed/ Ongoing/Sch
eduled
Boilers/ Steam Only Equipment
Boiler for steam/Steam motors - air compressors
10 14,395 4,642,121 37,000 1,680,102 0.014 0.003
Electrical Only
Equipment
Electric motors - other/Electric motors - pumps and fans