12
Defining Success How a rock solid investment process is defined and measured. 2016 Edition Manitou Investment Management Ltd.
Defining Success How a rock solid investment process is defined and measured. 2016 Edition
Manitou Investment Management Ltd.

Manitou Investment Management Ltd.
1
Contents Introduction ....................................................................................................... 2
Process – The Roadmap to Success ............................................................... 3
Defining the Desired Outcome ...................................................................... 3
Constructing a Portfolio to Achieve the Outcome .......................................... 3
Evidence of a solid stock selection process ..................................................... 4
Capitalization and Style .................................................................................... 5
Active Share .................................................................................................. 5
Evidence of a Solid Portfolio Construction Process ......................................... 6
Key Metrics Confirming Adherence to Manitou’s Process ............................ 6
‘Soft’ Factors That Can Impact a Manager’s Results ....................................... 7
Conclusion ........................................................................................................ 8
Appendix A ....................................................................................................... 9
Appendix B ....................................................................................................... 9
Appendix C ..................................................................................................... 10

Manitou Investment Management Ltd.
2
Introduction During the London Olympics, as medal winners were interviewed they were often asked why they thought they won. A common response was “I wasn’t thinking about winning, I was focused on the process”. Whether for Olympians or for investment managers, achieving success requires a focus on the process (the how and why). The outcome will take care of itself. In the investment industry, there are times when events or circumstances operate for or against the manager. At these times the outperforming manager may not deserve the resulting criticism. Having ‘good luck’ or ‘bad luck’ can influence an outcome, but luck cannot be controlled. What can be controlled is the process. A solid process substitutes skill for ‘good luck’ and includes controls to manage ‘risk’ and minimize the effect of bad luck. The overall intent is to increase the probability of success.
Good Outcome
Bad Outcome
Good Process
Earned Success Bad Break
Bad Process
Dumb Luck Poetic Justice
(based on “Getting It Right the First Time” written by J. Edward Russo and Paul J.H. Schoemaker)
Ultimately, outcomes matter. Notwithstanding our industry disclaimer “past performance is no guarantee of future performance”, there are clues that support the repeatability of a track record. These are: 1) a consistently applied investment approach and process, 2) a track record of sufficient length that demonstrates the firm’s performance over a variety of market conditions, and 3) stability of team, experience, depth and acumen. The purpose of this paper is not to delve into the specifics of how Manitou analyzes or selects companies. Instead, the intent is to: a) define what success means at Manitou and b) provide several tangible measures that demonstrate adherence to our stated process and appropriate periods of time.

Manitou Investment Management Ltd.
3
Process – The Roadmap to Success We believe that process is the backbone of a successful long-term active investment management strategy. We are presenting what is, in effect, a ‘quality assurance system’; one that can be used to monitor Manitou’s success. Manitou’s process incorporates a blend of creativity, wisdom and discipline. We believe these qualities will lead to success in dynamic and sometimes irrational markets. The existence of the characteristics detailed in the table on page 4 serve as indicators that our process is in place and working to substitute skill for luck, increasing the probability of our ongoing success. Before discussing the indicators, it is necessary to first define success.
Defining the Desired Outcome There must be quantifiable definition(s) of success. It is our view that both absolute and relative ‘bogeys’ are appropriate. The following are the stated performance objectives for each of Manitou’s equity mandates:
1. An absolute return of CPI+7%, over a rolling three year period. 2. Exceed the return of the relevant benchmark, net of fees, over a rolling three year period. 3. Perform in the first quartile of both a selected and broader universe of peers.
It is of course important to focus on an appropriate time horizon as there are serious consequences to myopically focusing on recent performance in the selection and subsequent appraisal of asset managers. We view a rolling three year average as optimal, as it balances both short and longer term perspectives.
Constructing a Portfolio to Achieve the Outcome How a portfolio manager adds value and manages risk is largely specific to the manager. It is important to understand the types of companies a manager holds and how these are selected. A manager should be able to convey a clear understanding of what they do, how they do it and prove that they are in fact doing what they say they do. A manager should be able to state the characteristics of the companies she buys and the overall characteristics of the portfolio that will result from the application of her particular processes and approach. Why? In volatile financial markets, holdings with certain characteristics have historically behaved in broadly predictable ways. A skillful manager will remain focused on the process, mindful of the appropriate time horizon against which she is being measured and confident that the application of her investment discipline will result in the desired outcome.
Manitou Investment Management Ltd.
4
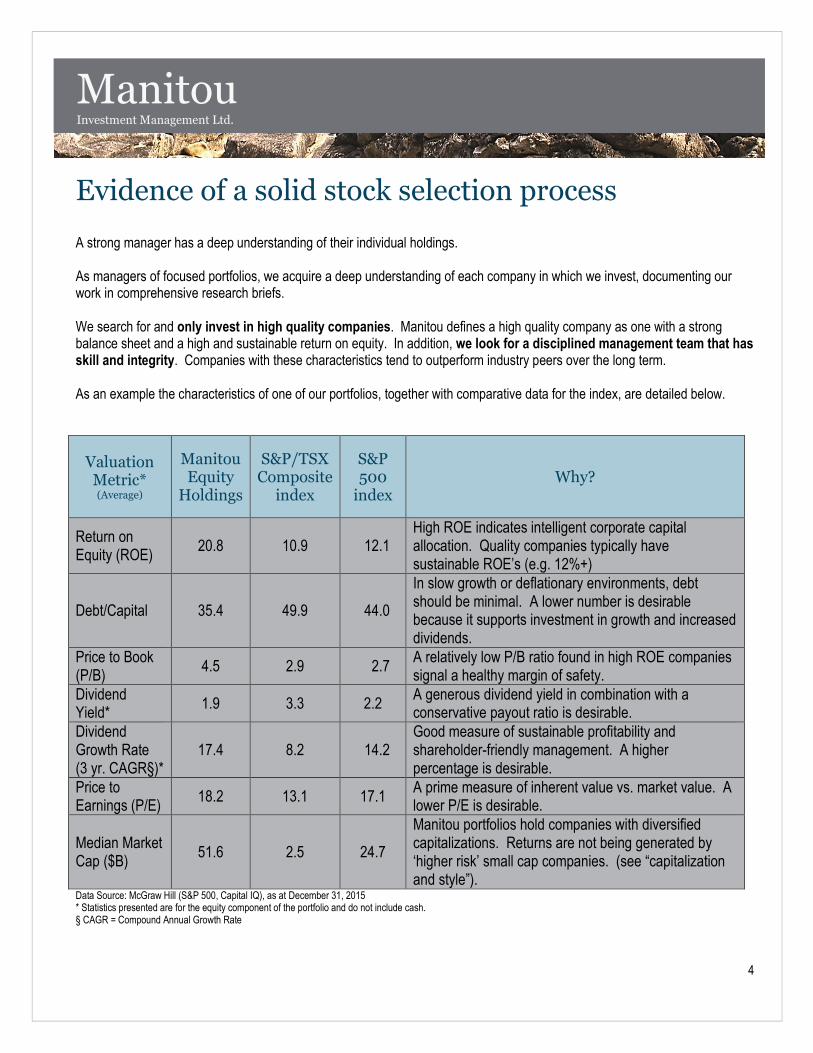
Evidence of a solid stock selection process A strong manager has a deep understanding of their individual holdings. As managers of focused portfolios, we acquire a deep understanding of each company in which we invest, documenting our work in comprehensive research briefs. We search for and only invest in high quality companies. Manitou defines a high quality company as one with a strong balance sheet and a high and sustainable return on equity. In addition, we look for a disciplined management team that has skill and integrity. Companies with these characteristics tend to outperform industry peers over the long term. As an example the characteristics of one of our portfolios, together with comparative data for the index, are detailed below.
Valuation Metric* (Average)
Manitou Equity
Holdings
S&P/TSX Composite
index
S&P 500
index Why?
Return on Equity (ROE)
20.8 10.9 12.1 High ROE indicates intelligent corporate capital allocation. Quality companies typically have sustainable ROE’s (e.g. 12%+)
Debt/Capital 35.4 49.9 44.0
In slow growth or deflationary environments, debt should be minimal. A lower number is desirable because it supports investment in growth and increased dividends.
Price to Book (P/B)
4.5 2.9 2.7 A relatively low P/B ratio found in high ROE companies signal a healthy margin of safety.
Dividend Yield*
1.9 3.3 2.2 A generous dividend yield in combination with a conservative payout ratio is desirable.
Dividend Growth Rate (3 yr. CAGR§)*
17.4 8.2 14.2 Good measure of sustainable profitability and shareholder-friendly management. A higher percentage is desirable.
Price to Earnings (P/E)
18.2 13.1 17.1 A prime measure of inherent value vs. market value. A lower P/E is desirable.
Median Market Cap ($B)
51.6 2.5 24.7
Manitou portfolios hold companies with diversified capitalizations. Returns are not being generated by ‘higher risk’ small cap companies. (see “capitalization and style”).
Data Source: McGraw Hill (S&P 500, Capital IQ), as at December 31, 2015 * Statistics presented are for the equity component of the portfolio and do not include cash. § CAGR = Compound Annual Growth Rate

Manitou Investment Management Ltd.
5
Capitalization and Style There are variances by mandate, but Manitou expects the capitalization and style profile of its equity mandates to generally reside within the shaded area below. This reflects a preference for investing in well-established ‘quality’ companies of various sizes trading below their intrinsic values. Although markets move up and down with occasional irrational willfulness, it is the companies with the characteristics mentioned in this document that can most reliably ride out volatility and generate strong performance over the long term.
See Appendix A for the actual capitalization and style characteristics of Manitou’s portfolio since 2011.
Active Share
See Appendix A for the actual capitalization and style characteristics of Manitou’s portfolio since 2011. Active Share is a measure of the proportion of stock holdings in a portfolio’s composition that is different than the composition found in the index benchmark. The higher the active share, the higher the difference between that portfolio and the benchmark index. The metric was introduced by Yale researchers Cremers and Petajisto1 in 2009 and has quickly been adopted as a way to ensure investors are getting the active management they pay for. Cremers and Petajisto concluded there is a positive correlation between a manager’s active share value and their performance against its benchmark. Active Share is also useful in identifying “closest indexers”, or managers who claim to be active but whose portfolios are very similar to the benchmark portfolio. Identifying closet indexers is extremely important because active management fees can be a significant hurdle to outperforming the index for anyone holding a portfolio similar to its benchmark. For investors seeking active management, an active share of 80% and over is considered a strong measure. See Appendix B for the active share measures of Manitou’s portfolios for 2011. 1 K.J. Martijn Cremers and Anti Petajisto, “How Active Is Your Fund Manager? A new Measure That Predicts Performance”,
Working Paper, Yale School of Management, March 31, 2009.
Large
Medium
Small
Value Blend Growth

Manitou Investment Management Ltd.
6
Evidence of a Solid Portfolio Construction Process Be it the funding of a schedule of charitable payments, a retirement lifestyle or any absolute return objective, Manitou builds portfolios that align with clients’ risk tolerance and ultimate objectives. The implementation of our process may result in a portfolio that deviates significantly from the index, particularly if specific areas of the market become overvalued. This is an anticipated part of our cycle of performance. Over a market cycle we expect our focus on high quality companies will lead to outperformance of our benchmarks. Although individual stocks held are subject to their own unique cycles, through diversification we expect aggregate portfolio metrics to be consistent with our approach. A measure out of sync will trigger an evaluation and, if necessary, a correction of the underlying causes. The table below sets out four key metrics we review regularly to confirm our process is working:
Key Metrics Confirming Adherence to Manitou’s Process
Metric Why is it important?
UP/DOWN Capture Ratio
The Up/Down Capture Ratio measures how the portfolio performs during periods where the benchmark is up or down. A manager who resides in the top left quadrant not only has captured less of the down-market and more of the up-market, but is also delivering a smoother ride through the market. Manitou expects its portfolio to reside in this quadrant when measured on 3-year rolling periods.
Up/Down Capture Ratio
Up
Cap
ture
High Up Market Capture/Low Down Market Capture
High Up Market Capture/High Down Market Capture
Low Up Market Capture/Low Down Market Capture
Low Up Market Capture/High Down Market Capture
Down Capture
See Appendix C for actual upside and downside capture statistics by mandate.
R-Squared R-Squared (or R²) measures the amount of price movement of the portfolio that is explained by movement in the benchmark (which can be an index, or blend of indices). R² can range from 0 to 1 with R² of 1 indicating that 100% of the movement in a portfolio is explained by the market movement. Given Manitou’s concentrated approach, an R² of 70% or less is expected.
Alpha Alpha measures the excess return relative to a benchmark (which can be an index, or blend of indices). A high positive Alpha is desired, indication outperformance relative to the benchmark.
Information Ratio
The Information Ratio is a measure of the portfolio’s risk-adjusted return. An Information Ratio greater than 1 indicated a return higher than the benchmark with similar or lower risk.
* Source: Fundata Canada Inc.
Manitou Investment Management Ltd.
7
‘Soft’ Factors That Can Impact a Manager’s Results In addition to having a repeatable and disciplined investment process, there are “soft” factors that can enhance or detract from the sustainability of returns experienced by our clients. Size of assets under management is worth considering. This is especially relevant when investing in Canada, where the universe of investible companies has shrunk due to mergers and industry consolidation. Is a manager able to take an optimal weight in a stock in which it holds a strong conviction? Or will a manager need to ‘over-diversify’ and dilute their ideas, for reasons of liquidity, with stocks of lesser potential? Related to this, the rate of growth of the asset base can materially influence future performance and the ability of a manager to stay true to their firm’s stated investment approach. Rapid growth and the addition of multiple mandates, while a positive consequence of success, should be considered with caution as well. A firm’s ownership structure plays another key role in sustaining a consistent client experience. In most instances, a large equity interest held by the key operators of the business is a positive, promoting stability of the team and a focus on long term performance. In comparison, being a division within a larger financial institution often leads to asset growth gaining priority over generating sustainable long term returns. In addition, a compensation plan that is tied to results over an appropriate time horizon is preferable as it reflects alignment with client interests. Specialization is another ‘soft’ factor. Most asset management firms can be good at a narrow range of mandates, underscoring the importance of allocation of intellectual assets. Firms that specialize tend to focus their human resources in their areas of strength. We believe that the ideal balance of these soft factors, is a firm with a solid professional research/portfolio management group and the capacity to add assets in a measured fashion that will not force a change in investment approach. Manitou’s ‘all cap’ investment approach and research depth are scalable, enabling it to add to a position or initiate a new one in a meaningful weight – without concern for liquidity. Manitou’s approach to growing its team has been one of acquiring experienced talent at the top of their game. Research and portfolio management personnel work collegially together, aligned with a common process and purpose. Employee ownership is encouraged and widely distributed across the firm. Compensation has been carefully structured to respect both individual and team contributions, with the investment success of the client being the ultimate objective. Overall, Manitou’s status as an independent manager allows for sustainable new business growth that does not challenge systems, quality of client service, equity selection, portfolio construction or any of the inputs into its solid investment process.

Manitou Investment Management Ltd.
8
Conclusion As stated in the Introduction, the objective of this paper was to define success at Manitou and discuss the role that process plays in obtaining it. In doing so, we sketched a portrait of the characteristics and qualities one can expect from a portfolio managed by Manitou. Our process is continuous. Manitou performs regular reviews to ensure we are on track to achieving the goals of our clients. This provides us with useful data to also measure our performance relative to our portfolio benchmarks and our peer groups. The Olympic champion and competent investment manager know that winning is the result of putting all the pieces in place. Favourable outcomes are difficult at the best of times and are especially difficult in the current environment. At Manitou we feel it is more important than ever to have a rock solid investment approach, the resources to conduct independent research and the discipline to focus on a process – elements that are within our control. By rigorously implementing, continuously monitoring and remaining true to these factors we increase the probability of achieving our definition success.
Manitou Investment Management Ltd.
9
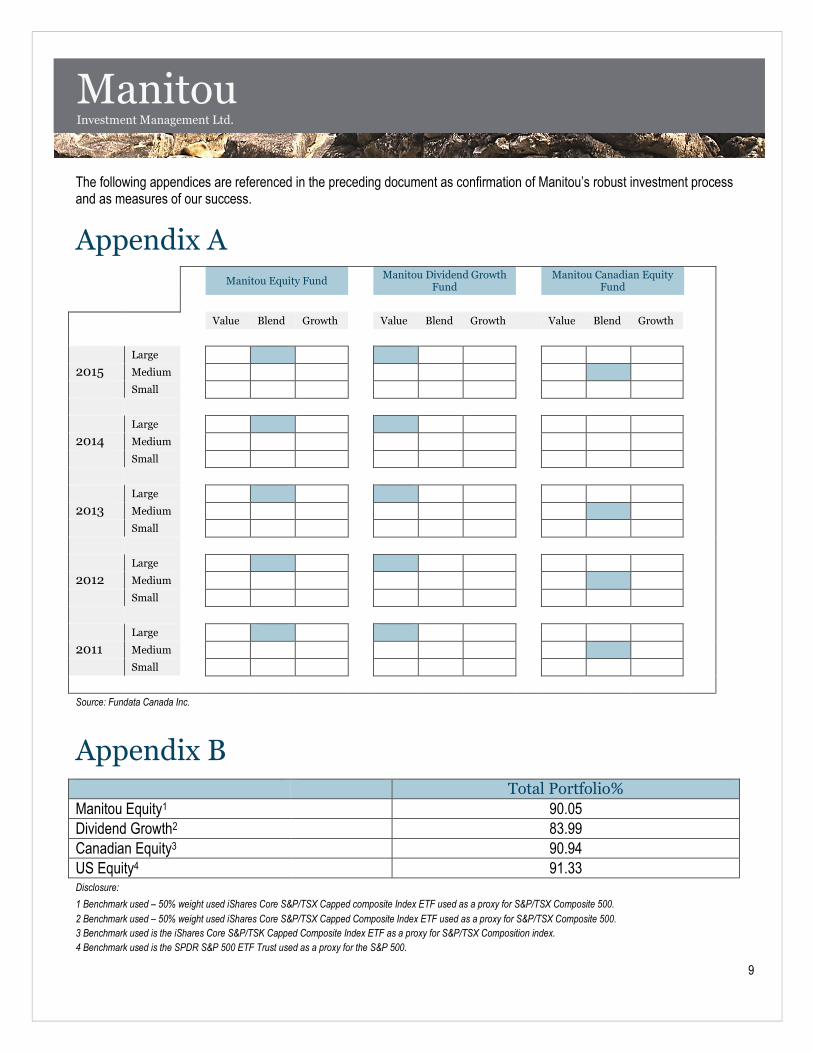
The following appendices are referenced in the preceding document as confirmation of Manitou’s robust investment process and as measures of our success.
Appendix A
Appendix B
Total Portfolio%
Manitou Equity1 90.05
Dividend Growth2 83.99
Canadian Equity3 90.94
US Equity4 91.33 Disclosure: 1 Benchmark used – 50% weight used iShares Core S&P/TSX Capped composite Index ETF used as a proxy for S&P/TSX Composite 500.
2 Benchmark used – 50% weight used iShares Core S&P/TSX Capped Composite Index ETF used as a proxy for S&P/TSX Composite 500.
3 Benchmark used is the iShares Core S&P/TSK Capped Composite Index ETF as a proxy for S&P/TSX Composition index.
4 Benchmark used is the SPDR S&P 500 ETF Trust used as a proxy for the S&P 500.
Manitou Equity Fund
Manitou Dividend Growth Fund
Manitou Canadian Equity Fund
Value Blend Growth Value Blend Growth Value Blend Growth
Large
2015 Medium
Small
Large
2014 Medium
Small
Large
2013 Medium
Small
Large
2012 Medium
Small
Large
2011 Medium
Small
Source: Fundata Canada Inc.
Manitou Investment Management Ltd.
10
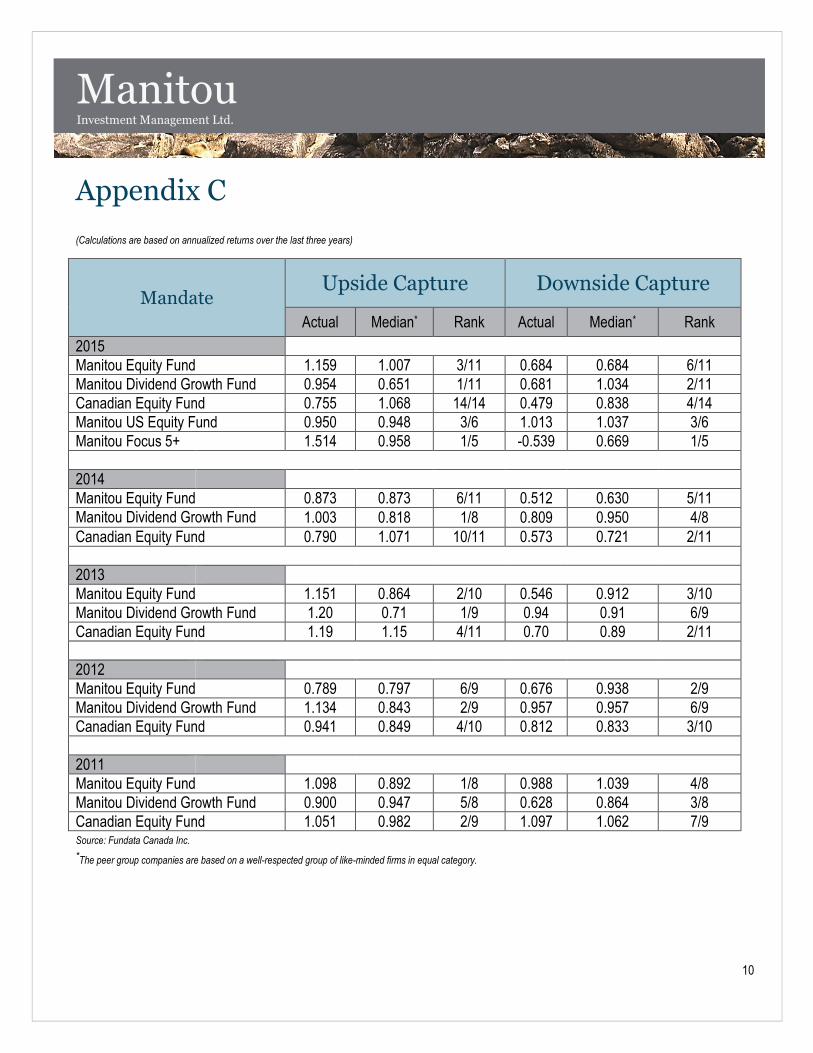
Appendix C (Calculations are based on annualized returns over the last three years)
Mandate Upside Capture Downside Capture
Actual Median* Rank Actual Median* Rank
2015
Manitou Equity Fund 1.159 1.007 3/11 0.684 0.684 6/11
Manitou Dividend Growth Fund 0.954 0.651 1/11 0.681 1.034 2/11
Canadian Equity Fund 0.755 1.068 14/14 0.479 0.838 4/14
Manitou US Equity Fund 0.950 0.948 3/6 1.013 1.037 3/6
Manitou Focus 5+ 1.514 0.958 1/5 -0.539 0.669 1/5
2014
Manitou Equity Fund 0.873 0.873 6/11 0.512 0.630 5/11
Manitou Dividend Growth Fund 1.003 0.818 1/8 0.809 0.950 4/8
Canadian Equity Fund 0.790 1.071 10/11 0.573 0.721 2/11
2013
Manitou Equity Fund 1.151 0.864 2/10 0.546 0.912 3/10
Manitou Dividend Growth Fund 1.20 0.71 1/9 0.94 0.91 6/9
Canadian Equity Fund 1.19 1.15 4/11 0.70 0.89 2/11
2012
Manitou Equity Fund 0.789 0.797 6/9 0.676 0.938 2/9
Manitou Dividend Growth Fund 1.134 0.843 2/9 0.957 0.957 6/9
Canadian Equity Fund 0.941 0.849 4/10 0.812 0.833 3/10
2011
Manitou Equity Fund 1.098 0.892 1/8 0.988 1.039 4/8
Manitou Dividend Growth Fund 0.900 0.947 5/8 0.628 0.864 3/8
Canadian Equity Fund 1.051 0.982 2/9 1.097 1.062 7/9 Source: Fundata Canada Inc.
*The peer group companies are based on a well-respected group of like-minded firms in equal category.

What’s in a Name? In traditional Ojibwa culture every person acquires a guardian ‘manitou’, or helping spirit. The powers of the manitou are drawn upon for
protection, identity and success. For us, the name Manitou represents strength, integrity, stewardship and the foundation upon which we build successful, long-lasting
relationships.
Manitou Investment Management Ltd.
Suite 3710, 77 King Street West, P.O. Box 342, Toronto Dominion Centre, Toronto, ON M5K 1K7, Ph.: 416.865.1867, www.manitouinvestment.com


