14
How to establish an ICT Indicator database in Indonesia Jakarta, 29 October – 2 November 2007
�����������������
����������������������
How to establish an ICT Indicator database in IndonesiaJakarta, 29 October – 2 November 2007
����������������� �������
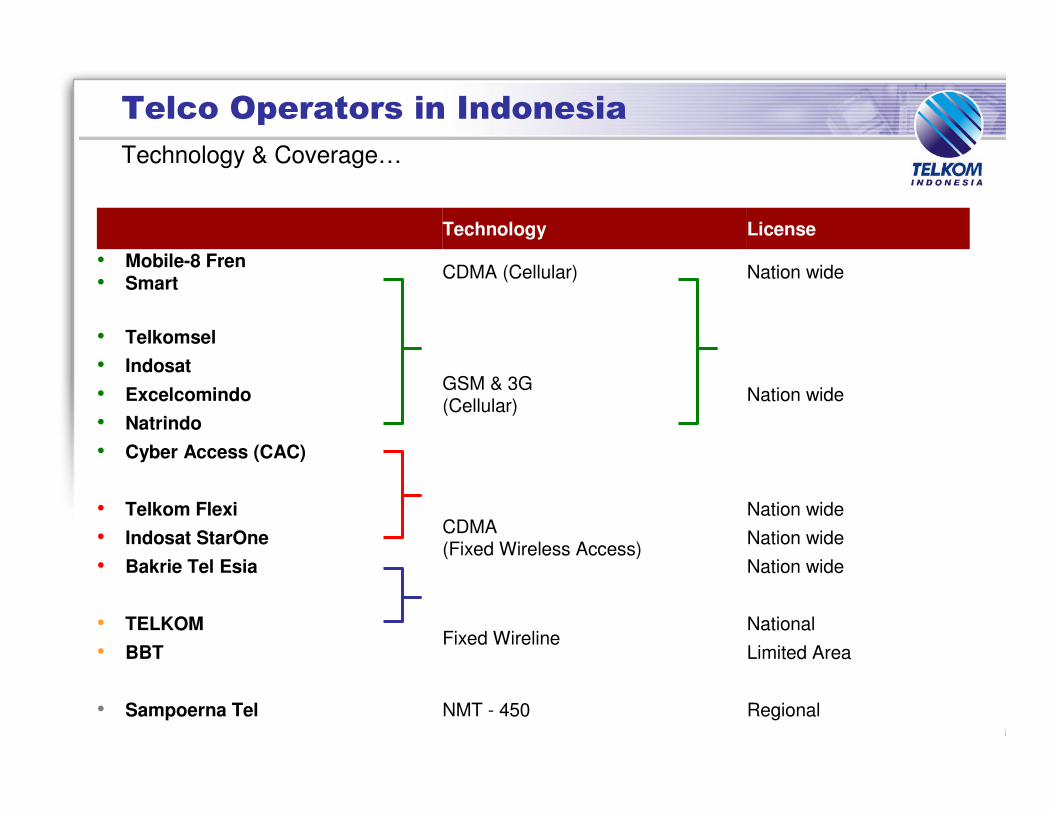
Technology & Coverage…
Nation wideCDMA (Cellular)• Mobile-8 Fren• Smart
NationalFixed Wireline
• TELKOM
RegionalNMT - 450• Sampoerna Tel
Limited Area• BBT
Nation wide• Bakrie Tel EsiaNation wide• Indosat StarOneNation wide
CDMA(Fixed Wireless Access)
• Telkom Flexi
• Cyber Access (CAC)
GSM & 3G(Cellular)
• Natrindo• Excelcomindo• Indosat
Nation wide
LicenseTechnology
• Telkomsel
��������
����
����
����
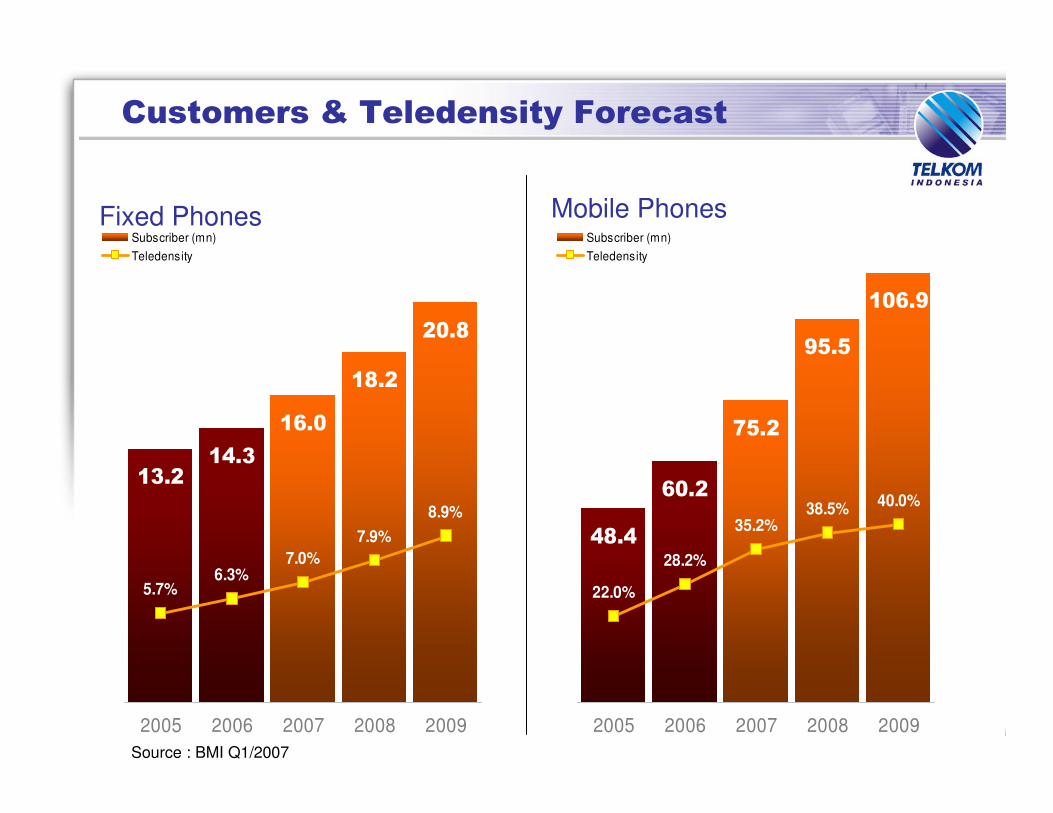
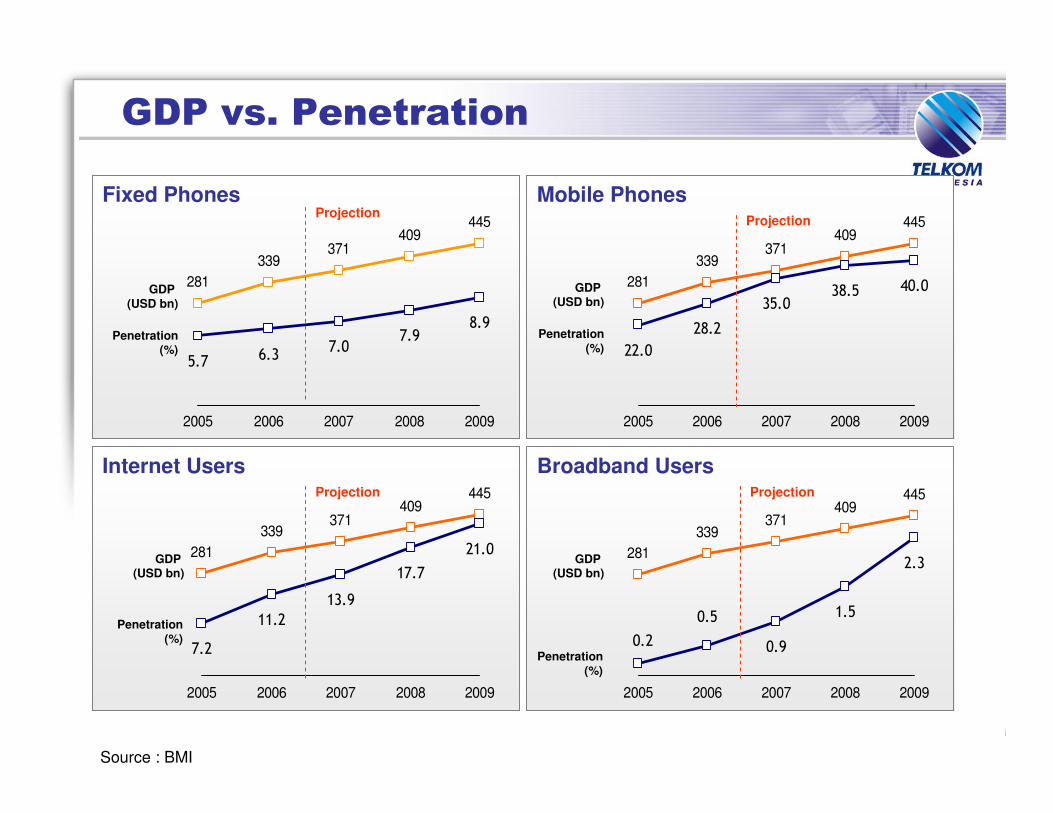
5.7%6.3%
7.0%
8.9%7.9%
2005 2006 2007 2008 2009
Subscriber (mn)Teledensity
����
����
����
����
�����
22.0%
28.2%
35.2%40.0%38.5%
2005 2006 2007 2008 2009
Subscriber (mn)Teledensity
������ ���� �����������!"�����
Mobile PhonesFixed Phones
Source : BMI Q1/2007
����
����
����
����
����
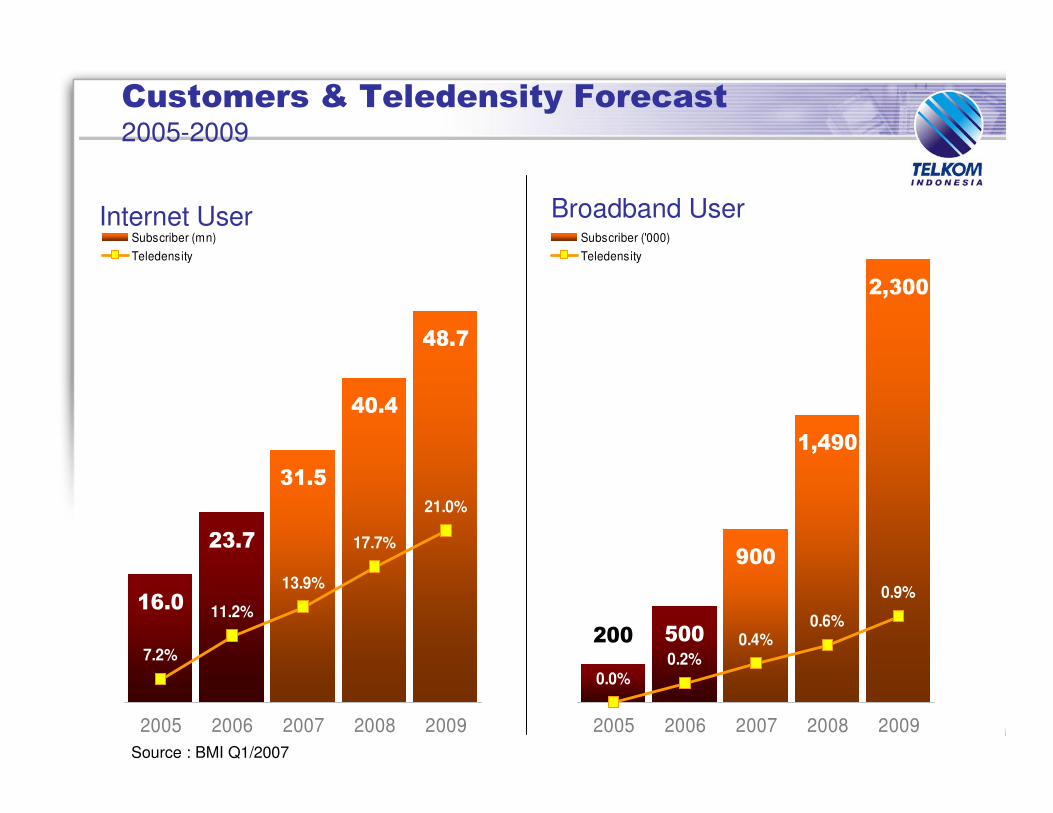
7.2%
11.2%
13.9%
21.0%
17.7%
2005 2006 2007 2008 2009
Subscriber (mn)Teledensity
���
���
�#���
�#���
���
0.0%0.2%
0.4%
0.9%
0.6%
2005 2006 2007 2008 2009
Subscriber ('000)Teledensity
������ ���� �����������!"�����2005-2009
Broadband UserInternet User
Source : BMI Q1/2007
$%&�'��&���������
Fixed Phones
339371
409445
281
������
������
���
2005 2006 2007 2008 2009
Mobile Phones
339371
409445
281
��
�������� ���
��
2005 2006 2007 2008 2009
Internet Users
339371
409445
281
���
����
����
���
��
2005 2006 2007 2008 2009
Broadband Users
339371
409445
281
���
���
��
���
��
2005 2006 2007 2008 2009
GDP (USD bn)
Penetration(%)
GDP (USD bn)
Penetration(%)
GDP (USD bn)
Penetration(%)
GDP (USD bn)
Penetration(%)
Source : BMI
Projection Projection
Projection Projection
��
���
���
���
���
���
���
��
��
� �� � �� �� �� ��
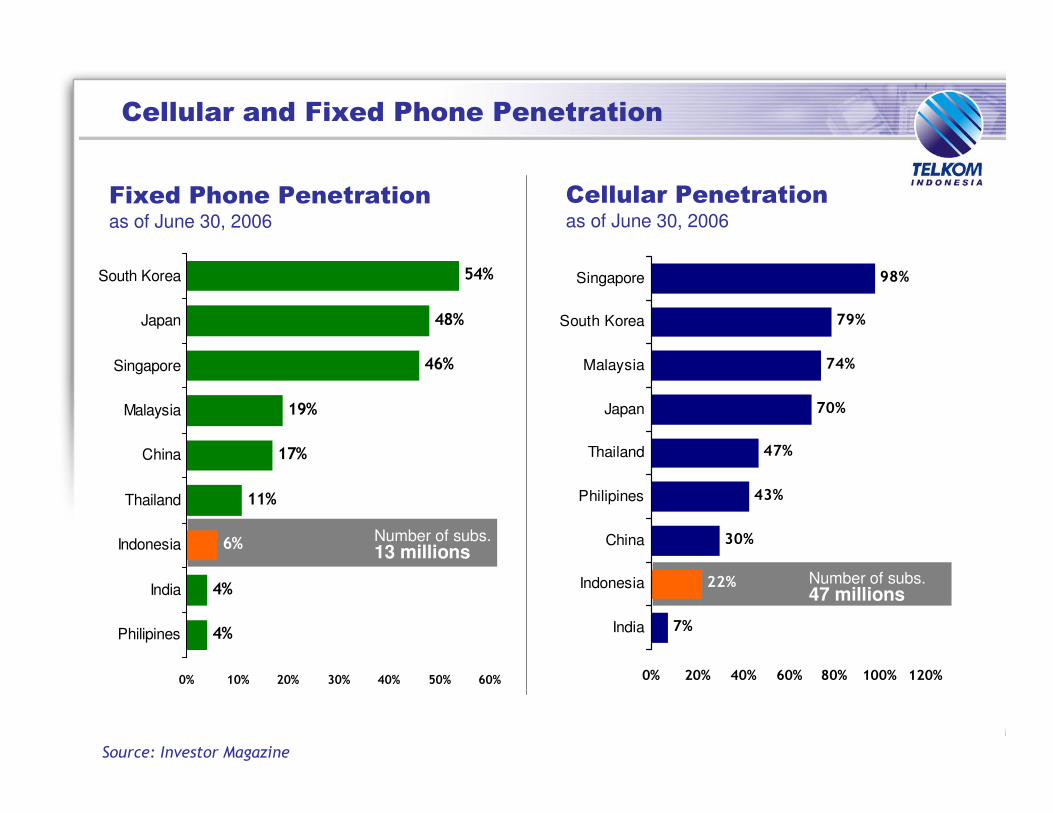
Philipines
India
Indonesia
Thailand
China
Malaysia
Singapore
Japan
South Korea
�����������"�(���&)����&���������
"�(���&)����&���������as of June 30, 2006
����������� ����������
Number of subs. 13 millions
Number of subs.47 millions
��������&���������as of June 30, 2006
��
��
���
���
��
���
���
���
�
� � �� �� �� �� ��
India
Indonesia
China
Philipines
Thailand
Japan
Malaysia
South Korea
Singapore
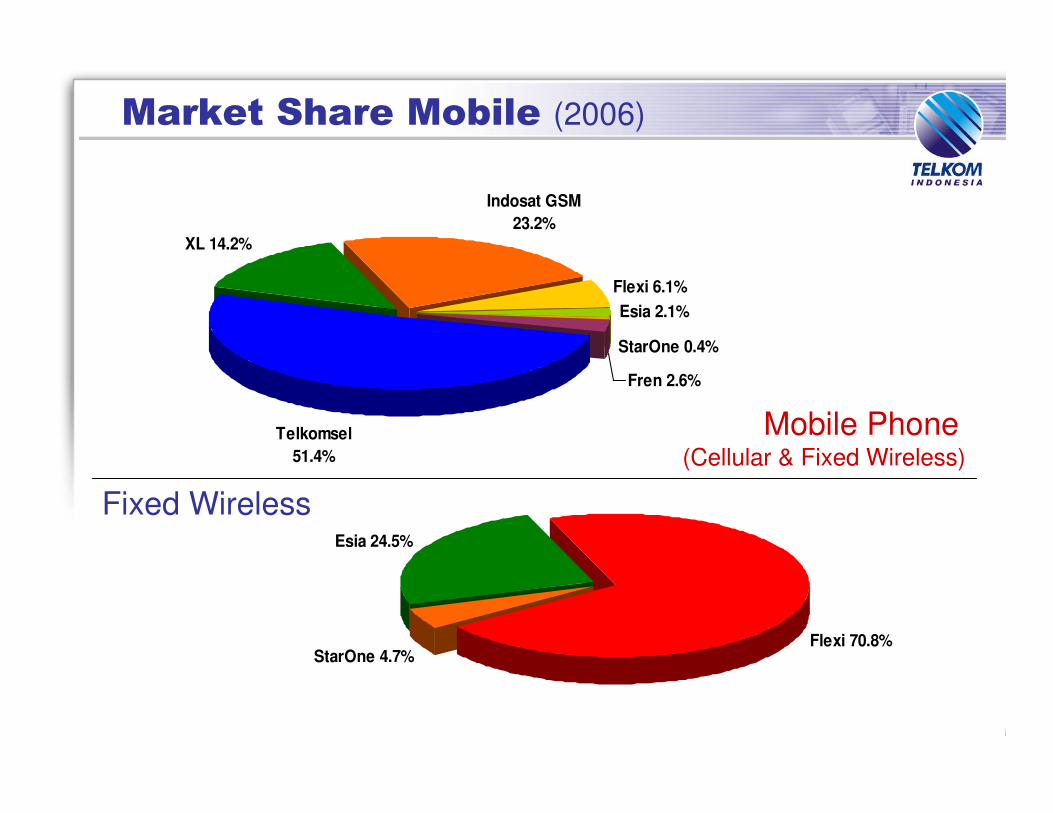
*�+���,)���* �-����(2006)
Esia 2.1%
StarOne 0.4%
XL 14.2%
Fren 2.6%
Flexi 6.1%
Indosat GSM 23.2%
Telkomsel 51.4%
Esia 24.5%
StarOne 4.7%Flexi 70.8%
Mobile Phone(Cellular & Fixed Wireless)
Fixed Wireless

"�(���Line Subscriber…
Fixed Wireline
Fixed Wiless
Business
Residential
Mio Subscribers Mio Subscriber
��#��
�#��
�#��
1H/07
�#��
�#��
1H/07
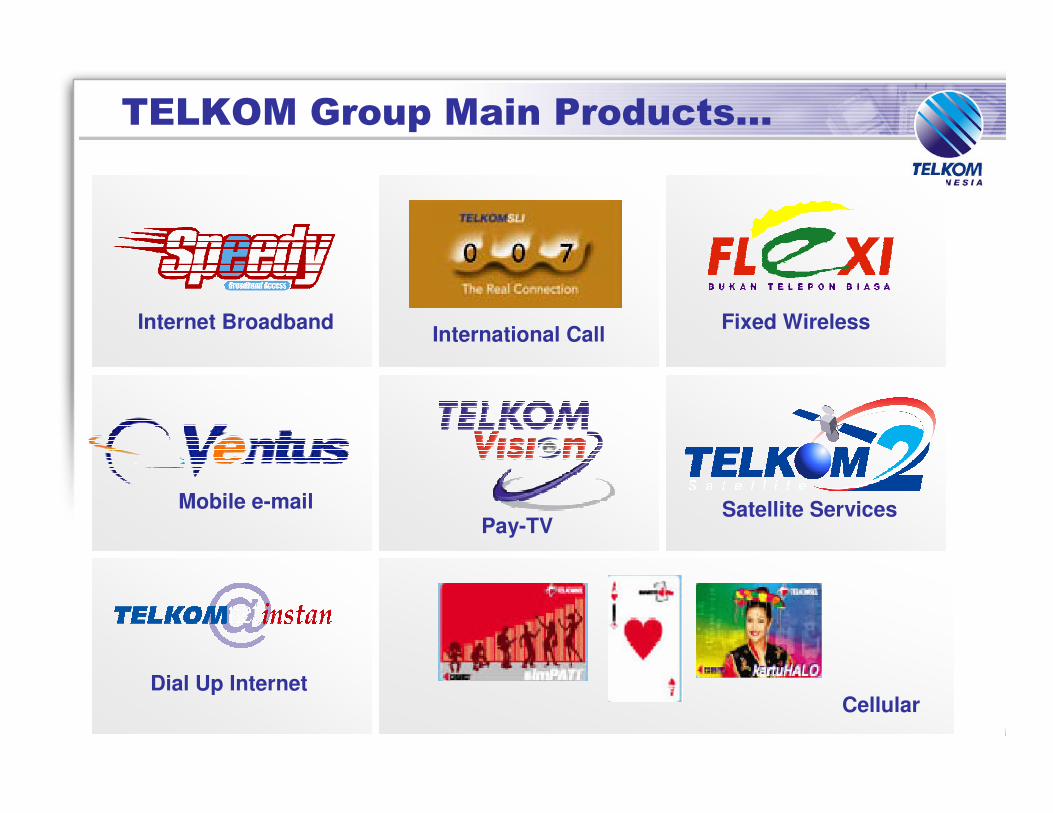
�./0�* �$�����*���&������1
Internet Broadband International Call Fixed Wireless
Mobile e-mailPay-TV
Satellite Services
Dial Up InternetCellular

�������"�(���
2 �������
"�(���
2 ������� ������� 3���-��
� TELKOM 99%� BBT <1%
� Telkomsel 56%� Indosat� Excel � Others
� TELKOM 71%� Indosat� Bakrie
8,7 M8,7 M 5,72 M5,72 M 62 M62 M 25 M25 M 150 K150 K
Source : Telkom & Depkominfo
� Internet Kiosk 43%� Campuses 3%� Schools 1%� Offices 41%� Households 12%
� Speedy 65%� Wireless BB� Others
�4
&���������
���4
&���������
����4
&���������
����4
&���������
���4
&���������
�./0�* �$�����&���������� �������-�����
as of December, 2006
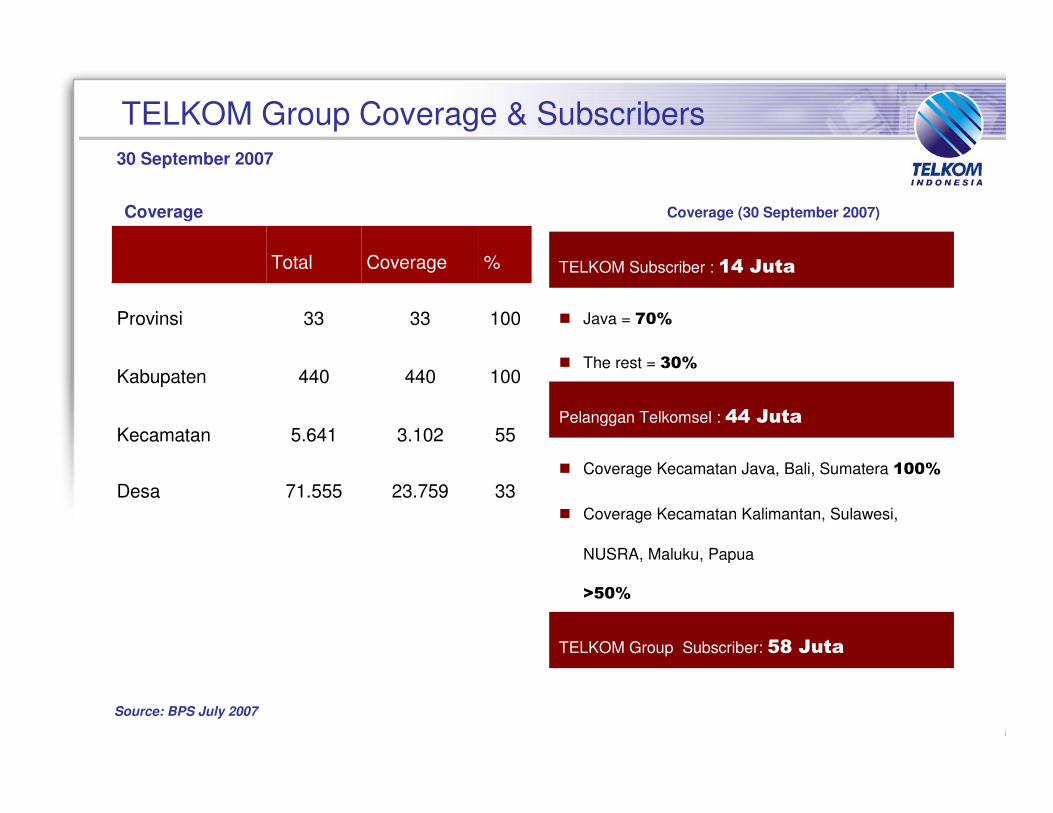
TELKOM Group Coverage & Subscribers30 September 2007
Coverage Coverage (30 September 2007)
Source: BPS July 2007
TELKOM Group Subscriber: ���5��
� Coverage Kecamatan Java, Bali, Sumatera ���4
� Coverage Kecamatan Kalimantan, Sulawesi,
NUSRA, Maluku, Papua
6��4
Pelanggan Telkomsel : ���5��
� Java = ��4
� The rest = ��4
TELKOM Subscriber : ���5��
3323.75971.555Desa
553.1025.641Kecamatan
100440440Kabupaten
1003333Provinsi
%CoverageTotal

����������������������
7 ������ � ���������7
• Fixed telephone lines per 100 inhabitants
• Mobile cellular subscribers per 100 inhabitants
• Percentage of population covered by mobile cellular
telephony
• Mobile cellular tariffs (100 minutes of use per month), in US$,
and as a percentage of per capita income
• Tendency: Fixed to Mobile
����������������������
7 ��������7
• Computers per 100 inhabitants
• Internet subscribers per 100 inhabitants
• Broadband Internet subscribers per 100 inhabitants
• International Internet bandwidth per inhabitant
• Internet access tariffs (20 hours per month), in US$, and as a percentage of per capita income
• Percentage of localities with public Internet access centres(PIACs) by number of inhabitants (rural/urban)
• Mostly cause–effect conditions.
• What about Internet coverage (Wireless) and IP address (public).


