Page 1
© D
assa
ult S
ystè
mes
| C
onfid
entia
l Inf
orm
atio
n |
2/3/
2021
| ref
.: 3D
S_D
ocum
ent_
2020
Dassault Systèmes
Q4 & 2020 Earnings Presentation
Bernard Charlès,
Vice-Chairman & CEO
Pascal Daloz,
COO & CFO
Page 2
2
© D
assa
ult S
ystè
mes
| C
onfid
entia
l Inf
orm
atio
n |
2/3/
2021
| ref
.: 3D
S_D
ocum
ent_
2020
Forward Looking Information Statements herein that are not historical facts but express expectations or objectives for the future, including but not limited to statementsregarding the Group’s non-IFRS financial performance objectives or framework, are forward-looking statements. Such forward-lookingstatements are based on Dassault Systèmes management's current views and assumptions and involve known and unknown risks anduncertainties. Actual results or performances may differ materially from those in such statements due to a range of factors.
The Group’s current framework for 2021 takes into consideration, among other things, an uncertain global economic environment. In light ofthe uncertainties regarding economic, business, social, health and geopolitical conditions at the global level, Dassault Systèmes’ revenue, netearnings and cash flows may grow more slowly, whether on an annual or quarterly basis, mainly due to the following factors:
the deployment of Dassault Systèmes’ solutions may represent a large portion of a customer’s investments in software technology.Decisions to make such an investment are impacted by the economic environment in which the customers operate. Uncertain globalgeopolitical, economic and health conditions and the lack of visibility or the lack of financial resources may cause some customers, e.g.within automotive, aerospace or natural resources industries, to reduce, postpone or terminate their investments, or to reduce or notrenew ongoing paid maintenance for their installed base, which impact larger customers’ revenue with their respective sub-contractors;the sales cycle of the Dassault Systèmes’ products – already relatively long due to the strategic nature of such investments for customers– could further lengthen; and
the political, economic and monetary situation in certain geographic regions where Dassault Systèmes operates could become morevolatile and, for example, result in stricter export compliance rules or the modification of current tariff regimes;
health conditions in some geographic areas where Dassault Systèmes operates will impact the economic situation of those regions.Specifically, it is not possible to predict the impact, length and scope of damages originating from the coronavirus pandemic as ofissuance date of this document. Health conditions, including the COVID-19 pandemic, may present risks for health and ability to travel forDassault Systèmes employees; and
continued pressure or volatility on raw materials and energy prices could also slow down Dassault Systèmes’ diversification efforts in newindustries.
Page 3
3
© D
assa
ult S
ystè
mes
| C
onfid
entia
l Inf
orm
atio
n |
2/3/
2021
| ref
.: 3D
S_D
ocum
ent_
2020
Forward Looking Information Dassault Systèmes makes every effort to take into consideration this uncertain macroeconomic outlook. Dassault Systèmes’ business
results, however, may not develop as anticipated. Furthermore, due to factors affecting sales of Dassault Systèmes’ products and services,
there may be a substantial time lag between an improvement in global economic and business conditions and an upswing in the Company’s
business results.
The economic context (as notably caused by the COVID-19 pandemic health crisis) may also adversely impact the financial situation or
financing capabilities of the Dassault Systèmes’ existing and potential customers, commercial and technology partners, some of whom may
be forced to temporarily close sites or cease operations due to cash flow and profitability issues. Dassault Systèmes’ ability to collect
outstanding receivables may be affected. In addition, the economic environment could generate increased price pressure, as customers
seek lower prices from various competitors, which could negatively impact Dassault Systèmes’ revenue, financial performance and market
position.
The Group’s actual results or performance may also be materially negatively affected by numerous risks and uncertainties, as described in
the “Risk Factors” section of the 2019 Document d'enregistrement universel (Annual Report) filed with the AMF (French Financial Markets
Authority) on March 19, 2020, available on the Group’s website www.3ds.com.
In preparing such forward-looking statements, the Group has in particular assumed an average US dollar to euro exchange rate of US$1.22
per €1.00 as well as an average Japanese yen to euro exchange rate of JPY126.0 to €1.00 before hedging for the first quarter and full year
2021. However, currency values fluctuate, and the Group’s results of operations may be significantly affected by changes in exchange rates.
Page 4
4
© D
assa
ult S
ystè
mes
| C
onfid
entia
l Inf
orm
atio
n |
2/3/
2021
| ref
.: 3D
S_D
ocum
ent_
2020
Non-IFRS InformationReaders are cautioned that the supplemental non-IFRS information presented in this earnings presentation is subject to inherent limitations.
It is not based on any comprehensive set of accounting rules or principles and should not be considered as a substitute for IFRS
measurements. Also, the Group’s supplemental non-IFRS financial information may not be comparable to similarly titled non-IFRS
measures used by other companies. Further specific limitations for individual non-IFRS measures, and the reasons for presenting non-IFRS
financial information, are set forth in the Group’s 2019 Document d'enregistrement universel (annual report) filed with the AMF on March 19,
2020.
In the tables accompanying this earnings presentation the Group sets forth its supplemental non-IFRS figures for revenue, operating
income, operating margin, net income and diluted earnings per share, which exclude the effect of adjusting the carrying value of acquired
companies’ deferred revenue, share-based compensation expense and related social charges, the amortization of acquired intangible
assets and of tangibles reevaluation, other operating income and expense, net, including acquisition, integration and restructuring
expenses, impairment of goodwill and acquired intangibles, lease incentives of acquired companies, certain one-time items included in
financial revenue and other, net, and the income tax effect of the non-IFRS adjustments and certain one-time tax effects. The tables also set
forth the most comparable IFRS financial measures and reconciliations of this information with non-IFRS information.
Page 5
5
© D
assa
ult S
ystè
mes
| C
onfid
entia
l Inf
orm
atio
n |
2/3/
2021
| ref
.: 3D
S_D
ocum
ent_
2020
Information in Constant Currencies
We have followed a long-standing policy of measuring our revenue performance and setting our revenue objectives exclusive of currency in order to measure in a transparent manner the underlying level of improvement in our total
revenue and software revenue by type, industry, region and product lines. We believe it is helpful to evaluate our growth exclusive of currency impacts, particularly to help understand revenue trends in our business. Therefore, we provide
percentage increases or decreases in our revenue and EPS (in both IFRS as well as non-IFRS) to eliminate the effect of changes in currency values, particularly the U.S. dollar and the Japanese yen, relative to the euro. When trend
information is expressed by us "in constant currencies", the results of the "prior" period have first been recalculated using the average exchange rates of the comparable period in the current year, and then compared with the results of the
comparable period in the current year.
While constant currency calculations are not considered to be an IFRS measure, we do believe these measures are critical to understanding our global revenue results and to compare with many of our competitors who report their
financial results in U.S. dollars. Therefore, we are including this calculation for comparing IFRS revenue figures for comparable periods as well as for comparing non-IFRS revenue figures for comparable periods. All constant currency
information is provided on an approximate basis. Unless otherwise indicated, the impact of exchange rate fluctuations is approximately the same for both the Group’s IFRS and supplemental non-IFRS financial data.
Information on Growth excluding acquisitions (“organic growth”)
In addition to discussing total growth, we also provide financial information where we discuss growth excluding acquisitions or growth on an organic basis as used alternatively. In both cases, growth excluding acquisitions have been
calculated using the following restatements of the scope of consolidation: for entities entering the consolidation scope in the current year, subtracting the contribution of the acquisition from the aggregates of the current year, and for
entities entering the consolidation scope in the previous year, subtracting the contribution of the acquisition from January 1st of the current year, until the last day of the month of the current year when the acquisition was made the
previous year.
Information on Industrial Sectors
Dassault Systèmes’ Industries develop Solution Experiences, industry-focused offerings which deliver specific value to companies and users in a particular industry. We serve eleven industries structured into three sectors: Manufacturing
Industries (Transportation & Mobility; Aerospace; Marine & Offshore; Industrial Equipment; High-Tech; Home & Lifestyle; Consumer Packaged Goods & Retail and a portion of Business Services); Life Sciences & Healthcare (Life
Sciences); and Infrastructure & Cities (Energy & Materials; Construction, Cities and Territories; Business Services).
Information on Product Lines
Commencing with the first quarter of 2020 and as previously disclosed, we are introducing a new presentation of our product lines to reflect our broader ambitions. Our new product line financial reporting includes: 1) Industrial Innovation
software revenue, comprised of our CATIA, ENOVIA, SIMULIA, DELMIA, GEOVIA, NETVIBES/EXALEAD, and 3DEXCITE brands; 2) Life Sciences software revenue, comprised of our MEDIDATA and BIOVIA brands; and 3) Mainstream
Innovation software revenue, comprised of our SOLIDWORKS brand as well as CENTRIC PLM, 3DVIA and our new 3DEXPERIENCE WORKS family.
3DEXPERIENCE Licenses and Software Contribution
To measure the progressive penetration of 3DEXPERIENCE software, the Group utilizes the following ratios: a) for new licenses revenue, the Group calculates the percentage contribution by comparing total 3DEXPERIENCE new licenses
revenue to new licenses revenue for all product lines except SOLIDWORKS and acquisitions (“related new licenses revenue”); and, b) for software revenue, the Group calculates the percentage contribution by comparing total
3DEXPERIENCE software revenue to software revenue for all product lines except SOLIDWORKS and acquisitions (“related software revenue”).
Adjusted Net Debt
The Adjusted Net Debt corresponds to the net financial debt position (borrowings net of cash, cash equivalent and short-term investments) adjusted of IFRS 16 lease liabilities.
IFRS EBITDAO (Earnings Before Interest, Taxes and Amortization Operating)
The IFRS EBITDAO corresponds to the IFRS operating income adjusted of amortization, depreciation and impairment expense of intangible and tangible assets and of non-cash share-based payment expense (excluding related social
charges).
Glossary of Definitions
Page 6
6
© D
assa
ult S
ystè
mes
| C
onfid
entia
l Inf
orm
atio
n |
2/3/
2021
| ref
.: 3D
S_D
ocum
ent_
2020
2020 Highlights Non-IFRS
In 2020, delivering:
Mission Critical in Three Sectors Manufacturing Industries - Life Sciences & Healthcare - Infrastructure & Cities
Leadership Reinforcement Industrial Innovation - Life Sciences - Mainstream Innovation
Sustainable Organization Successfully transitioning to the next generation of leaders
In 2020, demonstrating:
In 2021 and beyond, leveraging:
Revenue FY20 revenue up +12% (ex FX) to €4.5bn (recurring revenue: 80% of software revenue)
Operating Margin FY20 margin at 30.2%
EPS FY20 EPS up +3% to €3.77
Corporate Social Responsibility Fulfilling commitment to retain all employees - R&D headcount +10%
Purpose Driven Company Handprint Leverage - Footprint Commitment
Long-term Growth Potential Total Addressable Market: $41bn - Potential Addressable Market: $100bn
3DEXPERIENCE Platform The Platform is our Channel
Page 7
7
© D
assa
ult S
ystè
mes
| C
onfid
entia
l Inf
orm
atio
n |
2/3/
2021
| ref
.: 3D
S_D
ocum
ent_
2020
Q4 & FY 2020 Business & Strategy Highlights
Q4 & FY 2020 Financial Highlights
Q1 & FY 2021 Financial Objectives
Agenda
Financial Information Appendix
Page 8
8
© D
assa
ult S
ystè
mes
| C
onfid
entia
l Inf
orm
atio
n |
2/3/
2021
| ref
.: 3D
S_D
ocum
ent_
2020
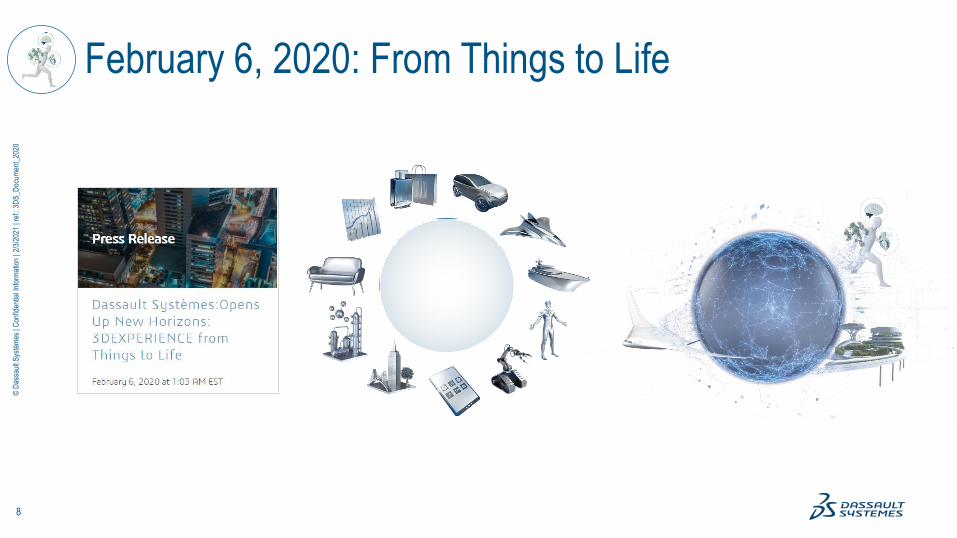
February 6, 2020: From Things to Life
Page 9
9
© D
assa
ult S
ystè
mes
| C
onfid
entia
l Inf
orm
atio
n |
2/3/
2021
| ref
.: 3D
S_D
ocum
ent_
2020
19813D
Design
19893D DMUDigital
Mock-up
20123DEXPERIENCE®
platform
19993D PLM
Product LifecycleManagement
2020Virtual TwinExperience of Humans
Catalyst of Industry Renaissance
…for Sustainable Innovation and Life Sciences & Healthcare
Page 10
10
© D
assa
ult S
ystè
mes
| C
onfid
entia
l Inf
orm
atio
n |
2/3/
2021
| ref
.: 3D
S_D
ocum
ent_
2020
FromTHINGS
to LIFE
FromCONNECTIONS
toRELATIONSHIPS
FromMAKING
to GROWING
FromSOCIAL
to HUMAN
NEW AMBITIONGame-changing Foundations
Page 11
11
© D
assa
ult S
ystè
mes
| C
onfid
entia
l Inf
orm
atio
n |
2/3/
2021
| ref
.: 3D
S_D
ocum
ent_
2020
Page 12
12
© D
assa
ult S
ystè
mes
| C
onfid
entia
l Inf
orm
atio
n |
2/3/
2021
| ref
.: 3D
S_D
ocum
ent_
2020
Time to Innovation Patient Centricity
Continuity & Digitalization
Game Changer in Three Sectors
Connecting Industries & Economy
Life Sciences& HealthcareManufacturing
Industries
New uses 5G - IOT
Consumer Markets
Government Stimulus
Quality of Life Health & Safety
Job Creation
Infrastructure& Cities
Page 13
13
© D
assa
ult S
ystè
mes
| C
onfid
entia
l Inf
orm
atio
n |
2/3/
2021
| ref
.: 3D
S_D
ocum
ent_
2020
60% OF COVID-19 TRIALS
POWERED BY MEDIDATA
New Patient Equation
500+clinical trials
Hundreds to thousandspatients in trials
50-60% reductionin study startup time
350+ researchersaccessing RWE* environment
75Bn records from 250M patientson RWE* environment * Real World Evidence
2020 RevealVirtual Twin Experience of Humans
Research to Patient Care Virtual Twin Experience
Research Manufacturing Patient
Page 14
14
© D
assa
ult S
ystè
mes
| C
onfid
entia
l Inf
orm
atio
n |
2/3/
2021
| ref
.: 3D
S_D
ocum
ent_
2020
Business Value:
Novo Nordisk
Leading healthcare company that aims to defeat
diabetes and other serious chronic diseases
► Virtual development and digital continuity
for insulin syringes
− Lead-time reduction
− Right first time
− Cost reduction
− Full traceability
− Automation and democratization
Adopts 3DEXPERIENCE Platform
EUROPE
Time to innovation Patient Centricity
3DEXPERIENCE platform with
Engineered to Cure
Page 15
15
© D
assa
ult S
ystè
mes
| C
onfid
entia
l Inf
orm
atio
n |
2/3/
2021
| ref
.: 3D
S_D
ocum
ent_
2020
TECHCATALYST TO CREATE
THE SUPPLIERS
OF THEFUTURE
3DS Platform Partner for SOFTWARE REPUBLIQUESovereignty for New Mobilities' Software Development
“The Renaulution is about moving the whole company from volumes
to value. We will feed our brands’ strength, each with their own clear,
differentiated territories. We’ll move from a car company working with
tech to a tech company working with cars.”LUCA DE MEO
CEO of Groupe Renault
Business Value:
‘Renaulution’: ambitious transformative program
Moving away from volumes and on to value.
New uses - 5G - IOT
EUROPE
NEW Mobility Experiences
NEW Value Networks
NEW Ways of Working
3DEXPERIENCE platform with
Smart, Safe and Connected
Page 16
16
© D
assa
ult S
ystè
mes
| C
onfid
entia
l Inf
orm
atio
n |
2/3/
2021
| ref
.: 3D
S_D
ocum
ent_
2020
Business Value:
The world's largest tier-one manufacturer of aerostructures
Spirit AeroSystemsExpands3DEXPERIENCE Adoption
► Competing for and winning contracts:
− Time to market acceleration
− Non-recurring cost reduction
− Recurring cost reduction
(operation and governance efficiency)
Government Stimulus
AMERICAS
3DEXPERIENCE platform with:
Program Excellence
Co-Design to Target
Ready for Rate
Page 17
17
© D
assa
ult S
ystè
mes
| C
onfid
entia
l Inf
orm
atio
n |
2/3/
2021
| ref
.: 3D
S_D
ocum
ent_
2020
Business Value:
► Strategic initiative to be merchandise driven,
and leverage direct connections with consumers
101 Countries
2,250 Stores
14,000 Points of sale
Ecco
Danish shoe manufacturer and retailer
Expands from CATIA Generative Design to Centric PLMECCO
Consumer Markets
EUROPE
E-commerce+ Centric PLM
Page 18
18
© D
assa
ult S
ystè
mes
| C
onfid
entia
l Inf
orm
atio
n |
2/3/
2021
| ref
.: 3D
S_D
ocum
ent_
2020
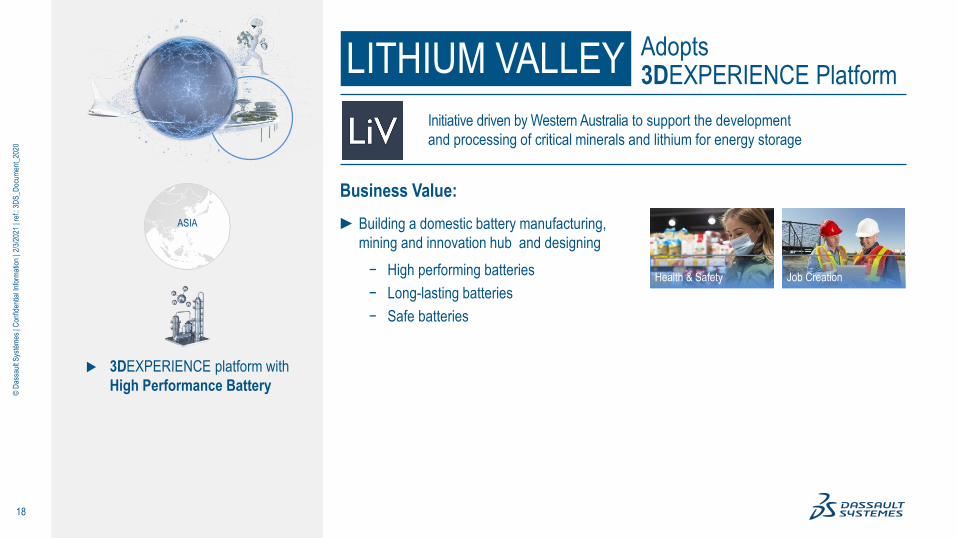
Business Value:
► Building a domestic battery manufacturing,
mining and innovation hub and designing
− High performing batteries
− Long-lasting batteries
− Safe batteries
LITHIUM VALLEY Adopts3DEXPERIENCE Platform
Initiative driven by Western Australia to support the development
and processing of critical minerals and lithium for energy storage
Health & Safety Job Creation
ASIA
3DEXPERIENCE platform with
High Performance Battery
Page 19
19
© D
assa
ult S
ystè
mes
| C
onfid
entia
l Inf
orm
atio
n |
2/3/
2021
| ref
.: 3D
S_D
ocum
ent_
2020
Engineer ready-to-deliver infrastructure with knowledge based design
Higher performing designs Lower lifecycle costs
Strong momentum in China
ENERGY – TRANSPORTATION - HEALTH
1 Chengdu Engineering Corporation Limited and Guiyang Engineering Corporation Limited 3 China Railway Siyuan Survey and Design group co., LTD.4 Shanghai Municipal Engineering Design Institute (group) co., LTD
2 31
Quality of Life
Business Value:ASIA
3DEXPERIENCE platform with
Civil Infrastructure
Engineering
Page 20
20
© D
assa
ult S
ystè
mes
| C
onfid
entia
l Inf
orm
atio
n |
2/3/
2021
| ref
.: 3D
S_D
ocum
ent_
2020
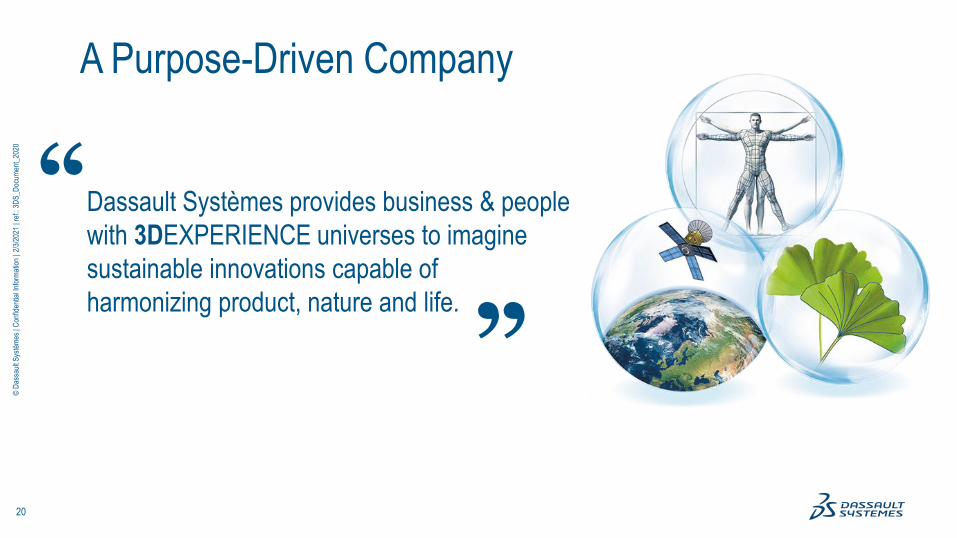
A Purpose-Driven Company
Dassault Systèmes provides business & people
with 3DEXPERIENCE universes to imagine
sustainable innovations capable of
harmonizing product, nature and life.
“ “
Page 21
21
© D
assa
ult S
ystè
mes
| C
onfid
entia
l Inf
orm
atio
n |
2/3/
2021
| ref
.: 3D
S_D
ocum
ent_
2020
A Purpose Driven CompanyInspire to Imagine Acts for Good
ACT EMOTION
ACT WATER
ACT CITIES
ACT ENERGY
ACT MOBILITY
ACT CONSUMPTION
ACT NATURE
ACT HEALTH
ACT HERITAGE
ACT FUTURE
How can we consume smarter
and protect our most precious resource?
Unveiling the “Water for
Life” Act to enable industry
to consume smarter and
protect the world’s most
precious resource
Page 22
22
© D
assa
ult S
ystè
mes
| C
onfid
entia
l Inf
orm
atio
n |
2/3/
2021
| ref
.: 3D
S_D
ocum
ent_
2020
1 Footprint: negative impact
2 Handprint: positive impact
3 Scopes 1, 2 and 3 excluding purchased goods,use of goods sold and services
4 Global CO2 emissions: 33 GtCO2 in 2019
Download Dassault Systèmes
Accenture Sustainability Insights
Virtual Twins to bring USD $1.3 Trillion
of economic value and 7.54Gt CO2e emissions
HANDPRINT2
LEVERAGE
FOOTPRINT1
COMMITMENT
3DS and Accenture Reveal Giant Potential of Virtual Twin Experience Handprint
2025 goal: 2/3 of new licenses with
positive sustainability impact
Committed to the SCIENCE BASED
TARGETS INITIATIVE
2025 goal3: 5t CO2/FTE-38% vs 2018
1 ‘0,000s
reductions between now and 2030
Page 23
23
© D
assa
ult S
ystè
mes
| C
onfid
entia
l Inf
orm
atio
n |
2/3/
2021
| ref
.: 3D
S_D
ocum
ent_
2020
50% of the Board*
40% of Executives
30% of Managers
* Excluding the directors representing the employees
Women’s Representation
Page 24
24
© D
assa
ult S
ystè
mes
| C
onfid
entia
l Inf
orm
atio
n |
2/3/
2021
| ref
.: 3D
S_D
ocum
ent_
2020
The 3DExperience Platform Powers our Customer EngagementThe platform is our channel
Page 25
25
© D
assa
ult S
ystè
mes
| C
onfid
entia
l Inf
orm
atio
n |
2/3/
2021
| ref
.: 3D
S_D
ocum
ent_
2020
Play the Experience
Reveal the Power
of Human Creativity
Represent the World
Test the World
Reveal the Invisible
3DEXPERIENCE®
Platform
Page 26
26
© D
assa
ult S
ystè
mes
| C
onfid
entia
l Inf
orm
atio
n |
2/3/
2021
| ref
.: 3D
S_D
ocum
ent_
2020
Page 27
27
© D
assa
ult S
ystè
mes
| C
onfid
entia
l Inf
orm
atio
n |
2/3/
2021
| ref
.: 3D
S_D
ocum
ent_
2020
Q4 & FY 2020 Business & Strategy Highlights
Q4 & FY 2020 Financial Highlights
Q1 & FY 2021 Financial Objectives
Agenda
Financial Information Appendix
Page 28
28
© D
assa
ult S
ystè
mes
| C
onfid
entia
l Inf
orm
atio
n |
2/3/
2021
| ref
.: 3D
S_D
ocum
ent_
2020
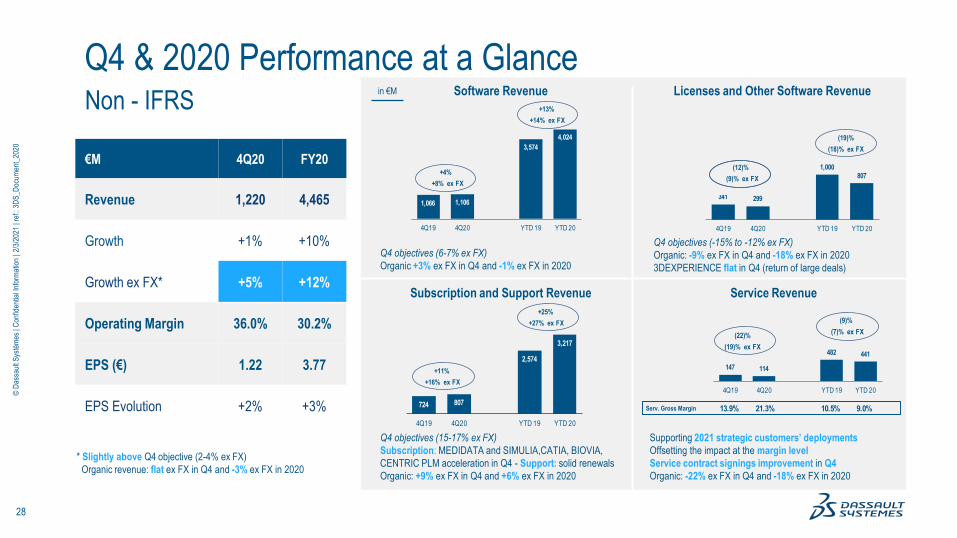
Software Revenuein €M Licenses and Other Software Revenue
Subscription and Support Revenue Service Revenue
Q4 & 2020 Performance at a Glance Non - IFRS
Serv. Gross Margin
* Slightly above Q4 objective (2-4% ex FX)
Organic revenue: flat ex FX in Q4 and -3% ex FX in 2020
Q4 objectives (15-17% ex FX)
Subscription: MEDIDATA and SIMULIA,CATIA, BIOVIA,
CENTRIC PLM acceleration in Q4 - Support: solid renewals
Organic: +9% ex FX in Q4 and +6% ex FX in 2020
Supporting 2021 strategic customers’ deployments
Offsetting the impact at the margin level
Service contract signings improvement in Q4
Organic: -22% ex FX in Q4 and -18% ex FX in 2020
€M 4Q20 FY20
Revenue 1,220 4,465
Growth +1% +10%
Growth ex FX* +5% +12%
Operating Margin 36.0% 30.2%
EPS (€) 1.22 3.77
EPS Evolution +2% +3%
+8% ex FX
+4%
+14% ex FX
+13%
341 299
1,000807
4Q19 4Q20 YTD 19 YTD 20
(9)% ex FX
(12)%
(18)% ex FX
(19)%
+16% ex FX
+11%
+27% ex FX
+25%
(19)% ex FX
(22)%(7)% ex FX
(9)%
147 114
482 441
4Q19 4Q20 YTD 19 YTD 20
1,066 1,106
3,574
4,024
4Q19 4Q20 YTD 19 YTD 20
Q4 objectives (6-7% ex FX)
Organic +3% ex FX in Q4 and -1% ex FX in 2020
Q4 objectives (-15% to -12% ex FX)
Organic: -9% ex FX in Q4 and -18% ex FX in 2020
3DEXPERIENCE flat in Q4 (return of large deals)
13.9% 21.3% 10.5% 9.0%724 807
2,574
3,217
4Q19 4Q20 YTD 19 YTD 20
Page 29
29
© D
assa
ult S
ystè
mes
| C
onfid
entia
l Inf
orm
atio
n |
2/3/
2021
| ref
.: 3D
S_D
ocum
ent_
2020
AMERICASQ4:+23%, 2020:+38%*Share 38%**
Strong performance in Life Sciences (Medidatacontribution) and in Aerospace
Software Revenue by Region Non-IFRS
ASIAQ4: +3%, 2020: +5%*Share 25%**
China up 20% ex FX in Q4 and 15% ex FX in 2020 offset by softness in Korea and difficult environment in India
EUROPE Q4: flat, 2020: +2% * | Share 37%**
Slight growth in Northern Europe and France in Q4
In 2020, double-digit growth in Northern Europe partly offset by Southern Europe
* YOY Growth ex FX
** 2020 share
Page 30
30
© D
assa
ult S
ystè
mes
| C
onfid
entia
l Inf
orm
atio
n |
2/3/
2021
| ref
.: 3D
S_D
ocum
ent_
2020 % Growth ex FX 4Q20 2020
Industrial Innovation software revenue -1% -3%
of which CATIA +4% -2%
of which ENOVIA -1% -5%
Life Sciences software revenue +39% +206%
Mainstream Innovation software revenue +10% +4%
of which SOLIDWORKS +7% +4%
Total software revenue +8% +14%
Software Revenue by Product Line Non-IFRS
CATIA performance driven by Cyber Systems in Q4 (Aerospace and Transportation & Mobility)
MEDIDATA: total revenue up 20% ex FX in Q4Backlog providing strong foundation for 2021
SOLIDWORKS: 20,000 new customers in 2020
ENOVIA win rate above ~80% in 2020
Page 31
31
© D
assa
ult S
ystè
mes
| C
onfid
entia
l Inf
orm
atio
n |
2/3/
2021
| ref
.: 3D
S_D
ocum
ent_
2020
Business Value:
► Time to market
► Total Cost of Ownership reduction (IT infrastructure)
► Virtual Twin Experience of the complete line for
pharmaceutical companies
SVM
Packaging machines for the pharmaceutical industry.
Adopts3DEXPERIENCE PlatformStevanato Group
Industrial Innovation Life Sciences Mainstream Innovation
New uses - 5G - IOT
EUROPE
3DEXPERIENCE Platform with
Digital Equipment Continuity
on the Cloud
Page 32
32
© D
assa
ult S
ystè
mes
| C
onfid
entia
l Inf
orm
atio
n |
2/3/
2021
| ref
.: 3D
S_D
ocum
ent_
2020
Business Value:
Time to innovation
Horizon
Pharmaceutical company
Rare and rheumatic diseases
► Lower development costs
► Clinical studies: reduction in time to completion
► Agility to scale and grow
► Expansion includes MEDIDATA’s Intelligent Trials
solution, built on the industry’s broadest clinical trial
dataset (6+ million patients in 22,000+ clinical trials)
Extends Multi-year Agreement
with MEDIDATA
Industrial Innovation Life Sciences Mainstream Innovation
AMERICAS
MEDIDATA Clinically Approved
on the Cloud
Page 33
33
© D
assa
ult S
ystè
mes
| C
onfid
entia
l Inf
orm
atio
n |
2/3/
2021
| ref
.: 3D
S_D
ocum
ent_
2020
Business Value:
TINIKO
Korea-based super-elastic metal
material company for biomedical use
► Continuity with SOLIDWORKS data and workflows
► Investments in hardware and IT infrastructure reduction
► Simulation solution scaling customers’ project needs
Simulation in the
3DEXPERIENCE® Works
portfolio on the Cloud
SOLIDWORKS customer
Adopts 3DEXPERIENCE Platform
and Expands with SIMULIA
Industrial Innovation Life Sciences Mainstream Innovation
ASIA
Time to innovation
Page 34
34
© D
assa
ult S
ystè
mes
| C
onfid
entia
l Inf
orm
atio
n |
2/3/
2021
| ref
.: 3D
S_D
ocum
ent_
2020
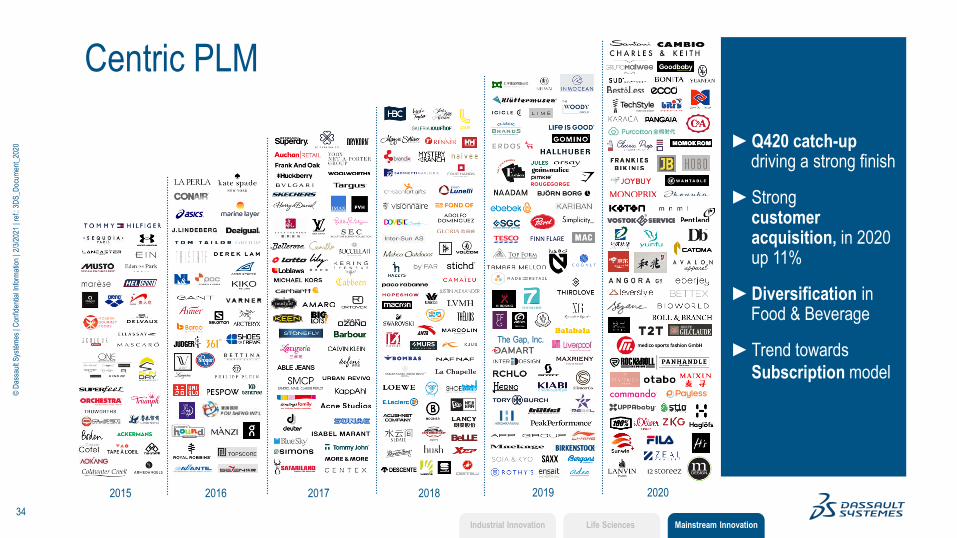
Centric PLM
20202016 20172015 2018 2019
The Gap, Inc.
►Q420 catch-up driving a strong finish
►Strong customer acquisition, in 2020 up 11%
►Diversification in Food & Beverage
►Trend towards
Subscription model
Industrial Innovation Life Sciences Mainstream Innovation
Page 35
35
© D
assa
ult S
ystè
mes
| C
onfid
entia
l Inf
orm
atio
n |
2/3/
2021
| ref
.: 3D
S_D
ocum
ent_
2020
Provider of ultra-realistic virtual world for automotive simulation
Dassault Systèmes entering into the capital (15%)
AUTOMATED DRIVING CERTIFICATION
January 2021
2019 FY Revenue: €21 million
Cloud-Native Distributed SQL Database Leader
CLOUD AND DATA SCIENCE STRATEGY
December 2020
2019 FY Revenue: $6 million
Specialist in AI-based semantic processing
COLLABORATIVE DATA SCIENCE EXPERIENCES
June 2020
2020 FY Revenue: €3 million
Acquisitions
Page 36
36
© D
assa
ult S
ystè
mes
| C
onfid
entia
l Inf
orm
atio
n |
2/3/
2021
| ref
.: 3D
S_D
ocum
ent_
2020
Operating Margin Evolution Non-IFRS
2020 YOY Evolution
0 bps*
40 bps*
-210
bps*
32.0% 30.2%
0 bps*
FY 19 Margin Currencies Core activities MEDIDATA
FY 2020
Other acquisitions FY 20 Margin
* bps: basis points
Page 37
37
© D
assa
ult S
ystè
mes
| C
onfid
entia
l Inf
orm
atio
n |
2/3/
2021
| ref
.: 3D
S_D
ocum
ent_
2020
EPS Non-IFRS
Q4 EPS 2 cents above the high-end of
guidance thanks to strong operational
performance and despite negative FX impact
(2 cents)
Q4 EPS guidance €1.15-1.20
EPS up 6% ex FX in Q4 and 5% ex FX in 2020
Diluted EPS
in EUR
3.65 3.77
1.20 1.22
YTD 19 YTD 20 4Q19 4Q20
+3%
+2%
Page 38
38
© D
assa
ult S
ystè
mes
| C
onfid
entia
l Inf
orm
atio
n |
2/3/
2021
| ref
.: 3D
S_D
ocum
ent_
2020
Change in Cash and Debt Position as of December 31, 2020IFRS
In € million
Net financial debt of €(2,041) million as of Dec 31, 2020Debt ratio**: Net Financial Debt + Lease
EBITDAO
€2.7 bn
€1.5 bn1.8 x
Cash & Cash equivalents: 2.1Bn, +204 M€ vs. Dec 2019 Net financial debt
** Debt ratio calculation details in appendix
Page 39
39
© D
assa
ult S
ystè
mes
| C
onfid
entia
l Inf
orm
atio
n |
2/3/
2021
| ref
.: 3D
S_D
ocum
ent_
2020
Q4 & FY 2020 Business & Strategy Highlights
Q4 & FY 2020 Financial Highlights
Q1 & FY 2021 Financial Objectives
Agenda
Financial Information Appendix
Page 40
40
© D
assa
ult S
ystè
mes
| C
onfid
entia
l Inf
orm
atio
n |
2/3/
2021
| ref
.: 3D
S_D
ocum
ent_
2020
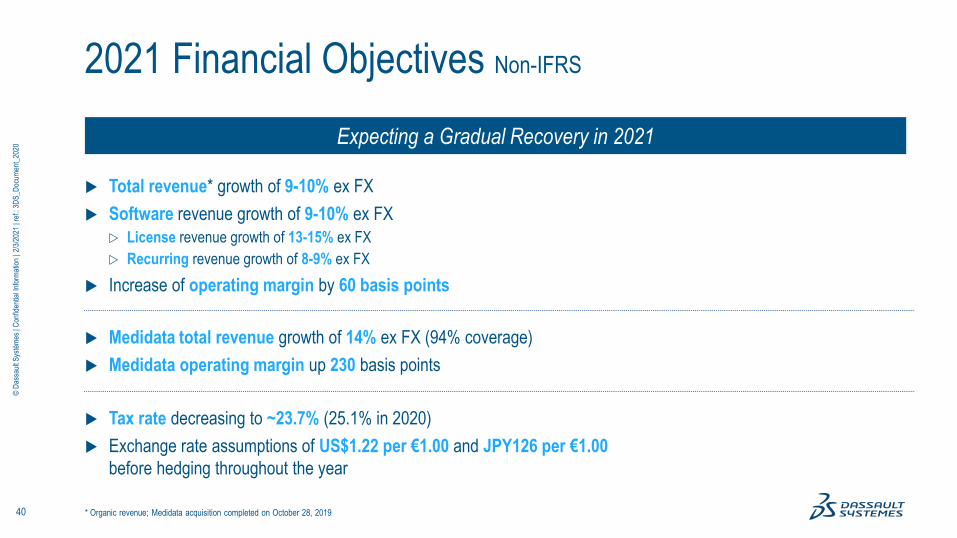
2021 Financial Objectives Non-IFRS
Expecting a Gradual Recovery in 2021
Total revenue* growth of 9-10% ex FX
Software revenue growth of 9-10% ex FX
License revenue growth of 13-15% ex FX
Recurring revenue growth of 8-9% ex FX
Increase of operating margin by 60 basis points
Medidata total revenue growth of 14% ex FX (94% coverage)
Medidata operating margin up 230 basis points
Tax rate decreasing to ~23.7% (25.1% in 2020)
Exchange rate assumptions of US$1.22 per €1.00 and JPY126 per €1.00
before hedging throughout the year
* Organic revenue; Medidata acquisition completed on October 28, 2019
Page 41
41
© D
assa
ult S
ystè
mes
| C
onfid
entia
l Inf
orm
atio
n |
2/3/
2021
| ref
.: 3D
S_D
ocum
ent_
2020
Proposed Objectives Non-IFRS
Q1 2021 FY 2021
1,145-1,170 Revenue (€M) 4,715-4,765
+0-2% Growth +6-7%
+6-8% Growth ex FX +9-10%
30.4-31.1% Operating Margin ~30.8%
+1.2 to 1.9 ptsOperating Margin
Growth+0.6 pts
0.98-1.03 EPS (€) 4.10-4.15
+3-8% EPS Growth +8-10%
1.22 €/$ rates 1.22
126.0 €/¥ rates 126.0
Tax rate of ~23.7%
Operating margin excluding Medidata:
+30 basis points ex FX
Ex FX
Software revenue +7-9%
of which licenses +0-5%
of which recurring +8-10%
Services revenue -2% to +2%
Ex FX
Software revenue +9-10%
of which licenses +13 -15%
of which recurring +8-9%
Services revenue +9-12%
Page 42
42
© D
assa
ult S
ystè
mes
| C
onfid
entia
l Inf
orm
atio
n |
2/3/
2021
| ref
.: 3D
S_D
ocum
ent_
2020
Q4 & FY 2020 Business & Strategy Highlights
Q4 & FY 2020 Financial Highlights
Q1 & FY 2021 Financial Objectives
Agenda
Financial Information Appendix
Page 43
43
© D
assa
ult S
ystè
mes
| C
onfid
entia
l Inf
orm
atio
n |
2/3/
2021
| ref
.: 3D
S_D
ocum
ent_
2020
IFRS
Software Revenue by Region
Americas
Europe
Asia
in MEUR 4Q20 4Q19 GrowthGrowth
ex FXYTD 20 YTD 19 Growth
Growth
ex FX
Americas 411 334 +23% +32% 1,527 1,109 +38% +41%
Europe 438 448 (2)% (0)% 1,483 1,470 +1% +2%
Asia 257 257 (0)% +3% 1,003 961 +4% +6%
Software revenue 1,105 1,038 +6% +11% 4,013 3,539 +13% +15%
4Q20 4Q19 YTD 20 YTD 19
38%
37%
25%31%
42%
27%37%
40%
23%32%
43%
25%
Page 44
44
© D
assa
ult S
ystè
mes
| C
onfid
entia
l Inf
orm
atio
n |
2/3/
2021
| ref
.: 3D
S_D
ocum
ent_
2020
Non - IFRS
Software Revenue by Region
Americas
Europe
Asia
in MEUR 4Q20 4Q19 GrowthGrowth
ex FXYTD 20 YTD 19 Growth
Growth
ex FX
Americas 411 360 +14% +23% 1,538 1,140 +35% +38%
Europe 438 448 (2)% (0)% 1,483 1,472 +1% +2%
Asia 257 258 (0)% +3% 1,003 962 +4% +5%
Software revenue 1,106 1,066 +4% +8% 4,024 3,574 +13% +14%
4Q20 4Q19 YTD 20 YTD 19
38%
37%
25%32%
41%
27%37%
40%
23%34%
42%
24%
Page 45
45
© D
assa
ult S
ystè
mes
| C
onfid
entia
l Inf
orm
atio
n |
2/3/
2021
| ref
.: 3D
S_D
ocum
ent_
2020
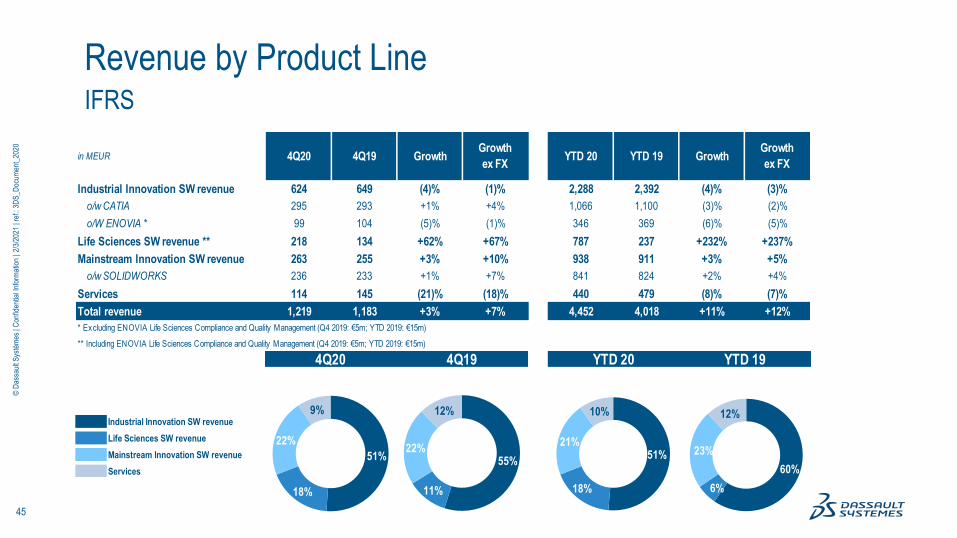
IFRS
Revenue by Product Line
Industrial Innovation SW revenue
Life Sciences SW revenue
Mainstream Innovation SW revenue
Services
in MEUR 4Q20 4Q19 GrowthGrowth
ex FXYTD 20 YTD 19 Growth
Growth
ex FX
Industrial Innovation SW revenue 624 649 (4)% (1)% 2,288 2,392 (4)% (3)%
o/w CATIA 295 293 +1% +4% 1,066 1,100 (3)% (2)%
o/W ENOVIA * 99 104 (5)% (1)% 346 369 (6)% (5)%
Life Sciences SW revenue ** 218 134 +62% +67% 787 237 +232% +237%
Mainstream Innovation SW revenue 263 255 +3% +10% 938 911 +3% +5%
o/w SOLIDWORKS 236 233 +1% +7% 841 824 +2% +4%
Services 114 145 (21)% (18)% 440 479 (8)% (7)%
Total revenue 1,219 1,183 +3% +7% 4,452 4,018 +11% +12%
* Excluding ENOVIA Life Sciences Compliance and Quality Management (Q4 2019: €5m; YTD 2019: €15m)
** Including ENOVIA Life Sciences Compliance and Quality Management (Q4 2019: €5m; YTD 2019: €15m)
4Q20 4Q19 YTD 20 YTD 19
51%
18%
21%
10%
60%
6%
23%
12%
51%
18%
22%
9%
55%
11%
22%
12%
Page 46
46
© D
assa
ult S
ystè
mes
| C
onfid
entia
l Inf
orm
atio
n |
2/3/
2021
| ref
.: 3D
S_D
ocum
ent_
2020
Non - IFRS
Revenue by Product Line
Industrial Innovation SW revenue
Life Sciences SW revenue
Mainstream Innovation SW revenue
Services
in MEUR 4Q20 4Q19 GrowthGrowth
ex FXYTD 20 YTD 19 Growth
Growth
ex FX
Industrial Innovation SW revenue 624 649 (4)% (1)% 2,288 2,392 (4)% (3)%
o/w CATIA 295 293 +1% +4% 1,067 1,100 (3)% (2)%
o/W ENOVIA * 99 104 (5)% (1)% 346 369 (6)% (5)%
Life Sciences SW revenue ** 218 161 +35% +39% 797 264 +202% +206%
Mainstream Innovation SW revenue 264 255 +3% +10% 938 918 +2% +4%
o/w SOLIDWORKS 236 233 +1% +7% 841 824 +2% +4%
Services 114 147 (22)% (19)% 441 482 (9)% (7)%
Total revenue 1,220 1,212 +1% +5% 4,465 4,056 +10% +12%
* Excluding ENOVIA Life Sciences Compliance and Quality Management (Q4 2019: €5m; YTD 2019: €15m)
** Including ENOVIA Life Sciences Compliance and Quality Management (Q4 2019: €5m; YTD 2019: €15m)
4Q20 4Q19 YTD 20 YTD 19
51%
18%
21%
10%
59%
7%
23%
12%
51%
18%
22%
9%
54%
13%
21%
12%
Page 47
47
© D
assa
ult S
ystè
mes
| C
onfid
entia
l Inf
orm
atio
n |
2/3/
2021
| ref
.: 3D
S_D
ocum
ent_
2020
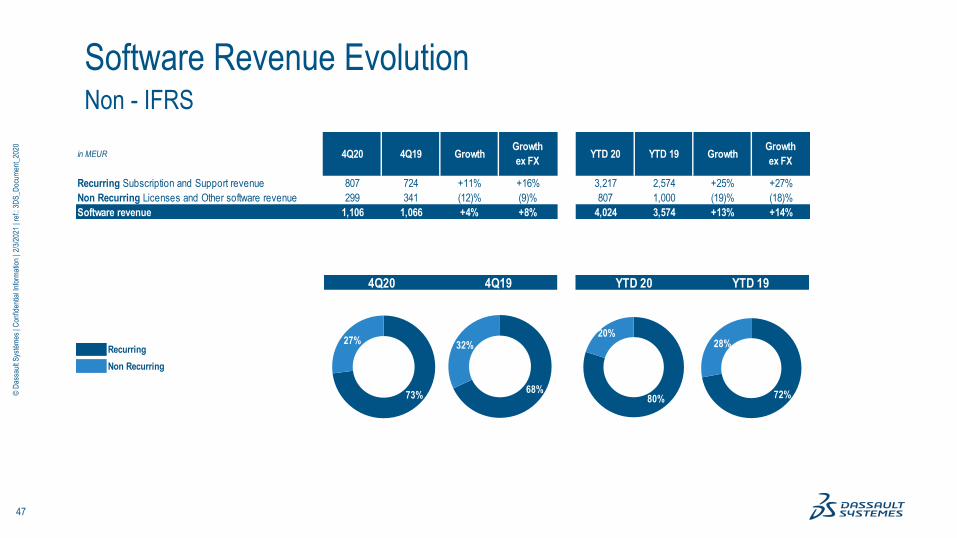
Non - IFRS
Software Revenue Evolution
Recurring
Non Recurring
in MEUR 4Q20 4Q19 GrowthGrowth
ex FXYTD 20 YTD 19 Growth
Growth
ex FX
Recurring Subscription and Support revenue 807 724 +11% +16% 3,217 2,574 +25% +27%
Non Recurring Licenses and Other software revenue 299 341 (12)% (9)% 807 1,000 (19)% (18)%
Software revenue 1,106 1,066 +4% +8% 4,024 3,574 +13% +14%
4Q20 4Q19 YTD 20 YTD 19
80%
20%
72%
28%
73%
27%
68%
32%
Page 48
48
© D
assa
ult S
ystè
mes
| C
onfid
entia
l Inf
orm
atio
n |
2/3/
2021
| ref
.: 3D
S_D
ocum
ent_
2020
IFRS P<hree months ended December 31, Twelve months ended December 31,
(In € million, except % and per share data) 2020 2019 YoY 2020 2019 YoY
Software revenue 1,105.3 1,038.2 +6% 4,012.6 3,539.4 +13%
Licenses and Other software revenue 298.9 341.5 (12)% 807.5 999.6 (19)%
Subscription and Support revenue 806.4 696.7 +16% 3,205.2 2,539.8 +26%
Services revenue 113.9 144.9 (21)% 439.6 478.8 (8)%
Total revenue 1,219.3 1,183.1 +3% 4,452.2 4,018.2 +11%
Cost of Software revenue (92.5) (64.2) +44% (341.5) (196.2) +74%
Cost of Services revenue (91.5) (129.8) (29)% (408.1) (437.4) (7)%
Research and development (231.7) (210.3) +10% (935.4) (737.9) +27%
Marketing and sales (314.9) (350.7) (10)% (1,256.3) (1,226.3) +2%
General and administrative (106.4) (107.9) (1)% (390.7) (329.5) +19%
Amortization of acquired intangible assets and of tangible assets revaluation (91.8) (91.9) (0)% (394.5) (244.0) +62%
Other operating income and expense, net (7.1) (5.7) +25% (56.0) (34.1) +64%
Total operating expenses (936.0) (960.5) (3)% (3,782.5) (3,205.4) +18%
Operating income 283.3 222.6 +27% 669.7 812.8 (18)%
Financial income (loss), net (4.4) (3.7) +20% (23.4) 3.1 N/A
Income tax expense (73.7) (38.8) +90% (160.8) (209.6) (23)%
Non-controlling interest (1.4) 2.8 (150)% 5.5 9.0 (39)%
Net Income (to equity holders of the parent) 203.7 182.9 +11% 491.0 615.3 (20)%
Diluted net income per share (EPS) 0.77 0.69 +11% 1.86 2.34 (20)%
Average diluted shares (Million) 264.4 263.7 264.2 263.2
Page 49
49
© D
assa
ult S
ystè
mes
| C
onfid
entia
l Inf
orm
atio
n |
2/3/
2021
| ref
.: 3D
S_D
ocum
ent_
2020
IFRS P&L (%)
* EBIT: Earnings Before Income Tax
Three months ended December 31, Twelve months ended December 31,
2020 2019 2020 2019
% of revenue % of revenue
Software revenue +90.7% +87.8% +90.1% +88.1%
Licenses and Other software revenue +24.5% +28.9% +18.1% +24.9%
Subscription and Support revenue +66.1% +58.9% +72.0% +63.2%
Services revenue +9.3% +12.2% +9.9% +11.9%
Total revenue +100.0% +100.0% +100.0% +100.0%
Cost of Software revenue +7.6% +5.4% +7.7% +4.9%
Cost of Services revenue +7.5% +11.0% +9.2% +10.9%
Research and development +19.0% +17.8% +21.0% +18.4%
Marketing and sales +25.8% +29.6% +28.2% +30.5%
General and administrative +8.7% +9.1% +8.8% +8.2%
Amortization of acquired intangible assets and of tangible assets revaluation +7.5% +7.8% +8.9% +6.1%
Other operating income and expense, net +0.6% +0.5% +1.3% +0.8%
Total operating expenses +76.8% +81.2% +85.0% +79.8%
Operating income +23.2% +18.8% +15.0% +20.2%
Financial income (loss), net (0.4)% (0.3)% (0.5)% +0.1%
Income tax rate (% of EBIT *) +26.4% +17.7% +24.9% +25.7%
Non-controlling interest (0.1)% +0.2% +0.1% +0.2%
Net Income (to equity holders of the parent) +16.7% +15.5% +11.0% +15.3%
Page 50
50
© D
assa
ult S
ystè
mes
| C
onfid
entia
l Inf
orm
atio
n |
2/3/
2021
| ref
.: 3D
S_D
ocum
ent_
2020
Non-IFRS P<hree months ended December 31, Twelve months ended December 31,
(In € million, except % and per share data) 2020 2019 YoY 2020 2019 YoY
Software revenue 1,105.7 1,065.6 +4% 4,024.0 3,573.6 +13%
Licenses and Other software revenue 298.9 341.5 (12)% 807.5 999.6 (19)%
Subscription and Support revenue 806.7 724.2 +11% 3,216.5 2,574.0 +25%
Services revenue 114.0 146.6 (22)% 440.8 482.0 (9)%
Total revenue 1,219.6 1,212.3 +1% 4,464.8 4,055.6 +10%
Cost of Software revenue (90.6) (63.4) +43% (334.7) (192.9) +74%
Cost of Services revenue (89.7) (126.3) (29)% (401.1) (431.4) (7)%
Research and development (212.4) (188.6) +13% (858.4) (668.2) +28%
Marketing and sales (299.2) (333.8) (10)% (1,193.6) (1,176.3) +1%
General and administrative (89.2) (92.4) (3)% (327.2) (289.6) +13%
Total operating expenses (781.1) (804.5) (3)% (3,115.0) (2,758.3) +13%
Operating income 438.5 407.8 +8% 1,349.8 1,297.4 +4%
Financial income (loss), net (4.1) (3.2) +26% (22.3) 3.2 N/A
Income tax expense (108.4) (89.3) +21% (332.8) (344.0) (3)%
Non-controlling interest (3.0) 1.4 N/S 0.0 3.0 (100)%
Net Income (to equity holders of the parent) 323.0 316.6 +2% 994.7 959.6 +4%
Diluted net income per share (EPS) 1.22 1.20 +2% 3.77 3.65 +3%
Average diluted shares (Million) 264.4 263.7 264.2 263.2
Page 51
51
© D
assa
ult S
ystè
mes
| C
onfid
entia
l Inf
orm
atio
n |
2/3/
2021
| ref
.: 3D
S_D
ocum
ent_
2020
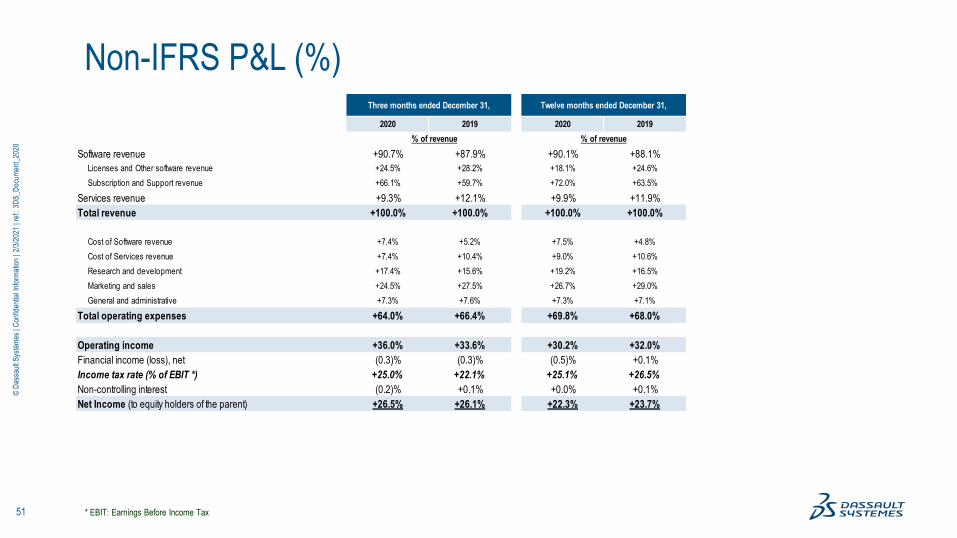
Non-IFRS P&L (%)
* EBIT: Earnings Before Income Tax
Three months ended December 31, Twelve months ended December 31,
2020 2019 2020 2019
% of revenue % of revenue
Software revenue +90.7% +87.9% +90.1% +88.1%
Licenses and Other software revenue +24.5% +28.2% +18.1% +24.6%
Subscription and Support revenue +66.1% +59.7% +72.0% +63.5%
Services revenue +9.3% +12.1% +9.9% +11.9%
Total revenue +100.0% +100.0% +100.0% +100.0%
Cost of Software revenue +7.4% +5.2% +7.5% +4.8%
Cost of Services revenue +7.4% +10.4% +9.0% +10.6%
Research and development +17.4% +15.6% +19.2% +16.5%
Marketing and sales +24.5% +27.5% +26.7% +29.0%
General and administrative +7.3% +7.6% +7.3% +7.1%
Total operating expenses +64.0% +66.4% +69.8% +68.0%
Operating income +36.0% +33.6% +30.2% +32.0%
Financial income (loss), net (0.3)% (0.3)% (0.5)% +0.1%
Income tax rate (% of EBIT *) +25.0% +22.1% +25.1% +26.5%
Non-controlling interest (0.2)% +0.1% +0.0% +0.1%
Net Income (to equity holders of the parent) +26.5% +26.1% +22.3% +23.7%
Page 52
52
© D
assa
ult S
ystè
mes
| C
onfid
entia
l Inf
orm
atio
n |
2/3/
2021
| ref
.: 3D
S_D
ocum
ent_
2020
Revenue and Gross Margin
IFRS – Non-IFRS Reconciliation QTD
(In € million, except %)2020
IFRSAdjustment
2020
Non-IFRS
2019
IFRSAdjustment
2019
Non-IFRSIFRS Non-IFRS
Total Revenue 1,219.3 0.4 1,219.6 1,183.1 29.2 1,212.3 +3% +1%
Total Revenue breakdown by activity
Software revenue 1,105.3 0.3 1,105.7 1,038.2 27.4 1,065.6 +6% +4%
Licenses and Other software revenue 298.9 298.9 341.5 341.5 (12)% (12)%
Subscription and Support revenue 806.4 0.3 806.7 696.7 27.4 724.2 +16% +11%
Recurring portion of Software revenue 73% 73% 67% 68%
Services revenue 113.9 0.0 114.0 144.9 1.7 146.6 (21)% (22)%
Total Revenue breakdown by product line
Industrial Innovation SW revenue 623.8 0.0 623.8 648.9 648.9 (4)% (4)%
o/w CATIA SW revenue 294.8 0.0 294.8 292.6 292.6 +1% +1%
o/w ENOVIA SW revenue (1)
99.3 99.3 104.1 104.1 (5)% (5)%
Life Sciences SW revenue (2) 218.1 0.2 218.4 134.4 26.9 161.3 +62% +35%
Mainstream Innovation SW revenue 263.4 0.1 263.5 254.9 0.6 255.5 +3% +3%
o/w SOLIDWORKS SW revenue 235.9 235.9 233.2 233.2 +1% +1%
Services revenue 113.9 0.0 114.0 144.9 1.7 146.6 (21)% (22)%
Total Revenue breakdown by geography
Americas revenue 438.0 0.3 438.3 389.3 27.6 416.9 +12% +5%
Europe revenue 495.8 0.1 495.8 508.8 0.7 509.5 (3)% (3)%
Asia revenue 285.5 0.0 285.5 284.9 0.9 285.9 +0% (0)%
Gross Margin
Cost of Software revenue (92.5) 1.8 (90.6) (64.2) 0.9 (63.4) +44% +43%
Software Gross margin (3) 91.6% 91.8% 93.8% 94.1%
Cost of Services revenue (91.5) 1.8 (89.7) (129.8) 3.4 (126.3) (29)% (29)%
Services Gross margin 19.7% 21.3% 10.4% 13.9%
(1) Excluding ENOVIA Life Sciences Compliance and Quality Management (Q4 2019: €5.4m)
(2) Including ENOVIA Life Sciences Compliance and Quality Management (Q4 2019: €5.4m)
(3) No amortization of acquired intangible assets and of tangible assets revaluation is included in Software Gross margin calculation
Three months ended December 31, Increase (Decrease)
Page 53
53
© D
assa
ult S
ystè
mes
| C
onfid
entia
l Inf
orm
atio
n |
2/3/
2021
| ref
.: 3D
S_D
ocum
ent_
2020
Expenses & Earnings
IFRS – Non-IFRS Reconciliation QTD
(In € million, except % and per share data)2020
IFRSAdjustment
2020
Non-IFRS
2019
IFRSAdjustment
2019
Non-IFRSIFRS Non-IFRS
Total Operating Expenses (936.0) 154.9 (781.1) (960.5) 156.0 (804.5) (3)% (3)%
Share-based compensation expense and related social charges (55.2) 55.2 (58.0) 58.0
Amortization of acquired intangible assets and of tangible assets revaluation (91.8) 91.8 (91.9) 91.9
Lease incentives of acquired companies (0.7) 0.7 (0.5) 0.5
Other operating income and expense, net (7.1) 7.1 (5.7) 5.7
Operating Income 283.3 155.2 438.5 222.6 185.2 407.8 +27% +8%
Operating Margin 23.2% 36.0% 18.8% 33.6%
Financial income (loss), net (4.4) 0.4 (4.1) (3.7) 0.4 (3.2) +20% +26%
Income tax expense (73.7) (34.7) (108.4) (38.8) (50.5) (89.3) +90% +21%
Non-controlling interest (1.4) (1.6) (3.0) 2.8 (1.5) 1.4 (150)% (320)%
Net Income attributable to shareholders 203.7 119.3 323.0 182.9 133.7 316.6 +11% +2%
Diluted net income per share, in EUR 0.77 0.45 1.22 0.69 0.51 1.20 +11% +2%
(In € million)2020
IFRS
Share-based
compensation
expense and
related social
charges
Lease incentives
of acquired
companies
2020
Non-IFRS
2019
IFRS
Share-based
compensation
expense and
related social
charges
Lease incentives
of acquired
companies
2019
Non-IFRS
Cost of revenue (184.0) 3.5 0.2 (180.3) (194.0) 4.1 0.2 (189.7)
Research and development (231.7) 19.0 0.3 (212.4) (210.3) 21.4 0.3 (188.6)
Marketing and sales (314.9) 15.6 0.1 (299.2) (350.7) 16.9 0.1 (333.8)
General and administrative (106.4) 17.1 0.1 (89.2) (107.9) 15.5 - (92.4)
Total 55.2 0.7 58.0 0.5
Three months ended December 31,
Three months ended December 31, Increase (Decrease)
Page 54
54
© D
assa
ult S
ystè
mes
| C
onfid
entia
l Inf
orm
atio
n |
2/3/
2021
| ref
.: 3D
S_D
ocum
ent_
2020
Revenue and Gross Margin
IFRS – Non-IFRS Reconciliation YTD
(In € million, except %)2020
IFRSAdjustment
2020
Non-IFRS
2019
IFRSAdjustment
2019
Non-IFRSIFRS Non-IFRS
Total Revenue 4,452.2 12.6 4,464.8 4,018.2 37.4 4,055.6 +11% +10%
Total Revenue breakdown by activity
Software revenue 4,012.6 11.4 4,024.0 3,539.4 34.2 3,573.6 +13% +13%
Licenses and Other software revenue 807.5 807.5 999.6 999.6 (19)% (19)%
Subscription and Support revenue 3,205.2 11.4 3,216.5 2,539.8 34.2 2,574.0 +26% +25%
Recurring portion of Software revenue 80% 80% 72% 72%
Services revenue 439.6 1.2 440.8 478.8 3.2 482.0 (8)% (9)%
Total Revenue breakdown by product line
Industrial Innovation SW revenue 2,287.6 0.8 2,288.5 2,391.6 2,391.6 (4)% (4)%
o/w CATIA SW revenue 1,065.8 0.8 1,066.6 1,100.2 1,100.2 (3)% (3)%
o/w ENOVIA SW revenue (1)
345.7 345.7 368.7 368.7 (6)% (6)%
Life Sciences SW revenue (2) 787.3 9.9 797.3 236.9 27.3 264.2 +232% +202%
Mainstream Innovation SW revenue 937.6 0.6 938.3 910.9 6.9 917.8 +3% +2%
o/w SOLIDWORKS SW revenue 841.4 841.4 823.5 823.5 +2% +2%
Services revenue 439.6 1.2 440.8 478.8 3.2 482.0 (8)% (9)%
Total Revenue breakdown by geography
Americas revenue 1,688.6 11.8 1,700.4 1,298.6 34.0 1,332.7 +30% +28%
Europe revenue 1,675.2 0.4 1,675.6 1,671.8 2.5 1,674.3 +0% +0%
Asia revenue 1,088.4 0.4 1,088.8 1,047.7 0.9 1,048.6 +4% +4%
Gross Margin
Cost of Software revenue (341.5) 6.9 (334.7) (196.2) 3.3 (192.9) +74% +74%
Software Gross margin (3) 91.5% 91.7% 94.5% 94.6%
Cost of Services revenue (408.1) 7.0 (401.1) (437.4) 6.0 (431.4) (7)% (7)%
Services Gross margin 7.2% 9.0% 8.6% 10.5%
(1) Excluding ENOVIA Life Sciences Compliance and Quality Management (YTD 2019: €15.0m)
(2) Including ENOVIA Life Sciences Compliance and Quality Management (YTD 2019: €15.0m)
(3) No amortization of acquired intangible assets and of tangible assets revaluation is included in Software Gross margin calculation
Twelve months ended December 31, Increase (Decrease)
Page 55
55
© D
assa
ult S
ystè
mes
| C
onfid
entia
l Inf
orm
atio
n |
2/3/
2021
| ref
.: 3D
S_D
ocum
ent_
2020
Expenses & Earnings
IFRS – Non-IFRS Reconciliation YTD
(In € million, except % and per share data)2020
IFRSAdjustment
2020
Non-IFRS
2019
IFRSAdjustment
2019
Non-IFRSIFRS Non-IFRS
Total Operating Expenses (3,782.5) 667.5 (3,115.0) (3,205.4) 447.1 (2,758.3) +18% +13%
Share-based compensation expense and related social charges (214.1) 214.1 (168.5) 168.5
Amortization of acquired intangible assets and of tangible assets revaluation (394.5) 394.5 (244.0) 244.0
Lease incentives of acquired companies (2.9) 2.9 (0.5) 0.5
Other operating income and expense, net (56.0) 56.0 (34.1) 34.1
Operating Income 669.7 680.1 1,349.8 812.8 484.5 1,297.4 (18)% +4%
Operating Margin 15.0% 30.2% 20.2% 32.0%
Financial income (loss), net (23.4) 1.1 (22.3) 3.1 0.1 3.2 N/A N/A
Income tax expense (160.8) (172.0) (332.8) (209.6) (134.4) (344.0) (23)% (3)%
Non-controlling interest 5.5 (5.5) 0.0 9.0 (5.9) 3.0 (39)% (100)%
Net Income attributable to shareholders 491.0 503.7 994.7 615.3 344.3 959.6 (20)% +4%
Diluted net income per share, in EUR 1.86 1.91 3.77 2.34 1.31 3.65 (20)% +3%
(In € million)2020
IFRS
Share-based
compensation
expense and
related social
charges
Lease incentives
of acquired
companies
2020
Non-IFRS
2019
IFRS
Share-based
compensation
expense and
related social
charges
Lease incentives
of acquired
companies
2019
Non-IFRS
Cost of revenue (749.7) 13.1 0.8 (735.8) (633.6) 9.1 0.2 (624.2)
Research and development (935.4) 75.7 1.3 (858.4) (737.9) 69.5 0.3 (668.2)
Marketing and sales (1,256.3) 62.3 0.4 (1,193.6) (1,226.3) 49.9 0.1 (1,176.3)
General and administrative (390.7) 63.1 0.4 (327.2) (329.5) 39.9 - (289.6)
Total 214.1 2.9 168.5 0.5
Twelve months ended December 31,
Twelve months ended December 31, Increase (Decrease)
Page 56
56
© D
assa
ult S
ystè
mes
| C
onfid
entia
l Inf
orm
atio
n |
2/3/
2021
| ref
.: 3D
S_D
ocum
ent_
2020
Non - IFRS
Financial income (loss), net
(In € million) 2020 2019 YoY 2020 2019 YoY
Interest Income 2.3 5.8 (3.4) 14.3 33.7 (19.4)
Interest Expense (5.1) (5.4) 0.3 (21.1) (14.9) (6.1)
Interest Expense on cap lease (IFRS 16) (3.1) (4.2) 1.1 (15.1) (14.3) (0.8)
Financial net Income (loss) (5.9) (3.8) (2.1) (21.9) 4.4 (26.3)
Exchange Gain / (Loss) 1.8 0.6 1.2 (0.8) (1.3) 0.4
Other Income / (Loss) 0.0 (0.0) 0.1 0.4 0.0 0.4
Total (4.1) (3.2) (0.8) (22.3) 3.2 (25.5)
Three months ended December 31, Twelve months ended December 31,
Page 57
57
© D
assa
ult S
ystè
mes
| C
onfid
entia
l Inf
orm
atio
n |
2/3/
2021
| ref
.: 3D
S_D
ocum
ent_
2020
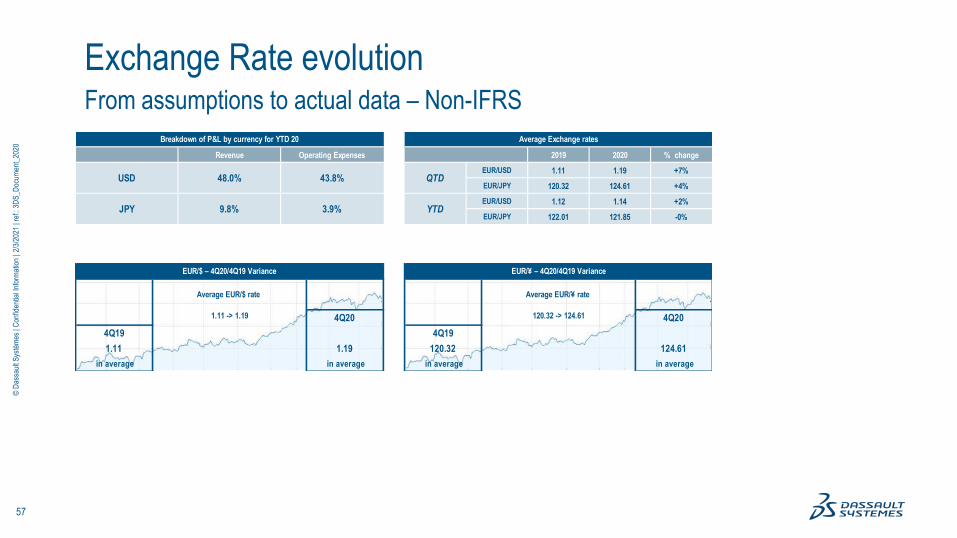
From assumptions to actual data – Non-IFRS
Exchange Rate evolution
Revenue Operating Expenses 2019 2020 % change
EUR/USD 1.11 1.19 +7%
EUR/JPY 120.32 124.61 +4%
EUR/USD 1.12 1.14 +2%
EUR/JPY 122.01 121.85 -0%JPY
48.0% 43.8%
Breakdown of P&L by currency for YTD 20
3.9% YTD
USD
9.8%
QTD
Average Exchange rates
4Q20 4Q20
4Q19 4Q19
1.11 1.19 120.32 124.61
in average in average in average in average
EUR/$ – 4Q20/4Q19 Variance EUR/¥ – 4Q20/4Q19 Variance
1.11 -> 1.19 120.32 -> 124.61
Average EUR/$ rate Average EUR/¥ rate
Page 58
58
© D
assa
ult S
ystè
mes
| C
onfid
entia
l Inf
orm
atio
n |
2/3/
2021
| ref
.: 3D
S_D
ocum
ent_
2020
Non - IFRS
Comparing 4Q20 with mid-range Objectives
In € million, except % RevenueOperating
Expenses
Operating
Profit
Operating
Margin
4Q20 Guidances mid-range 1,207.5 (786.1) 421.4 34.9%
Growth YoY -0.4% -2.3% +3.3% +1.3pt
USD impact (8.7) 3.6 (5.1) -0.2pt
JPY impact including hedging (0.4) (0.1) (0.5) -0.0pt
Other currencies and other hedging
impact(3.8) 2.8 (1.0) +0.0pt
Total FX (12.9) 6.3 (6.6) -0.2pt
Activity / Cost Control / Other 25.0 (1.3) 23.7 +1.3pt
Delta: Reported vs guidances 12.1 5.0 17.1 +1.1pt
4Q20 Reported 1,219.6 (781.1) 438.5 36.0%
Growth YoY +0.6% -2.9% +7.5% +2.3pts
4Q19 Reported 1,212.3 (804.5) 407.8 33.6%
Page 59
59
© D
assa
ult S
ystè
mes
| C
onfid
entia
l Inf
orm
atio
n |
2/3/
2021
| ref
.: 3D
S_D
ocum
ent_
2020
Non - IFRS
Estimated FX impact on 4Q20 Op. Results
€ millions, except %
QTD
Total
Revenue
Operating
Expenses
Operating
Income
Operating
Margin
4Q20 Reported 1,219.6 (781.1) 438.5 36.0%
4Q19 Reported 1,212.3 (804.5) 407.8 33.6%
Growth as reported +0.6% -2.9% +7.5% +2.3 pts
Impact of Actual Currency Rates
USD impact (34.8) 19.8 (15.0)
JPY impact including hedging (1.9) 1.0 (0.9)
Other currencies and other hedging impact (9.7) 7.7 (2.0)
Total FX Impact adjustment (46.4) 28.5 (17.9)
4Q19 ex FX 1,165.9 (776.0) 389.9 33.4%
Growth exFX +5% +1% +12% +2.5 pts
Page 60
60
© D
assa
ult S
ystè
mes
| C
onfid
entia
l Inf
orm
atio
n |
2/3/
2021
| ref
.: 3D
S_D
ocum
ent_
2020
Non - IFRS
Estimated FX impact on FY Op. Results
€ millions, except %
FY
Total
Revenue
Operating
Expenses
Operating
Income
Operating
Margin
FY2020 Reported 4,464.8 (3,115.0) 1,349.8 30.2%
FY2019 Reported 4,055.6 (2,758.3) 1,297.4 32.0%
Growth as reported +10.1% +12.9% +4.0% -1.8 pt
Impact of Actual Currency Rates
USD impact (40.5) 20.7 (19.8)
JPY impact including hedging 5.1 (0.2) 4.9
Other currencies and other hedging impact (22.4) 17.8 (4.6)
Total FX Impact adjustment (57.8) 38.3 (19.5)
FY2019 ex FX 3,997.9 (2,720.0) 1,277.9 32.0%
Growth exFX +12% +15% +6% -1.7 pt
Page 61
61
© D
assa
ult S
ystè
mes
| C
onfid
entia
l Inf
orm
atio
n |
2/3/
2021
| ref
.: 3D
S_D
ocum
ent_
2020
Adjusted Net Debt / EBITDAO
€ millions FY 20 FY 19 Changes
Reported Financial Net Debt 2,041 2,656 (615)
Operating leases liabilities (IFRS 16) 643 696 (53)
Adjusted Net Debt 2,685 3,351 (666)
Operating income (IFRS) 670 813 (143)
Amortization and impairment on intangible assets 415 254 161
Amort.and depr. of tangible assets and right of use (IFRS16) 190 142 48
Reported EBITDA 1,274 1,209 65
Share-based payments, excluding related social charges 178 116 62
EBITDAO 1,453 1,325 128
Adjusted Net Debt / EBITDAO 1.8 X 2.5 X (0.7)
Page 62
62
© D
assa
ult S
ystè
mes
| C
onfid
entia
l Inf
orm
atio
n |
2/3/
2021
| ref
.: 3D
S_D
ocum
ent_
2020
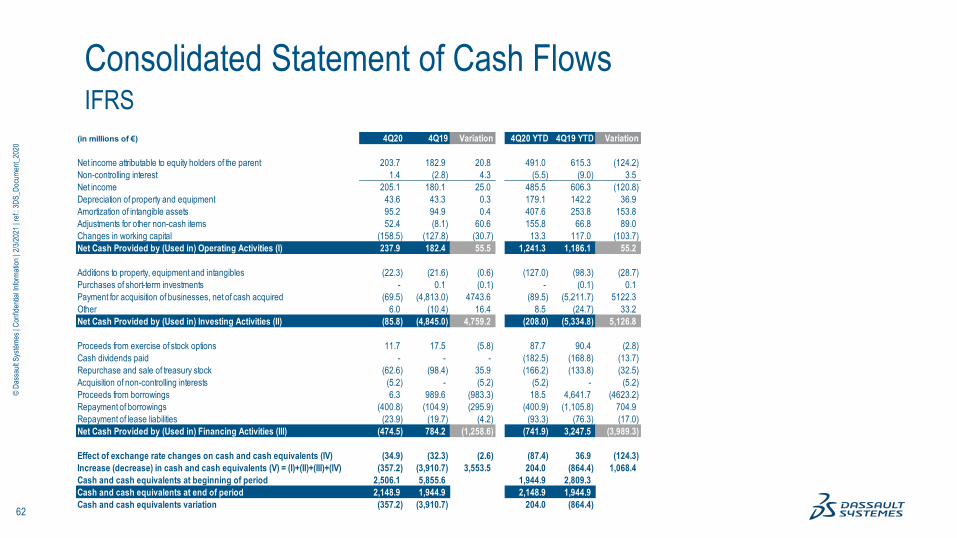
Consolidated Statement of Cash FlowsIFRS
(in millions of €) 4Q20 4Q19 Variation 4Q20 YTD 4Q19 YTD Variation
Net income attributable to equity holders of the parent 203.7 182.9 20.8 491.0 615.3 (124.2)
Non-controlling interest 1.4 (2.8) 4.3 (5.5) (9.0) 3.5
Net income 205.1 180.1 25.0 485.5 606.3 (120.8)
Depreciation of property and equipment 43.6 43.3 0.3 179.1 142.2 36.9
Amortization of intangible assets 95.2 94.9 0.4 407.6 253.8 153.8
Adjustments for other non-cash items 52.4 (8.1) 60.6 155.8 66.8 89.0
Changes in working capital (158.5) (127.8) (30.7) 13.3 117.0 (103.7)
Net Cash Provided by (Used in) Operating Activities (I) 237.9 182.4 55.5 1,241.3 1,186.1 55.2
Additions to property, equipment and intangibles (22.3) (21.6) (0.6) (127.0) (98.3) (28.7)
Purchases of short-term investments - 0.1 (0.1) - (0.1) 0.1
Payment for acquisition of businesses, net of cash acquired (69.5) (4,813.0) 4743.6 (89.5) (5,211.7) 5122.3
Other 6.0 (10.4) 16.4 8.5 (24.7) 33.2
Net Cash Provided by (Used in) Investing Activities (II) (85.8) (4,845.0) 4,759.2 (208.0) (5,334.8) 5,126.8
Proceeds from exercise of stock options 11.7 17.5 (5.8) 87.7 90.4 (2.8)
Cash dividends paid - - - (182.5) (168.8) (13.7)
Repurchase and sale of treasury stock (62.6) (98.4) 35.9 (166.2) (133.8) (32.5)
Acquisition of non-controlling interests (5.2) - (5.2) (5.2) - (5.2)
Proceeds from borrowings 6.3 989.6 (983.3) 18.5 4,641.7 (4623.2)
Repayment of borrowings (400.8) (104.9) (295.9) (400.9) (1,105.8) 704.9
Repayment of lease liabilities (23.9) (19.7) (4.2) (93.3) (76.3) (17.0)
Net Cash Provided by (Used in) Financing Activities (III) (474.5) 784.2 (1,258.6) (741.9) 3,247.5 (3,989.3)
Effect of exchange rate changes on cash and cash equivalents (IV) (34.9) (32.3) (2.6) (87.4) 36.9 (124.3)
Increase (decrease) in cash and cash equivalents (V) = (I)+(II)+(III)+(IV) (357.2) (3,910.7) 3,553.5 204.0 (864.4) 1,068.4
Cash and cash equivalents at beginning of period 2,506.1 5,855.6 1,944.9 2,809.3
Cash and cash equivalents at end of period 2,148.9 1,944.9 2,148.9 1,944.9
Cash and cash equivalents variation (357.2) (3,910.7) 204.0 (864.4)
Page 63
63
© D
assa
ult S
ystè
mes
| C
onfid
entia
l Inf
orm
atio
n |
2/3/
2021
| ref
.: 3D
S_D
ocum
ent_
2020
Balance SheetIFRS
End of End of Variation
(in millions of €) Dec-20 Dec-19 Dec-20 / Dec-19
Cash and cash equivalents 2 148,9 1 944,9 +204,0
Trade accounts receivable, net 1 229,1 1 319,2 -90,1
Contract assets 27,0 26,9 +0,1
Other current assets 355,4 378,0 -22,6
Total current assets 3 760,3 3 669,0 +91,3
Property and equipment, net 861,1 899,7 -38,6
Goodwill and Intangible assets, net 7 937,2 8 917,0 -979,8
Other non-current assets 405,6 386,9 +18,6
Total non-current assets 9 203,9 10 203,7 -999,8
Total Assets 12 964,2 13 872,6 -908,4
Trade accounts payable 171,7 220,0 -48,3
Contract liabilities 1 169,1 1 093,5 +75,7
Borrowings, current 16,0 4,4 +11,6
Other current liabilities 730,1 816,0 -85,9
Total current liabilities 2 086,9 2 133,8 -46,9
Borrowings, non-current 4 174,3 4 596,8 -422,5
Other non-current liabilities 1 596,9 1 879,4 -282,5
Total non-current liabilities 5 771,2 6 476,2 -705,0
Non-controlling interest 44,8 53,9 -9,1
Parent Shareholders' equity 5 061,3 5 208,7 -147,4
Total Liabilities and Equity 12 964,2 13 872,6 -908,4
Page 64
64
© D
assa
ult S
ystè
mes
| C
onfid
entia
l Inf
orm
atio
n |
2/3/
2021
| ref
.: 3D
S_D
ocum
ent_
2020
Operating Cash Flow Evolution – YTD 20IFRS
* Previously named unearned revenue
€ million YTD 20 YTD 19 Changes
Operating Cash Flow +1,241 +1,186 +55 Up +5% year over year
Net income adjusted for non cash items +1,227 +1,069 +158 Mainly driven by MEDIDATA
Decrease (increase) in trade accounts receivable
and contract assets+16 -42 +58
Balance down 1% exFX at constant perimeter
DSO down 5 days excluding MEDIDATA (down 4 days)
Increase in contract liability * +142 +109 +33 Balance up 14%, in line with the activity
(Decrease) increase in accrued compensation -25 +8 -33 Timing effects
(Decrease) increase in accounts payable -36 +26 -62 Lower purchases
(Decrease) increase in income taxes payable -114 +53 -167Lower profit before tax and effective tax rate and last
payment for a known tax litigation
Other +31 -37 +68Mainly due to early retirement plan in France in 2020
In 2019, mainly due to payment of fees related to issuance
of bonds and term loans
Page 65
65
© D
assa
ult S
ystè
mes
| C
onfid
entia
l Inf
orm
atio
n |
2/3/
2021
| ref
.: 3D
S_D
ocum
ent_
2020
Trade Accounts Receivables - DSOIFRS
DSO
in days
10291
84 8193
4Q19 1Q20 2Q20 3Q20 4Q20
Page 66
66
© D
assa
ult S
ystè
mes
| C
onfid
entia
l Inf
orm
atio
n |
2/3/
2021
| ref
.: 3D
S_D
ocum
ent_
2020
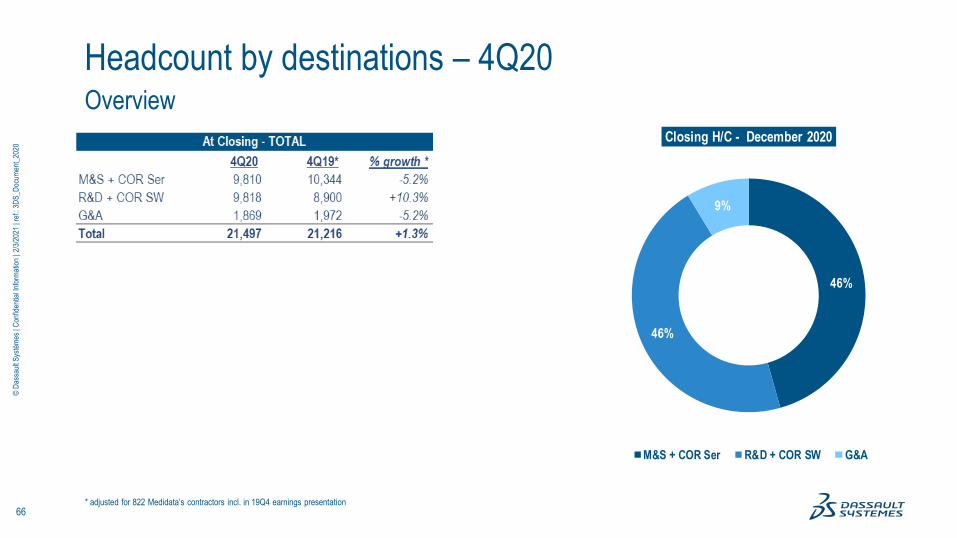
Overview
Headcount by destinations – 4Q20
46%
46%
9%
Closing H/C - December 2020
M&S + COR Ser R&D + COR SW G&A
* adjusted for 822 Medidata’s contractors incl. in 19Q4 earnings presentation
Page 67
67
© D
assa
ult S
ystè
mes
| C
onfid
entia
l Inf
orm
atio
n |
2/3/
2021
| ref
.: 3D
S_D
ocum
ent_
2020
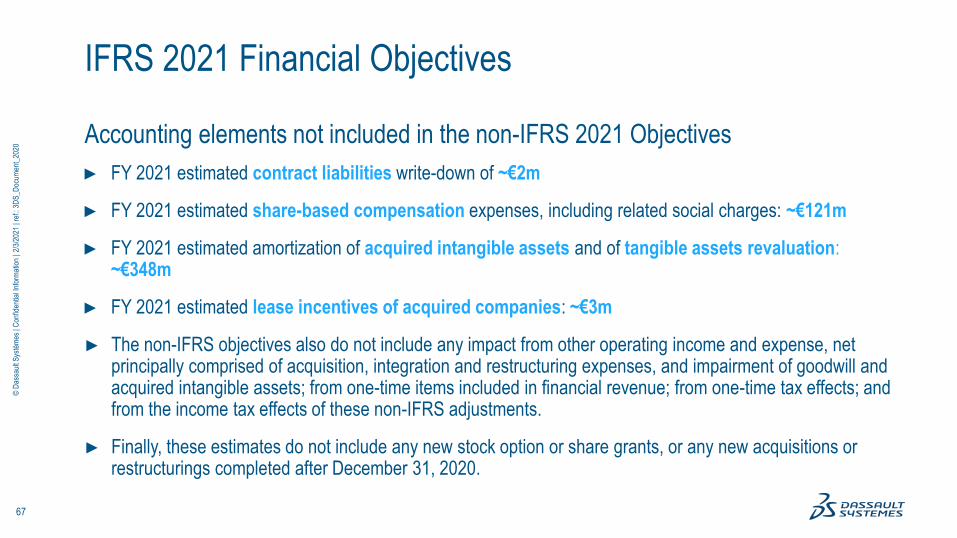
Accounting elements not included in the non-IFRS 2021 Objectives
► FY 2021 estimated contract liabilities write-down of ~€2m
► FY 2021 estimated share-based compensation expenses, including related social charges: ~€121m
► FY 2021 estimated amortization of acquired intangible assets and of tangible assets revaluation: ~€348m
► FY 2021 estimated lease incentives of acquired companies: ~€3m
► The non-IFRS objectives also do not include any impact from other operating income and expense, net principally comprised of acquisition, integration and restructuring expenses, and impairment of goodwill and acquired intangible assets; from one-time items included in financial revenue; from one-time tax effects; and from the income tax effects of these non-IFRS adjustments.
► Finally, these estimates do not include any new stock option or share grants, or any new acquisitions or restructurings completed after December 31, 2020.
IFRS 2021 Financial Objectives
Page 68
68
© D
assa
ult S
ystè
mes
| C
onfid
entia
l Inf
orm
atio
n |
2/3/
2021
| ref
.: 3D
S_D
ocum
ent_
2020