All statements included or incorporated by reference in this presentation other than characterizations of historical fact are forward-looking statementswithin the meaning of the federal securities laws including the Private Securities Litigation Reform Act of 1995 Examples of forward-looking statementsinclude but are not necessarily limited to statements relating to our ability to acquire sell lease or finance aircraft raise capital pay dividends and increaserevenues earnings EBITDA Adjusted EBITDA Adjusted Net Income Cash Return on Equity and Net Cash Interest Margin and the global aviation industry andaircraft leasing sector Words such as ldquoanticipatesrdquo ldquoexpectsrdquo ldquointendsrdquo ldquoplansrdquo ldquoprojectsrdquo ldquobelievesrdquo ldquomayrdquo ldquowillrdquo ldquowouldrdquo ldquocouldrdquo ldquoshouldrdquo ldquoseeksrdquoldquoestimatesrdquo and variations on these words and similar expressions are intended to identify such forward-looking statements These statements are based onour historical performance and that of our subsidiaries and on our current plans estimates and expectations and are subject to a number of factors thatcould lead to actual results materially different from those described in the forward-looking statements Aircastle can give no assurance that its expectationswill be attained Accordingly you should not place undue reliance on any such forward-looking statements which are subject to certain risks anduncertainties that could cause actual results to differ materially from those anticipated as of the date of this presentation These risks or uncertaintiesinclude but are not limited to those described from time to time in Aircastlersquos filings with the SEC and previously disclosed under ldquoRisk Factorsrdquo in Item 1A ofAircastlersquos 2018 Annual Report on Form 10-K In addition new risks and uncertainties emerge from time to time and it is not possible for Aircastle to predictor assess the impact of every factor that may cause its actual results to differ from those contained in any forward-looking statements Such forward-lookingstatements speak only as of the date of this presentation Aircastle expressly disclaims any obligation to revise or update publicly any forward-lookingstatement to reflect future events or circumstances
The information contained herein is the property of Aircastle and shall not be disclosed copied distributed or transmitted or used for any purpose withoutthe express written consent of Aircastle
3FIRST QUARTER 2019 EARNINGS CALLbull 05022019
Acquired fourteen aircraft during the first quarter for $445 million Committed to acquire twelve additional aircraft in 2019 for $385 million
2019 acquisitions are all modern in-demand narrow-body aircraft
Sold four aircraft and reclassified two others as direct financing and sales-type leases for gains of $120 million
Repurchased $87 million of our common shares to date at an average price of $1757 per shareAverage Q119 share price of $1991 was 133 higher
Declared our 52nd consecutive quarterly dividend
Committed leases for Ten A320 aircraft repossessed from Avianca Brazil transitioning to LATAM Airlines Group SA and
Seven 737 family aircraft previously leased with Jet Airways
Q119 Highlights
4FIRST QUARTER 2019 EARNINGS CALLbull 05022019
Key Financial Metrics ndash Q119
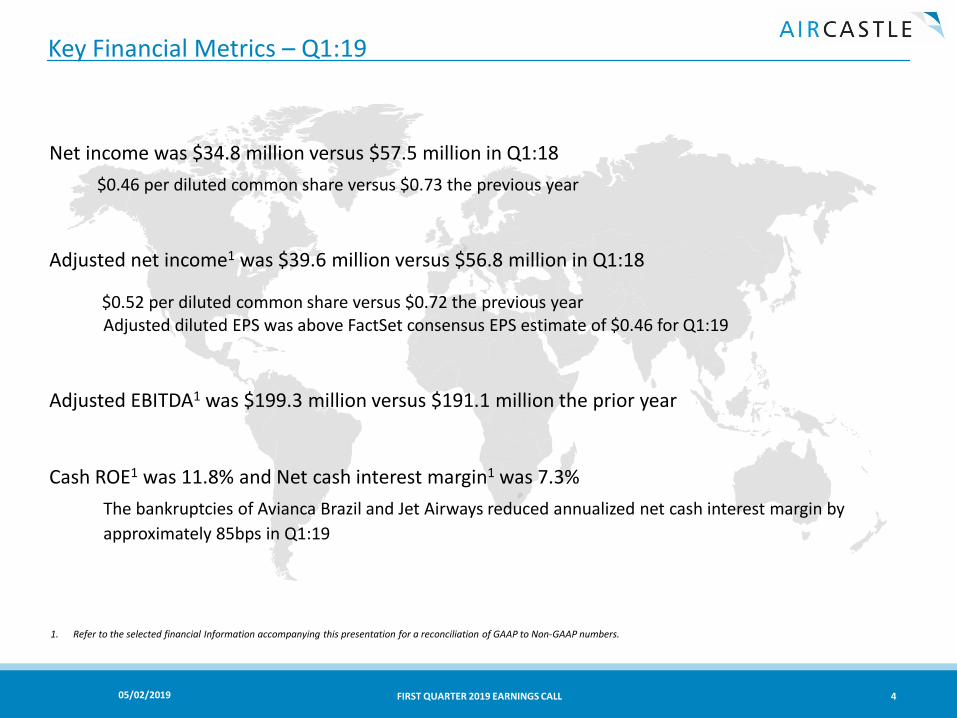
Net income was $348 million versus $575 million in Q118$046 per diluted common share versus $073 the previous year
Adjusted net income1 was $396 million versus $568 million in Q118
$052 per diluted common share versus $072 the previous yearAdjusted diluted EPS was above FactSet consensus EPS estimate of $046 for Q119
Adjusted EBITDA1 was $1993 million versus $1911 million the prior year
Cash ROE1 was 118 and Net cash interest margin1 was 73The bankruptcies of Avianca Brazil and Jet Airways reduced annualized net cash interest margin by approximately 85bps in Q119
1 Refer to the selected financial Information accompanying this presentation for a reconciliation of GAAP to Non-GAAP numbers
5FIRST QUARTER 2019 EARNINGS CALLbull 05022019
Q119 Revenue Summary
Lease rental revenues of $1897 million up $28million vs Q118
Increase was driven by net fleet growth
Q119 rental revenues were $159 million lower due to the bankruptcies of Avianca Brazil and Jet Airways
Gain on sale up $62 millionSale of four aircraft resulted in a gain on sale of $83 million
$37 million of gain on sale due to reclassification of two other aircraft as direct financing and sales-type leases
Maintenance revenue of $164 million up $44 million due to transitions
Revenue Summary
$ in millions Q119 Q118
Lease Rental and Direct Financing and Sales-Type Lease Revenues $1897 $1869
Amortization of Lease Premiums Discounts and Incentives (57) (31)
Maintenance Revenue 164 120
Total Lease Revenue 2004 1958
Gain on Sale of Flight Equipment 120 58
Other Revenue 16 11
Total Revenues $2139 $2027
6FIRST QUARTER 2019 EARNINGS CALLbull 05022019
Q119 Earnings Summary
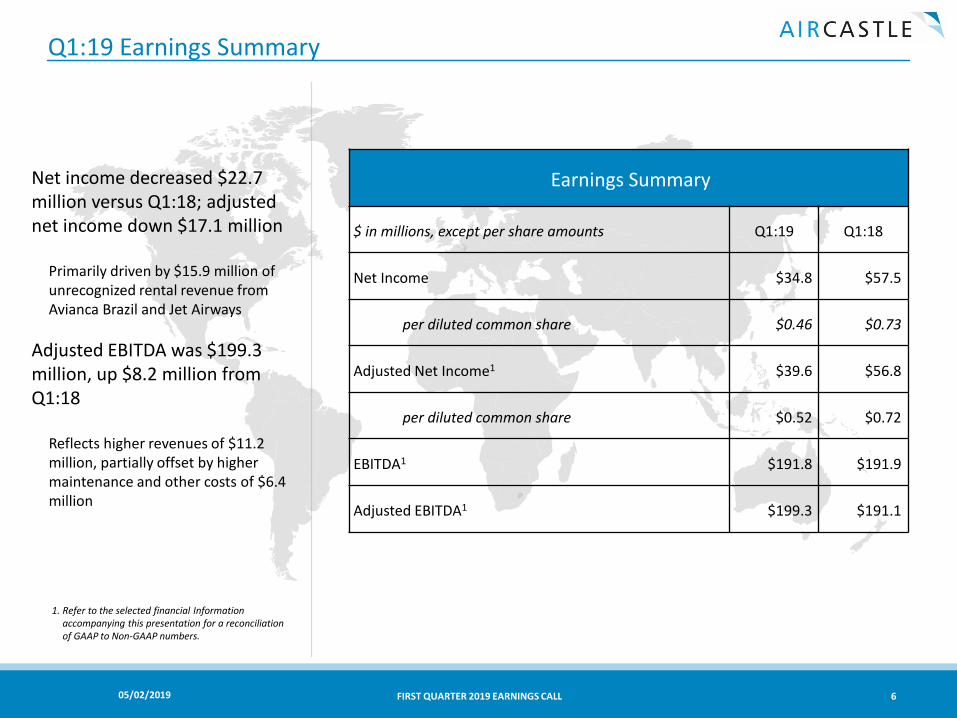
Net income decreased $227million versus Q118 adjusted net income down $171 million
Primarily driven by $159 million of unrecognized rental revenue from Avianca Brazil and Jet Airways
Adjusted EBITDA was $1993million up $82 million from Q118
Reflects higher revenues of $112 million partially offset by higher maintenance and other costs of $64 million
Earnings Summary
$ in millions except per share amounts Q119 Q118
Net Income $348 $575
per diluted common share $046 $073
Adjusted Net Income1 $396 $568
per diluted common share $052 $072
EBITDA1 $1918 $1919
Adjusted EBITDA1 $1993 $1911
1 Refer to the selected financial Information accompanying this presentation for a reconciliation of GAAP to Non-GAAP numbers
7FIRST QUARTER 2019 EARNINGS CALLbull 05022019
Q119 Acquisitions amp Sales
Acquired fourteen aircraft in Q119 for $445 million
Committed to acquire twelve additional aircraft for $385 million in 2019
Sold four aircraft for gain on sale of $83 million recognized $37 million of gains from the reclassification of two aircraft as direct financing and sales-type leases
Our 2019 placement task is nearly complete confirmed leases signed for ten Avianca Brazil A320s and seven Jet 737 family aircraft
Q119 Acquisitions amp Sales
Acquisitions1 Completed Sales
Investments Sales Proceeds $445 million $56 million
Total Number of Aircraft 14 4
1 Closed deals only through March 31 2019
8FIRST QUARTER 2019 EARNINGS CALLbull 05022019
Robust Portfolio Management with an Active Asset Strategy
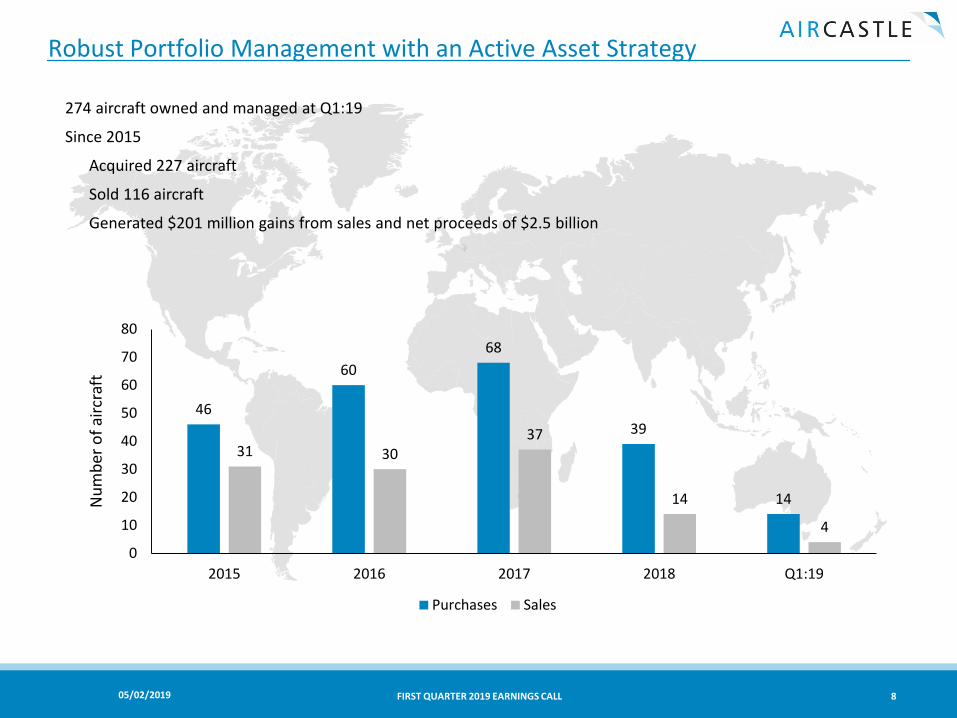
274 aircraft owned and managed at Q119
Since 2015
Acquired 227 aircraft
Sold 116 aircraft
Generated $201 million gains from sales and net proceeds of $25 billion
46
6068
39
14
31 3037
14
4
0
10
20
30
40
50
60
70
80
2015 2016 2017 2018 Q119
Num
ber o
f airc
raft
Purchases Sales
9FIRST QUARTER 2019 EARNINGS CALLbull 05022019
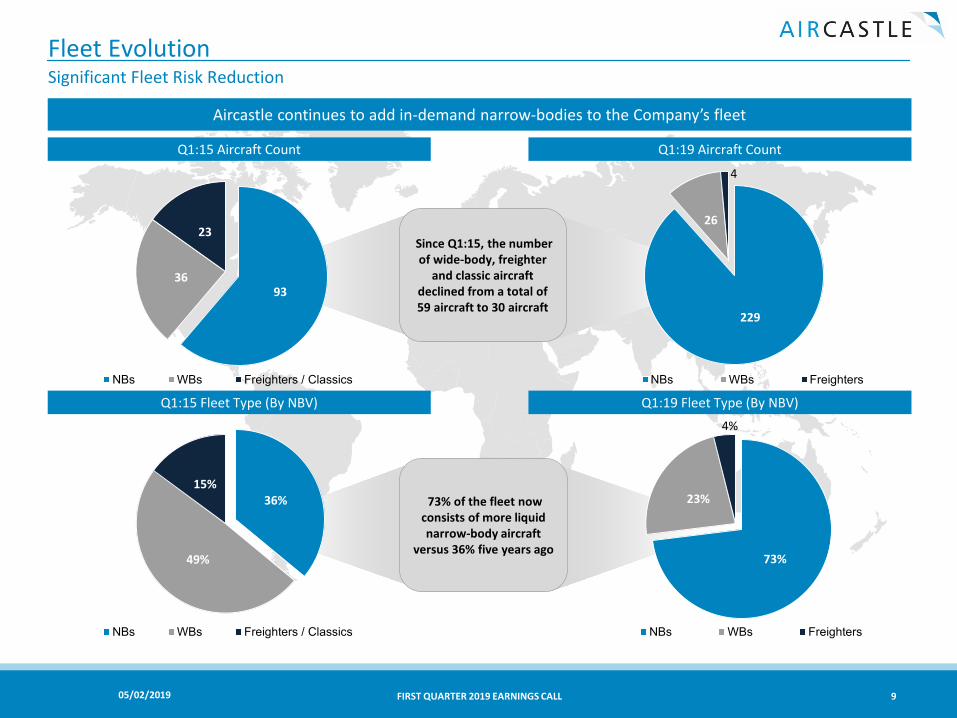
73 of the fleet now consists of more liquidnarrow-body aircraft
versus 36 five years ago
36
49
15
NBs WBs Freighters Classics
73
23
4
NBs WBs Freighters
9336
23
NBs WBs Freighters Classics
229
26
4
NBs WBs Freighters
Fleet EvolutionSignificant Fleet Risk Reduction
Since Q115 the number of wide-body freighter
and classic aircraft declined from a total of 59 aircraft to 30 aircraft
Q115 Aircraft Count Q119 Aircraft Count
Q115 Fleet Type (By NBV) Q119 Fleet Type (By NBV)
Aircastle continues to add in-demand narrow-bodies to the Companyrsquos fleet
10FIRST QUARTER 2019 EARNINGS CALLbull 05022019
Portfolio Metrics
Since Q115 expanded owned fleet at a compound annual growth rate of 71
$ in billions Q115 Q119 Q119 vs Q115
Flight Equipment Held for Lease1 $58 $76 + $18
Wtd Avg Fleet Age (years)2 83 94 + 11
Wtd Avg Lease Term (years)2 56 45 - 11
Managed JV Aircraft1 $05 $07 + $02
1 Calculated using NBV at period end2 Weighted average by NBV
NBV as used throughout this presentation includes the net book value of flight equipment held for lease and the net investment in direct financing and sales-type leases
11FIRST QUARTER 2019 EARNINGS CALLbull 05022019
Diversified Customer Base with Broad Geographic Distribution
86 airline customers in 47countries across the globe
Most top customers are large flag carriers and leading LCCs
Balanced distribution of the aircraft fleet by geographic region
Asia represents 37 of portfolio NBV followed by Europe at 29
South America represents 10 North America 9
Top Ten Lessees of NBV1 per
customer Customer Country Aircraft
gt6 IndiGo India 17
3-6
Lion Air Indonesia 11
LATAM Chile 3
TAP Portugal Portugal 8
Iberia Spain 15
SAA SouthAfrica 4
easyJet UnitedKingdom 20
Jeju Air SouthKorea 9
lt3Aerolineas Argentinas Argentina 5
Interjet Mexico 11
1 As of March 31 2019
Top Ten Countries
Country AC of NBV1
India 28 122
Indonesia 15 66
Russia 11 60
United Kingdom 30 52
South Korea 14 51
Portugal 8 45
Chile 3 44
USA 15 42
Mexico 16 42
Spain 16 41
12FIRST QUARTER 2019 EARNINGS CALLbull 05022019
Leasing Activity and Portfolio Performance
Note Aircraft on-lease days as a percent of total days in period weighted by NBV
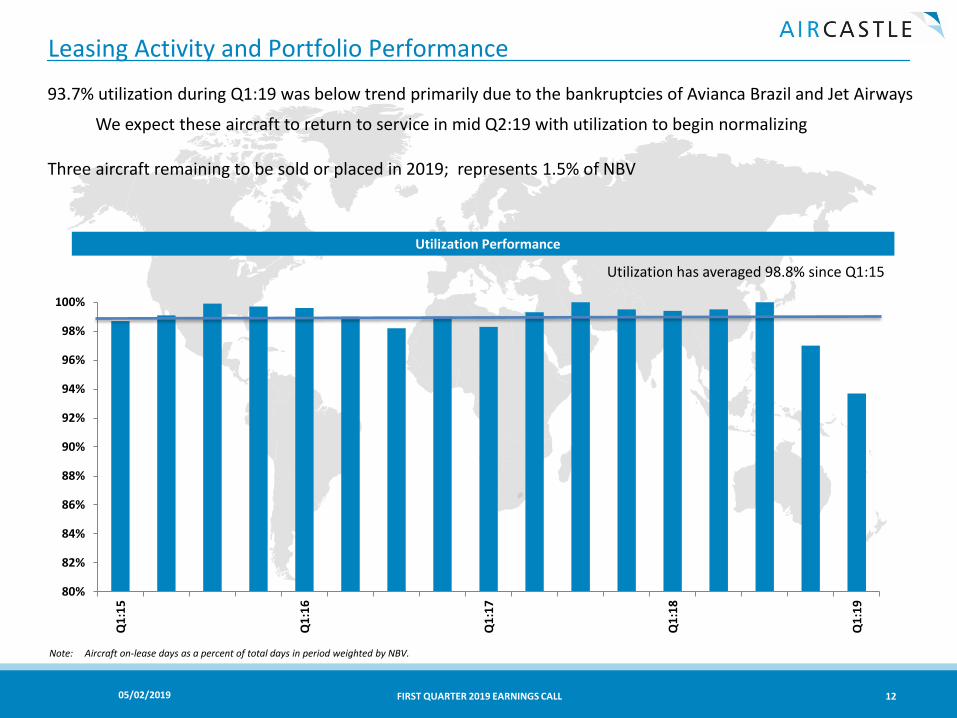
937 utilization during Q119 was below trend primarily due to the bankruptcies of Avianca Brazil and Jet Airways
We expect these aircraft to return to service in mid Q219 with utilization to begin normalizing
Three aircraft remaining to be sold or placed in 2019 represents 15 of NBV
Utilization Performance
Utilization has averaged 988 since Q115
80
82
84
86
88
90
92
94
96
98
100
Q1
15
Q1
16
Q1
17
Q1
18
Q1
19
13FIRST QUARTER 2019 EARNINGS CALLbull 05022019
Rental Yields and Net Cash Interest Margins
Approximately 85bps of the reduction reflects unrecognized rental revenue from AviancaBrazil and Jet Airways
105 lease rental yield 12 and 73 net cash interest margin1
114 pro-forma3 lease rental yield12 81 and net cash interest margin13
We expect the net cash interest margin to rebound in the second half of 2019 as the Avianca Brazil and Jet Airways aircraft return to revenue service
0
2
4
6
8
10
12
14
Q1
15
Q2
15
Q3
15
Q4
15
Q1
16
Q2
16
Q3
16
Q4
16
Q1
17
Q2
17
Q3
17
Q4
17
Q1
18
Q2
18
Q3
18
Q4
18
Q1
19
Pro-
form
aQ
119
Lease Rental Yield Net Cash Interest Margin
105
73
1 Refer to the selected financial Information accompanying this presentation for a reconciliation of GAAP to Non-GAAP numbers
2 Lease Rental Yield = Operating and finance lease rental revenue plus direct financing and sales-typelease collections average monthly NBV including direct financing and sales-type leases for the period calculated on a quarterly basis annualized
3 Adds back $159 million of lease rental revenue in Q119 to show the impact of the bankruptcies of Avianca Brazil and Jet Airways on Lease Rental Yield and Net Cash Interest Margin
1 2 13
Pro-forma 23
114
Pro-forma 13
81
14FIRST QUARTER 2019 EARNINGS CALLbull 05022019
Cash ROE Performance
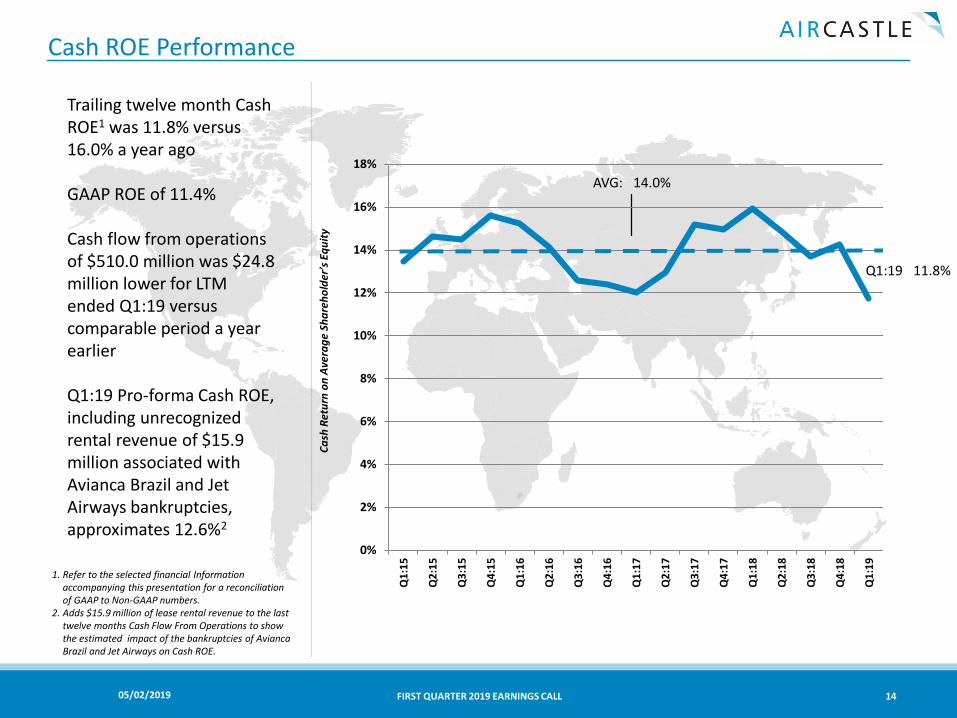
Q119 118
AVG 140
Trailing twelve month Cash ROE1 was 118 versus 160 a year ago
GAAP ROE of 114
Cash flow from operations of $5100 million was $248million lower for LTM ended Q119 versus comparable period a year earlier
Q119 Pro-forma Cash ROE including unrecognized rental revenue of $159 million associated with Avianca Brazil and Jet Airways bankruptcies approximates 1262
1 Refer to the selected financial Information accompanying this presentation for a reconciliation of GAAP to Non-GAAP numbers
2 Adds $159 million of lease rental revenue to the last twelve months Cash Flow From Operations to show the estimated impact of the bankruptcies of AviancaBrazil and Jet Airways on Cash ROE
0
2
4
6
8
10
12
14
16
18
Q1
15
Q2
15
Q3
15
Q4
15
Q1
16
Q2
16
Q3
16
Q4
16
Q1
17
Q2
17
Q3
17
Q4
17
Q1
18
Q2
18
Q3
18
Q4
18
Q1
19
Cash
Ret
urn
on A
vera
ge S
hare
hold
errsquos
Equ
ity
15FIRST QUARTER 2019 EARNINGS CALLbull 05022019
Q119 Capital Structure
Strong liquidity profile and low financial leverage minimal forward commitments
Net debt to equity of 24x84 of total debt was unsecured at quarter-end
Average remaining life of debt is 32 years$500 million note matures in 2019
$705 million in available revolver capacity $375 million drawn from a total of $108 billionUnrestricted cash of $93 million
$63 billion of unencumbered flight equipment ndash 228 aircraft
16FIRST QUARTER 2019 EARNINGS CALLbull 05022019
Selected Financial Guidance Elements for Q219
Guidance Item Q219
Lease rental revenue1 $186 - $190
Direct financing and sales-type lease revenue $8 - $9
Amortization of lease premiums discounts and incentives $(5) - $(6)
Maintenance revenue2 $16 - $20
Gain on sale $4 - $8
Depreciation $87 - $90
Interest net $66 - $69
SGampA3 $18 - $19
Full year effective tax rate 7 - 9
1 Reflects the return to service of Avianca Brazil and Jet Airways aircraft commencing in Q219 2 Includes $101M of net maintenance revenue (maintenance reserves net of a transactional impairment) in connection with the early return of seven aircraft from Jet Airways3 Includes $32M of non-cash share based payment expense
17FIRST QUARTER 2019 EARNINGS CALLbull 05022019
Appendix
18FIRST QUARTER 2019 EARNINGS CALLbull 05022019
Q119 Capital Structure amp Liquidity Summary
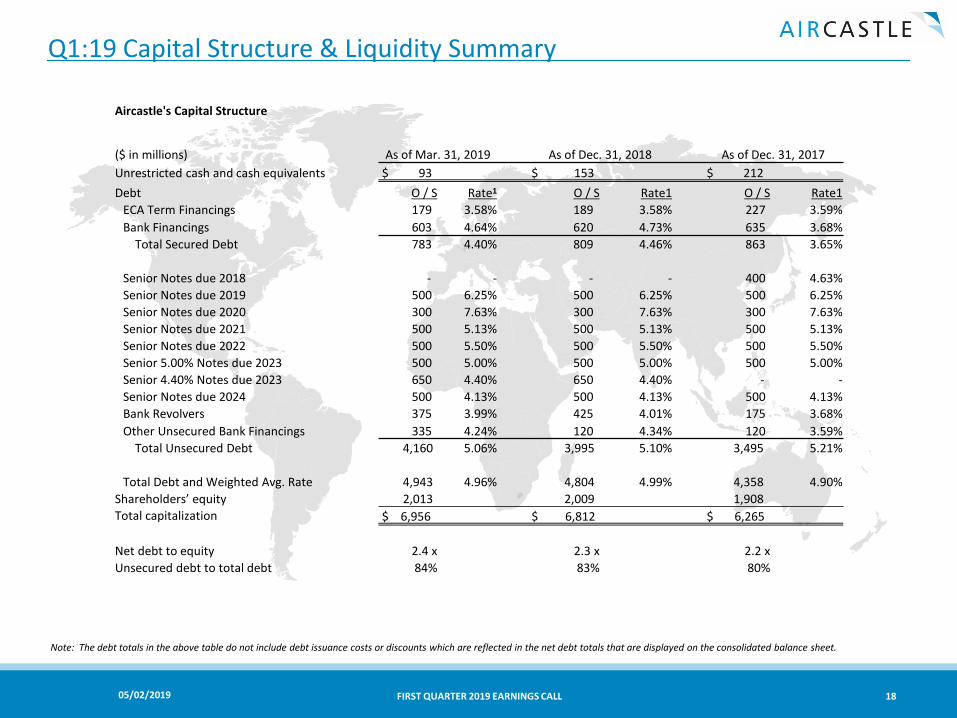
Note The debt totals in the above table do not include debt issuance costs or discounts which are reflected in the net debt totals that are displayed on the consolidated balance sheet
Aircastles Capital Structure
As of Mar 31 2019 As of Dec 31 2018 As of Dec 31 2017($ in millions)Unrestricted cash and cash equivalents $ 93 $ 153 $ 212 Debt O S Rate1 O S Rate1 O S Rate1
Total Debt and Weighted Avg Rate 4943 496 4804 499 4358 490Shareholdersrsquo equity 2013 2009 1908 Total capitalization $ 6956 $ 6812 $ 6265
Net debt to equity 24 x 23 x 22 xUnsecured debt to total debt 84 83 80
19FIRST QUARTER 2019 EARNINGS CALLbull 05022019
Supplemental Financial Information
Three Months Ended
March 31in thousands except per share amounts 2019 2018
Revenues $ 213927 $ 202680
EBITDA $ 191817 $ 191941
Adjusted EBITDA $ 199347 $ 191145
Net income $ 34810 $ 57547Net income allocable to common shares $ 34609 $ 57232
Per common share - Basic $ 046 $ 073Per common share - Diluted $ 046 $ 073
Adjusted net income $ 39616 $ 56751Adjusted net income allocable to common shares $ 39387 $ 56440
Per common share - Basic $ 053 $ 072Per common share - Diluted $ 052 $ 072
Basic common shares outstanding 74704 78367Diluted common shares outstanding 75274 78595
20FIRST QUARTER 2019 EARNINGS CALLbull 05022019
Reconciliation of GAAP to Non-GAAP Measures ndash EBITDA and Adjusted EBITDA
We define EBITDA as income (loss) from continuing operations before income taxes interest expense and depreciation and amortization We use EBITDA to assess our consolidated financial and operating performance and we believe this non-US GAAP measure is helpful in identifying trends in our performance
This measure provides an assessment of controllable expenses and affords management the ability to make decisions which are expected to facilitate meeting current financial goals as well as achieving optimal financial performance It provides an indicator for management to determine if adjustments to current spending decisions are needed
EBITDA provides us with a measure of operating performance because it assists us in comparing our operating performance on a consistent basis as it removes the impact of our capital structure (primarily interest charges on our outstanding debt) and asset base (primarily depreciation and amortization) from our operating results
Accordingly this metric measures our financial performance based on operational factors that management can impact in the short-term namely the cost structure or expenses of the organization EBITDA is one of the metrics used by senior management and the board of directors to review the consolidated financial performance of our business
We define Adjusted EBITDA as EBITDA (as defined above) further adjusted to give effect to adjustments required in calculating covenant ratios and compliance as that term is defined in the indenture governing our senior unsecured notes Adjusted EBITDA is a material component of these covenants
2019 2018
Net income $ 34810 $ 57547
Depreciation 84735 75002
Amortization of lease premiums discounts and incentives 5711 3128
Interest net 63463 57108
Income tax provision 3098 (844)
EBITDA 191817 191941
Adjustments
Equity share of joint venture impairment 2724 -
Non-cash share based payment expense 2726 2378
(Gain) loss on MTM of interest rate derivative contracts 2080 (3174)
Adjusted EBITDA $ 199347 $ 191145
Three Mos Ended Dec 31
(Dollars in thousands)
Sheet1
Sheet2
Sheet3
21FIRST QUARTER 2019 EARNINGS CALLbull 05022019
Reconciliation of GAAP to Non-GAAP Measures ndash Adjusted Net Income
Management believes that ANI when viewed in conjunction with the Companyrsquos results under US GAAP and the above reconciliation provides useful information about operating and period-over-period performance and provides additional information that is useful for evaluating the underlying operating performance of our business without regard to periodic reporting elements related to interest rate derivative accounting changes related to refinancing activity and non-cash share based payment expense
1 Included in Other income (expense)2 Included in Selling general and administrative expenses
Net Income Loss on mark-to-market of interest rate derivative contracts(1)
Non-cash share-based payment expense(2)
Adjusted Net Income2726 2378
39616$ 56751$
For the Three Months Ended March 31
2019 2018
34810$ 57547$ 2080 (3174)
Sheet1
22FIRST QUARTER 2019 EARNINGS CALLbull 05022019
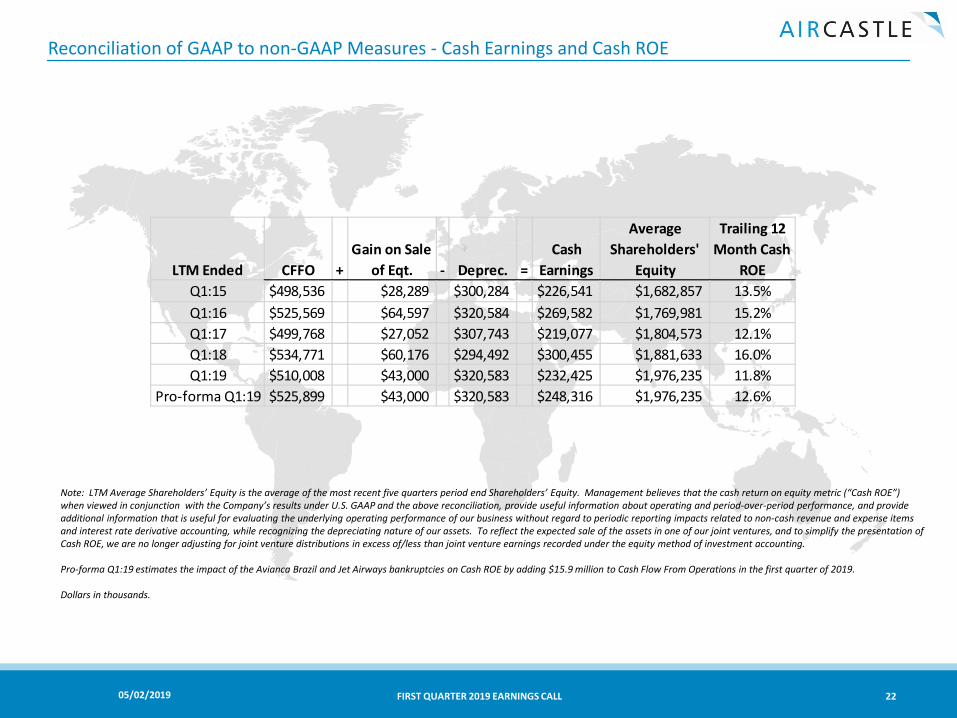
Reconciliation of GAAP to non-GAAP Measures - Cash Earnings and Cash ROE
Note LTM Average Shareholdersrsquo Equity is the average of the most recent five quarters period end Shareholdersrsquo Equity Management believes that the cash return on equity metric (ldquoCash ROErdquo) when viewed in conjunction with the Companyrsquos results under US GAAP and the above reconciliation provide useful information about operating and period-over-period performance and provide additional information that is useful for evaluating the underlying operating performance of our business without regard to periodic reporting impacts related to non-cash revenue and expense items and interest rate derivative accounting while recognizing the depreciating nature of our assets To reflect the expected sale of the assets in one of our joint ventures and to simplify the presentation of Cash ROE we are no longer adjusting for joint venture distributions in excess ofless than joint venture earnings recorded under the equity method of investment accounting
Pro-forma Q119 estimates the impact of the Avianca Brazil and Jet Airways bankruptcies on Cash ROE by adding $159 million to Cash Flow From Operations in the first quarter of 2019
1 We define net cash interest margin as lease rentals from operating leases interest income and cash collections from direct financing and sales-type leases minus interest on borrowings net settlements on interest rate derivatives and other liabilities adjusted for loan termination payments divided by the average net book of flight equipment (which includes net investment in direct financing and sales-type leases) for the period calculated on a quarterly and annualized basis The second quarter of 2017 excludes a non-recurring $70 million accelerated collection received from a lessee in connection with a finance lease
2 Excludes loan termination payments of $15 million and $35 million in the first quarter and fourth quarter of 2016 respectively and loan termination payments of $10 million in both the second and third quarters of 2017 and an $08 million loan termination gain in the third quarter of 2018
Management believes that net cash interest margin when viewed in conjunction with the Companyrsquos results under US GAAP and the above reconciliation provides useful information about the effective deployment of our capital in the context of the yield on our aircraft assets the utilization of those assets by our lessees and our ability to borrow efficiently
Except for percentages all figures are $ in thousands
3 Pro-forma Q119 estimates the impact of the Avianca Brazil and Jet Airways bankruptcies on annualized net cash interest margin by adding $159 million to quarterly rental revenue in the first quarter of 2019
As part of the Companyrsquos adoption of ASC 842 we were required to reclassify collections on direct financing and sales-type leases on our Consolidated Statement of Cash Flows for the three months ended March 31 2019 The presentation for the three months ended March 31 2018 has also been reclassified to conform to the current period presentation
Reclassification of Collections on Direct Financing and Sales-Type Leases
Three Months Ended March 31 2018
Net cash and restricted cash provided by operating activities as previously reported $142412
Collections on direct financing and sales-type leases 6493
Net cash and restricted cash provided by operating activities $148905
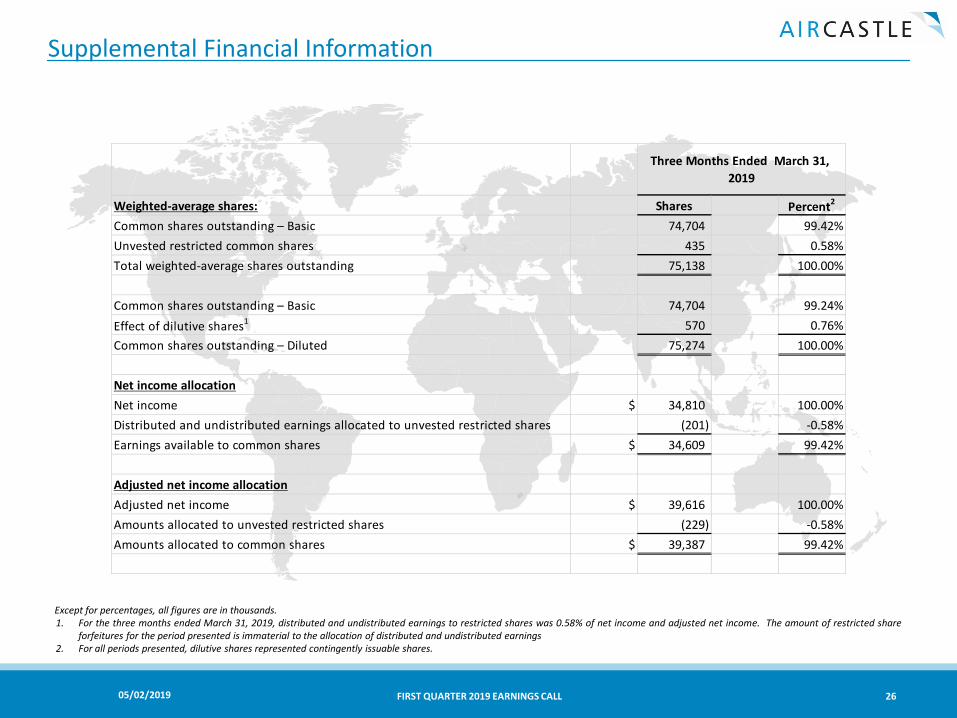
Except for percentages all figures are in thousands1 For the three months ended March 31 2019 distributed and undistributed earnings to restricted shares was 058 of net income and adjusted net income The amount of restricted share
forfeitures for the period presented is immaterial to the allocation of distributed and undistributed earnings2 For all periods presented dilutive shares represented contingently issuable shares
Weighted-average shares Shares Percent2
Common shares outstanding ndash Basic 74704 9942Unvested restricted common shares 435 058Total weighted-average shares outstanding 75138 10000
Common shares outstanding ndash Basic 74704 9924Effect of dilutive shares1 570 076Common shares outstanding ndash Diluted 75274 10000
Net income allocationNet income $ 34810 10000Distributed and undistributed earnings allocated to unvested restricted shares (201) -058Earnings available to common shares $ 34609 9942
Adjusted net income allocationAdjusted net income $ 39616 10000Amounts allocated to unvested restricted shares (229) -058Amounts allocated to common shares $ 39387 9942
Three Months Ended March 31 2019
Sheet1
27FIRST QUARTER 2019 EARNINGS CALLbull 05022019
Supplemental Financial Information
Except for percentages all figures are in thousands1 For the three months ended March 31 2018 distributed and undistributed earnings to restricted shares was 055 of net income and adjusted net income The amount of restricted share
forfeitures for the period presented is immaterial to the allocation of distributed and undistributed earnings2 For all periods presented dilutive shares represented contingently issuable shares
Weighted-average shares Shares Percent2
Common shares outstanding ndash Basic 78367 9945Unvested restricted common shares 431 055Total weighted-average shares outstanding 78798 10000
Common shares outstanding ndash Basic 78367 9971Effect of dilutive shares1 228 029Common shares outstanding ndash Diluted 78595 10000
Net income allocationNet income $ 57547 10000Distributed and undistributed earnings allocated to unvested restricted shares (315) -055Earnings available to common shares $ 57232 9945
Adjusted net income allocationAdjusted net income $ 56751 10000Amounts allocated to unvested restricted shares (311) -055Amounts allocated to common shares $ 56440 9945
Three Months Ended March 31 2018
Sheet1
28FIRST QUARTER 2019 EARNINGS CALLbull 05022019
Limitations of EBITDA Adjusted EBITDA ANI Cash ROE and Net Cash Interest Margin
An investor or potential investor may find EBITDA Adjusted EBITDA ANI Cash Earnings Cash ROE and Net Cash Interest Margin important measures in evaluating our performance results of operations and financial position We use these non-US GAAP measures to supplement our US GAAP results in order to provide a more complete understanding of the factors and trends affecting our business
EBITDA Adjusted EBITDA ANI Cash Earnings Cash ROE and Net Cash Interest Margin have limitations as analytical tools and should not be viewed in isolation or as substitutes for US GAAP measures of earnings Material limitations in making the adjustments to ourearnings to calculate EBITDA Adjusted EBITDA ANI Cash Earnings Cash ROE and Net Cash Interest Margin and using these non-US GAAP measures as compared to US GAAP net income income from continuing operations and cash flows provided by or used in operations include
depreciation and amortization though not directly affecting our current cash position represent the wear and tear andor reduction in value of our aircraft which affects the aircraftrsquos availability for use and may be indicative of future needs for capital expenditures
the cash portion of income tax (benefit) provision generally represents charges (gains) which may significantly affect our financial results
elements of our interest rate derivative accounting may be used to evaluate the effectiveness of our hedging policy
hedge loss amortization charges related to Term Financing No 1 and Securitization No 1 and
adjustments required in calculating covenant ratios and compliance as that term is defined in the indenture governing our seniorunsecured notes
EBITDA Adjusted EBITDA ANI Cash Earnings Cash ROE and Net Cash Interest Margin are not alternatives to net income income from operations or cash flows provided by or used in operations as calculated and presented in accordance with US GAAP You should not rely on these non-US GAAP measures as a substitute for any such US GAAP financial measure We strongly urge you to review the reconciliations to US GAAP net income along with our consolidated financial statements included elsewhere in our Annual Report We also strongly urge you to not rely on any single financial measure to evaluate our business In addition because EBITDA Adjusted EBITDA ANI Cash Earnings Cash ROE and Net Cash Interest Margin are not measures of financial performance under US GAAP and are susceptible to varying calculations EBITDA Adjusted EBITDA ANI Cash Earnings Cash ROE and Net Cash Interest Margin as presented here may differ from and may not be comparable to similarly titled measures used by other companies
Slide Number 1
Slide Number 2
Slide Number 3
Slide Number 4
Slide Number 5
Slide Number 6
Slide Number 7
Slide Number 8
Slide Number 9
Slide Number 10
Slide Number 11
Slide Number 12
Slide Number 13
Slide Number 14
Slide Number 15
Slide Number 16
Slide Number 17
Slide Number 18
Slide Number 19
Slide Number 20
Slide Number 21
Slide Number 22
Slide Number 23
Slide Number 24
Slide Number 25
Slide Number 26
Slide Number 27
Slide Number 28
Three Months Ended March 31 2019
Three Months Ended March 31 2019
Weighted-average shares
Shares
Percent2
Weighted-average shares
Shares
Percent2
Common shares outstanding ndash Basic
74704
9942
Common shares outstanding ndash Basic
74704
9942
Unvested restricted common shares
435
058
Unvested restricted common shares
435
058
Total weighted-average shares outstanding
75138
10000
Total weighted-average shares outstanding
75138
10000
Common shares outstanding ndash Basic
74704
9924
Common shares outstanding ndash Basic
74704
9924
Effect of dilutive shares1
570
076
Effect of dilutive shares1
570
076
Common shares outstanding ndash Diluted
75274
10000
Common shares outstanding ndash Diluted
75274
10000
Net income allocation
Net income allocation
Net income
$
34810
10000
Net income
$
34810
10000
Distributed and undistributed earnings allocated to unvested restricted shares
(201)
-058
Distributed and undistributed earnings allocated to unvested restricted shares
(201)
-058
Earnings available to common shares
$
34609
9942
Earnings available to common shares
$
34609
9942
Adjusted net income allocation
Adjusted net income allocation
Adjusted net income
$
39616
10000
Adjusted net income
$
39616
10000
Amounts allocated to unvested restricted shares
(229)
-058
Amounts allocated to unvested restricted shares
(229)
-058
Amounts allocated to common shares
$
39387
9942
Amounts allocated to common shares
$
39387
9942
Three Months Ended March 31 2018
Three Months Ended March 31 2018
Weighted-average shares
Shares
Percent2
Weighted-average shares
Shares
Percent2
Common shares outstanding ndash Basic
78367
9945
Common shares outstanding ndash Basic
78367
9945
Unvested restricted common shares
431
055
Unvested restricted common shares
431
055
Total weighted-average shares outstanding
78798
10000
Total weighted-average shares outstanding
78798
10000
Common shares outstanding ndash Basic
78367
9971
Common shares outstanding ndash Basic
78367
9971
Effect of dilutive shares1
228
029
Effect of dilutive shares1
228
029
Common shares outstanding ndash Diluted
78595
10000
Common shares outstanding ndash Diluted
78595
10000
Net income allocation
Net income allocation
Net income
$
57547
10000
Net income
$
57547
10000
Distributed and undistributed earnings allocated to unvested restricted shares
(315)
-055
Distributed and undistributed earnings allocated to unvested restricted shares
(315)
-055
Earnings available to common shares
$
57232
9945
Earnings available to common shares
$
57232
9945
Adjusted net income allocation
Adjusted net income allocation
Adjusted net income
$
56751
10000
Adjusted net income
$
56751
10000
Amounts allocated to unvested restricted shares
(311)
-055
Amounts allocated to unvested restricted shares
(311)
-055
Amounts allocated to common shares
$
56440
9945
Amounts allocated to common shares
$
56440
9945
Three Months Ended March 31 2019
Three Months Ended March 31 2019
Weighted-average shares
Shares
Percent2
Weighted-average shares
Shares
Percent2
Common shares outstanding ndash Basic
74704
9942
Common shares outstanding ndash Basic
74704
9942
Unvested restricted common shares
435
058
Unvested restricted common shares
435
058
Total weighted-average shares outstanding
75138
10000
Total weighted-average shares outstanding
75138
10000
Common shares outstanding ndash Basic
74704
9924
Common shares outstanding ndash Basic
74704
9924
Effect of dilutive shares1
570
076
Effect of dilutive shares1
570
076
Common shares outstanding ndash Diluted
75274
10000
Common shares outstanding ndash Diluted
75274
10000
Net income allocation
Net income allocation
Net income
$
34810
10000
Net income
$
34810
10000
Distributed and undistributed earnings allocated to unvested restricted shares
(201)
-058
Distributed and undistributed earnings allocated to unvested restricted shares
(201)
-058
Earnings available to common shares
$
34609
9942
Earnings available to common shares
$
34609
9942
Adjusted net income allocation
Adjusted net income allocation
Adjusted net income
$
39616
10000
Adjusted net income
$
39616
10000
Amounts allocated to unvested restricted shares
(229)
-058
Amounts allocated to unvested restricted shares
(229)
-058
Amounts allocated to common shares
$
39387
9942
Amounts allocated to common shares
$
39387
9942
Three Months Ended March 31 2018
Three Months Ended March 31 2018
Weighted-average shares
Shares
Percent2
Weighted-average shares
Shares
Percent2
Common shares outstanding ndash Basic
78367
9945
Common shares outstanding ndash Basic
78367
9945
Unvested restricted common shares
431
055
Unvested restricted common shares
431
055
Total weighted-average shares outstanding
78798
10000
Total weighted-average shares outstanding
78798
10000
Common shares outstanding ndash Basic
78367
9971
Common shares outstanding ndash Basic
78367
9971
Effect of dilutive shares1
228
029
Effect of dilutive shares1
228
029
Common shares outstanding ndash Diluted
78595
10000
Common shares outstanding ndash Diluted
78595
10000
Net income allocation
Net income allocation
Net income
$
57547
10000
Net income
$
57547
10000
Distributed and undistributed earnings allocated to unvested restricted shares
(315)
-055
Distributed and undistributed earnings allocated to unvested restricted shares
(315)
-055
Earnings available to common shares
$
57232
9945
Earnings available to common shares
$
57232
9945
Adjusted net income allocation
Adjusted net income allocation
Adjusted net income
$
56751
10000
Adjusted net income
$
56751
10000
Amounts allocated to unvested restricted shares
(311)
-055
Amounts allocated to unvested restricted shares
(311)
-055
Amounts allocated to common shares
$
56440
9945
Amounts allocated to common shares
$
56440
9945
Q119
Q418
Q318
Q119 B (W) vs Q418
Average NBV for the 4th and 3rd Quarters of 2018
$ 7449957
$ 7136627
$ 6787206
$ 313330
Average NBV 44 higher Q418 to Q119
Operating and Finance Lease Revenues
$ 189676
$ 192711
$ 190836
$ (3034)
Finance Lease Collections
$ 5925
$ 7316
$ 9518
$ (1391)
Annualized Portfolio Yield
105
112
118
-07
Annualized yield 71bps lower
Cash Interest Expense
$ 60279
$ 60348
$ 54521
$ 69
Annualized Cash Interest
32
34
32
01
Annualized cash int exp 15bps lower
Annualized Cash Net Interest Margin
73
78
86
-06
Annualized cash margin 56bps lower
Average NBV
Quarterly Rental Revenue(1)
Cash Interest(2)
Annualized Net Cash Interest Margin(1)(2)
Yield
Cash Interest Expense
Q112
$ 4388008
$ 152242
$ 44969
98
139
410
Q212
$ 4542477
$ 156057
$ 48798
94
137
430
Q312
$ 4697802
$ 163630
$ 41373
104
139
352
Q412
$ 4726457
$ 163820
$ 43461
102
139
368
Q113
$ 4740161
$ 162319
$ 48591
96
137
410
Q213
$ 4840396
$ 164239
$ 44915
99
136
371
Q313
$ 4863444
$ 167876
$ 47682
99
138
392
Q413
$ 5118601
$ 176168
$ 49080
99
138
384
Q114
$ 5312651
$ 181095
$ 51685
97
136
389
Q214
$ 5721521
$ 190574
$ 48172
100
133
337
Q314
$ 5483958
$ 182227
$ 44820
100
133
327
Q414
$ 5468637
$ 181977
$ 44459
101
133
325
Q115
$ 5743035
$ 181027
$ 50235
91
126
350
Q215
$ 5967898
$ 189238
$ 51413
92
127
345
Q315
$ 6048330
$ 191878
$ 51428
93
127
340
Q415
$ 5962874
$ 188491
$ 51250
92
126
344
Q116
$ 5988076
$ 186730
$ 51815
90
125
346
Q216
$ 5920030
$ 184469
$ 55779
87
125
377
Q316
$ 6265175
$ 193909
$ 57589
87
124
368
Q416
$ 6346361
$ 196714
$ 58631
87
124
370
Q117
$ 6505355
$ 200273
$ 58839
87
123
362
Q217
$ 6512100
$ 199522
$ 55871
88
123
343
Q317
$ 5985908
$ 184588
$ 53457
88
123
357
Q417
$ 6247581
$ 187794
$ 53035
86
120
340
Q118
$ 6700223
$ 193418
$ 53978
83
115
322
Q218
$ 6721360
$ 193988
$ 53979
83
115
321
Q318
$ 6787206
$ 200354
$ 54521
86
118
321
Q418
$ 7136627
$ 200027
$ 60348
78
112
338
Q119
$ 7449957
$ 195601
$ 60279
73
105
324
Pro-forma Q119
$ 7449957
$ 211501
$ 60279
81
114
324
Average NBV
Quarterly Rental Revenue1
Cash Interest2
Annualized Net Cash Interest Margin12
Yield
Cash Interest Expense
Q113
$ 4740161
$ 162319
$ 48591
96
137
410
Q213
$ 4840396
$ 164239
$ 44915
99
136
371
Q313
$ 4863444
$ 167876
$ 47682
99
138
392
Q413
$ 5118601
$ 176168
$ 49080
99
138
384
Q114
$ 5312651
$ 181095
$ 51685
97
136
389
Q214
$ 5721521
$ 190574
$ 48172
100
133
337
Q314
$ 5483958
$ 182227
$ 44820
100
133
327
Q414
$ 5468637
$ 181977
$ 44459
101
133
325
Q115
$ 5743035
$ 181027
$ 50235
91
126
350
Q215
$ 5967898
$ 189238
$ 51413
92
127
345
Q315
$ 6048330
$ 191878
$ 51428
93
127
340
Q415
$ 5962874
$ 188491
$ 51250
92
126
344
Q116
$ 5988076
$ 186730
$ 51815
90
125
346
Q216
$ 5920030
$ 184469
$ 55779
87
125
377
Q316
$ 6265175
$ 193909
$ 57589
87
124
368
Q416
$ 6346361
$ 196714
$ 58631
87
124
370
Q117
$ 6505355
$ 200273
$ 58839
87
123
362
Q217
$ 6512100
$ 199522
$ 55871
88
123
343
Q317
$ 5985908
$ 184588
$ 53457
88
123
357
Q417
$ 6247581
$ 187794
$ 53035
86
120
340
Q118
$ 6700223
$ 193418
$ 53978
83
115
322
Q218
$ 6721360
$ 193988
$ 53979
83
115
321
Q318
$ 6787206
$ 200354
$ 54521
86
118
321
Q418
$ 7136627
$ 200027
$ 60348
78
112
338
Q119
$ 7449957
$ 195601
$ 60279
73
105
324
Pro-forma Q119
$ 7449957
$ 211501
$ 60279
81
114
324
NBV FE
Fin Lease
NBV Flight Equip + Fin Lease
Lease Rentals
Interest Inc Fin lease
Collections on Fin Leases
Total Lease Rent Collections
Quarterly Lease rent Collections
Cash Interest
Loan and Contract Termination Fees included in Cash Interest
Adj Cash Int
NIM $
NIM
Yield
Cash Int
Month End
Month End
Month End
Mo Avg
Qtrly Avg
MTD
MTD
QTD
QTD
QTD
DEC10
4065780
- 0
4065780
JAN11
3981690
- 0
3981690
4023735
- 0
47091
- 0
- 0
47091
- 0
- 0
- 0
FEB11
4051167
- 0
4051167
4016428
- 0
47264
- 0
- 0
47264
- 0
- 0
- 0
MAR11
4120309
- 0
4120309
4085738
4041967
46761
- 0
- 0
46761
141116
$ 41278
41278
99838
988
APR11
4125377
- 0
4125377
4122843
- 0
47211
- 0
- 0
47211
- 0
- 0
- 0
MAY11
4194987
- 0
4194987
4160182
- 0
47897
- 0
- 0
47897
- 0
- 0
- 0
JUN11
4099641
- 0
4099641
4147314
4143446
48248
- 0
- 0
48248
143356
$ 43217
$ 3196
40021
103335
998
JUL11
4271013
- 0
4271013
4185327
- 0
47994
- 0
- 0
47994
- 0
- 0
- 0
AUG11
4248242
- 0
4248242
4259628
- 0
49193
- 0
- 0
49193
- 0
- 0
- 0
SEP11
4196918
- 0
4196918
4222580
4222512
48704
- 0
- 0
48704
145890
$ 42066
42066
103824
984
OCT11
4430527
- 0
4430527
4313723
- 0
49054
- 0
- 0
49054
- 0
- 0
- 0
NOV11
4401782
- 0
4401782
4416155
- 0
50498
- 0
- 0
50498
- 0
- 0
- 0
DEC11
4387986
- 0
4387986
4394884
4374921
50297
- 0
- 0
50297
149848
$ 43041
43041
106807
977
JAN12
4391666
- 0
4391666
4389826
- 0
51034
- 0
- 0
51034
- 0
- 0
- 0
FEB12
4385360
- 0
4385360
4388513
- 0
49705
- 0
- 0
49705
- 0
- 0
- 0
MAR12
4386010
- 0
4386010
4385685
4388008
51503
- 0
- 0
51503
152242
$ 44969
44969
107273
978
APR12
4484956
- 0
4484956
4435483
- 0
50824
- 0
- 0
50824
- 0
- 0
- 0
MAY12
4570712
31500
4602212
4543584
- 0
51020
- 0
- 0
51020
- 0
- 0
- 0
JUN12
4604493
90024
4694518
4648365
4542477
51781
956
1476
54213
156057
$ 48798
48798
107259
944
JUL12
4572121
90739
4662860
4678689
- 0
52892
963
- 0
53855
- 0
- 0
- 0
AUG12
4665966
90332
4756298
4709579
- 0
52945
948
- 0
53893
- 0
- 0
- 0
SEP12
4532445
121533
4653978
4705138
4697802
53709
1608
565
55881
163630
$ 41373
41373
122257
1041
OCT12
4574055
120934
4694990
4674484
- 0
52277
1311
- 0
53588
- 0
- 0
- 0
NOV12
4645741
120345
4766086
4730538
- 0
52596
1321
- 0
53917
- 0
- 0
- 0
DEC12
4662661
119951
4782612
4774349
4726457
53217
1286
1811
56314
163820
$ 43461
43461
120359
1019
JAN13
4639414
119339
4758753
4770682
- 0
52957
1298
- 0
54255
- 0
- 0
- 0
FEB13
4614480
118707
4733187
4745970
- 0
51936
1277
- 0
53213
- 0
- 0
- 0
MAR13
4544773
129700
4674474
4703830
4740161
51697
1309
1845
54850
162319
$ 48591
48591
113728
960
APR13
4621392
128981
4750373
4712423
- 0
51363
1384
- 0
52747
- 0
- 0
- 0
MAY13
4915814
128237
5044051
4897212
- 0
53613
1359
- 0
54972
- 0
- 0
- 0
JUN13
4651553
127504
4779057
4911554
4840396
52942
1370
2207
56520
164239
$ 47869
$ 2954
44915
119324
986
JUL13
4668642
149932
4818574
4798816
- 0
52469
1372
- 0
53840
- 0
- 0
- 0
AUG13
4690154
149017
4839171
4828873
- 0
53339
1423
- 0
54763
- 0
- 0
- 0
SEP13
4938113
148005
5086118
4962645
4863444
55340
1327
2606
59273
167876
$ 47682
47682
120194
989
OCT13
4913184
147017
5060200
5073159
- 0
56643
1350
- 0
57993
- 0
- 0
- 0
NOV13
5011676
146076
5157752
5108976
- 0
56264
1361
- 0
57625
- 0
- 0
- 0
DEC13
5044410
145173
5189583
5173668
5118601
56367
1333
2850
60550
176168
$ 49080
49080
127088
993
JAN14
5015452
144256
5159708
5174646
- 0
58142
1337
- 0
59478
- 0
- 0
- 0
FEB14
5129035
143356
5272392
5216050
- 0
57572
1354
- 0
58926
- 0
- 0
- 0
MAR14
5679723
142400
5822123
5547257
5312651
58621
1297
2773
62691
181095
$ 51685
51685
129410
974
APR14
5605462
155551
5761013
5791568
- 0
61276
1329
- 0
62604
- 0
- 0
- 0
MAY14
5512769
154435
5667205
5714109
- 0
60998
1338
- 0
62336
- 0
- 0
- 0
JUN14
5577966
72600
5650566
5658886
5721521
60957
1231
3446
65634
190574
$ 48172
48172
142402
996
JUL14
5418990
71971
5490961
5570764
- 0
60509
484
- 0
60993
- 0
- 0
- 0
AUG14
5412453
71345
5483799
5487380
- 0
59617
488
- 0
60105
- 0
- 0
- 0
SEP14
5232940
70723
5303663
5393731
5483958
58760
491
1877
61129
182227
$ 44820
44820
137407
1002
OCT14
5340303
88360
5428663
5366163
- 0
59394
480
- 0
59874
- 0
- 0
- 0
NOV14
5374566
107667
5482233
5455448
- 0
59717
542
- 0
60259
- 0
- 0
- 0
DEC14
5579718
106651
5686369
5584301
5468637
59091
537
2216
61844
181977
$ 44459
44459
137518
1006
1331
325
134
99
JAN15
5642590
105896
5748487
5717428
- 0
59898
539
- 0
60437
- 0
- 0
- 0
FEB15
5623616
105155
5728770
5738628
- 0
58688
552
- 0
59240
- 0
- 0
- 0
MAR15
5712950
104377
5817327
5773049
5743035
58560
516
2274
61350
181027
$ 50235
50235
130792
911
1261
350
APR15
5778092
119625
5897717
5857522
- 0
60016
589
- 0
60605
- 0
- 0
- 0
MAY15
5940205
118903
6059108
5978412
- 0
61684
628
- 0
62311
- 0
- 0
- 0
JUN15
5953555
122855
6076411
6067759
5967898
63140
660
2521
66322
189238
$ 51413
51413
137825
924
1268
345
JUL15
5942037
122200
6064238
6070324
- 0
63838
625
- 0
64463
- 0
- 0
- 0
AUG15
5917660
121542
6039202
6051720
- 0
62322
623
- 0
62945
- 0
- 0
- 0
SEP15
5885807
120882
6006689
6022946
6048330
61877
620
1973
64470
191878
$ 51428
51428
140450
929
1269
340
OCT15
5829040
103074
5932114
5969402
- 0
61959
611
- 0
62570
- 0
- 0
- 0
NOV15
5801167
117861
5919028
5925571
- 0
60485
623
- 0
61108
- 0
- 0
- 0
DEC15
5867062
201211
6068273
5993651
5962874
60949
1072
2791
64812
188491
$ 51250
51250
137241
921
1264
344
127
92
JAN16
5836479
198445
6034923
6051598
- 0
60245
1141
- 0
61387
- 0
- 0
- 0
FEB16
5796230
213436
6009666
6022295
- 0
60098
1161
- 0
61259
- 0
- 0
- 0
MAR16
5558666
212336
5771002
5890334
5988076
59227
1195
3663
64085
186730
$ 53324
1509
51815
134915
901
1247
346
APR16
5654825
211354
5866179
5818591
- 0
58383
1160
- 0
59544
- 0
- 0
- 0
MAY16
5659238
265253
5924490
5895335
- 0
58787
1432
- 0
60218
- 0
- 0
- 0
JUN16
5875935
291903
6167838
6046164
5920030
58955
1582
4170
64707
184469
55779
55779
128690
870
1246
377
JUL16
5980982
290048
6271030
6219434
- 0
60301
1805
- 0
62107
- 0
- 0
- 0
AUG16
6017274
288131
6305405
6288218
- 0
60757
1744
- 0
62501
- 0
- 0
- 0
SEP16
6004489
265854
6270343
6287874
6265175
60917
1805
6580
69301
193909
57589
57589
136320
870
1238
368
OCT16
6025556
264389
6289945
6280144
- 0
61757
1413
63170
- 0
- 0
- 0
NOV16
6097520
262667
6360187
6325066
- 0
62824
1357
64181
- 0
- 0
- 0
DEC16
6246707
260853
6507560
6433874
6346361
62969
1394
5000
69363
196714
62082
3451
58631
138083
870
1240
370
124
88
JAN17
6219012
259264
6478276
6492918
- 0
63296
1359
64655
- 0
FEB17
6227957
257474
6485431
6481853
- 0
63575
1288
64863
- 0
MAR17
6297190
299969
6597159
6541295
6505355
63715
1426
5614
70755
200273
58839
58839
141434
870
1231
362
APR17
6269189
348327
6617516
6607338
64119
1814
65933
MAY17
6156371
377186
6533557
6575537
63186
2079
65265
JUN17
5818821
354474
6173295
6353426
6512100
61794
1985
4545
68324
199522
56859
988
55871
143651
882
1226
343
JUL17
5615695
352411
5968106
6070700
59464
1954
61418
AUG17
5523543
390140
5913683
5940895
56603
1917
58520
SEP17
5490164
488408
5978572
5946128
5985908
55621
2541
6488
64650
184588
54527
1070
53457
131131
876
1233
357
OCT17
5493432
549212
6042644
6010608
55282
2833
58115
NOV17
5789587
554117
6343704
6193174
56823
3248
60071
DEC17
6188469
545750
6734219
6538962
6247581
57826
3272
8511
69609
187794
53035
53035
134759
863
1202
340
122
87
JAN18
6163924
543311
6707235
6720727
59570
3212
62782
FEB18
6173766
514024
6687790
6697513
59177
3007
62184
MAR18
6143695
533373
6677067
6682429
6700223
58736
3222
6493
68451
193418
53978
53978
139440
832
1155
322
APR18
6120068
531077
6651145
6664106
58481
2936
61417
MAY18
6257826
528503
6786329
6718737
59975
3015
62990
JUN18
6249406
526738
6776144
6781236
6721360
60030
2918
6634
69582
193988
53979
53979
140009
833
1154
321
12 MONTH CALCULATION
JUL18
6261431
523491
6784922
6780533
60815
2990
63804
Yield
NIM
AUG18
6250137
519066
6769203
6777062
60517
2927
63444
2014
134
99
SEP18
6321623
517221
6838844
6804023
6787206
60712
2876
9518
73106
200354
53683
-838
54521
145833
859
1181
321
2015
127
92
OCT18
6602809
515251
7118060
6978452
62875
2742
65617
2016
124
88
NOV18
6657588
512429
7170017
7144039
61402
2610
64012
2017
122
87
DEC18
6935585
469180
7404765
7287391
7136627
60405
2677
7316
70398
200027
60348
60348
139679
783
1121
338
115
83
2018
115
83
JAN19
6900489
509725
7410214
7407489
59462
2959
62421
LTM Q119
112
80
FEB19
6907294
507653
7414948
7412581
62458
2701
65158
MAR19
7138689
505964
7644653
7529800
7449957
59314
2783
5925
68022
195601
60279
60279
135322
727
1050
324
112
80
wCollections on Finance Leases
2019
2018
2017
Finance Lease Collections
Finance Lease Collections
Finance Lease Collections
Yield
Cash Interest
Net Spread
Avg NBV
Lease Rent
Interest
YTD
5925
YTD
29961
YTD
32184
Q117
1231
362
870
6505355
200273
$ 58839
Q119
5925
Q118
6493
Q117
5614
Q119
1050
324
727
7449957
195601
60279
Q219
Q218
6634
Q217
11571
-181
-038
-143
Change
145
-23
24
Q319
Q318
9518
Q317
6488
Q419
Q418
7316
Q417
8511
Yield
Cash Interest
Net Spread
Avg NBV
Lease Rent
Interest
Finance Lease Revenue
Finance Lease Revenue
Finance Lease Revenue
Q118
1155
322
832
6700223
193418
53978
Q119
8442
Q418
8029
Q417
9353
Q119
1050
324
727
7449957
195601
60279
January
2959
October
2742
October
2833
-104
001
-106
Change
112
11
117
February
2701
November
2610
November
3248
March
2783
December
2677
December
3272
Yield
Cash Interest
Net Spread
Avg NBV
Lease Rent
Interest
Q418
1121
338
783
7136627
200027
60348
Collections on Finance Leases excludes $70 million of unusual payments received from KLM in Q217
Q119
1050
324
727
7449957
195601
60279
-071
-015
-056
Change
44
-22
-01
112
w$17mm added to Q119
11
Actual
1050
324
727
Revised
1141
324
818
091
091
wCollections on Finance Leases
Yield
Cash Interest
Net Spread
Q314
13292
3269
1002
Q316
12380
3677
870
-0911
0408
-132
Yield
Cash Interest
Net Spread
Q315
12690
3401
929
Q316
12380
3677
870
-0310
0276
-059
Yield
Cash Interest
Net Spread
Q216
12464
3769
870
Q316
12380
3677
870
-0084
-0092
001
Old Format
Yield
Cash Interest
Net Spread
Q314
13221
3312
991
Q316
12173
3852
832
-1047
-0540
-159
Yield
Cash Interest
Net Spread
Q315
12691
3471
922
Q316
12173
3852
832
-0518
-0381
-090
Yield
Cash Interest
Net Spread
Q216
12409
3930
8479
Q316
12173
3852
8321
Change
-0236
0078
-0159
For the Three Months Ended March 31
2019
2018
Net Income
$ 34810
$ 57547
(Gain) loss on mark-to-market of interest rate derivative contracts(1)
2080
(3174)
Non-cash share-based payment expense(2)
2726
2378
Adjusted Net Income
$ 39616
$ 56751
For the Three Months Ended March 31
2019
2018
Net Income
$ 34810
$ 57547
Loss on mark-to-market of interest rate derivative contracts(1)
2080
(3174)
Non-cash share-based payment expense(2)
2726
2378
Adjusted Net Income
$ 39616
$ 56751
Three Mos Ended Dec 31
2019
2018
(Dollars in thousands)
Net income
$ 34810
$ 57547
Depreciation
84735
75002
Amortization of lease premiums discounts and incentives
5711
3128
Interest net
63463
57108
Income tax provision
3098
(844)
EBITDA
191817
191941
Adjustments
Equity share of joint venture impairment
2724
-
Non-cash share based payment expense
2726
2378
(Gain) loss on MTM of interest rate derivative contracts
2080
(3174)
Adjusted EBITDA
$ 199347
$ 191145
Three Mos Ended Dec 31
2019
2018
(Dollars in thousands)
Net income
$ 34810
$ 57547
Depreciation
84735
75002
Amortization of lease premiums discounts and incentives
5711
3128
Interest net
63463
57108
Income tax provision
3098
(844)
EBITDA
191817
191941
Adjustments
Equity share of joint venture impairment
2724
- 0
Non-cash share based payment expense
2726
2378
(Gain) loss on MTM of interest rate derivative contracts
2080
(3174)
Adjusted EBITDA
$ 199347
$ 191145
2FIRST QUARTER 2019 EARNINGS CALLbull 05022019
Forward-Looking Statements Property of Aircastle
All statements included or incorporated by reference in this presentation other than characterizations of historical fact are forward-looking statementswithin the meaning of the federal securities laws including the Private Securities Litigation Reform Act of 1995 Examples of forward-looking statementsinclude but are not necessarily limited to statements relating to our ability to acquire sell lease or finance aircraft raise capital pay dividends and increaserevenues earnings EBITDA Adjusted EBITDA Adjusted Net Income Cash Return on Equity and Net Cash Interest Margin and the global aviation industry andaircraft leasing sector Words such as ldquoanticipatesrdquo ldquoexpectsrdquo ldquointendsrdquo ldquoplansrdquo ldquoprojectsrdquo ldquobelievesrdquo ldquomayrdquo ldquowillrdquo ldquowouldrdquo ldquocouldrdquo ldquoshouldrdquo ldquoseeksrdquoldquoestimatesrdquo and variations on these words and similar expressions are intended to identify such forward-looking statements These statements are based onour historical performance and that of our subsidiaries and on our current plans estimates and expectations and are subject to a number of factors thatcould lead to actual results materially different from those described in the forward-looking statements Aircastle can give no assurance that its expectationswill be attained Accordingly you should not place undue reliance on any such forward-looking statements which are subject to certain risks anduncertainties that could cause actual results to differ materially from those anticipated as of the date of this presentation These risks or uncertaintiesinclude but are not limited to those described from time to time in Aircastlersquos filings with the SEC and previously disclosed under ldquoRisk Factorsrdquo in Item 1A ofAircastlersquos 2018 Annual Report on Form 10-K In addition new risks and uncertainties emerge from time to time and it is not possible for Aircastle to predictor assess the impact of every factor that may cause its actual results to differ from those contained in any forward-looking statements Such forward-lookingstatements speak only as of the date of this presentation Aircastle expressly disclaims any obligation to revise or update publicly any forward-lookingstatement to reflect future events or circumstances
The information contained herein is the property of Aircastle and shall not be disclosed copied distributed or transmitted or used for any purpose withoutthe express written consent of Aircastle
3FIRST QUARTER 2019 EARNINGS CALLbull 05022019
Acquired fourteen aircraft during the first quarter for $445 million Committed to acquire twelve additional aircraft in 2019 for $385 million
2019 acquisitions are all modern in-demand narrow-body aircraft
Sold four aircraft and reclassified two others as direct financing and sales-type leases for gains of $120 million
Repurchased $87 million of our common shares to date at an average price of $1757 per shareAverage Q119 share price of $1991 was 133 higher
Declared our 52nd consecutive quarterly dividend
Committed leases for Ten A320 aircraft repossessed from Avianca Brazil transitioning to LATAM Airlines Group SA and
Seven 737 family aircraft previously leased with Jet Airways
Q119 Highlights
4FIRST QUARTER 2019 EARNINGS CALLbull 05022019
Key Financial Metrics ndash Q119
Net income was $348 million versus $575 million in Q118$046 per diluted common share versus $073 the previous year
Adjusted net income1 was $396 million versus $568 million in Q118
$052 per diluted common share versus $072 the previous yearAdjusted diluted EPS was above FactSet consensus EPS estimate of $046 for Q119
Adjusted EBITDA1 was $1993 million versus $1911 million the prior year
Cash ROE1 was 118 and Net cash interest margin1 was 73The bankruptcies of Avianca Brazil and Jet Airways reduced annualized net cash interest margin by approximately 85bps in Q119
1 Refer to the selected financial Information accompanying this presentation for a reconciliation of GAAP to Non-GAAP numbers
5FIRST QUARTER 2019 EARNINGS CALLbull 05022019
Q119 Revenue Summary
Lease rental revenues of $1897 million up $28million vs Q118
Increase was driven by net fleet growth
Q119 rental revenues were $159 million lower due to the bankruptcies of Avianca Brazil and Jet Airways
Gain on sale up $62 millionSale of four aircraft resulted in a gain on sale of $83 million
$37 million of gain on sale due to reclassification of two other aircraft as direct financing and sales-type leases
Maintenance revenue of $164 million up $44 million due to transitions
Revenue Summary
$ in millions Q119 Q118
Lease Rental and Direct Financing and Sales-Type Lease Revenues $1897 $1869
Amortization of Lease Premiums Discounts and Incentives (57) (31)
Maintenance Revenue 164 120
Total Lease Revenue 2004 1958
Gain on Sale of Flight Equipment 120 58
Other Revenue 16 11
Total Revenues $2139 $2027
6FIRST QUARTER 2019 EARNINGS CALLbull 05022019
Q119 Earnings Summary
Net income decreased $227million versus Q118 adjusted net income down $171 million
Primarily driven by $159 million of unrecognized rental revenue from Avianca Brazil and Jet Airways
Adjusted EBITDA was $1993million up $82 million from Q118
Reflects higher revenues of $112 million partially offset by higher maintenance and other costs of $64 million
Earnings Summary
$ in millions except per share amounts Q119 Q118
Net Income $348 $575
per diluted common share $046 $073
Adjusted Net Income1 $396 $568
per diluted common share $052 $072
EBITDA1 $1918 $1919
Adjusted EBITDA1 $1993 $1911
1 Refer to the selected financial Information accompanying this presentation for a reconciliation of GAAP to Non-GAAP numbers
7FIRST QUARTER 2019 EARNINGS CALLbull 05022019
Q119 Acquisitions amp Sales
Acquired fourteen aircraft in Q119 for $445 million
Committed to acquire twelve additional aircraft for $385 million in 2019
Sold four aircraft for gain on sale of $83 million recognized $37 million of gains from the reclassification of two aircraft as direct financing and sales-type leases
Our 2019 placement task is nearly complete confirmed leases signed for ten Avianca Brazil A320s and seven Jet 737 family aircraft
Q119 Acquisitions amp Sales
Acquisitions1 Completed Sales
Investments Sales Proceeds $445 million $56 million
Total Number of Aircraft 14 4
1 Closed deals only through March 31 2019
8FIRST QUARTER 2019 EARNINGS CALLbull 05022019
Robust Portfolio Management with an Active Asset Strategy
274 aircraft owned and managed at Q119
Since 2015
Acquired 227 aircraft
Sold 116 aircraft
Generated $201 million gains from sales and net proceeds of $25 billion
46
6068
39
14
31 3037
14
4
0
10
20
30
40
50
60
70
80
2015 2016 2017 2018 Q119
Num
ber o
f airc
raft
Purchases Sales
9FIRST QUARTER 2019 EARNINGS CALLbull 05022019
73 of the fleet now consists of more liquidnarrow-body aircraft
versus 36 five years ago
36
49
15
NBs WBs Freighters Classics
73
23
4
NBs WBs Freighters
9336
23
NBs WBs Freighters Classics
229
26
4
NBs WBs Freighters
Fleet EvolutionSignificant Fleet Risk Reduction
Since Q115 the number of wide-body freighter
and classic aircraft declined from a total of 59 aircraft to 30 aircraft
Q115 Aircraft Count Q119 Aircraft Count
Q115 Fleet Type (By NBV) Q119 Fleet Type (By NBV)
Aircastle continues to add in-demand narrow-bodies to the Companyrsquos fleet
10FIRST QUARTER 2019 EARNINGS CALLbull 05022019
Portfolio Metrics
Since Q115 expanded owned fleet at a compound annual growth rate of 71
$ in billions Q115 Q119 Q119 vs Q115
Flight Equipment Held for Lease1 $58 $76 + $18
Wtd Avg Fleet Age (years)2 83 94 + 11
Wtd Avg Lease Term (years)2 56 45 - 11
Managed JV Aircraft1 $05 $07 + $02
1 Calculated using NBV at period end2 Weighted average by NBV
NBV as used throughout this presentation includes the net book value of flight equipment held for lease and the net investment in direct financing and sales-type leases
11FIRST QUARTER 2019 EARNINGS CALLbull 05022019
Diversified Customer Base with Broad Geographic Distribution
86 airline customers in 47countries across the globe
Most top customers are large flag carriers and leading LCCs
Balanced distribution of the aircraft fleet by geographic region
Asia represents 37 of portfolio NBV followed by Europe at 29
South America represents 10 North America 9
Top Ten Lessees of NBV1 per
customer Customer Country Aircraft
gt6 IndiGo India 17
3-6
Lion Air Indonesia 11
LATAM Chile 3
TAP Portugal Portugal 8
Iberia Spain 15
SAA SouthAfrica 4
easyJet UnitedKingdom 20
Jeju Air SouthKorea 9
lt3Aerolineas Argentinas Argentina 5
Interjet Mexico 11
1 As of March 31 2019
Top Ten Countries
Country AC of NBV1
India 28 122
Indonesia 15 66
Russia 11 60
United Kingdom 30 52
South Korea 14 51
Portugal 8 45
Chile 3 44
USA 15 42
Mexico 16 42
Spain 16 41
12FIRST QUARTER 2019 EARNINGS CALLbull 05022019
Leasing Activity and Portfolio Performance
Note Aircraft on-lease days as a percent of total days in period weighted by NBV
937 utilization during Q119 was below trend primarily due to the bankruptcies of Avianca Brazil and Jet Airways
We expect these aircraft to return to service in mid Q219 with utilization to begin normalizing
Three aircraft remaining to be sold or placed in 2019 represents 15 of NBV
Utilization Performance
Utilization has averaged 988 since Q115
80
82
84
86
88
90
92
94
96
98
100
Q1
15
Q1
16
Q1
17
Q1
18
Q1
19
13FIRST QUARTER 2019 EARNINGS CALLbull 05022019
Rental Yields and Net Cash Interest Margins
Approximately 85bps of the reduction reflects unrecognized rental revenue from AviancaBrazil and Jet Airways
105 lease rental yield 12 and 73 net cash interest margin1
114 pro-forma3 lease rental yield12 81 and net cash interest margin13
We expect the net cash interest margin to rebound in the second half of 2019 as the Avianca Brazil and Jet Airways aircraft return to revenue service
0
2
4
6
8
10
12
14
Q1
15
Q2
15
Q3
15
Q4
15
Q1
16
Q2
16
Q3
16
Q4
16
Q1
17
Q2
17
Q3
17
Q4
17
Q1
18
Q2
18
Q3
18
Q4
18
Q1
19
Pro-
form
aQ
119
Lease Rental Yield Net Cash Interest Margin
105
73
1 Refer to the selected financial Information accompanying this presentation for a reconciliation of GAAP to Non-GAAP numbers
2 Lease Rental Yield = Operating and finance lease rental revenue plus direct financing and sales-typelease collections average monthly NBV including direct financing and sales-type leases for the period calculated on a quarterly basis annualized
3 Adds back $159 million of lease rental revenue in Q119 to show the impact of the bankruptcies of Avianca Brazil and Jet Airways on Lease Rental Yield and Net Cash Interest Margin
1 2 13
Pro-forma 23
114
Pro-forma 13
81
14FIRST QUARTER 2019 EARNINGS CALLbull 05022019
Cash ROE Performance
Q119 118
AVG 140
Trailing twelve month Cash ROE1 was 118 versus 160 a year ago
GAAP ROE of 114
Cash flow from operations of $5100 million was $248million lower for LTM ended Q119 versus comparable period a year earlier
Q119 Pro-forma Cash ROE including unrecognized rental revenue of $159 million associated with Avianca Brazil and Jet Airways bankruptcies approximates 1262
1 Refer to the selected financial Information accompanying this presentation for a reconciliation of GAAP to Non-GAAP numbers
2 Adds $159 million of lease rental revenue to the last twelve months Cash Flow From Operations to show the estimated impact of the bankruptcies of AviancaBrazil and Jet Airways on Cash ROE
0
2
4
6
8
10
12
14
16
18
Q1
15
Q2
15
Q3
15
Q4
15
Q1
16
Q2
16
Q3
16
Q4
16
Q1
17
Q2
17
Q3
17
Q4
17
Q1
18
Q2
18
Q3
18
Q4
18
Q1
19
Cash
Ret
urn
on A
vera
ge S
hare
hold
errsquos
Equ
ity
15FIRST QUARTER 2019 EARNINGS CALLbull 05022019
Q119 Capital Structure
Strong liquidity profile and low financial leverage minimal forward commitments
Net debt to equity of 24x84 of total debt was unsecured at quarter-end
Average remaining life of debt is 32 years$500 million note matures in 2019
$705 million in available revolver capacity $375 million drawn from a total of $108 billionUnrestricted cash of $93 million
$63 billion of unencumbered flight equipment ndash 228 aircraft
16FIRST QUARTER 2019 EARNINGS CALLbull 05022019
Selected Financial Guidance Elements for Q219
Guidance Item Q219
Lease rental revenue1 $186 - $190
Direct financing and sales-type lease revenue $8 - $9
Amortization of lease premiums discounts and incentives $(5) - $(6)
Maintenance revenue2 $16 - $20
Gain on sale $4 - $8
Depreciation $87 - $90
Interest net $66 - $69
SGampA3 $18 - $19
Full year effective tax rate 7 - 9
1 Reflects the return to service of Avianca Brazil and Jet Airways aircraft commencing in Q219 2 Includes $101M of net maintenance revenue (maintenance reserves net of a transactional impairment) in connection with the early return of seven aircraft from Jet Airways3 Includes $32M of non-cash share based payment expense
17FIRST QUARTER 2019 EARNINGS CALLbull 05022019
Appendix
18FIRST QUARTER 2019 EARNINGS CALLbull 05022019
Q119 Capital Structure amp Liquidity Summary
Note The debt totals in the above table do not include debt issuance costs or discounts which are reflected in the net debt totals that are displayed on the consolidated balance sheet
Aircastles Capital Structure
As of Mar 31 2019 As of Dec 31 2018 As of Dec 31 2017($ in millions)Unrestricted cash and cash equivalents $ 93 $ 153 $ 212 Debt O S Rate1 O S Rate1 O S Rate1
Total Debt and Weighted Avg Rate 4943 496 4804 499 4358 490Shareholdersrsquo equity 2013 2009 1908 Total capitalization $ 6956 $ 6812 $ 6265
Net debt to equity 24 x 23 x 22 xUnsecured debt to total debt 84 83 80
19FIRST QUARTER 2019 EARNINGS CALLbull 05022019
Supplemental Financial Information
Three Months Ended
March 31in thousands except per share amounts 2019 2018
Revenues $ 213927 $ 202680
EBITDA $ 191817 $ 191941
Adjusted EBITDA $ 199347 $ 191145
Net income $ 34810 $ 57547Net income allocable to common shares $ 34609 $ 57232
Per common share - Basic $ 046 $ 073Per common share - Diluted $ 046 $ 073
Adjusted net income $ 39616 $ 56751Adjusted net income allocable to common shares $ 39387 $ 56440
Per common share - Basic $ 053 $ 072Per common share - Diluted $ 052 $ 072
Basic common shares outstanding 74704 78367Diluted common shares outstanding 75274 78595
20FIRST QUARTER 2019 EARNINGS CALLbull 05022019
Reconciliation of GAAP to Non-GAAP Measures ndash EBITDA and Adjusted EBITDA
We define EBITDA as income (loss) from continuing operations before income taxes interest expense and depreciation and amortization We use EBITDA to assess our consolidated financial and operating performance and we believe this non-US GAAP measure is helpful in identifying trends in our performance
This measure provides an assessment of controllable expenses and affords management the ability to make decisions which are expected to facilitate meeting current financial goals as well as achieving optimal financial performance It provides an indicator for management to determine if adjustments to current spending decisions are needed
EBITDA provides us with a measure of operating performance because it assists us in comparing our operating performance on a consistent basis as it removes the impact of our capital structure (primarily interest charges on our outstanding debt) and asset base (primarily depreciation and amortization) from our operating results
Accordingly this metric measures our financial performance based on operational factors that management can impact in the short-term namely the cost structure or expenses of the organization EBITDA is one of the metrics used by senior management and the board of directors to review the consolidated financial performance of our business
We define Adjusted EBITDA as EBITDA (as defined above) further adjusted to give effect to adjustments required in calculating covenant ratios and compliance as that term is defined in the indenture governing our senior unsecured notes Adjusted EBITDA is a material component of these covenants
2019 2018
Net income $ 34810 $ 57547
Depreciation 84735 75002
Amortization of lease premiums discounts and incentives 5711 3128
Interest net 63463 57108
Income tax provision 3098 (844)
EBITDA 191817 191941
Adjustments
Equity share of joint venture impairment 2724 -
Non-cash share based payment expense 2726 2378
(Gain) loss on MTM of interest rate derivative contracts 2080 (3174)
Adjusted EBITDA $ 199347 $ 191145
Three Mos Ended Dec 31
(Dollars in thousands)
Sheet1
Sheet2
Sheet3
21FIRST QUARTER 2019 EARNINGS CALLbull 05022019
Reconciliation of GAAP to Non-GAAP Measures ndash Adjusted Net Income
Management believes that ANI when viewed in conjunction with the Companyrsquos results under US GAAP and the above reconciliation provides useful information about operating and period-over-period performance and provides additional information that is useful for evaluating the underlying operating performance of our business without regard to periodic reporting elements related to interest rate derivative accounting changes related to refinancing activity and non-cash share based payment expense
1 Included in Other income (expense)2 Included in Selling general and administrative expenses
Net Income Loss on mark-to-market of interest rate derivative contracts(1)
Non-cash share-based payment expense(2)
Adjusted Net Income2726 2378
39616$ 56751$
For the Three Months Ended March 31
2019 2018
34810$ 57547$ 2080 (3174)
Sheet1
22FIRST QUARTER 2019 EARNINGS CALLbull 05022019
Reconciliation of GAAP to non-GAAP Measures - Cash Earnings and Cash ROE
Note LTM Average Shareholdersrsquo Equity is the average of the most recent five quarters period end Shareholdersrsquo Equity Management believes that the cash return on equity metric (ldquoCash ROErdquo) when viewed in conjunction with the Companyrsquos results under US GAAP and the above reconciliation provide useful information about operating and period-over-period performance and provide additional information that is useful for evaluating the underlying operating performance of our business without regard to periodic reporting impacts related to non-cash revenue and expense items and interest rate derivative accounting while recognizing the depreciating nature of our assets To reflect the expected sale of the assets in one of our joint ventures and to simplify the presentation of Cash ROE we are no longer adjusting for joint venture distributions in excess ofless than joint venture earnings recorded under the equity method of investment accounting
Pro-forma Q119 estimates the impact of the Avianca Brazil and Jet Airways bankruptcies on Cash ROE by adding $159 million to Cash Flow From Operations in the first quarter of 2019
1 We define net cash interest margin as lease rentals from operating leases interest income and cash collections from direct financing and sales-type leases minus interest on borrowings net settlements on interest rate derivatives and other liabilities adjusted for loan termination payments divided by the average net book of flight equipment (which includes net investment in direct financing and sales-type leases) for the period calculated on a quarterly and annualized basis The second quarter of 2017 excludes a non-recurring $70 million accelerated collection received from a lessee in connection with a finance lease
2 Excludes loan termination payments of $15 million and $35 million in the first quarter and fourth quarter of 2016 respectively and loan termination payments of $10 million in both the second and third quarters of 2017 and an $08 million loan termination gain in the third quarter of 2018
Management believes that net cash interest margin when viewed in conjunction with the Companyrsquos results under US GAAP and the above reconciliation provides useful information about the effective deployment of our capital in the context of the yield on our aircraft assets the utilization of those assets by our lessees and our ability to borrow efficiently
Except for percentages all figures are $ in thousands
3 Pro-forma Q119 estimates the impact of the Avianca Brazil and Jet Airways bankruptcies on annualized net cash interest margin by adding $159 million to quarterly rental revenue in the first quarter of 2019
As part of the Companyrsquos adoption of ASC 842 we were required to reclassify collections on direct financing and sales-type leases on our Consolidated Statement of Cash Flows for the three months ended March 31 2019 The presentation for the three months ended March 31 2018 has also been reclassified to conform to the current period presentation
Reclassification of Collections on Direct Financing and Sales-Type Leases
Three Months Ended March 31 2018
Net cash and restricted cash provided by operating activities as previously reported $142412
Collections on direct financing and sales-type leases 6493
Net cash and restricted cash provided by operating activities $148905
Except for percentages all figures are in thousands1 For the three months ended March 31 2019 distributed and undistributed earnings to restricted shares was 058 of net income and adjusted net income The amount of restricted share
forfeitures for the period presented is immaterial to the allocation of distributed and undistributed earnings2 For all periods presented dilutive shares represented contingently issuable shares
Weighted-average shares Shares Percent2
Common shares outstanding ndash Basic 74704 9942Unvested restricted common shares 435 058Total weighted-average shares outstanding 75138 10000
Common shares outstanding ndash Basic 74704 9924Effect of dilutive shares1 570 076Common shares outstanding ndash Diluted 75274 10000
Net income allocationNet income $ 34810 10000Distributed and undistributed earnings allocated to unvested restricted shares (201) -058Earnings available to common shares $ 34609 9942
Adjusted net income allocationAdjusted net income $ 39616 10000Amounts allocated to unvested restricted shares (229) -058Amounts allocated to common shares $ 39387 9942
Three Months Ended March 31 2019
Sheet1
27FIRST QUARTER 2019 EARNINGS CALLbull 05022019
Supplemental Financial Information
Except for percentages all figures are in thousands1 For the three months ended March 31 2018 distributed and undistributed earnings to restricted shares was 055 of net income and adjusted net income The amount of restricted share
forfeitures for the period presented is immaterial to the allocation of distributed and undistributed earnings2 For all periods presented dilutive shares represented contingently issuable shares
Weighted-average shares Shares Percent2
Common shares outstanding ndash Basic 78367 9945Unvested restricted common shares 431 055Total weighted-average shares outstanding 78798 10000
Common shares outstanding ndash Basic 78367 9971Effect of dilutive shares1 228 029Common shares outstanding ndash Diluted 78595 10000
Net income allocationNet income $ 57547 10000Distributed and undistributed earnings allocated to unvested restricted shares (315) -055Earnings available to common shares $ 57232 9945
Adjusted net income allocationAdjusted net income $ 56751 10000Amounts allocated to unvested restricted shares (311) -055Amounts allocated to common shares $ 56440 9945
Three Months Ended March 31 2018
Sheet1
28FIRST QUARTER 2019 EARNINGS CALLbull 05022019
Limitations of EBITDA Adjusted EBITDA ANI Cash ROE and Net Cash Interest Margin
An investor or potential investor may find EBITDA Adjusted EBITDA ANI Cash Earnings Cash ROE and Net Cash Interest Margin important measures in evaluating our performance results of operations and financial position We use these non-US GAAP measures to supplement our US GAAP results in order to provide a more complete understanding of the factors and trends affecting our business
EBITDA Adjusted EBITDA ANI Cash Earnings Cash ROE and Net Cash Interest Margin have limitations as analytical tools and should not be viewed in isolation or as substitutes for US GAAP measures of earnings Material limitations in making the adjustments to ourearnings to calculate EBITDA Adjusted EBITDA ANI Cash Earnings Cash ROE and Net Cash Interest Margin and using these non-US GAAP measures as compared to US GAAP net income income from continuing operations and cash flows provided by or used in operations include
depreciation and amortization though not directly affecting our current cash position represent the wear and tear andor reduction in value of our aircraft which affects the aircraftrsquos availability for use and may be indicative of future needs for capital expenditures
the cash portion of income tax (benefit) provision generally represents charges (gains) which may significantly affect our financial results
elements of our interest rate derivative accounting may be used to evaluate the effectiveness of our hedging policy
hedge loss amortization charges related to Term Financing No 1 and Securitization No 1 and
adjustments required in calculating covenant ratios and compliance as that term is defined in the indenture governing our seniorunsecured notes
EBITDA Adjusted EBITDA ANI Cash Earnings Cash ROE and Net Cash Interest Margin are not alternatives to net income income from operations or cash flows provided by or used in operations as calculated and presented in accordance with US GAAP You should not rely on these non-US GAAP measures as a substitute for any such US GAAP financial measure We strongly urge you to review the reconciliations to US GAAP net income along with our consolidated financial statements included elsewhere in our Annual Report We also strongly urge you to not rely on any single financial measure to evaluate our business In addition because EBITDA Adjusted EBITDA ANI Cash Earnings Cash ROE and Net Cash Interest Margin are not measures of financial performance under US GAAP and are susceptible to varying calculations EBITDA Adjusted EBITDA ANI Cash Earnings Cash ROE and Net Cash Interest Margin as presented here may differ from and may not be comparable to similarly titled measures used by other companies
Slide Number 1
Slide Number 2
Slide Number 3
Slide Number 4
Slide Number 5
Slide Number 6
Slide Number 7
Slide Number 8
Slide Number 9
Slide Number 10
Slide Number 11
Slide Number 12
Slide Number 13
Slide Number 14
Slide Number 15
Slide Number 16
Slide Number 17
Slide Number 18
Slide Number 19
Slide Number 20
Slide Number 21
Slide Number 22
Slide Number 23
Slide Number 24
Slide Number 25
Slide Number 26
Slide Number 27
Slide Number 28
Three Months Ended March 31 2019
Three Months Ended March 31 2019
Weighted-average shares
Shares
Percent2
Weighted-average shares
Shares
Percent2
Common shares outstanding ndash Basic
74704
9942
Common shares outstanding ndash Basic
74704
9942
Unvested restricted common shares
435
058
Unvested restricted common shares
435
058
Total weighted-average shares outstanding
75138
10000
Total weighted-average shares outstanding
75138
10000
Common shares outstanding ndash Basic
74704
9924
Common shares outstanding ndash Basic
74704
9924
Effect of dilutive shares1
570
076
Effect of dilutive shares1
570
076
Common shares outstanding ndash Diluted
75274
10000
Common shares outstanding ndash Diluted
75274
10000
Net income allocation
Net income allocation
Net income
$
34810
10000
Net income
$
34810
10000
Distributed and undistributed earnings allocated to unvested restricted shares
(201)
-058
Distributed and undistributed earnings allocated to unvested restricted shares
(201)
-058
Earnings available to common shares
$
34609
9942
Earnings available to common shares
$
34609
9942
Adjusted net income allocation
Adjusted net income allocation
Adjusted net income
$
39616
10000
Adjusted net income
$
39616
10000
Amounts allocated to unvested restricted shares
(229)
-058
Amounts allocated to unvested restricted shares
(229)
-058
Amounts allocated to common shares
$
39387
9942
Amounts allocated to common shares
$
39387
9942
Three Months Ended March 31 2018
Three Months Ended March 31 2018
Weighted-average shares
Shares
Percent2
Weighted-average shares
Shares
Percent2
Common shares outstanding ndash Basic
78367
9945
Common shares outstanding ndash Basic
78367
9945
Unvested restricted common shares
431
055
Unvested restricted common shares
431
055
Total weighted-average shares outstanding
78798
10000
Total weighted-average shares outstanding
78798
10000
Common shares outstanding ndash Basic
78367
9971
Common shares outstanding ndash Basic
78367
9971
Effect of dilutive shares1
228
029
Effect of dilutive shares1
228
029
Common shares outstanding ndash Diluted
78595
10000
Common shares outstanding ndash Diluted
78595
10000
Net income allocation
Net income allocation
Net income
$
57547
10000
Net income
$
57547
10000
Distributed and undistributed earnings allocated to unvested restricted shares
(315)
-055
Distributed and undistributed earnings allocated to unvested restricted shares
(315)
-055
Earnings available to common shares
$
57232
9945
Earnings available to common shares
$
57232
9945
Adjusted net income allocation
Adjusted net income allocation
Adjusted net income
$
56751
10000
Adjusted net income
$
56751
10000
Amounts allocated to unvested restricted shares
(311)
-055
Amounts allocated to unvested restricted shares
(311)
-055
Amounts allocated to common shares
$
56440
9945
Amounts allocated to common shares
$
56440
9945
Three Months Ended March 31 2019
Three Months Ended March 31 2019
Weighted-average shares
Shares
Percent2
Weighted-average shares
Shares
Percent2
Common shares outstanding ndash Basic
74704
9942
Common shares outstanding ndash Basic
74704
9942
Unvested restricted common shares
435
058
Unvested restricted common shares
435
058
Total weighted-average shares outstanding
75138
10000
Total weighted-average shares outstanding
75138
10000
Common shares outstanding ndash Basic
74704
9924
Common shares outstanding ndash Basic
74704
9924
Effect of dilutive shares1
570
076
Effect of dilutive shares1
570
076
Common shares outstanding ndash Diluted
75274
10000
Common shares outstanding ndash Diluted
75274
10000
Net income allocation
Net income allocation
Net income
$
34810
10000
Net income
$
34810
10000
Distributed and undistributed earnings allocated to unvested restricted shares
(201)
-058
Distributed and undistributed earnings allocated to unvested restricted shares
(201)
-058
Earnings available to common shares
$
34609
9942
Earnings available to common shares
$
34609
9942
Adjusted net income allocation
Adjusted net income allocation
Adjusted net income
$
39616
10000
Adjusted net income
$
39616
10000
Amounts allocated to unvested restricted shares
(229)
-058
Amounts allocated to unvested restricted shares
(229)
-058
Amounts allocated to common shares
$
39387
9942
Amounts allocated to common shares
$
39387
9942
Three Months Ended March 31 2018
Three Months Ended March 31 2018
Weighted-average shares
Shares
Percent2
Weighted-average shares
Shares
Percent2
Common shares outstanding ndash Basic
78367
9945
Common shares outstanding ndash Basic
78367
9945
Unvested restricted common shares
431
055
Unvested restricted common shares
431
055
Total weighted-average shares outstanding
78798
10000
Total weighted-average shares outstanding
78798
10000
Common shares outstanding ndash Basic
78367
9971
Common shares outstanding ndash Basic
78367
9971
Effect of dilutive shares1
228
029
Effect of dilutive shares1
228
029
Common shares outstanding ndash Diluted
78595
10000
Common shares outstanding ndash Diluted
78595
10000
Net income allocation
Net income allocation
Net income
$
57547
10000
Net income
$
57547
10000
Distributed and undistributed earnings allocated to unvested restricted shares
(315)
-055
Distributed and undistributed earnings allocated to unvested restricted shares
(315)
-055
Earnings available to common shares
$
57232
9945
Earnings available to common shares
$
57232
9945
Adjusted net income allocation
Adjusted net income allocation
Adjusted net income
$
56751
10000
Adjusted net income
$
56751
10000
Amounts allocated to unvested restricted shares
(311)
-055
Amounts allocated to unvested restricted shares
(311)
-055
Amounts allocated to common shares
$
56440
9945
Amounts allocated to common shares
$
56440
9945
Q119
Q418
Q318
Q119 B (W) vs Q418
Average NBV for the 4th and 3rd Quarters of 2018
$ 7449957
$ 7136627
$ 6787206
$ 313330
Average NBV 44 higher Q418 to Q119
Operating and Finance Lease Revenues
$ 189676
$ 192711
$ 190836
$ (3034)
Finance Lease Collections
$ 5925
$ 7316
$ 9518
$ (1391)
Annualized Portfolio Yield
105
112
118
-07
Annualized yield 71bps lower
Cash Interest Expense
$ 60279
$ 60348
$ 54521
$ 69
Annualized Cash Interest
32
34
32
01
Annualized cash int exp 15bps lower
Annualized Cash Net Interest Margin
73
78
86
-06
Annualized cash margin 56bps lower
Average NBV
Quarterly Rental Revenue(1)
Cash Interest(2)
Annualized Net Cash Interest Margin(1)(2)
Yield
Cash Interest Expense
Q112
$ 4388008
$ 152242
$ 44969
98
139
410
Q212
$ 4542477
$ 156057
$ 48798
94
137
430
Q312
$ 4697802
$ 163630
$ 41373
104
139
352
Q412
$ 4726457
$ 163820
$ 43461
102
139
368
Q113
$ 4740161
$ 162319
$ 48591
96
137
410
Q213
$ 4840396
$ 164239
$ 44915
99
136
371
Q313
$ 4863444
$ 167876
$ 47682
99
138
392
Q413
$ 5118601
$ 176168
$ 49080
99
138
384
Q114
$ 5312651
$ 181095
$ 51685
97
136
389
Q214
$ 5721521
$ 190574
$ 48172
100
133
337
Q314
$ 5483958
$ 182227
$ 44820
100
133
327
Q414
$ 5468637
$ 181977
$ 44459
101
133
325
Q115
$ 5743035
$ 181027
$ 50235
91
126
350
Q215
$ 5967898
$ 189238
$ 51413
92
127
345
Q315
$ 6048330
$ 191878
$ 51428
93
127
340
Q415
$ 5962874
$ 188491
$ 51250
92
126
344
Q116
$ 5988076
$ 186730
$ 51815
90
125
346
Q216
$ 5920030
$ 184469
$ 55779
87
125
377
Q316
$ 6265175
$ 193909
$ 57589
87
124
368
Q416
$ 6346361
$ 196714
$ 58631
87
124
370
Q117
$ 6505355
$ 200273
$ 58839
87
123
362
Q217
$ 6512100
$ 199522
$ 55871
88
123
343
Q317
$ 5985908
$ 184588
$ 53457
88
123
357
Q417
$ 6247581
$ 187794
$ 53035
86
120
340
Q118
$ 6700223
$ 193418
$ 53978
83
115
322
Q218
$ 6721360
$ 193988
$ 53979
83
115
321
Q318
$ 6787206
$ 200354
$ 54521
86
118
321
Q418
$ 7136627
$ 200027
$ 60348
78
112
338
Q119
$ 7449957
$ 195601
$ 60279
73
105
324
Pro-forma Q119
$ 7449957
$ 211501
$ 60279
81
114
324
Average NBV
Quarterly Rental Revenue1
Cash Interest2
Annualized Net Cash Interest Margin12
Yield
Cash Interest Expense
Q113
$ 4740161
$ 162319
$ 48591
96
137
410
Q213
$ 4840396
$ 164239
$ 44915
99
136
371
Q313
$ 4863444
$ 167876
$ 47682
99
138
392
Q413
$ 5118601
$ 176168
$ 49080
99
138
384
Q114
$ 5312651
$ 181095
$ 51685
97
136
389
Q214
$ 5721521
$ 190574
$ 48172
100
133
337
Q314
$ 5483958
$ 182227
$ 44820
100
133
327
Q414
$ 5468637
$ 181977
$ 44459
101
133
325
Q115
$ 5743035
$ 181027
$ 50235
91
126
350
Q215
$ 5967898
$ 189238
$ 51413
92
127
345
Q315
$ 6048330
$ 191878
$ 51428
93
127
340
Q415
$ 5962874
$ 188491
$ 51250
92
126
344
Q116
$ 5988076
$ 186730
$ 51815
90
125
346
Q216
$ 5920030
$ 184469
$ 55779
87
125
377
Q316
$ 6265175
$ 193909
$ 57589
87
124
368
Q416
$ 6346361
$ 196714
$ 58631
87
124
370
Q117
$ 6505355
$ 200273
$ 58839
87
123
362
Q217
$ 6512100
$ 199522
$ 55871
88
123
343
Q317
$ 5985908
$ 184588
$ 53457
88
123
357
Q417
$ 6247581
$ 187794
$ 53035
86
120
340
Q118
$ 6700223
$ 193418
$ 53978
83
115
322
Q218
$ 6721360
$ 193988
$ 53979
83
115
321
Q318
$ 6787206
$ 200354
$ 54521
86
118
321
Q418
$ 7136627
$ 200027
$ 60348
78
112
338
Q119
$ 7449957
$ 195601
$ 60279
73
105
324
Pro-forma Q119
$ 7449957
$ 211501
$ 60279
81
114
324
NBV FE
Fin Lease
NBV Flight Equip + Fin Lease
Lease Rentals
Interest Inc Fin lease
Collections on Fin Leases
Total Lease Rent Collections
Quarterly Lease rent Collections
Cash Interest
Loan and Contract Termination Fees included in Cash Interest
Adj Cash Int
NIM $
NIM
Yield
Cash Int
Month End
Month End
Month End
Mo Avg
Qtrly Avg
MTD
MTD
QTD
QTD
QTD
DEC10
4065780
- 0
4065780
JAN11
3981690
- 0
3981690
4023735
- 0
47091
- 0
- 0
47091
- 0
- 0
- 0
FEB11
4051167
- 0
4051167
4016428
- 0
47264
- 0
- 0
47264
- 0
- 0
- 0
MAR11
4120309
- 0
4120309
4085738
4041967
46761
- 0
- 0
46761
141116
$ 41278
41278
99838
988
APR11
4125377
- 0
4125377
4122843
- 0
47211
- 0
- 0
47211
- 0
- 0
- 0
MAY11
4194987
- 0
4194987
4160182
- 0
47897
- 0
- 0
47897
- 0
- 0
- 0
JUN11
4099641
- 0
4099641
4147314
4143446
48248
- 0
- 0
48248
143356
$ 43217
$ 3196
40021
103335
998
JUL11
4271013
- 0
4271013
4185327
- 0
47994
- 0
- 0
47994
- 0
- 0
- 0
AUG11
4248242
- 0
4248242
4259628
- 0
49193
- 0
- 0
49193
- 0
- 0
- 0
SEP11
4196918
- 0
4196918
4222580
4222512
48704
- 0
- 0
48704
145890
$ 42066
42066
103824
984
OCT11
4430527
- 0
4430527
4313723
- 0
49054
- 0
- 0
49054
- 0
- 0
- 0
NOV11
4401782
- 0
4401782
4416155
- 0
50498
- 0
- 0
50498
- 0
- 0
- 0
DEC11
4387986
- 0
4387986
4394884
4374921
50297
- 0
- 0
50297
149848
$ 43041
43041
106807
977
JAN12
4391666
- 0
4391666
4389826
- 0
51034
- 0
- 0
51034
- 0
- 0
- 0
FEB12
4385360
- 0
4385360
4388513
- 0
49705
- 0
- 0
49705
- 0
- 0
- 0
MAR12
4386010
- 0
4386010
4385685
4388008
51503
- 0
- 0
51503
152242
$ 44969
44969
107273
978
APR12
4484956
- 0
4484956
4435483
- 0
50824
- 0
- 0
50824
- 0
- 0
- 0
MAY12
4570712
31500
4602212
4543584
- 0
51020
- 0
- 0
51020
- 0
- 0
- 0
JUN12
4604493
90024
4694518
4648365
4542477
51781
956
1476
54213
156057
$ 48798
48798
107259
944
JUL12
4572121
90739
4662860
4678689
- 0
52892
963
- 0
53855
- 0
- 0
- 0
AUG12
4665966
90332
4756298
4709579
- 0
52945
948
- 0
53893
- 0
- 0
- 0
SEP12
4532445
121533
4653978
4705138
4697802
53709
1608
565
55881
163630
$ 41373
41373
122257
1041
OCT12
4574055
120934
4694990
4674484
- 0
52277
1311
- 0
53588
- 0
- 0
- 0
NOV12
4645741
120345
4766086
4730538
- 0
52596
1321
- 0
53917
- 0
- 0
- 0
DEC12
4662661
119951
4782612
4774349
4726457
53217
1286
1811
56314
163820
$ 43461
43461
120359
1019
JAN13
4639414
119339
4758753
4770682
- 0
52957
1298
- 0
54255
- 0
- 0
- 0
FEB13
4614480
118707
4733187
4745970
- 0
51936
1277
- 0
53213
- 0
- 0
- 0
MAR13
4544773
129700
4674474
4703830
4740161
51697
1309
1845
54850
162319
$ 48591
48591
113728
960
APR13
4621392
128981
4750373
4712423
- 0
51363
1384
- 0
52747
- 0
- 0
- 0
MAY13
4915814
128237
5044051
4897212
- 0
53613
1359
- 0
54972
- 0
- 0
- 0
JUN13
4651553
127504
4779057
4911554
4840396
52942
1370
2207
56520
164239
$ 47869
$ 2954
44915
119324
986
JUL13
4668642
149932
4818574
4798816
- 0
52469
1372
- 0
53840
- 0
- 0
- 0
AUG13
4690154
149017
4839171
4828873
- 0
53339
1423
- 0
54763
- 0
- 0
- 0
SEP13
4938113
148005
5086118
4962645
4863444
55340
1327
2606
59273
167876
$ 47682
47682
120194
989
OCT13
4913184
147017
5060200
5073159
- 0
56643
1350
- 0
57993
- 0
- 0
- 0
NOV13
5011676
146076
5157752
5108976
- 0
56264
1361
- 0
57625
- 0
- 0
- 0
DEC13
5044410
145173
5189583
5173668
5118601
56367
1333
2850
60550
176168
$ 49080
49080
127088
993
JAN14
5015452
144256
5159708
5174646
- 0
58142
1337
- 0
59478
- 0
- 0
- 0
FEB14
5129035
143356
5272392
5216050
- 0
57572
1354
- 0
58926
- 0
- 0
- 0
MAR14
5679723
142400
5822123
5547257
5312651
58621
1297
2773
62691
181095
$ 51685
51685
129410
974
APR14
5605462
155551
5761013
5791568
- 0
61276
1329
- 0
62604
- 0
- 0
- 0
MAY14
5512769
154435
5667205
5714109
- 0
60998
1338
- 0
62336
- 0
- 0
- 0
JUN14
5577966
72600
5650566
5658886
5721521
60957
1231
3446
65634
190574
$ 48172
48172
142402
996
JUL14
5418990
71971
5490961
5570764
- 0
60509
484
- 0
60993
- 0
- 0
- 0
AUG14
5412453
71345
5483799
5487380
- 0
59617
488
- 0
60105
- 0
- 0
- 0
SEP14
5232940
70723
5303663
5393731
5483958
58760
491
1877
61129
182227
$ 44820
44820
137407
1002
OCT14
5340303
88360
5428663
5366163
- 0
59394
480
- 0
59874
- 0
- 0
- 0
NOV14
5374566
107667
5482233
5455448
- 0
59717
542
- 0
60259
- 0
- 0
- 0
DEC14
5579718
106651
5686369
5584301
5468637
59091
537
2216
61844
181977
$ 44459
44459
137518
1006
1331
325
134
99
JAN15
5642590
105896
5748487
5717428
- 0
59898
539
- 0
60437
- 0
- 0
- 0
FEB15
5623616
105155
5728770
5738628
- 0
58688
552
- 0
59240
- 0
- 0
- 0
MAR15
5712950
104377
5817327
5773049
5743035
58560
516
2274
61350
181027
$ 50235
50235
130792
911
1261
350
APR15
5778092
119625
5897717
5857522
- 0
60016
589
- 0
60605
- 0
- 0
- 0
MAY15
5940205
118903
6059108
5978412
- 0
61684
628
- 0
62311
- 0
- 0
- 0
JUN15
5953555
122855
6076411
6067759
5967898
63140
660
2521
66322
189238
$ 51413
51413
137825
924
1268
345
JUL15
5942037
122200
6064238
6070324
- 0
63838
625
- 0
64463
- 0
- 0
- 0
AUG15
5917660
121542
6039202
6051720
- 0
62322
623
- 0
62945
- 0
- 0
- 0
SEP15
5885807
120882
6006689
6022946
6048330
61877
620
1973
64470
191878
$ 51428
51428
140450
929
1269
340
OCT15
5829040
103074
5932114
5969402
- 0
61959
611
- 0
62570
- 0
- 0
- 0
NOV15
5801167
117861
5919028
5925571
- 0
60485
623
- 0
61108
- 0
- 0
- 0
DEC15
5867062
201211
6068273
5993651
5962874
60949
1072
2791
64812
188491
$ 51250
51250
137241
921
1264
344
127
92
JAN16
5836479
198445
6034923
6051598
- 0
60245
1141
- 0
61387
- 0
- 0
- 0
FEB16
5796230
213436
6009666
6022295
- 0
60098
1161
- 0
61259
- 0
- 0
- 0
MAR16
5558666
212336
5771002
5890334
5988076
59227
1195
3663
64085
186730
$ 53324
1509
51815
134915
901
1247
346
APR16
5654825
211354
5866179
5818591
- 0
58383
1160
- 0
59544
- 0
- 0
- 0
MAY16
5659238
265253
5924490
5895335
- 0
58787
1432
- 0
60218
- 0
- 0
- 0
JUN16
5875935
291903
6167838
6046164
5920030
58955
1582
4170
64707
184469
55779
55779
128690
870
1246
377
JUL16
5980982
290048
6271030
6219434
- 0
60301
1805
- 0
62107
- 0
- 0
- 0
AUG16
6017274
288131
6305405
6288218
- 0
60757
1744
- 0
62501
- 0
- 0
- 0
SEP16
6004489
265854
6270343
6287874
6265175
60917
1805
6580
69301
193909
57589
57589
136320
870
1238
368
OCT16
6025556
264389
6289945
6280144
- 0
61757
1413
63170
- 0
- 0
- 0
NOV16
6097520
262667
6360187
6325066
- 0
62824
1357
64181
- 0
- 0
- 0
DEC16
6246707
260853
6507560
6433874
6346361
62969
1394
5000
69363
196714
62082
3451
58631
138083
870
1240
370
124
88
JAN17
6219012
259264
6478276
6492918
- 0
63296
1359
64655
- 0
FEB17
6227957
257474
6485431
6481853
- 0
63575
1288
64863
- 0
MAR17
6297190
299969
6597159
6541295
6505355
63715
1426
5614
70755
200273
58839
58839
141434
870
1231
362
APR17
6269189
348327
6617516
6607338
64119
1814
65933
MAY17
6156371
377186
6533557
6575537
63186
2079
65265
JUN17
5818821
354474
6173295
6353426
6512100
61794
1985
4545
68324
199522
56859
988
55871
143651
882
1226
343
JUL17
5615695
352411
5968106
6070700
59464
1954
61418
AUG17
5523543
390140
5913683
5940895
56603
1917
58520
SEP17
5490164
488408
5978572
5946128
5985908
55621
2541
6488
64650
184588
54527
1070
53457
131131
876
1233
357
OCT17
5493432
549212
6042644
6010608
55282
2833
58115
NOV17
5789587
554117
6343704
6193174
56823
3248
60071
DEC17
6188469
545750
6734219
6538962
6247581
57826
3272
8511
69609
187794
53035
53035
134759
863
1202
340
122
87
JAN18
6163924
543311
6707235
6720727
59570
3212
62782
FEB18
6173766
514024
6687790
6697513
59177
3007
62184
MAR18
6143695
533373
6677067
6682429
6700223
58736
3222
6493
68451
193418
53978
53978
139440
832
1155
322
APR18
6120068
531077
6651145
6664106
58481
2936
61417
MAY18
6257826
528503
6786329
6718737
59975
3015
62990
JUN18
6249406
526738
6776144
6781236
6721360
60030
2918
6634
69582
193988
53979
53979
140009
833
1154
321
12 MONTH CALCULATION
JUL18
6261431
523491
6784922
6780533
60815
2990
63804
Yield
NIM
AUG18
6250137
519066
6769203
6777062
60517
2927
63444
2014
134
99
SEP18
6321623
517221
6838844
6804023
6787206
60712
2876
9518
73106
200354
53683
-838
54521
145833
859
1181
321
2015
127
92
OCT18
6602809
515251
7118060
6978452
62875
2742
65617
2016
124
88
NOV18
6657588
512429
7170017
7144039
61402
2610
64012
2017
122
87
DEC18
6935585
469180
7404765
7287391
7136627
60405
2677
7316
70398
200027
60348
60348
139679
783
1121
338
115
83
2018
115
83
JAN19
6900489
509725
7410214
7407489
59462
2959
62421
LTM Q119
112
80
FEB19
6907294
507653
7414948
7412581
62458
2701
65158
MAR19
7138689
505964
7644653
7529800
7449957
59314
2783
5925
68022
195601
60279
60279
135322
727
1050
324
112
80
wCollections on Finance Leases
2019
2018
2017
Finance Lease Collections
Finance Lease Collections
Finance Lease Collections
Yield
Cash Interest
Net Spread
Avg NBV
Lease Rent
Interest
YTD
5925
YTD
29961
YTD
32184
Q117
1231
362
870
6505355
200273
$ 58839
Q119
5925
Q118
6493
Q117
5614
Q119
1050
324
727
7449957
195601
60279
Q219
Q218
6634
Q217
11571
-181
-038
-143
Change
145
-23
24
Q319
Q318
9518
Q317
6488
Q419
Q418
7316
Q417
8511
Yield
Cash Interest
Net Spread
Avg NBV
Lease Rent
Interest
Finance Lease Revenue
Finance Lease Revenue
Finance Lease Revenue
Q118
1155
322
832
6700223
193418
53978
Q119
8442
Q418
8029
Q417
9353
Q119
1050
324
727
7449957
195601
60279
January
2959
October
2742
October
2833
-104
001
-106
Change
112
11
117
February
2701
November
2610
November
3248
March
2783
December
2677
December
3272
Yield
Cash Interest
Net Spread
Avg NBV
Lease Rent
Interest
Q418
1121
338
783
7136627
200027
60348
Collections on Finance Leases excludes $70 million of unusual payments received from KLM in Q217
Q119
1050
324
727
7449957
195601
60279
-071
-015
-056
Change
44
-22
-01
112
w$17mm added to Q119
11
Actual
1050
324
727
Revised
1141
324
818
091
091
wCollections on Finance Leases
Yield
Cash Interest
Net Spread
Q314
13292
3269
1002
Q316
12380
3677
870
-0911
0408
-132
Yield
Cash Interest
Net Spread
Q315
12690
3401
929
Q316
12380
3677
870
-0310
0276
-059
Yield
Cash Interest
Net Spread
Q216
12464
3769
870
Q316
12380
3677
870
-0084
-0092
001
Old Format
Yield
Cash Interest
Net Spread
Q314
13221
3312
991
Q316
12173
3852
832
-1047
-0540
-159
Yield
Cash Interest
Net Spread
Q315
12691
3471
922
Q316
12173
3852
832
-0518
-0381
-090
Yield
Cash Interest
Net Spread
Q216
12409
3930
8479
Q316
12173
3852
8321
Change
-0236
0078
-0159
For the Three Months Ended March 31
2019
2018
Net Income
$ 34810
$ 57547
(Gain) loss on mark-to-market of interest rate derivative contracts(1)
2080
(3174)
Non-cash share-based payment expense(2)
2726
2378
Adjusted Net Income
$ 39616
$ 56751
For the Three Months Ended March 31
2019
2018
Net Income
$ 34810
$ 57547
Loss on mark-to-market of interest rate derivative contracts(1)
2080
(3174)
Non-cash share-based payment expense(2)
2726
2378
Adjusted Net Income
$ 39616
$ 56751
Three Mos Ended Dec 31
2019
2018
(Dollars in thousands)
Net income
$ 34810
$ 57547
Depreciation
84735
75002
Amortization of lease premiums discounts and incentives
5711
3128
Interest net
63463
57108
Income tax provision
3098
(844)
EBITDA
191817
191941
Adjustments
Equity share of joint venture impairment
2724
-
Non-cash share based payment expense
2726
2378
(Gain) loss on MTM of interest rate derivative contracts
2080
(3174)
Adjusted EBITDA
$ 199347
$ 191145
Three Mos Ended Dec 31
2019
2018
(Dollars in thousands)
Net income
$ 34810
$ 57547
Depreciation
84735
75002
Amortization of lease premiums discounts and incentives
5711
3128
Interest net
63463
57108
Income tax provision
3098
(844)
EBITDA
191817
191941
Adjustments
Equity share of joint venture impairment
2724
- 0
Non-cash share based payment expense
2726
2378
(Gain) loss on MTM of interest rate derivative contracts
2080
(3174)
Adjusted EBITDA
$ 199347
$ 191145
17FIRST QUARTER 2019 EARNINGS CALLbull 05022019
Appendix
18FIRST QUARTER 2019 EARNINGS CALLbull 05022019
Q119 Capital Structure amp Liquidity Summary
Note The debt totals in the above table do not include debt issuance costs or discounts which are reflected in the net debt totals that are displayed on the consolidated balance sheet
Aircastles Capital Structure
As of Mar 31 2019 As of Dec 31 2018 As of Dec 31 2017($ in millions)Unrestricted cash and cash equivalents $ 93 $ 153 $ 212 Debt O S Rate1 O S Rate1 O S Rate1
Total Debt and Weighted Avg Rate 4943 496 4804 499 4358 490Shareholdersrsquo equity 2013 2009 1908 Total capitalization $ 6956 $ 6812 $ 6265
Net debt to equity 24 x 23 x 22 xUnsecured debt to total debt 84 83 80
19FIRST QUARTER 2019 EARNINGS CALLbull 05022019
Supplemental Financial Information
Three Months Ended
March 31in thousands except per share amounts 2019 2018
Revenues $ 213927 $ 202680
EBITDA $ 191817 $ 191941
Adjusted EBITDA $ 199347 $ 191145
Net income $ 34810 $ 57547Net income allocable to common shares $ 34609 $ 57232
Per common share - Basic $ 046 $ 073Per common share - Diluted $ 046 $ 073
Adjusted net income $ 39616 $ 56751Adjusted net income allocable to common shares $ 39387 $ 56440
Per common share - Basic $ 053 $ 072Per common share - Diluted $ 052 $ 072
Basic common shares outstanding 74704 78367Diluted common shares outstanding 75274 78595
20FIRST QUARTER 2019 EARNINGS CALLbull 05022019
Reconciliation of GAAP to Non-GAAP Measures ndash EBITDA and Adjusted EBITDA
We define EBITDA as income (loss) from continuing operations before income taxes interest expense and depreciation and amortization We use EBITDA to assess our consolidated financial and operating performance and we believe this non-US GAAP measure is helpful in identifying trends in our performance
This measure provides an assessment of controllable expenses and affords management the ability to make decisions which are expected to facilitate meeting current financial goals as well as achieving optimal financial performance It provides an indicator for management to determine if adjustments to current spending decisions are needed
EBITDA provides us with a measure of operating performance because it assists us in comparing our operating performance on a consistent basis as it removes the impact of our capital structure (primarily interest charges on our outstanding debt) and asset base (primarily depreciation and amortization) from our operating results
Accordingly this metric measures our financial performance based on operational factors that management can impact in the short-term namely the cost structure or expenses of the organization EBITDA is one of the metrics used by senior management and the board of directors to review the consolidated financial performance of our business
We define Adjusted EBITDA as EBITDA (as defined above) further adjusted to give effect to adjustments required in calculating covenant ratios and compliance as that term is defined in the indenture governing our senior unsecured notes Adjusted EBITDA is a material component of these covenants
2019 2018
Net income $ 34810 $ 57547
Depreciation 84735 75002
Amortization of lease premiums discounts and incentives 5711 3128
Interest net 63463 57108
Income tax provision 3098 (844)
EBITDA 191817 191941
Adjustments
Equity share of joint venture impairment 2724 -
Non-cash share based payment expense 2726 2378
(Gain) loss on MTM of interest rate derivative contracts 2080 (3174)
Adjusted EBITDA $ 199347 $ 191145
Three Mos Ended Dec 31
(Dollars in thousands)
Sheet1
Sheet2
Sheet3
21FIRST QUARTER 2019 EARNINGS CALLbull 05022019
Reconciliation of GAAP to Non-GAAP Measures ndash Adjusted Net Income
Management believes that ANI when viewed in conjunction with the Companyrsquos results under US GAAP and the above reconciliation provides useful information about operating and period-over-period performance and provides additional information that is useful for evaluating the underlying operating performance of our business without regard to periodic reporting elements related to interest rate derivative accounting changes related to refinancing activity and non-cash share based payment expense
1 Included in Other income (expense)2 Included in Selling general and administrative expenses
Net Income Loss on mark-to-market of interest rate derivative contracts(1)
Non-cash share-based payment expense(2)
Adjusted Net Income2726 2378
39616$ 56751$
For the Three Months Ended March 31
2019 2018
34810$ 57547$ 2080 (3174)
Sheet1
22FIRST QUARTER 2019 EARNINGS CALLbull 05022019
Reconciliation of GAAP to non-GAAP Measures - Cash Earnings and Cash ROE
Note LTM Average Shareholdersrsquo Equity is the average of the most recent five quarters period end Shareholdersrsquo Equity Management believes that the cash return on equity metric (ldquoCash ROErdquo) when viewed in conjunction with the Companyrsquos results under US GAAP and the above reconciliation provide useful information about operating and period-over-period performance and provide additional information that is useful for evaluating the underlying operating performance of our business without regard to periodic reporting impacts related to non-cash revenue and expense items and interest rate derivative accounting while recognizing the depreciating nature of our assets To reflect the expected sale of the assets in one of our joint ventures and to simplify the presentation of Cash ROE we are no longer adjusting for joint venture distributions in excess ofless than joint venture earnings recorded under the equity method of investment accounting
Pro-forma Q119 estimates the impact of the Avianca Brazil and Jet Airways bankruptcies on Cash ROE by adding $159 million to Cash Flow From Operations in the first quarter of 2019
1 We define net cash interest margin as lease rentals from operating leases interest income and cash collections from direct financing and sales-type leases minus interest on borrowings net settlements on interest rate derivatives and other liabilities adjusted for loan termination payments divided by the average net book of flight equipment (which includes net investment in direct financing and sales-type leases) for the period calculated on a quarterly and annualized basis The second quarter of 2017 excludes a non-recurring $70 million accelerated collection received from a lessee in connection with a finance lease
2 Excludes loan termination payments of $15 million and $35 million in the first quarter and fourth quarter of 2016 respectively and loan termination payments of $10 million in both the second and third quarters of 2017 and an $08 million loan termination gain in the third quarter of 2018
Management believes that net cash interest margin when viewed in conjunction with the Companyrsquos results under US GAAP and the above reconciliation provides useful information about the effective deployment of our capital in the context of the yield on our aircraft assets the utilization of those assets by our lessees and our ability to borrow efficiently
Except for percentages all figures are $ in thousands
3 Pro-forma Q119 estimates the impact of the Avianca Brazil and Jet Airways bankruptcies on annualized net cash interest margin by adding $159 million to quarterly rental revenue in the first quarter of 2019
As part of the Companyrsquos adoption of ASC 842 we were required to reclassify collections on direct financing and sales-type leases on our Consolidated Statement of Cash Flows for the three months ended March 31 2019 The presentation for the three months ended March 31 2018 has also been reclassified to conform to the current period presentation
Reclassification of Collections on Direct Financing and Sales-Type Leases
Three Months Ended March 31 2018
Net cash and restricted cash provided by operating activities as previously reported $142412
Collections on direct financing and sales-type leases 6493
Net cash and restricted cash provided by operating activities $148905
Except for percentages all figures are in thousands1 For the three months ended March 31 2019 distributed and undistributed earnings to restricted shares was 058 of net income and adjusted net income The amount of restricted share
forfeitures for the period presented is immaterial to the allocation of distributed and undistributed earnings2 For all periods presented dilutive shares represented contingently issuable shares
Weighted-average shares Shares Percent2
Common shares outstanding ndash Basic 74704 9942Unvested restricted common shares 435 058Total weighted-average shares outstanding 75138 10000
Common shares outstanding ndash Basic 74704 9924Effect of dilutive shares1 570 076Common shares outstanding ndash Diluted 75274 10000
Net income allocationNet income $ 34810 10000Distributed and undistributed earnings allocated to unvested restricted shares (201) -058Earnings available to common shares $ 34609 9942
Adjusted net income allocationAdjusted net income $ 39616 10000Amounts allocated to unvested restricted shares (229) -058Amounts allocated to common shares $ 39387 9942
Three Months Ended March 31 2019
Sheet1
27FIRST QUARTER 2019 EARNINGS CALLbull 05022019
Supplemental Financial Information
Except for percentages all figures are in thousands1 For the three months ended March 31 2018 distributed and undistributed earnings to restricted shares was 055 of net income and adjusted net income The amount of restricted share
forfeitures for the period presented is immaterial to the allocation of distributed and undistributed earnings2 For all periods presented dilutive shares represented contingently issuable shares
Weighted-average shares Shares Percent2
Common shares outstanding ndash Basic 78367 9945Unvested restricted common shares 431 055Total weighted-average shares outstanding 78798 10000
Common shares outstanding ndash Basic 78367 9971Effect of dilutive shares1 228 029Common shares outstanding ndash Diluted 78595 10000
Net income allocationNet income $ 57547 10000Distributed and undistributed earnings allocated to unvested restricted shares (315) -055Earnings available to common shares $ 57232 9945
Adjusted net income allocationAdjusted net income $ 56751 10000Amounts allocated to unvested restricted shares (311) -055Amounts allocated to common shares $ 56440 9945
Three Months Ended March 31 2018
Sheet1
28FIRST QUARTER 2019 EARNINGS CALLbull 05022019
Limitations of EBITDA Adjusted EBITDA ANI Cash ROE and Net Cash Interest Margin
An investor or potential investor may find EBITDA Adjusted EBITDA ANI Cash Earnings Cash ROE and Net Cash Interest Margin important measures in evaluating our performance results of operations and financial position We use these non-US GAAP measures to supplement our US GAAP results in order to provide a more complete understanding of the factors and trends affecting our business
EBITDA Adjusted EBITDA ANI Cash Earnings Cash ROE and Net Cash Interest Margin have limitations as analytical tools and should not be viewed in isolation or as substitutes for US GAAP measures of earnings Material limitations in making the adjustments to ourearnings to calculate EBITDA Adjusted EBITDA ANI Cash Earnings Cash ROE and Net Cash Interest Margin and using these non-US GAAP measures as compared to US GAAP net income income from continuing operations and cash flows provided by or used in operations include
depreciation and amortization though not directly affecting our current cash position represent the wear and tear andor reduction in value of our aircraft which affects the aircraftrsquos availability for use and may be indicative of future needs for capital expenditures
the cash portion of income tax (benefit) provision generally represents charges (gains) which may significantly affect our financial results
elements of our interest rate derivative accounting may be used to evaluate the effectiveness of our hedging policy
hedge loss amortization charges related to Term Financing No 1 and Securitization No 1 and
adjustments required in calculating covenant ratios and compliance as that term is defined in the indenture governing our seniorunsecured notes
EBITDA Adjusted EBITDA ANI Cash Earnings Cash ROE and Net Cash Interest Margin are not alternatives to net income income from operations or cash flows provided by or used in operations as calculated and presented in accordance with US GAAP You should not rely on these non-US GAAP measures as a substitute for any such US GAAP financial measure We strongly urge you to review the reconciliations to US GAAP net income along with our consolidated financial statements included elsewhere in our Annual Report We also strongly urge you to not rely on any single financial measure to evaluate our business In addition because EBITDA Adjusted EBITDA ANI Cash Earnings Cash ROE and Net Cash Interest Margin are not measures of financial performance under US GAAP and are susceptible to varying calculations EBITDA Adjusted EBITDA ANI Cash Earnings Cash ROE and Net Cash Interest Margin as presented here may differ from and may not be comparable to similarly titled measures used by other companies
Slide Number 1
Slide Number 2
Slide Number 3
Slide Number 4
Slide Number 5
Slide Number 6
Slide Number 7
Slide Number 8
Slide Number 9
Slide Number 10
Slide Number 11
Slide Number 12
Slide Number 13
Slide Number 14
Slide Number 15
Slide Number 16
Slide Number 17
Slide Number 18
Slide Number 19
Slide Number 20
Slide Number 21
Slide Number 22
Slide Number 23
Slide Number 24
Slide Number 25
Slide Number 26
Slide Number 27
Slide Number 28
Three Months Ended March 31 2019
Three Months Ended March 31 2019
Weighted-average shares
Shares
Percent2
Weighted-average shares
Shares
Percent2
Common shares outstanding ndash Basic
74704
9942
Common shares outstanding ndash Basic
74704
9942
Unvested restricted common shares
435
058
Unvested restricted common shares
435
058
Total weighted-average shares outstanding
75138
10000
Total weighted-average shares outstanding
75138
10000
Common shares outstanding ndash Basic
74704
9924
Common shares outstanding ndash Basic
74704
9924
Effect of dilutive shares1
570
076
Effect of dilutive shares1
570
076
Common shares outstanding ndash Diluted
75274
10000
Common shares outstanding ndash Diluted
75274
10000
Net income allocation
Net income allocation
Net income
$
34810
10000
Net income
$
34810
10000
Distributed and undistributed earnings allocated to unvested restricted shares
(201)
-058
Distributed and undistributed earnings allocated to unvested restricted shares
(201)
-058
Earnings available to common shares
$
34609
9942
Earnings available to common shares
$
34609
9942
Adjusted net income allocation
Adjusted net income allocation
Adjusted net income
$
39616
10000
Adjusted net income
$
39616
10000
Amounts allocated to unvested restricted shares
(229)
-058
Amounts allocated to unvested restricted shares
(229)
-058
Amounts allocated to common shares
$
39387
9942
Amounts allocated to common shares
$
39387
9942
Three Months Ended March 31 2018
Three Months Ended March 31 2018
Weighted-average shares
Shares
Percent2
Weighted-average shares
Shares
Percent2
Common shares outstanding ndash Basic
78367
9945
Common shares outstanding ndash Basic
78367
9945
Unvested restricted common shares
431
055
Unvested restricted common shares
431
055
Total weighted-average shares outstanding
78798
10000
Total weighted-average shares outstanding
78798
10000
Common shares outstanding ndash Basic
78367
9971
Common shares outstanding ndash Basic
78367
9971
Effect of dilutive shares1
228
029
Effect of dilutive shares1
228
029
Common shares outstanding ndash Diluted
78595
10000
Common shares outstanding ndash Diluted
78595
10000
Net income allocation
Net income allocation
Net income
$
57547
10000
Net income
$
57547
10000
Distributed and undistributed earnings allocated to unvested restricted shares
(315)
-055
Distributed and undistributed earnings allocated to unvested restricted shares
(315)
-055
Earnings available to common shares
$
57232
9945
Earnings available to common shares
$
57232
9945
Adjusted net income allocation
Adjusted net income allocation
Adjusted net income
$
56751
10000
Adjusted net income
$
56751
10000
Amounts allocated to unvested restricted shares
(311)
-055
Amounts allocated to unvested restricted shares
(311)
-055
Amounts allocated to common shares
$
56440
9945
Amounts allocated to common shares
$
56440
9945
Three Months Ended March 31 2019
Three Months Ended March 31 2019
Weighted-average shares
Shares
Percent2
Weighted-average shares
Shares
Percent2
Common shares outstanding ndash Basic
74704
9942
Common shares outstanding ndash Basic
74704
9942
Unvested restricted common shares
435
058
Unvested restricted common shares
435
058
Total weighted-average shares outstanding
75138
10000
Total weighted-average shares outstanding
75138
10000
Common shares outstanding ndash Basic
74704
9924
Common shares outstanding ndash Basic
74704
9924
Effect of dilutive shares1
570
076
Effect of dilutive shares1
570
076
Common shares outstanding ndash Diluted
75274
10000
Common shares outstanding ndash Diluted
75274
10000
Net income allocation
Net income allocation
Net income
$
34810
10000
Net income
$
34810
10000
Distributed and undistributed earnings allocated to unvested restricted shares
(201)
-058
Distributed and undistributed earnings allocated to unvested restricted shares
(201)
-058
Earnings available to common shares
$
34609
9942
Earnings available to common shares
$
34609
9942
Adjusted net income allocation
Adjusted net income allocation
Adjusted net income
$
39616
10000
Adjusted net income
$
39616
10000
Amounts allocated to unvested restricted shares
(229)
-058
Amounts allocated to unvested restricted shares
(229)
-058
Amounts allocated to common shares
$
39387
9942
Amounts allocated to common shares
$
39387
9942
Three Months Ended March 31 2018
Three Months Ended March 31 2018
Weighted-average shares
Shares
Percent2
Weighted-average shares
Shares
Percent2
Common shares outstanding ndash Basic
78367
9945
Common shares outstanding ndash Basic
78367
9945
Unvested restricted common shares
431
055
Unvested restricted common shares
431
055
Total weighted-average shares outstanding
78798
10000
Total weighted-average shares outstanding
78798
10000
Common shares outstanding ndash Basic
78367
9971
Common shares outstanding ndash Basic
78367
9971
Effect of dilutive shares1
228
029
Effect of dilutive shares1
228
029
Common shares outstanding ndash Diluted
78595
10000
Common shares outstanding ndash Diluted
78595
10000
Net income allocation
Net income allocation
Net income
$
57547
10000
Net income
$
57547
10000
Distributed and undistributed earnings allocated to unvested restricted shares
(315)
-055
Distributed and undistributed earnings allocated to unvested restricted shares
(315)
-055
Earnings available to common shares
$
57232
9945
Earnings available to common shares
$
57232
9945
Adjusted net income allocation
Adjusted net income allocation
Adjusted net income
$
56751
10000
Adjusted net income
$
56751
10000
Amounts allocated to unvested restricted shares
(311)
-055
Amounts allocated to unvested restricted shares
(311)
-055
Amounts allocated to common shares
$
56440
9945
Amounts allocated to common shares
$
56440
9945
Q119
Q418
Q318
Q119 B (W) vs Q418
Average NBV for the 4th and 3rd Quarters of 2018
$ 7449957
$ 7136627
$ 6787206
$ 313330
Average NBV 44 higher Q418 to Q119
Operating and Finance Lease Revenues
$ 189676
$ 192711
$ 190836
$ (3034)
Finance Lease Collections
$ 5925
$ 7316
$ 9518
$ (1391)
Annualized Portfolio Yield
105
112
118
-07
Annualized yield 71bps lower
Cash Interest Expense
$ 60279
$ 60348
$ 54521
$ 69
Annualized Cash Interest
32
34
32
01
Annualized cash int exp 15bps lower
Annualized Cash Net Interest Margin
73
78
86
-06
Annualized cash margin 56bps lower
Average NBV
Quarterly Rental Revenue(1)
Cash Interest(2)
Annualized Net Cash Interest Margin(1)(2)
Yield
Cash Interest Expense
Q112
$ 4388008
$ 152242
$ 44969
98
139
410
Q212
$ 4542477
$ 156057
$ 48798
94
137
430
Q312
$ 4697802
$ 163630
$ 41373
104
139
352
Q412
$ 4726457
$ 163820
$ 43461
102
139
368
Q113
$ 4740161
$ 162319
$ 48591
96
137
410
Q213
$ 4840396
$ 164239
$ 44915
99
136
371
Q313
$ 4863444
$ 167876
$ 47682
99
138
392
Q413
$ 5118601
$ 176168
$ 49080
99
138
384
Q114
$ 5312651
$ 181095
$ 51685
97
136
389
Q214
$ 5721521
$ 190574
$ 48172
100
133
337
Q314
$ 5483958
$ 182227
$ 44820
100
133
327
Q414
$ 5468637
$ 181977
$ 44459
101
133
325
Q115
$ 5743035
$ 181027
$ 50235
91
126
350
Q215
$ 5967898
$ 189238
$ 51413
92
127
345
Q315
$ 6048330
$ 191878
$ 51428
93
127
340
Q415
$ 5962874
$ 188491
$ 51250
92
126
344
Q116
$ 5988076
$ 186730
$ 51815
90
125
346
Q216
$ 5920030
$ 184469
$ 55779
87
125
377
Q316
$ 6265175
$ 193909
$ 57589
87
124
368
Q416
$ 6346361
$ 196714
$ 58631
87
124
370
Q117
$ 6505355
$ 200273
$ 58839
87
123
362
Q217
$ 6512100
$ 199522
$ 55871
88
123
343
Q317
$ 5985908
$ 184588
$ 53457
88
123
357
Q417
$ 6247581
$ 187794
$ 53035
86
120
340
Q118
$ 6700223
$ 193418
$ 53978
83
115
322
Q218
$ 6721360
$ 193988
$ 53979
83
115
321
Q318
$ 6787206
$ 200354
$ 54521
86
118
321
Q418
$ 7136627
$ 200027
$ 60348
78
112
338
Q119
$ 7449957
$ 195601
$ 60279
73
105
324
Pro-forma Q119
$ 7449957
$ 211501
$ 60279
81
114
324
Average NBV
Quarterly Rental Revenue1
Cash Interest2
Annualized Net Cash Interest Margin12
Yield
Cash Interest Expense
Q113
$ 4740161
$ 162319
$ 48591
96
137
410
Q213
$ 4840396
$ 164239
$ 44915
99
136
371
Q313
$ 4863444
$ 167876
$ 47682
99
138
392
Q413
$ 5118601
$ 176168
$ 49080
99
138
384
Q114
$ 5312651
$ 181095
$ 51685
97
136
389
Q214
$ 5721521
$ 190574
$ 48172
100
133
337
Q314
$ 5483958
$ 182227
$ 44820
100
133
327
Q414
$ 5468637
$ 181977
$ 44459
101
133
325
Q115
$ 5743035
$ 181027
$ 50235
91
126
350
Q215
$ 5967898
$ 189238
$ 51413
92
127
345
Q315
$ 6048330
$ 191878
$ 51428
93
127
340
Q415
$ 5962874
$ 188491
$ 51250
92
126
344
Q116
$ 5988076
$ 186730
$ 51815
90
125
346
Q216
$ 5920030
$ 184469
$ 55779
87
125
377
Q316
$ 6265175
$ 193909
$ 57589
87
124
368
Q416
$ 6346361
$ 196714
$ 58631
87
124
370
Q117
$ 6505355
$ 200273
$ 58839
87
123
362
Q217
$ 6512100
$ 199522
$ 55871
88
123
343
Q317
$ 5985908
$ 184588
$ 53457
88
123
357
Q417
$ 6247581
$ 187794
$ 53035
86
120
340
Q118
$ 6700223
$ 193418
$ 53978
83
115
322
Q218
$ 6721360
$ 193988
$ 53979
83
115
321
Q318
$ 6787206
$ 200354
$ 54521
86
118
321
Q418
$ 7136627
$ 200027
$ 60348
78
112
338
Q119
$ 7449957
$ 195601
$ 60279
73
105
324
Pro-forma Q119
$ 7449957
$ 211501
$ 60279
81
114
324
NBV FE
Fin Lease
NBV Flight Equip + Fin Lease
Lease Rentals
Interest Inc Fin lease
Collections on Fin Leases
Total Lease Rent Collections
Quarterly Lease rent Collections
Cash Interest
Loan and Contract Termination Fees included in Cash Interest
Adj Cash Int
NIM $
NIM
Yield
Cash Int
Month End
Month End
Month End
Mo Avg
Qtrly Avg
MTD
MTD
QTD
QTD
QTD
DEC10
4065780
- 0
4065780
JAN11
3981690
- 0
3981690
4023735
- 0
47091
- 0
- 0
47091
- 0
- 0
- 0
FEB11
4051167
- 0
4051167
4016428
- 0
47264
- 0
- 0
47264
- 0
- 0
- 0
MAR11
4120309
- 0
4120309
4085738
4041967
46761
- 0
- 0
46761
141116
$ 41278
41278
99838
988
APR11
4125377
- 0
4125377
4122843
- 0
47211
- 0
- 0
47211
- 0
- 0
- 0
MAY11
4194987
- 0
4194987
4160182
- 0
47897
- 0
- 0
47897
- 0
- 0
- 0
JUN11
4099641
- 0
4099641
4147314
4143446
48248
- 0
- 0
48248
143356
$ 43217
$ 3196
40021
103335
998
JUL11
4271013
- 0
4271013
4185327
- 0
47994
- 0
- 0
47994
- 0
- 0
- 0
AUG11
4248242
- 0
4248242
4259628
- 0
49193
- 0
- 0
49193
- 0
- 0
- 0
SEP11
4196918
- 0
4196918
4222580
4222512
48704
- 0
- 0
48704
145890
$ 42066
42066
103824
984
OCT11
4430527
- 0
4430527
4313723
- 0
49054
- 0
- 0
49054
- 0
- 0
- 0
NOV11
4401782
- 0
4401782
4416155
- 0
50498
- 0
- 0
50498
- 0
- 0
- 0
DEC11
4387986
- 0
4387986
4394884
4374921
50297
- 0
- 0
50297
149848
$ 43041
43041
106807
977
JAN12
4391666
- 0
4391666
4389826
- 0
51034
- 0
- 0
51034
- 0
- 0
- 0
FEB12
4385360
- 0
4385360
4388513
- 0
49705
- 0
- 0
49705
- 0
- 0
- 0
MAR12
4386010
- 0
4386010
4385685
4388008
51503
- 0
- 0
51503
152242
$ 44969
44969
107273
978
APR12
4484956
- 0
4484956
4435483
- 0
50824
- 0
- 0
50824
- 0
- 0
- 0
MAY12
4570712
31500
4602212
4543584
- 0
51020
- 0
- 0
51020
- 0
- 0
- 0
JUN12
4604493
90024
4694518
4648365
4542477
51781
956
1476
54213
156057
$ 48798
48798
107259
944
JUL12
4572121
90739
4662860
4678689
- 0
52892
963
- 0
53855
- 0
- 0
- 0
AUG12
4665966
90332
4756298
4709579
- 0
52945
948
- 0
53893
- 0
- 0
- 0
SEP12
4532445
121533
4653978
4705138
4697802
53709
1608
565
55881
163630
$ 41373
41373
122257
1041
OCT12
4574055
120934
4694990
4674484
- 0
52277
1311
- 0
53588
- 0
- 0
- 0
NOV12
4645741
120345
4766086
4730538
- 0
52596
1321
- 0
53917
- 0
- 0
- 0
DEC12
4662661
119951
4782612
4774349
4726457
53217
1286
1811
56314
163820
$ 43461
43461
120359
1019
JAN13
4639414
119339
4758753
4770682
- 0
52957
1298
- 0
54255
- 0
- 0
- 0
FEB13
4614480
118707
4733187
4745970
- 0
51936
1277
- 0
53213
- 0
- 0
- 0
MAR13
4544773
129700
4674474
4703830
4740161
51697
1309
1845
54850
162319
$ 48591
48591
113728
960
APR13
4621392
128981
4750373
4712423
- 0
51363
1384
- 0
52747
- 0
- 0
- 0
MAY13
4915814
128237
5044051
4897212
- 0
53613
1359
- 0
54972
- 0
- 0
- 0
JUN13
4651553
127504
4779057
4911554
4840396
52942
1370
2207
56520
164239
$ 47869
$ 2954
44915
119324
986
JUL13
4668642
149932
4818574
4798816
- 0
52469
1372
- 0
53840
- 0
- 0
- 0
AUG13
4690154
149017
4839171
4828873
- 0
53339
1423
- 0
54763
- 0
- 0
- 0
SEP13
4938113
148005
5086118
4962645
4863444
55340
1327
2606
59273
167876
$ 47682
47682
120194
989
OCT13
4913184
147017
5060200
5073159
- 0
56643
1350
- 0
57993
- 0
- 0
- 0
NOV13
5011676
146076
5157752
5108976
- 0
56264
1361
- 0
57625
- 0
- 0
- 0
DEC13
5044410
145173
5189583
5173668
5118601
56367
1333
2850
60550
176168
$ 49080
49080
127088
993
JAN14
5015452
144256
5159708
5174646
- 0
58142
1337
- 0
59478
- 0
- 0
- 0
FEB14
5129035
143356
5272392
5216050
- 0
57572
1354
- 0
58926
- 0
- 0
- 0
MAR14
5679723
142400
5822123
5547257
5312651
58621
1297
2773
62691
181095
$ 51685
51685
129410
974
APR14
5605462
155551
5761013
5791568
- 0
61276
1329
- 0
62604
- 0
- 0
- 0
MAY14
5512769
154435
5667205
5714109
- 0
60998
1338
- 0
62336
- 0
- 0
- 0
JUN14
5577966
72600
5650566
5658886
5721521
60957
1231
3446
65634
190574
$ 48172
48172
142402
996
JUL14
5418990
71971
5490961
5570764
- 0
60509
484
- 0
60993
- 0
- 0
- 0
AUG14
5412453
71345
5483799
5487380
- 0
59617
488
- 0
60105
- 0
- 0
- 0
SEP14
5232940
70723
5303663
5393731
5483958
58760
491
1877
61129
182227
$ 44820
44820
137407
1002
OCT14
5340303
88360
5428663
5366163
- 0
59394
480
- 0
59874
- 0
- 0
- 0
NOV14
5374566
107667
5482233
5455448
- 0
59717
542
- 0
60259
- 0
- 0
- 0
DEC14
5579718
106651
5686369
5584301
5468637
59091
537
2216
61844
181977
$ 44459
44459
137518
1006
1331
325
134
99
JAN15
5642590
105896
5748487
5717428
- 0
59898
539
- 0
60437
- 0
- 0
- 0
FEB15
5623616
105155
5728770
5738628
- 0
58688
552
- 0
59240
- 0
- 0
- 0
MAR15
5712950
104377
5817327
5773049
5743035
58560
516
2274
61350
181027
$ 50235
50235
130792
911
1261
350
APR15
5778092
119625
5897717
5857522
- 0
60016
589
- 0
60605
- 0
- 0
- 0
MAY15
5940205
118903
6059108
5978412
- 0
61684
628
- 0
62311
- 0
- 0
- 0
JUN15
5953555
122855
6076411
6067759
5967898
63140
660
2521
66322
189238
$ 51413
51413
137825
924
1268
345
JUL15
5942037
122200
6064238
6070324
- 0
63838
625
- 0
64463
- 0
- 0
- 0
AUG15
5917660
121542
6039202
6051720
- 0
62322
623
- 0
62945
- 0
- 0
- 0
SEP15
5885807
120882
6006689
6022946
6048330
61877
620
1973
64470
191878
$ 51428
51428
140450
929
1269
340
OCT15
5829040
103074
5932114
5969402
- 0
61959
611
- 0
62570
- 0
- 0
- 0
NOV15
5801167
117861
5919028
5925571
- 0
60485
623
- 0
61108
- 0
- 0
- 0
DEC15
5867062
201211
6068273
5993651
5962874
60949
1072
2791
64812
188491
$ 51250
51250
137241
921
1264
344
127
92
JAN16
5836479
198445
6034923
6051598
- 0
60245
1141
- 0
61387
- 0
- 0
- 0
FEB16
5796230
213436
6009666
6022295
- 0
60098
1161
- 0
61259
- 0
- 0
- 0
MAR16
5558666
212336
5771002
5890334
5988076
59227
1195
3663
64085
186730
$ 53324
1509
51815
134915
901
1247
346
APR16
5654825
211354
5866179
5818591
- 0
58383
1160
- 0
59544
- 0
- 0
- 0
MAY16
5659238
265253
5924490
5895335
- 0
58787
1432
- 0
60218
- 0
- 0
- 0
JUN16
5875935
291903
6167838
6046164
5920030
58955
1582
4170
64707
184469
55779
55779
128690
870
1246
377
JUL16
5980982
290048
6271030
6219434
- 0
60301
1805
- 0
62107
- 0
- 0
- 0
AUG16
6017274
288131
6305405
6288218
- 0
60757
1744
- 0
62501
- 0
- 0
- 0
SEP16
6004489
265854
6270343
6287874
6265175
60917
1805
6580
69301
193909
57589
57589
136320
870
1238
368
OCT16
6025556
264389
6289945
6280144
- 0
61757
1413
63170
- 0
- 0
- 0
NOV16
6097520
262667
6360187
6325066
- 0
62824
1357
64181
- 0
- 0
- 0
DEC16
6246707
260853
6507560
6433874
6346361
62969
1394
5000
69363
196714
62082
3451
58631
138083
870
1240
370
124
88
JAN17
6219012
259264
6478276
6492918
- 0
63296
1359
64655
- 0
FEB17
6227957
257474
6485431
6481853
- 0
63575
1288
64863
- 0
MAR17
6297190
299969
6597159
6541295
6505355
63715
1426
5614
70755
200273
58839
58839
141434
870
1231
362
APR17
6269189
348327
6617516
6607338
64119
1814
65933
MAY17
6156371
377186
6533557
6575537
63186
2079
65265
JUN17
5818821
354474
6173295
6353426
6512100
61794
1985
4545
68324
199522
56859
988
55871
143651
882
1226
343
JUL17
5615695
352411
5968106
6070700
59464
1954
61418
AUG17
5523543
390140
5913683
5940895
56603
1917
58520
SEP17
5490164
488408
5978572
5946128
5985908
55621
2541
6488
64650
184588
54527
1070
53457
131131
876
1233
357
OCT17
5493432
549212
6042644
6010608
55282
2833
58115
NOV17
5789587
554117
6343704
6193174
56823
3248
60071
DEC17
6188469
545750
6734219
6538962
6247581
57826
3272
8511
69609
187794
53035
53035
134759
863
1202
340
122
87
JAN18
6163924
543311
6707235
6720727
59570
3212
62782
FEB18
6173766
514024
6687790
6697513
59177
3007
62184
MAR18
6143695
533373
6677067
6682429
6700223
58736
3222
6493
68451
193418
53978
53978
139440
832
1155
322
APR18
6120068
531077
6651145
6664106
58481
2936
61417
MAY18
6257826
528503
6786329
6718737
59975
3015
62990
JUN18
6249406
526738
6776144
6781236
6721360
60030
2918
6634
69582
193988
53979
53979
140009
833
1154
321
12 MONTH CALCULATION
JUL18
6261431
523491
6784922
6780533
60815
2990
63804
Yield
NIM
AUG18
6250137
519066
6769203
6777062
60517
2927
63444
2014
134
99
SEP18
6321623
517221
6838844
6804023
6787206
60712
2876
9518
73106
200354
53683
-838
54521
145833
859
1181
321
2015
127
92
OCT18
6602809
515251
7118060
6978452
62875
2742
65617
2016
124
88
NOV18
6657588
512429
7170017
7144039
61402
2610
64012
2017
122
87
DEC18
6935585
469180
7404765
7287391
7136627
60405
2677
7316
70398
200027
60348
60348
139679
783
1121
338
115
83
2018
115
83
JAN19
6900489
509725
7410214
7407489
59462
2959
62421
LTM Q119
112
80
FEB19
6907294
507653
7414948
7412581
62458
2701
65158
MAR19
7138689
505964
7644653
7529800
7449957
59314
2783
5925
68022
195601
60279
60279
135322
727
1050
324
112
80
wCollections on Finance Leases
2019
2018
2017
Finance Lease Collections
Finance Lease Collections
Finance Lease Collections
Yield
Cash Interest
Net Spread
Avg NBV
Lease Rent
Interest
YTD
5925
YTD
29961
YTD
32184
Q117
1231
362
870
6505355
200273
$ 58839
Q119
5925
Q118
6493
Q117
5614
Q119
1050
324
727
7449957
195601
60279
Q219
Q218
6634
Q217
11571
-181
-038
-143
Change
145
-23
24
Q319
Q318
9518
Q317
6488
Q419
Q418
7316
Q417
8511
Yield
Cash Interest
Net Spread
Avg NBV
Lease Rent
Interest
Finance Lease Revenue
Finance Lease Revenue
Finance Lease Revenue
Q118
1155
322
832
6700223
193418
53978
Q119
8442
Q418
8029
Q417
9353
Q119
1050
324
727
7449957
195601
60279
January
2959
October
2742
October
2833
-104
001
-106
Change
112
11
117
February
2701
November
2610
November
3248
March
2783
December
2677
December
3272
Yield
Cash Interest
Net Spread
Avg NBV
Lease Rent
Interest
Q418
1121
338
783
7136627
200027
60348
Collections on Finance Leases excludes $70 million of unusual payments received from KLM in Q217
Q119
1050
324
727
7449957
195601
60279
-071
-015
-056
Change
44
-22
-01
112
w$17mm added to Q119
11
Actual
1050
324
727
Revised
1141
324
818
091
091
wCollections on Finance Leases
Yield
Cash Interest
Net Spread
Q314
13292
3269
1002
Q316
12380
3677
870
-0911
0408
-132
Yield
Cash Interest
Net Spread
Q315
12690
3401
929
Q316
12380
3677
870
-0310
0276
-059
Yield
Cash Interest
Net Spread
Q216
12464
3769
870
Q316
12380
3677
870
-0084
-0092
001
Old Format
Yield
Cash Interest
Net Spread
Q314
13221
3312
991
Q316
12173
3852
832
-1047
-0540
-159
Yield
Cash Interest
Net Spread
Q315
12691
3471
922
Q316
12173
3852
832
-0518
-0381
-090
Yield
Cash Interest
Net Spread
Q216
12409
3930
8479
Q316
12173
3852
8321
Change
-0236
0078
-0159
For the Three Months Ended March 31
2019
2018
Net Income
$ 34810
$ 57547
(Gain) loss on mark-to-market of interest rate derivative contracts(1)
2080
(3174)
Non-cash share-based payment expense(2)
2726
2378
Adjusted Net Income
$ 39616
$ 56751
For the Three Months Ended March 31
2019
2018
Net Income
$ 34810
$ 57547
Loss on mark-to-market of interest rate derivative contracts(1)
2080
(3174)
Non-cash share-based payment expense(2)
2726
2378
Adjusted Net Income
$ 39616
$ 56751
Three Mos Ended Dec 31
2019
2018
(Dollars in thousands)
Net income
$ 34810
$ 57547
Depreciation
84735
75002
Amortization of lease premiums discounts and incentives
5711
3128
Interest net
63463
57108
Income tax provision
3098
(844)
EBITDA
191817
191941
Adjustments
Equity share of joint venture impairment
2724
-
Non-cash share based payment expense
2726
2378
(Gain) loss on MTM of interest rate derivative contracts
2080
(3174)
Adjusted EBITDA
$ 199347
$ 191145
Three Mos Ended Dec 31
2019
2018
(Dollars in thousands)
Net income
$ 34810
$ 57547
Depreciation
84735
75002
Amortization of lease premiums discounts and incentives
5711
3128
Interest net
63463
57108
Income tax provision
3098
(844)
EBITDA
191817
191941
Adjustments
Equity share of joint venture impairment
2724
- 0
Non-cash share based payment expense
2726
2378
(Gain) loss on MTM of interest rate derivative contracts