69
Demand and the Consumer
| Date post: | 20-Jul-2015 |
| Category: |
Education |
| Upload: | ashish-gupta |
| View: | 37 times |
| Download: | 3 times |

Demand and the
Consumer

Marginal Utility Theory
• Utility and consumer satisfaction
• Total and marginal utility– diminishing marginal utility
• The optimum level of consumption– consumer surplus
• marginal consumer surplus
• total consumer surplus
• consumer surplus and the marginal utility curve
40
50
60
70
80
90
100
110
120
0 250 500 750 1000
MU
, P (
penc
e p
er li
tre)
Q (litres per annum)
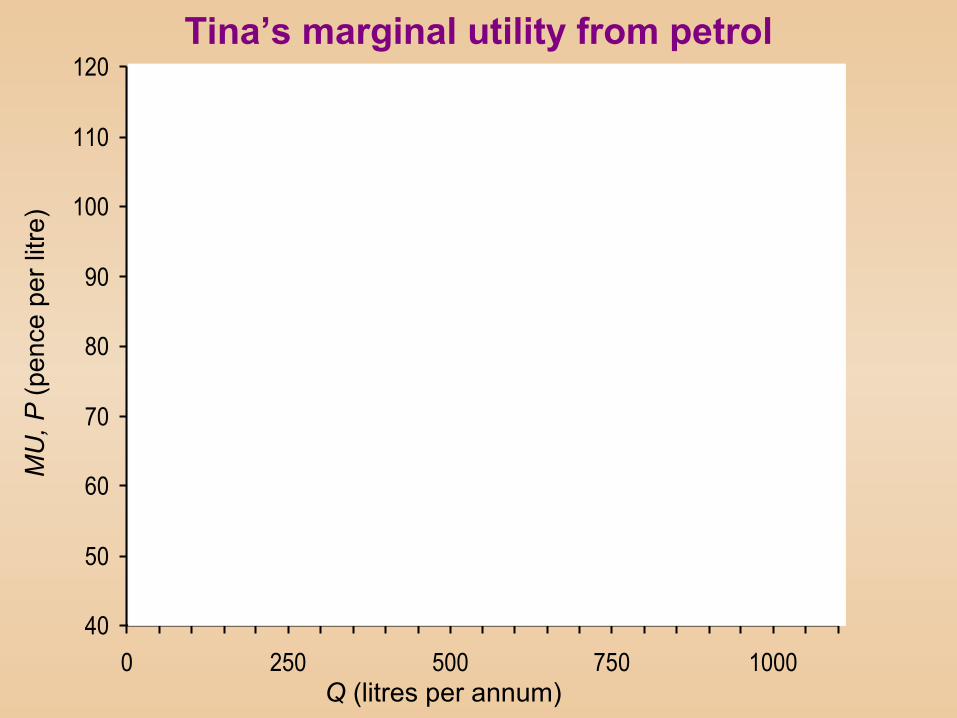
Tina’s marginal utility from petrol

ConsumerConsumersurplussurplus
40
50
60
70
80
90
100
110
120
0 250 500 750 1000
a
b
c
MU
, P (
penc
e p
er li
tre)
MU
Q (litres per annum)
Tina’s marginal utility from petrol

Marginal Utility Theory
• Utility and consumer satisfaction
• Total and marginal utility– diminishing marginal utility
• The optimum level of consumption– consumer surplus
• marginal consumer surplus
• total consumer surplus
• consumer surplus and the marginal utility curve
– rational consumer behaviour

Marginal Utility Theory
• Utility and consumer satisfaction
• Total and marginal utility– diminishing marginal utility
• The optimum level of consumption– consumer surplus
• marginal consumer surplus
• total consumer surplus
• consumer surplus and the marginal utility curve
– rational consumer behaviour• maximising consumer surplus: P = MU
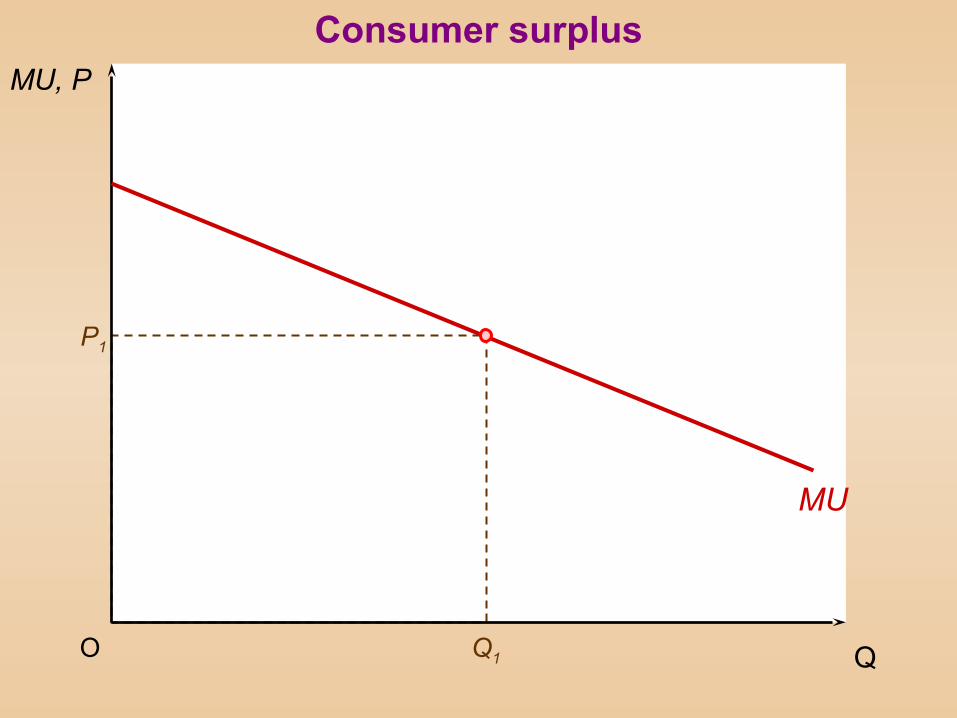
MU
P1
Q1O
MU, P
Q
Consumer surplus

Totalconsumer
expenditureMU
P1
Q1O
MU, P
Q
Consumer surplus
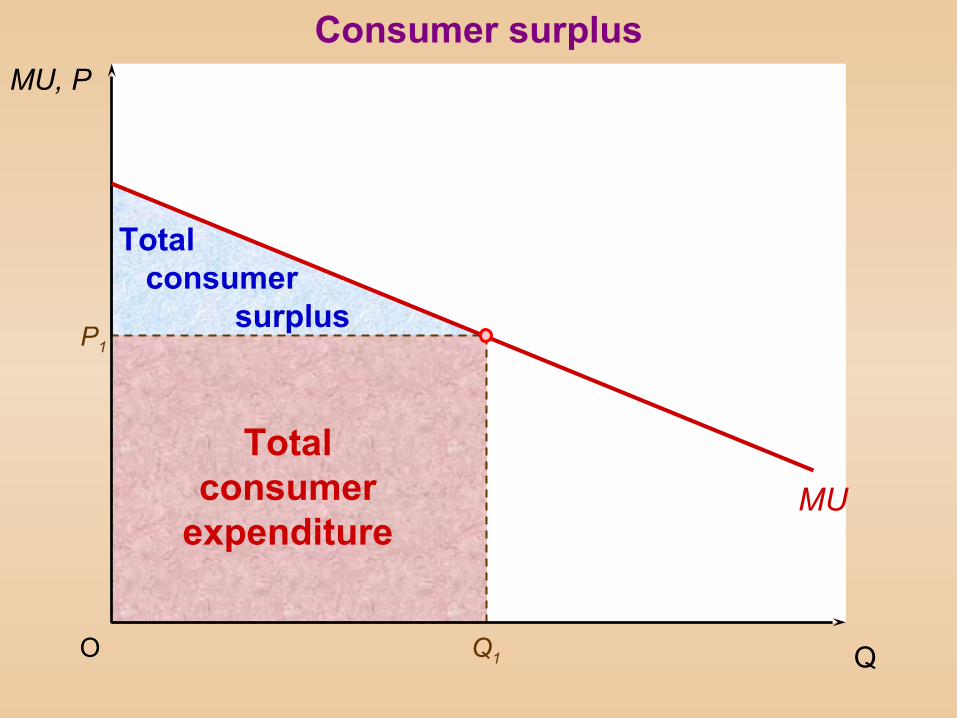
Totalconsumer
expenditureMU
Total consumer surplus
P1
Q1
MU, P
QO
Consumer surplus

Marginal Utility Theory
• Marginal utility and the demand curve
– an individual’s demand curve

MU = D
MU, P
QO Q1
P1
aConsumption at Q1
where P1 = MU
Deriving an individual person’s demand curve

Q2O
P1
Q1
a
P2
b
Consumption at Q2
where P2 = MU
MU, P
Q
MU = D
Deriving an individual person’s demand curve

P2
Q2O
P1
Q3Q1
a
P3
c
Consumption at Q3
where P3 = MU
b
MU, P
Q
MU = D
Deriving an individual person’s demand curve

Marginal Utility Theory
• Marginal utility and the demand curve
– an individual’s demand curve
– the market demand curve

Marginal Utility Theory
• Marginal utility and the demand curve
– an individual’s demand curve
– the market demand curve
• the shape of the demand curve

Marginal Utility Theory
• Marginal utility and the demand curve
– an individual’s demand curve
– the market demand curve
• the shape of the demand curve
• shifts in the demand curve

Marginal Utility Theory
• Marginal utility and the demand curve
– an individual’s demand curve
– the market demand curve
• the shape of the demand curve
• shifts in the demand curve
• Limitations of the one-commodity version

Marginal Utility Theory
• Marginal utility and the demand curve
– an individual’s demand curve
– the market demand curve
• the shape of the demand curve
• shifts in the demand curve
• Limitations of the one-commodity version
– marginal utility affected by consumption of other goods

Marginal Utility Theory
• Marginal utility and the demand curve
– an individual’s demand curve
– the market demand curve
• the shape of the demand curve
• shifts in the demand curve
• Limitations of the one-commodity version
– marginal utility affected by consumption of other goods
– marginal utility of money not constant

Risk, Uncertainty and Insurance
• Demand under conditions of risk and uncertainty– the problem of imperfect information
• Attitudes towards risk and uncertainty– defining risk and uncertainty
– types of odds
– risk attitudes• risk neutral
• risk loving
• risk averse

• Diminishing marginal utility of income and attitudes towards risk taking
– most people are risk averse
– diminishing marginal utility of incomes
Risk, Uncertainty and Insurance
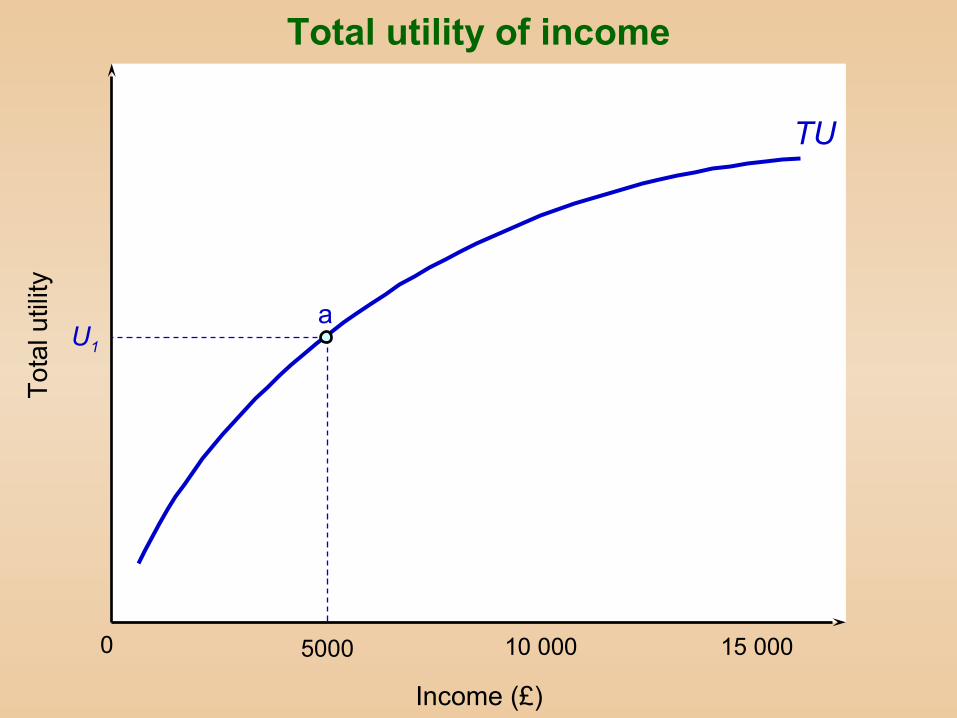
TU
5000 10 000 15 0000
U1a
Income (£)
To
tal u
tility
Total utility of income

TU
5000 10 000 15 0000
U2
U1a
b
Income (£)
To
tal u
tility
Total utility of income

TU
5000 10 000 15 0000
U3
U2
U1a
b
c
Income (£)
To
tal u
tility
Total utility of income

TU
5000 10 000 15 0000 8000
U3
U2
U1
U4
a
b
c
Income (£)
To
tal u
tility
d
Total utility of income

• Insurance: a way of removing risks
– how insurers spread risks
• the law of large numbers
• importance of the independence of risks
– problems for insurers
• adverse selection
• moral hazard
Risk, Uncertainty and Insurance
The Characteristics Approach
• Consumer choice between products– importance of products' characteristics
• Identifying & plotting characteristics– plotting a product's mix of
characteristics

f3
s3
Qu
ant
ity o
f fib
re
Healthbran
Tastyflakes
Quantity of sugar
h1
t1
f1
s1O
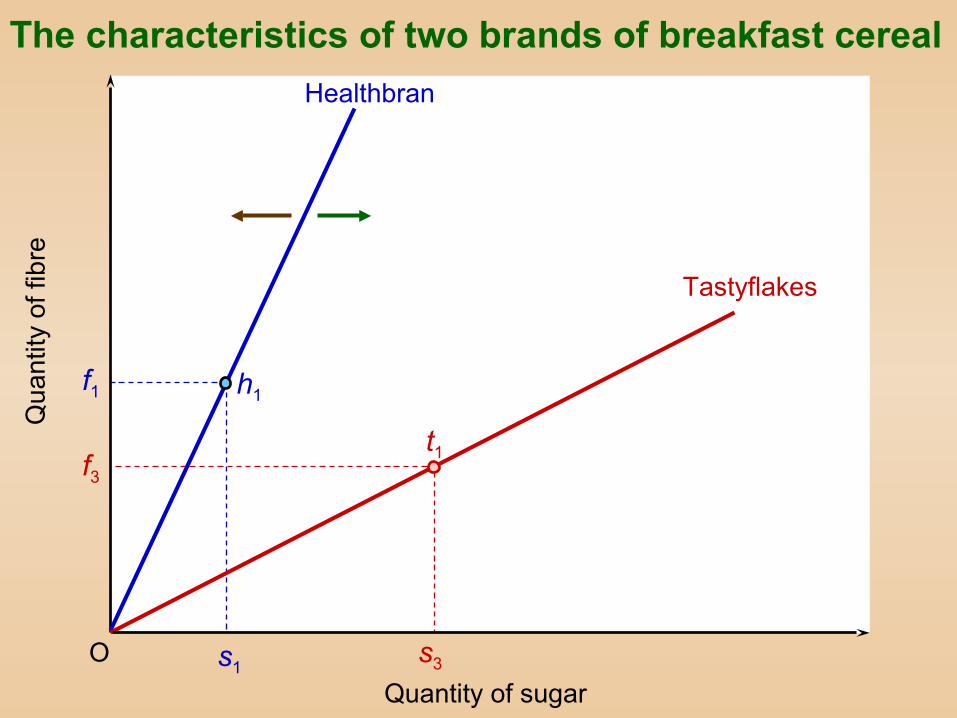
The characteristics of two brands of breakfast cereal

The Characteristics Approach
• Consumer choice between products– importance of products' characteristics
• Identifying & plotting characteristics– plotting a product's mix of
characteristics
– changes in a product's characteristics
f3
s3
Qu
ant
ity o
f fib
re
Healthbran
Tastyflakes
Quantity of sugar
h1
t1
f1
s1O
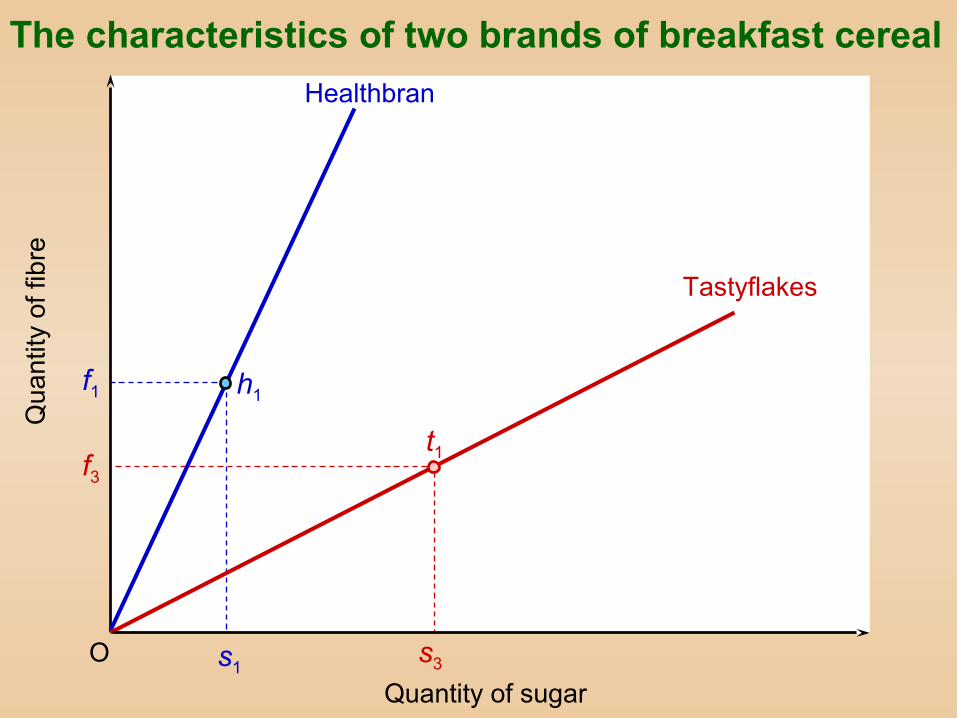
The characteristics of two brands of breakfast cereal

The Characteristics Approach
• Consumer choice between products– importance of products' characteristics
• Identifying & plotting characteristics– plotting a product's mix of
characteristics
– changes in a product's characteristics
• The budget constraint

The Characteristics Approach
• Consumer choice between products– importance of products' characteristics
• Identifying & plotting characteristics– plotting a product's mix of
characteristics
– changes in a product's characteristics
• The budget constraint– affects how much of each characteristic
can be purchased
f3
s3
Qu
ant
ity o
f fib
re
Healthbran
Tastyflakes
Quantity of sugar
h1
t1
f1
s1O
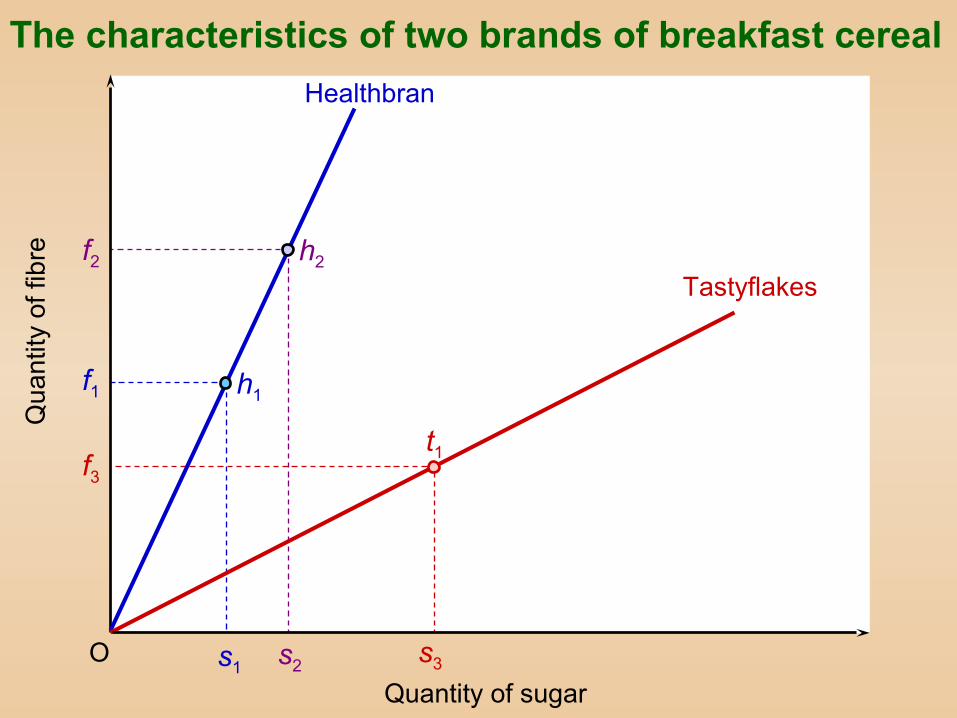
The characteristics of two brands of breakfast cereal

The Characteristics Approach
• Consumer choice between products– importance of products' characteristics
• Identifying & plotting characteristics– plotting a product's mix of
characteristics
– changes in a product's characteristics
• The budget constraint– affects how much of each characteristic
can be purchased• effects of a change in the budget
f2
s2
f3
s3
Qu
ant
ity o
f fib
re
Healthbran
Tastyflakes
Quantity of sugar
h2
h1
t1
f1
s1O
The characteristics of two brands of breakfast cereal

The Characteristics Approach
• Consumer choice between products– importance of products' characteristics
• Identifying & plotting characteristics– plotting a product's mix of
characteristics
– changes in a product's characteristics
• The budget constraint– affects how much of each characteristic
can be purchased• effects of a change in the budget
• effects of change in a product's price

f2
s2
f3
s3
Qu
ant
ity o
f fib
re
Healthbran
Tastyflakes
Quantity of sugar
h2
h1
t1
f1
s1O
The characteristics of two brands of breakfast cereal

The Characteristics Approach
• The efficiency frontier– shows the different combinations of
characteristics that can be purchased
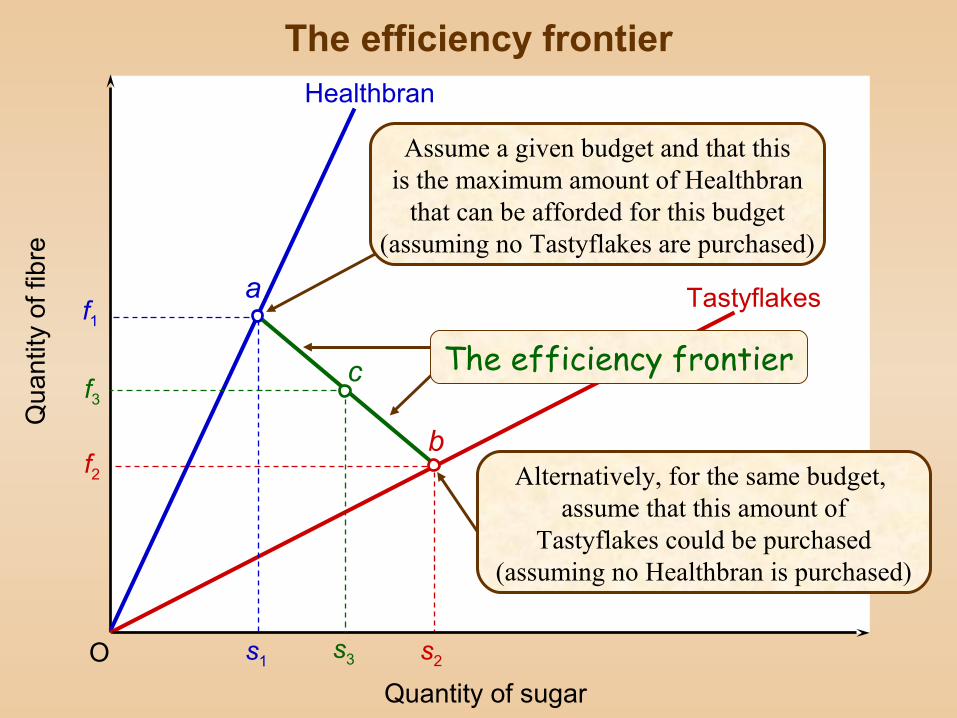
f2
s2
Assume a given budget and that thisis the maximum amount of Healthbran
that can be afforded for this budget(assuming no Tastyflakes are purchased)
f1
Qu
ant
ity o
f fib
re
Healthbran
Tastyflakes
Quantity of sugar
a
b
s1O
f3
s3
The efficiency frontier
Alternatively, for the same budget, assume that this amount of
Tastyflakes could be purchased(assuming no Healthbran is purchased)
c The efficiency frontier

Qu
ant
ity o
f fib
re
Healthbran
Tastyflakes
Quantity of sugar
O
Oatybix
Sweetreats
a
b
c
d
The efficiency frontier: four brands

The Characteristics Approach
• The efficiency frontier– shows the different combinations of
characteristics that can be purchased• interpreting a point on the frontier

fall
sall
fh
ft
sh st
Qu
ant
ity o
f fib
re
Healthbran
Tastyflakes
Quantity of sugar
a
b
O
c
d
e
Consuming a mixture of two products

The Characteristics Approach
• The efficiency frontier– shows the different combinations of
characteristics that can be purchased• interpreting a point on the frontier
– cases of shifts in the frontier
The Characteristics Approach
• The efficiency frontier– shows the different combinations of
characteristics that can be purchased• interpreting a point on the frontier
– cases of shifts in the frontier
• The optimum level of consumption

The Characteristics Approach
• The efficiency frontier– shows the different combinations of
characteristics that can be purchased• interpreting a point on the frontier
– cases of shifts in the frontier
• The optimum level of consumption– indifference curves

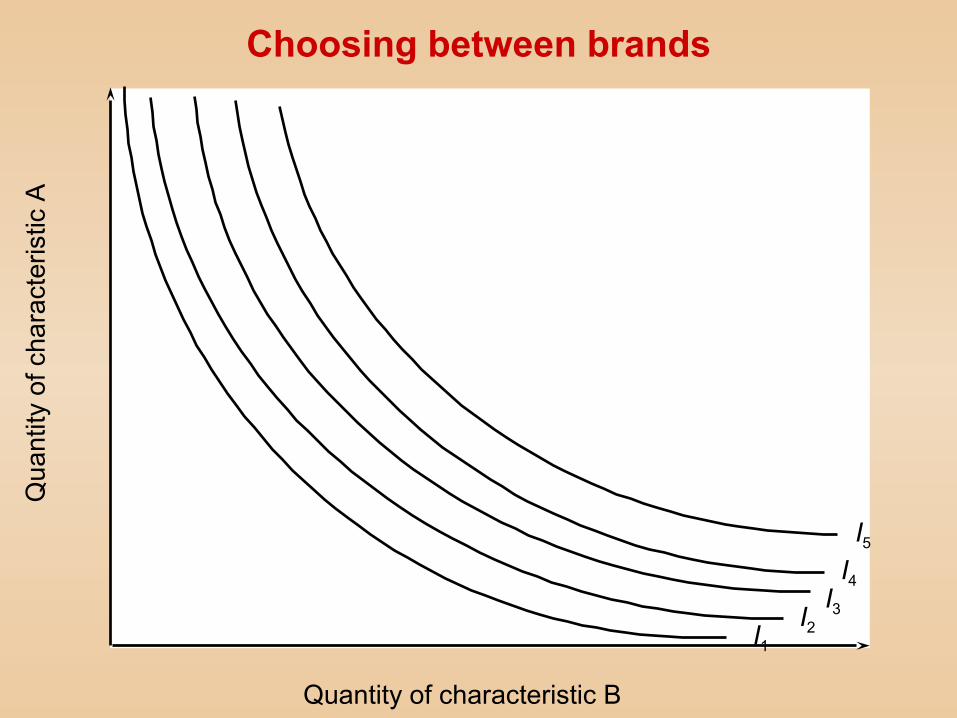
The Characteristics Approach
• The efficiency frontier– shows the different combinations of
characteristics that can be purchased• interpreting a point on the frontier
– cases of shifts in the frontier
• The optimum level of consumption– indifference curves
• plotting indifference curves

Qu
ant
ity o
f cha
ract
eris
tic A
I1I2I3I4
I5
Quantity of characteristic B
Choosing between brands
The Characteristics Approach
• The efficiency frontier– shows the different combinations of
characteristics that can be purchased• interpreting a point on the frontier
– cases of shifts in the frontier
• The optimum level of consumption– indifference curves
• plotting indifference curves
• the shape of the curves
Qu
ant
ity o
f cha
ract
eris
tic A
I1I2I3I4
I5
Quantity of characteristic B
Choosing between brands

The Characteristics Approach
• The efficiency frontier– shows the different combinations of
characteristics that can be purchased• interpreting a point on the frontier
– cases of shifts in the frontier
• The optimum level of consumption– indifference curves
• plotting indifference curves
• the shape of the curves
– the optimum consumption point

The Characteristics Approach
• The efficiency frontier– shows the different combinations of
characteristics that can be purchased• interpreting a point on the frontier
– cases of shifts in the frontier
• The optimum level of consumption– indifference curves
• plotting indifference curves
• the shape of the curves
– the optimum consumption point• the tangency point

Qu
ant
ity o
f cha
ract
eris
tic A
I1I2I3I4
I5
Brand 1Brand 2
Brand 3
Quantities of any one ofthree brands that can bepurchased for a given
budget at current prices.Brand 2 is chosen
Quantity of characteristic B
a
b
c
Choosing between brands

Qu
ant
ity o
f cha
ract
eris
tic A
I1I2I3I4
I5
Brand 1
Brand 2
Quantity of characteristic B
e
a
d
c
b
Choosing a mixture of brands

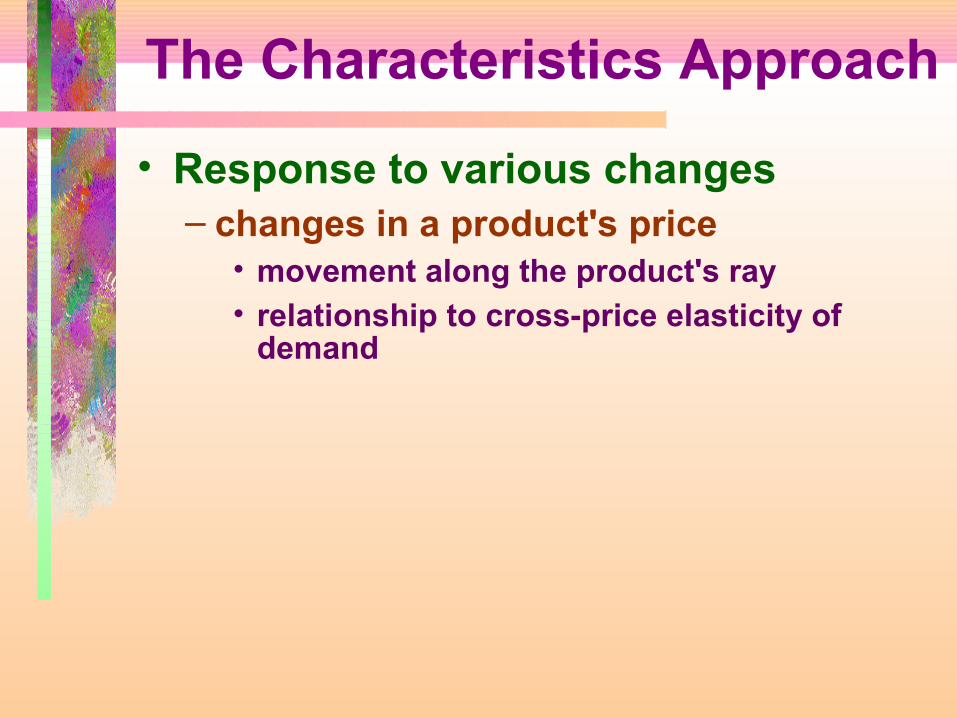
The Characteristics Approach
• Response to various changes– changes in a product's price
• movement along the product's ray

Qu
ant
ity o
f cha
ract
eris
tic A
I1I2I3I4
I5
Brand 1Brand 2
Brand 3
Quantity of characteristic B
a
b
c
d
Choosing between brands
Fall in priceof brand 1.
Brand 1 is now chosen
The Characteristics Approach
• Response to various changes– changes in a product's price
• movement along the product's ray• relationship to cross-price elasticity of
demand
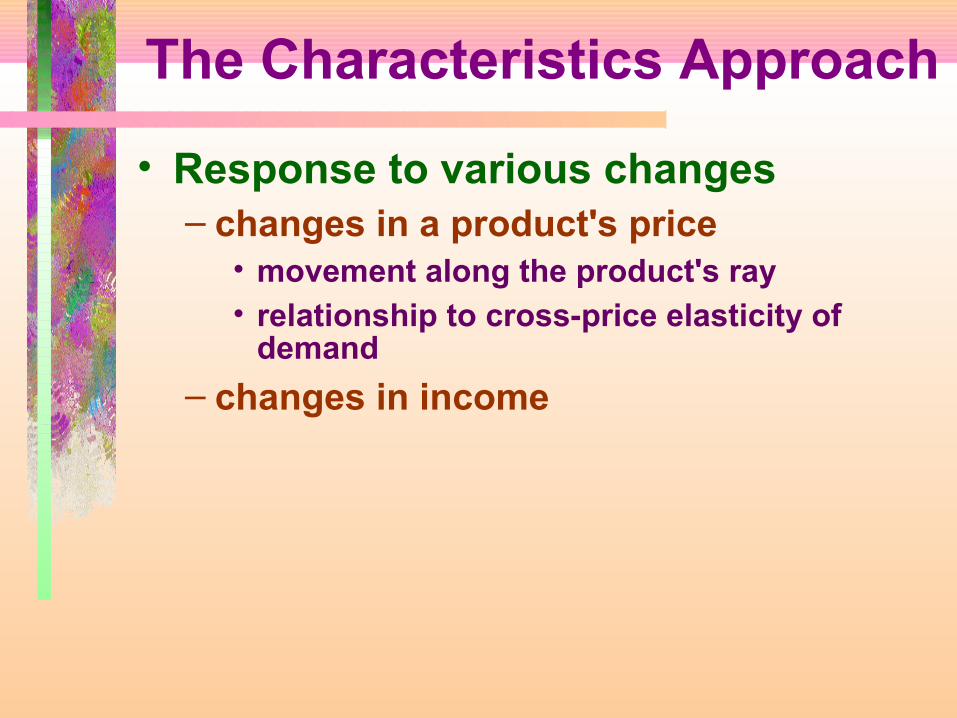
The Characteristics Approach
• Response to various changes– changes in a product's price
• movement along the product's ray• relationship to cross-price elasticity of
demand
– changes in income

The Characteristics Approach
• Response to various changes– changes in a product's price
• movement along the product's ray• relationship to cross-price elasticity of
demand
– changes in income• parallel movement of efficiency frontier

Qu
ant
ity o
f cha
ract
eris
tic A
I1I2I3I4
I5
Brand 1
Brand 2
Quantity of characteristic B
e
a
d
c
b
Choosing a mixture of brands
Rise in income

The Characteristics Approach
• Response to various changes– changes in a product's price
• movement along the product's ray• relationship to cross-price elasticity of
demand
– changes in income• parallel movement of efficiency frontier
– changes in a product's characteristics

The Characteristics Approach
• Response to various changes– changes in a product's price
• movement along the product's ray• relationship to cross-price elasticity of
demand
– changes in income• parallel movement of efficiency frontier
– changes in a product's characteristics• change in slope of product's ray

The Characteristics Approach
• Response to various changes– changes in a product's price
• movement along the product's ray• relationship to cross-price elasticity of
demand
– changes in income• parallel movement of efficiency frontier
– changes in a product's characteristics• change in slope of product's ray• movement along new ray

I2
Brand 1 (after)
I1
Qu
ant
ity o
f cha
ract
eris
tic A
Brand 1 (before)
Brand 2
Quantity of characteristic B
a
b
c
A change in the characteristics of Brand 1
Brand 2is chosen
Characteristicsof Brand 1 change
Brand 1 isnow chosen

The Characteristics Approach
• Response to various changes– changes in a product's price
• movement along the product's ray• relationship to cross-price elasticity of
demand
– changes in income• parallel movement of efficiency frontier
– changes in a product's characteristics• change in slope of product's ray• movement along new ray
– changes in tastes

The Characteristics Approach
• Response to various changes– changes in a product's price
• movement along the product's ray• relationship to cross-price elasticity of
demand
– changes in income• parallel movement of efficiency frontier
– changes in a product's characteristics• change in slope of product's ray• movement along new ray
– changes in tastes• shift in indifference curves

The Characteristics Approach
• Usefulness of characteristics approach– helps understand the nature of
consumer choice
– helps firms in understanding the effects of making changes
• to consumer perceptions– through changing product specifications
– by promoting various characteristics through advertising
• repositioning its product
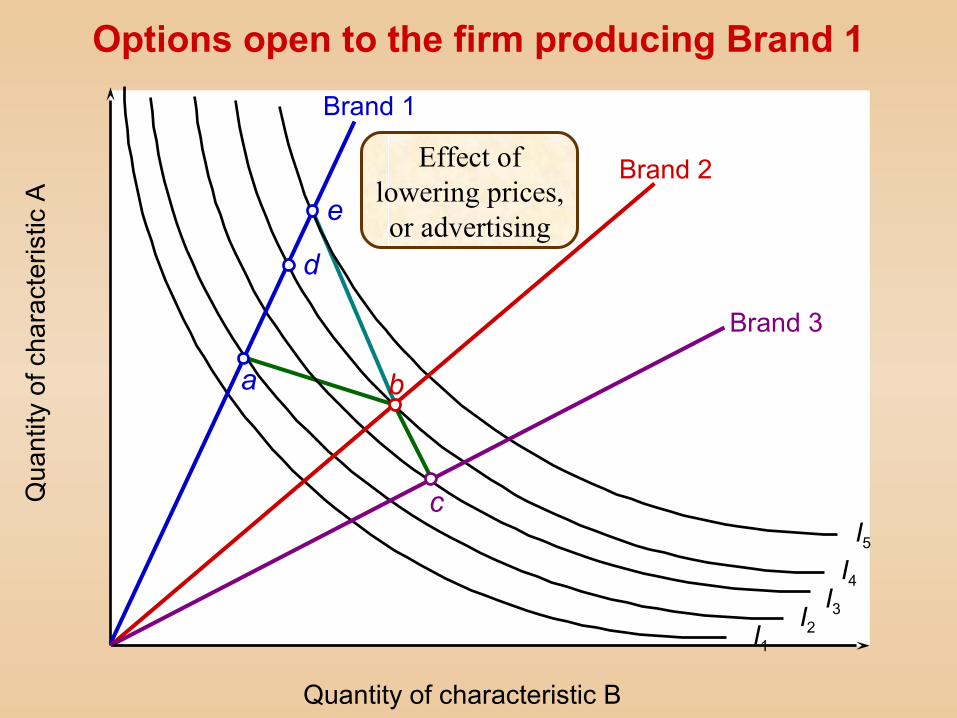
Qu
ant
ity o
f cha
ract
eris
tic A
I1I2I3I4
I5
Brand 1
Brand 2
Brand 3
a
Quantity of characteristic B
b
c
d
Options open to the firm producing Brand 1
e
Effect oflowering prices,or advertising

The Characteristics Approach
• Usefulness of characteristics approach– helps understand the nature of
consumer choice
– helps firms in understanding the effects of making changes
• to consumer perceptions– through changing product specifications
– by promoting various characteristics through advertising
• repositioning its product
• launching a new brand

The Characteristics Approach
• Limitations of characteristics approach– problem in measuring characteristics
– most products have many characteristics
• only two characteristics can be plotted
– problem in identifying indifference curves
• hard for one individual
• more difficult for whole markets– but can divide markets into segments
– consumer tastes change


