08 Dec 2005 1 Accountant Perspective On Appraisal Value Derivation Conference: Dynamic Solvency Testing & Appraisal Value Thursday, 8 December 2005 Ballroom Sahid Hotel Jaya – Jakarta Presented by : Simon Imanto – Head Finance and Accounting PT AIG Life
Value DerivationConference: Dynamic Solvency Testing & Appraisal Value
Thursday, 8 December 2005
Ballroom Sahid Hotel Jaya – Jakarta
Presented by : Simon Imanto – Head Finance and Accounting
PT AIG Life
08 Dec 2005 2
• How to Measure a Life Insurance Company
• Different Measures of the Same
• Statutory Profits– Key Drivers
• Achieved Profits– Profit Factors
– Key Drivers
– Reporting
– Areas for Focus
Topics
08 Dec 2005 3
Some methods are used by:
Info Bank Magazine
Investor Magazine
Bisnis Indonesia Newspaper
How to Measure a Life Insurer
08 Dec 2005 4
Info Bank Magazine
1. Risk based capital (RBC)
2. Liquidity
3. Statutory deposit / reserve
4. Investment / reserve + claim payable
5. Fixed asset / equity
6. Gross premium growth
7. Net premium income / equity
8. Net investment income / average of investment
9. Expense (claim + expense + commission)/net premium income
10. Profit (loss) before tax / average of equity
08 Dec 2005 5
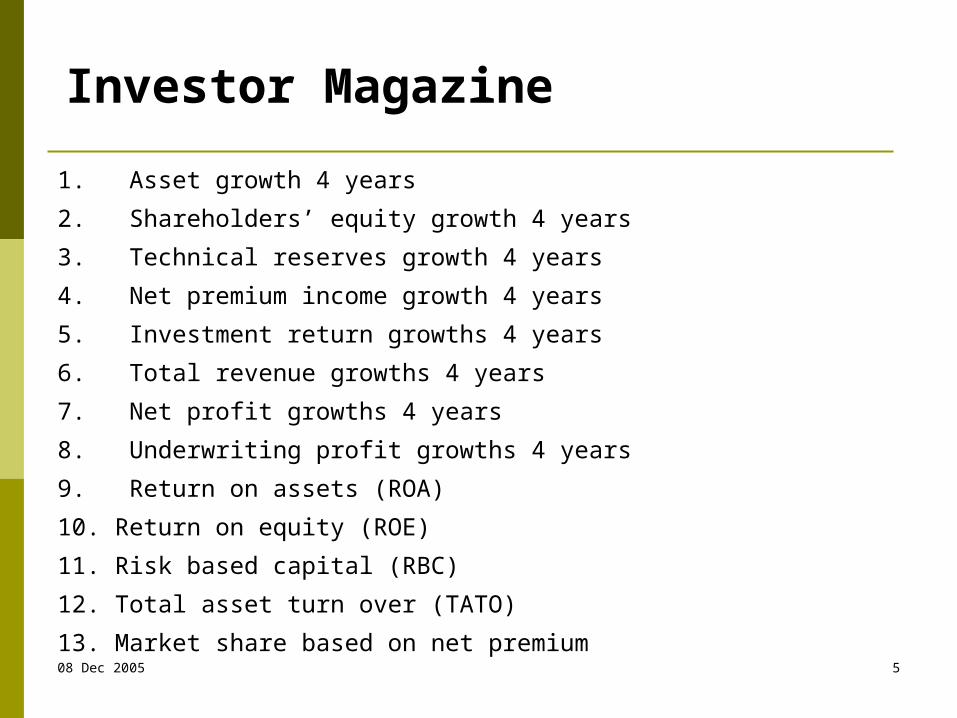
Investor Magazine
1. Asset growth 4 years
2. Shareholders’ equity growth 4 years
3. Technical reserves growth 4 years
4. Net premium income growth 4 years
5. Investment return growths 4 years
6. Total revenue growths 4 years
7. Net profit growths 4 years
8. Underwriting profit growths 4 years
9. Return on assets (ROA)
10. Return on equity (ROE)
11. Risk based capital (RBC)
12. Total asset turn over (TATO)
13. Market share based on net premium
08 Dec 2005 6
Bisnis Indonesia Newspaper
1. Risk based capital (RBC)
2. Liquidity
3. Productive asset ratio
4. Solvency
5. Investment return
6. Return on equity
7. Cash flow
8. Economic scale
08 Dec 2005 7
Statutory ReportsPUBLISHED FINANCIAL STATEMENT YEAR 2004 (in the newspapers)
A B C D E FINVESTMENTTotal Investment 4,760,322 3,541,061 3,097,049 2,672,067 2,568,145 2,437,858 NON INVESTMENTTotal Non Investment 481,360 300,630 318,963 123,141 111,720 135,688 Total Assets 5,241,682 3,841,691 3,416,012 2,795,208 2,679,865 2,573,546
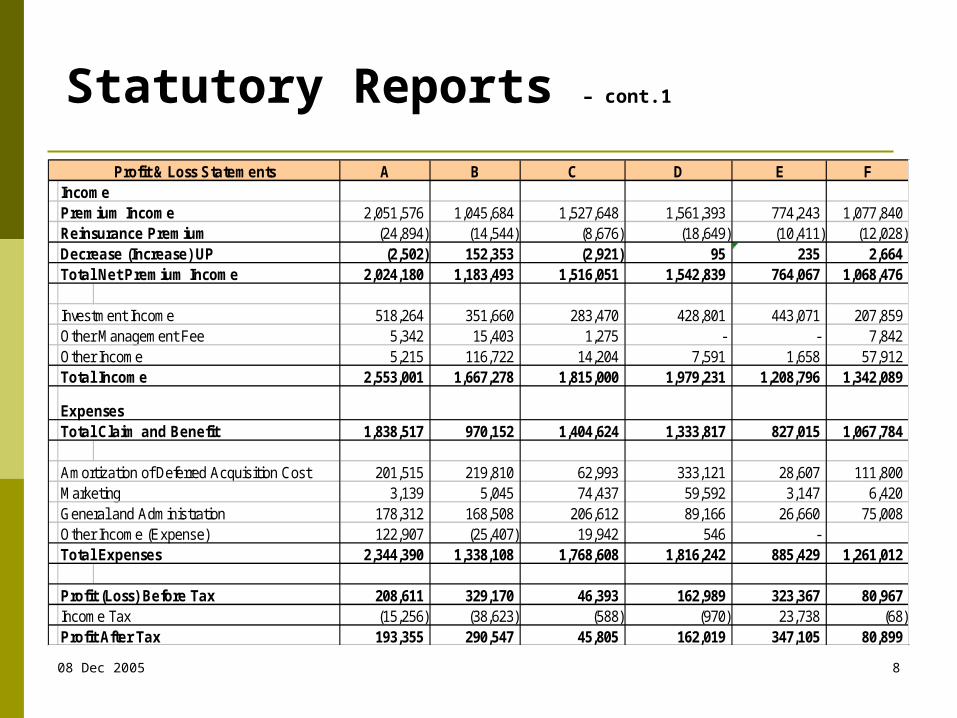
A B C D E FIncomePremium Income 2,051,576 1,045,684 1,527,648 1,561,393 774,243 1,077,840 Reinsurance Premium (24,894) (14,544) (8,676) (18,649) (10,411) (12,028) Decrease (Increase) UP (2,502) 152,353 (2,921) 95 235 2,664 Total Net Premium Income 2,024,180 1,183,493 1,516,051 1,542,839 764,067 1,068,476
Investment Income 518,264 351,660 283,470 428,801 443,071 207,859 Other Management Fee 5,342 15,403 1,275 - - 7,842 Other Income 5,215 116,722 14,204 7,591 1,658 57,912 Total Income 2,553,001 1,667,278 1,815,000 1,979,231 1,208,796 1,342,089
ExpensesTotal Claim and Benefit 1,838,517 970,152 1,404,624 1,333,817 827,015 1,067,784
Amortization of Deferred Acquisition Cost 201,515 219,810 62,993 333,121 28,607 111,800 Marketing 3,139 5,045 74,437 59,592 3,147 6,420 General and Administration 178,312 168,508 206,612 89,166 26,660 75,008 Other Income (Expense) 122,907 (25,407) 19,942 546 - Total Expenses 2,344,390 1,338,108 1,768,608 1,816,242 885,429 1,261,012
Profit (Loss) Before Tax 208,611 329,170 46,393 162,989 323,367 80,967 Income Tax (15,256) (38,623) (588) (970) 23,738 (68) Profit After Tax 193,355 290,547 45,805 162,019 347,105 80,899
Profit & Loss Statements
08 Dec 2005 9
Different bases but what’s the difference?
• Local Statutory
• Income Less Expenditure
• Cash
• US GAAP
• Modified Statutory Basis (MSB : UK GAAP)
• Achieved Profits
08 Dec 2005 10
ONLY TIMING DIFFERENCES
• Statutory Profits is a one year snapshot
• Achieved Profits takes into account the income and expenditure arising over the entire life that the policy is in-force
The difference is ….
08 Dec 2005 11
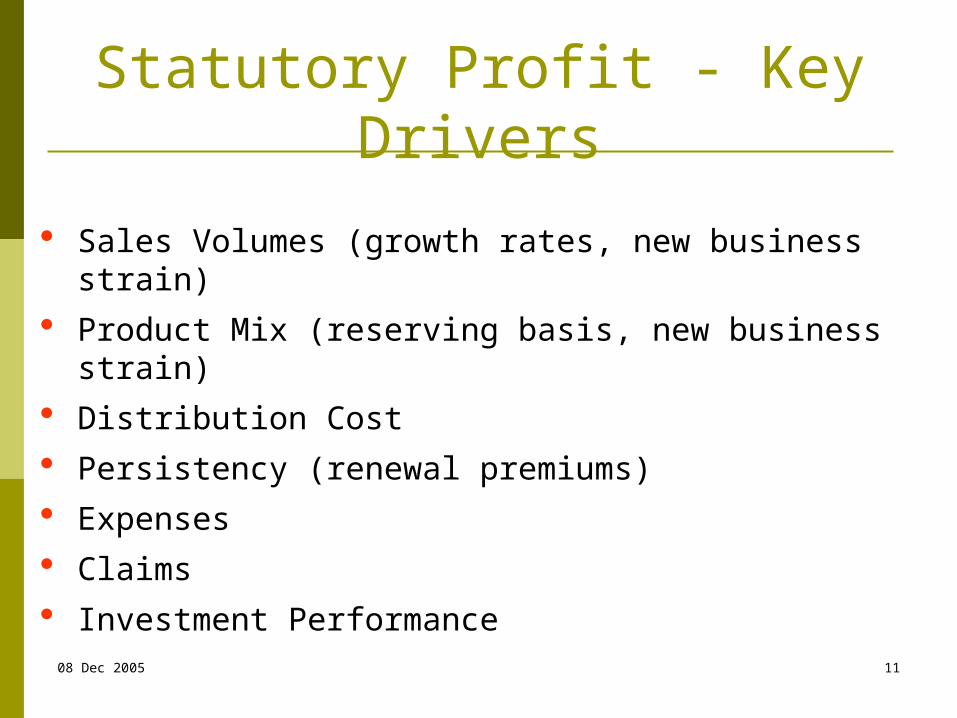
Statutory Profit - Key Drivers
Sales Volumes (growth rates, new business strain) Product Mix (reserving basis, new business strain) Distribution Cost Persistency (renewal premiums) Expenses Claims Investment Performance
08 Dec 2005 12
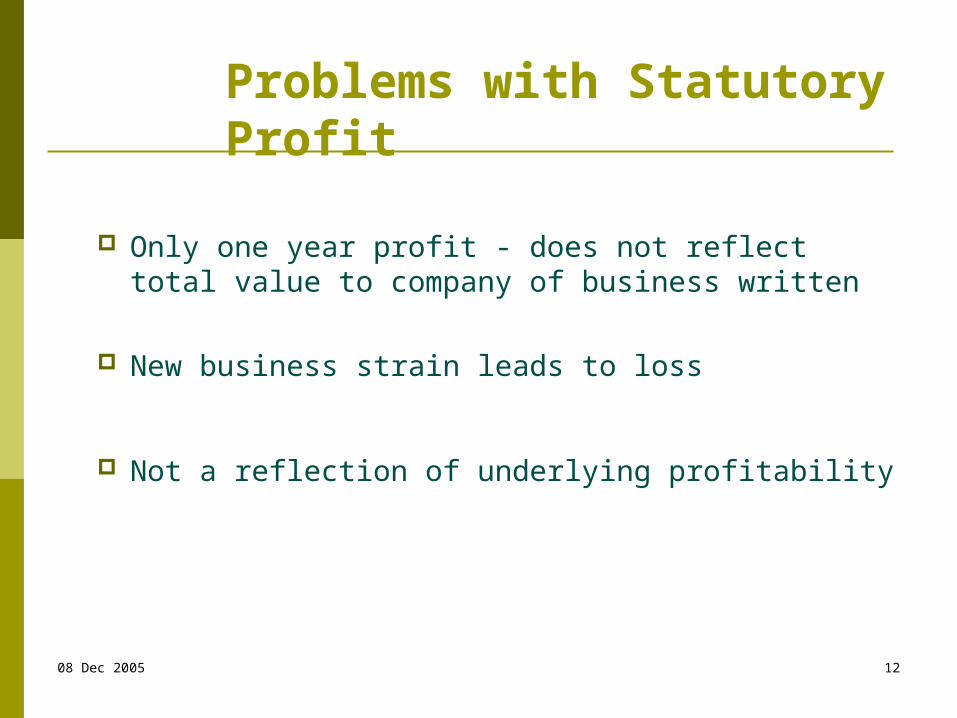
Only one year profit - does not reflect total value to company of business written
New business strain leads to loss
Not a reflection of underlying profitability
Problems with Statutory Profit
08 Dec 2005 13
Achieved ProfitsAchieved Profits
08 Dec 2005 14
Achieved Profit New Business Achieved Profit - accounts for all expected
future profits in the year that business is sold, on a discounted basis
In Force Achieved Profit – expected IFAP is the increase in the value of profits over the year as the discounting period reduces
Experience variances are differences between expected achieved profits during the year and actual achieved profits
08 Dec 2005 15
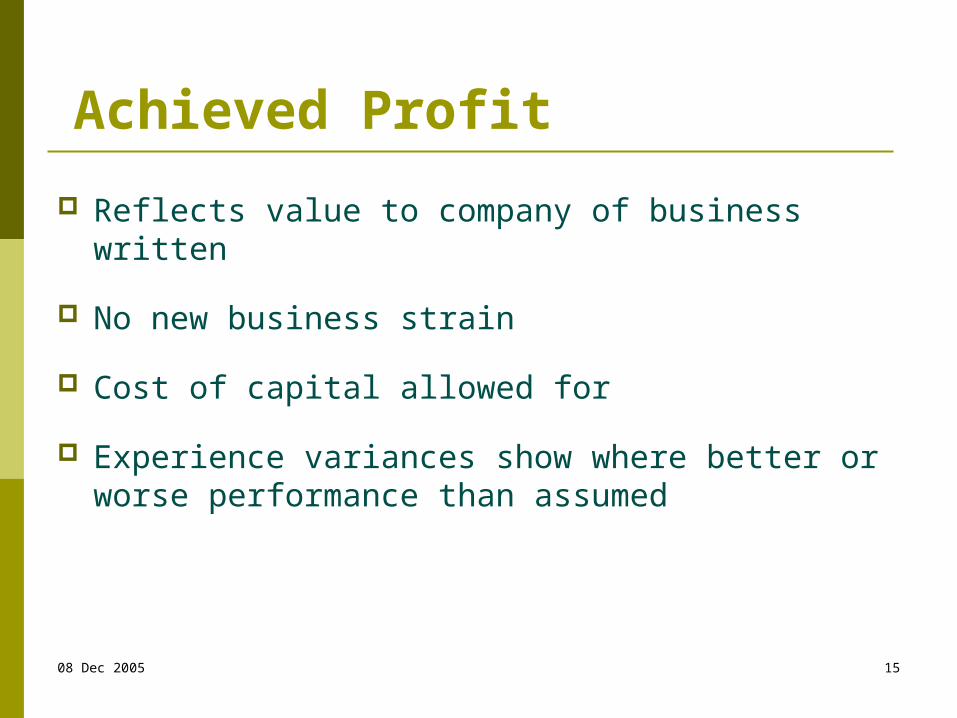
Achieved Profit
Reflects value to company of business written
No new business strain
Cost of capital allowed for
Experience variances show where better or worse performance than assumed
08 Dec 2005 16
Achieved Profits - Achieved or Achievable??
Achieved Profits is based on assumptions of future events: Investment returns Persistency Claims Expenses Tax
Then discounted to a Net Present Value using a selected Risk Discount Rate
08 Dec 2005 17
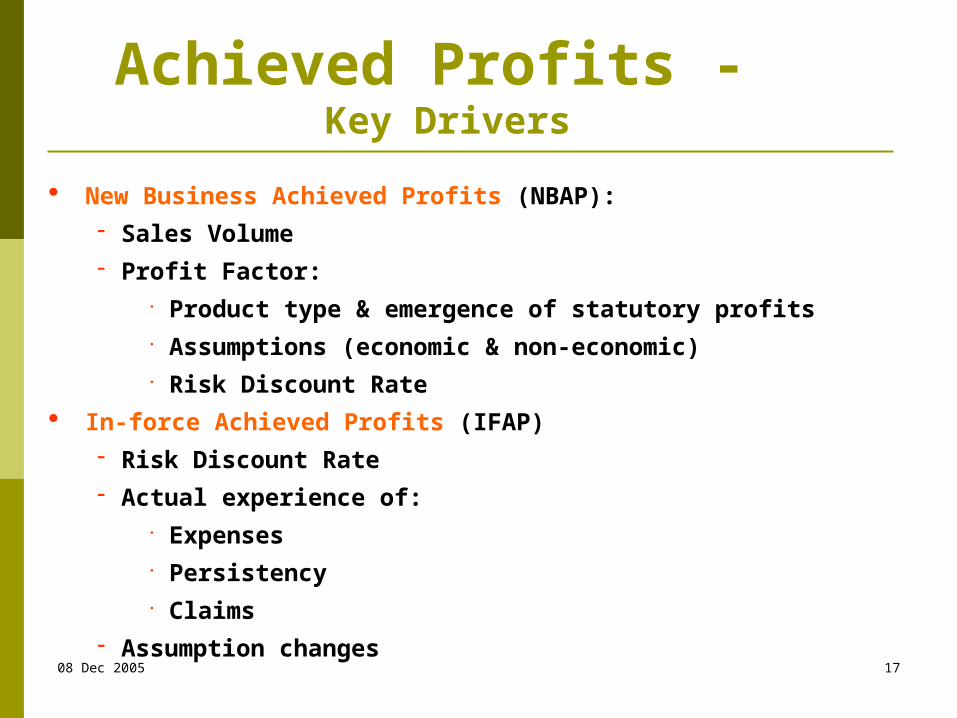
Achieved Profits - Key Drivers
New Business Achieved Profits (NBAP): Sales Volume Profit Factor:
Product type & emergence of statutory profits Assumptions (economic & non-economic) Risk Discount Rate
In-force Achieved Profits (IFAP) Risk Discount Rate Actual experience of:
Expenses Persistency Claims
Assumption changes
08 Dec 2005 18
Achieved ProfitsAchieved Profits = Change in Embedded Value + current year Statutory Profit
Embedded Value = Net Present Value of future expected Statutory Profits
08 Dec 2005 19
Achieved Profits - Key Reporting Measures
Weighted New Business Sales (“APE” or “FYP”)
[Regular + 10% Single Premium]
NBAP
[NBAP from regular & single]
AP Margin % = ___NBAP__
APE or FYP
08 Dec 2005 20
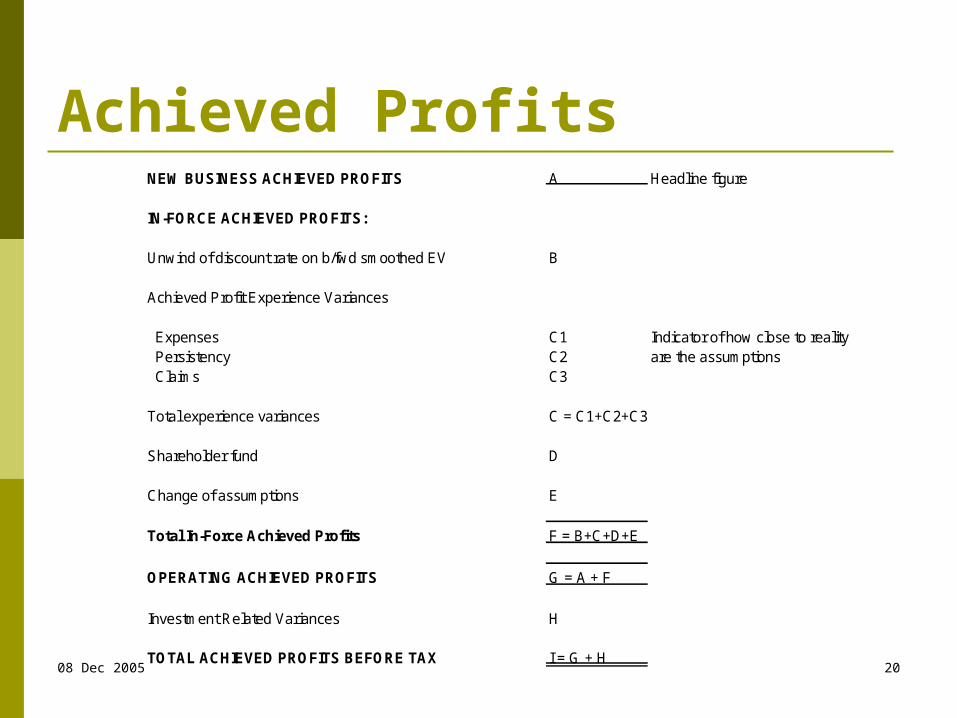
Achieved ProfitsNEW BUSINESS ACHIEVED PROFITS A Headline figure
IN-FORCE ACHIEVED PROFITS:
Unwind of discount rate on b/fwd smoothed EV B
Achieved Profit Experience Variances
Expenses C1 Indicator of how close to reality Persistency C2 are the assumptions Claims C3
Total experience variances C = C1+C2+C3
Shareholder fund D
Change of assumptions E
Total In-Force Achieved Profits F = B+C+D+E
OPERATING ACHIEVED PROFITS G = A + F
Investment Related Variances H
TOTAL ACHIEVED PROFITS BEFORE TAX I = G + H
08 Dec 2005 21
Achieved Profits An Example
Achieved Profits FY 2005FY 2005
Rp'millionNew Business Achieved Profits (Reg + Single) A 35,000.0
In-Force Achieved ProfitsUnwind of discount rate on b/fwd smoothed EV B1 11,000.0
Achieved Profit Experience Variances Expenses B2a (17,500.0) Persistency B2b 3,000.0 Claims B2c 2,000.0 Others (please specify) - Future losses on NB B2d - Total experience variances B2 (12,500.0)
Shareholder fund B3 -
Change of assumptions(please explain in commentary) B4 -
Total In-Force Achieved Profits B (1,500.0)
Total Operating Achieved profits C=A+B 33,500.0 1)
Investment Related Variances D 12,500.0 2)
Total Achieved Profit Before Tax E=C+D 46,000.0
Tax F -
Total Achieved Profit after tax G=E+F 46,000.0
08 Dec 2005 22
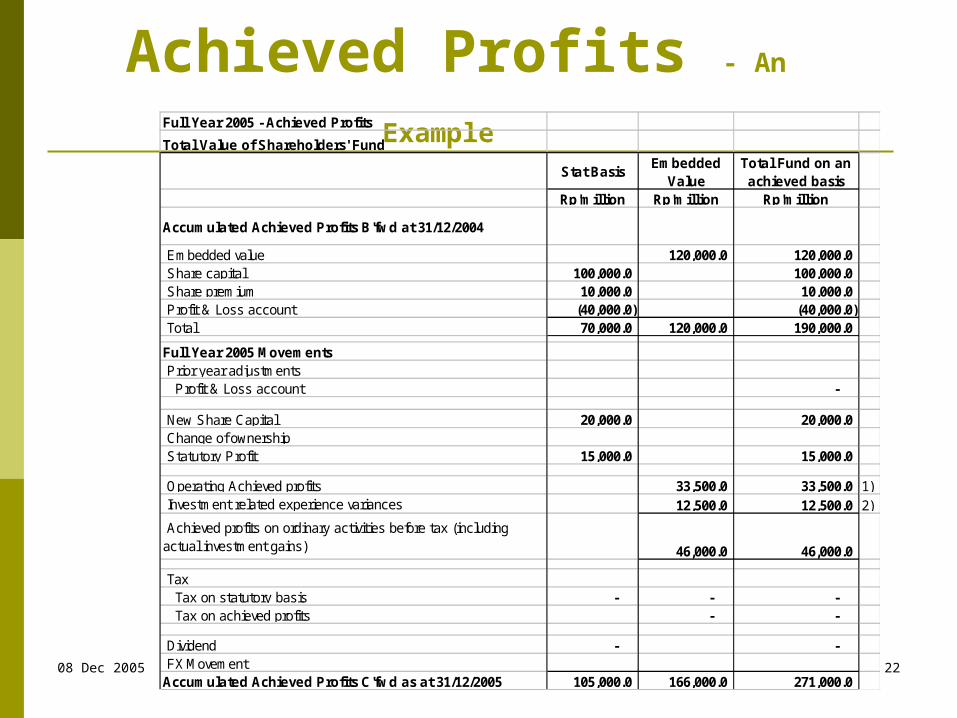
Achieved Profits - An Example Full Year 2005 - Achieved Profits
Total Value of Shareholders' Fund
Stat BasisEmbedded
ValueTotal Fund on an achieved basis
Rp'million Rp'million Rp'million
Accumulated Achieved Profits B'fwd at 31/12/2004
Embedded value 120,000.0 120,000.0 Share capital 100,000.0 100,000.0 Share premium 10,000.0 10,000.0 Profit & Loss account (40,000.0) (40,000.0) Total 70,000.0 120,000.0 190,000.0
Full Year 2005 Movements Prior year adjustments Profit & Loss account -
New Share Capital 20,000.0 20,000.0 Change of ownership Statutory Profit 15,000.0 15,000.0
Achieved profits on ordinary activities before tax (including actual investment gains) 46,000.0 46,000.0
Tax Tax on statutory basis - - - Tax on achieved profits - -
Dividend - - FX Movement Accumulated Achieved Profits C'fwd as at 31/12/2005 105,000.0 166,000.0 271,000.0
08 Dec 2005 23
Asset ValuationAsset Valuation
08 Dec 2005 24
MOF Decree 424/KMK.06/2003
Summary of financial soundness – see attached
Considered Points for revising :
• Gov. Bonds : based on book value
• Statutory Deposits : could be allowed investing on Gov. Bonds
08 Dec 2005 25
Deferred TaxDeferred Tax
08 Dec 2005 26
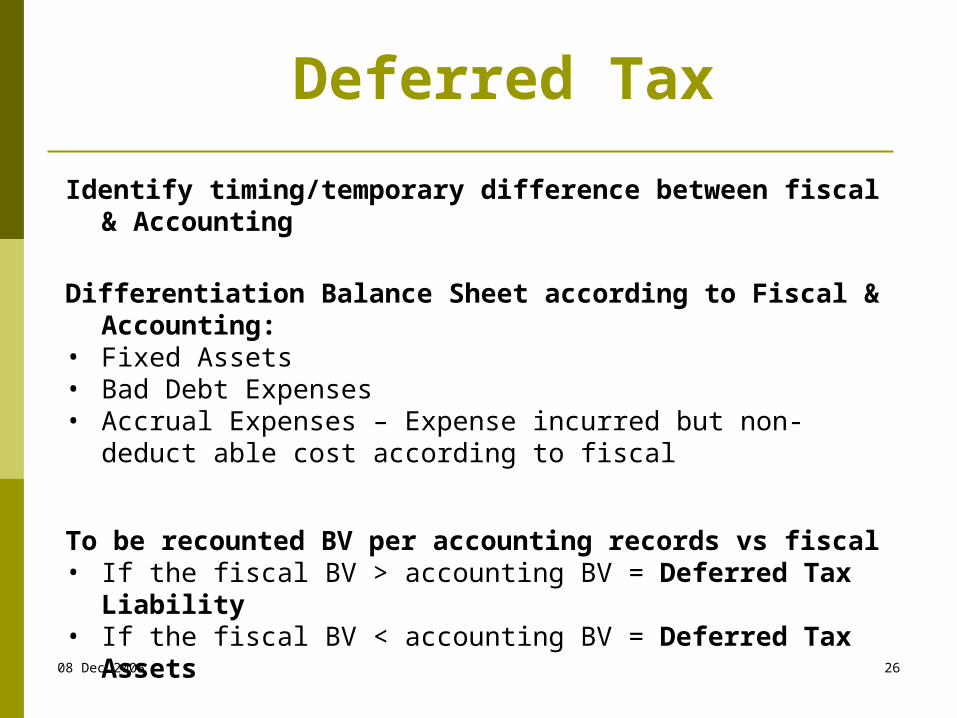
Deferred Tax
Identify timing/temporary difference between fiscal & Accounting
Differentiation Balance Sheet according to Fiscal & Accounting:
• Fixed Assets• Bad Debt Expenses• Accrual Expenses – Expense incurred but non-deduct able
cost according to fiscal
To be recounted BV per accounting records vs fiscal• If the fiscal BV > accounting BV = Deferred Tax Liability• If the fiscal BV < accounting BV = Deferred Tax Assets
08 Dec 2005 27
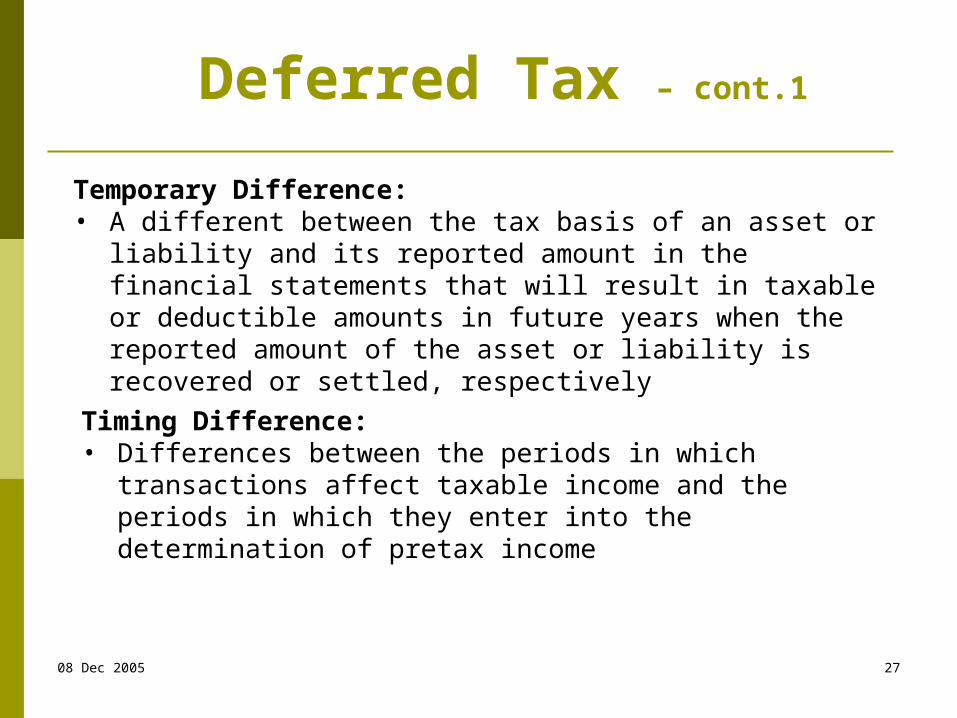
Deferred Tax – cont.1
Temporary Difference:• A different between the tax basis of an asset or liability
and its reported amount in the financial statements that will result in taxable or deductible amounts in future years when the reported amount of the asset or liability is recovered or settled, respectively
Timing Difference:• Differences between the periods in which transactions
affect taxable income and the periods in which they enter into the determination of pretax income
08 Dec 2005 28
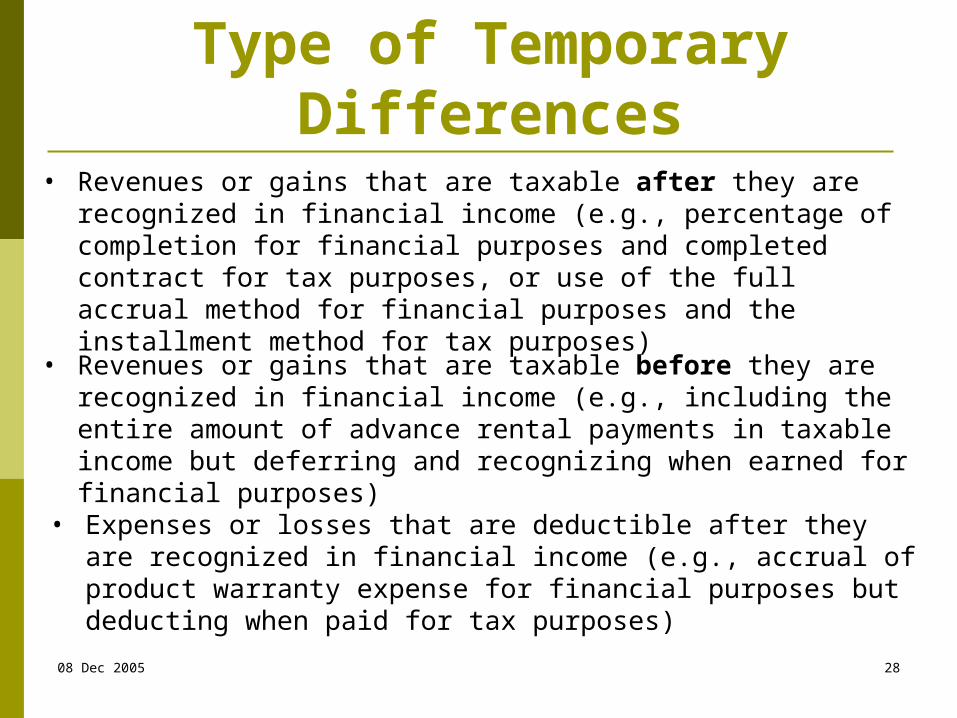
Type of Temporary Differences
• Revenues or gains that are taxable after they are recognized in financial income (e.g., percentage of completion for financial purposes and completed contract for tax purposes, or use of the full accrual method for financial purposes and the installment method for tax purposes)
• Expenses or losses that are deductible after they are recognized in financial income (e.g., accrual of product warranty expense for financial purposes but deducting when paid for tax purposes)
• Revenues or gains that are taxable before they are recognized in financial income (e.g., including the entire amount of advance rental payments in taxable income but deferring and recognizing when earned for financial purposes)
08 Dec 2005 29
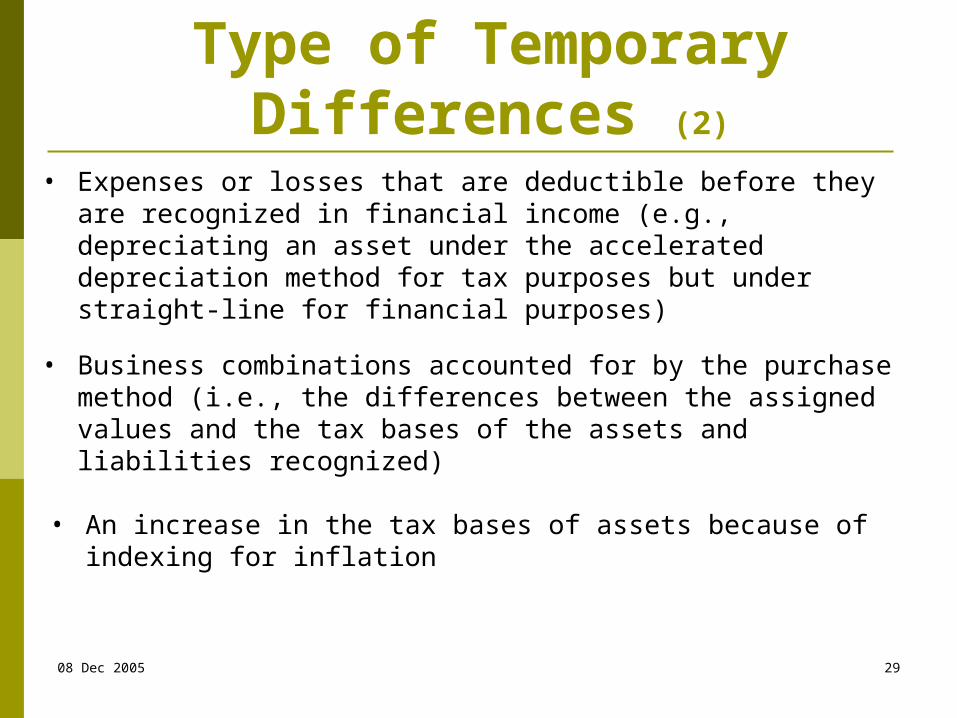
Type of Temporary Differences (2)
• Expenses or losses that are deductible before they are recognized in financial income (e.g., depreciating an asset under the accelerated depreciation method for tax purposes but under straight-line for financial purposes)
• An increase in the tax bases of assets because of indexing for inflation
• Business combinations accounted for by the purchase method (i.e., the differences between the assigned values and the tax bases of the assets and liabilities recognized)