29
08/16/01
| Date post: | 19-Dec-2015 |
| Category: |
Documents |
| View: | 213 times |
| Download: | 1 times |

08/16/01

08/16/01
Link Budgets for Cellular Networks
Link Budgets for Cellular Networks
Presented by Eric Johnson

08/16/01
IntroductionIntroduction
Overview Link Budget Importance Path Balance Finding ERP Parameters Scenarios
08/16/01
Importance of a Link BudgetImportance of a Link Budget
What is a Link Budget? Determines tower transmit ERP for
sufficient signal strength at the cell boundary for a quality mobile call
Defines the cell coverage radius when used with a path loss model
Why need a Link Budget? Determine transmit ERP and cell radius Ensure path balance
Balance the uplink and downlink power Don’t transmit more base station power than the
maximum cell phone power capability
08/16/01
Importance of a Link BudgetImportance of a Link Budget
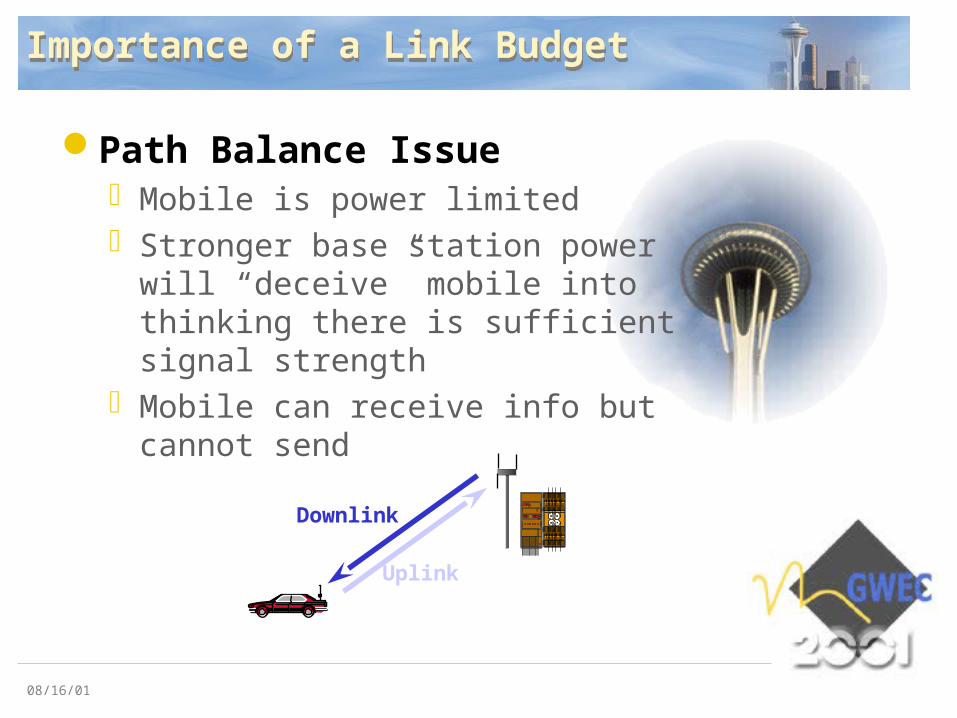
Path Balance Issue Mobile is power limited Stronger base station power will
“deceive” mobile into thinking there is sufficient signal strength
Mobile can receive info but cannot send
Uplink
Downlink

08/16/01
Importance of a Link BudgetImportance of a Link Budget
Consequences Mobile call initiations will fail and
poor handoff decisions will be made At the cell boundary
Solution Setting the base station power to
“match” the mobile power allows for optimum performance
Path balance

08/16/01
Path BalancePath Balance
Balanced Path
Distance from mobile
fromtower
Pow
er
Min. Receive Pwr
ERP Max. Mobile Pwr
Min. Receive Pwr
Same
Path Loss

08/16/01
Path BalancePath Balance
Not path balanced
CurrentPower
Max. Mobile Pwr
Min. Receive Pwr
Previous Distance
Cannot Receive
PreviousPower
Min. Receive Pwr

08/16/01
Path BalancePath Balance
Path balance limited by mobile powerIS-136
Older phone’s max. power: 3 W (35 dBm) Current phones max. power: 0.6 W (28 dBm)
Ranges from 26 to 28 dBm
Benefit: less power consumption less recharging Drawback: smaller cell coverage more cells
GSM Mobile power max.: 1.0 W (30 dBm)

08/16/01
Finding ERPFinding ERP
Link budget determines transmit ERP Network is limited by mobile power Typical transmit is 100 W ERP
Transmit ERP determines cell radius Radius also depends on tower
height and path loss environment Small improvement (1 dB) in link
budget can provide large coverage gains

08/16/01
Finding ERPFinding ERP
Distance from mobile
fromtower
Pow
erERP?
Min. Receive Pwr
Mobile to TowerPath Loss
Mobile to Tower Path Loss
PathLoss
Max. Mobile Pwr
Min. Receive Pwr

08/16/01
ParametersParameters
Summary of Parameters Thermal Noise Power Antenna Gain Signal to Noise (S/N) Minimum Input Power
Simplified Example
IS-136Thermal Noise -129.0 dBm AAntenna Gain 12.0 dBi BCable Loss 1.2 dB CS/N 15.0 dB DMinimum Input Power -124.8 dBm E = A - B + C + D

08/16/01
ParametersParameters
Noise-Limited System Ambient temperature creates noise floor Interference from high frequency re-use
may cause system to be interference limited
Site measurements determine if noise or interference limited
The following analysis assumes a noise limited system

08/16/01
ParametersParameters
Thermal Noise Power PN = kTB
k = boltzman’s constant T = ambient temperature in Kelvin B = signal bandwidth
IS-136 PN = -129 dBm
GSM PN = -121 dBm
dBm 129)10*)(294)(3010*(1.38P 323N
dBm 121)10*)(294)(20010*(1.38P 323N
08/16/01
ParametersParameters
Thermal Noise Power (cont.) The noise floor for GSM is 8 dB
higher than IS-136 because it uses a wider bandwidth signal
Result: IS-136 is 8 dB more sensitive to lower power signals

08/16/01
ParametersParameters
Antenna Gain Tower gain ranges from 6 dBd to 16 dBd
Mobile gain typically 0 dBd (-2 dBd to 0 dBd)
gain more uplink larger coverage area gain narrower beamwidth Gain choice depends on desired coverage area
More Gain Narrower
Beam
Less Gain Broader
BeamIsotropicGain

08/16/01
ParametersParameters
Cable Loss 1-5/8” diameter
0.8 dB/100-ft
7/8” diameter 1.2 dB/100-ft
Tower heights range from 30 ft to 600 ft

08/16/01
ParametersParameters
Signal to Noise (S/N) IS-136 15 dB (15 - 17 dB) GSM 11 dB (7 - 12 dB) GSM has a S/N advantage over IS-136 GSM has more tolerance for errors than IS-136
Wider bandwidth and different modulation scheme
Difference between GSM and IS-136 GSM noise floor is worse (higher) than IS-136 GSM S/N is better (lower) than IS-136 GSM has more uplink power available Result: GSM and IS-136 have comparable link
budgets, so only analyze IS-136 link budget

08/16/01
Scenario 1: BaselineScenario 1: Baseline
Site Configuration Height: 200 ft Antenna Gain: 12 dBd Cable: 1-5/8” 0.8 dB/100-ft
Determine ERP Path balance to find ERP

08/16/01
Scenario 1: BaselineScenario 1: Baseline
Min. input powerBase Mobile
Uplink Downlink
Channel BW (kHz) 30.0 kHz 30.0 kHzAmbient Temperature (deg F) 70 deg F 70 deg FThermal Noise (Kelvin) 294.1 K 294.1 KNoise Floor (dBm) -129.1 dBm -129.1 dBm ARBS Noise Figure (dB) 4.0 dB 9.0 dB BNoise Floor (dBm) -125.1 dBm -120.1 dBm C = A + BCable Length (ft) 220.0 ftCable Loss per 100 ft (dB/100-ft) 0.8 dBReceiver Cable Loss (dB) 1.7 dB DEffective Noise Floor (dBm) -123.5 dBm -120.1 dBm E = C + DC/N (3% BER) (dB) 15.0 dB 15.0 dB FMin. Radio Input (dBm) -108.5 dBm -105.1 dBm G = E + FBody Loss (dB) 3.0 dB HVehicle Loss (dB) 5.0 dB IOther: in building coverage (dB) 0.0 dB JReceiver Antenna Gain (dBd) 12.0 dBd 0.0 dBd KReceiver Diversity Gain (dB) 5.0 dB LEffective Min. Input (dBm) -125.5 dBm -97.1 dBm M = G + H + I + J - K - L

08/16/01
Scenario 1: BaselineScenario 1: Baseline
Max. path loss and max. transmit powerMobile BaseUplink Downlink
Transmit PA (W) 0.6 W 16.9 WTransmit PA (dBm) 27.8 dBm 42.3 dBm ATransmit Cable Loss Total (dB) 1.7 dB BTransmit Combiner Loss (dB) 4.5 dB CTransmit Antenna Gain (dBd) 0.0 dBd 12.0 dBd DTransmit ERP (dBm) 27.8 dBm 48.1 dBm E = A - B - C + DTransmit ERP (W) 0.6 W 64.4 WBody Loss (dB) 3.0 dB FVehicle Loss (dB) 5.0 dB GOther: in building coverage (dB) 0.0 dB HSlow fade margin (dB) 5.4 dB 5.4 dB IEffective Transmit Power (dBm) 14.4 dBm 42.7 dBm J = E - F - G - H - I
Effective Min. Input (dBm) -125.5 dBm -97.1 dBm
Max. Path Loss (dB) 139.8 dB 139.8 dB

08/16/01
Scenario 2: Less Antenna GainScenario 2: Less Antenna Gain
Less antenna gain Wider beamwidth for broader coverage Reduces uplink Reduces cell radius
Site Configuration Height: 200 ft Antenna Gain: 8 dBd Cable: 1-5/8” 0.8 dB/100-ft
Results ERP: 25.7 W Radius: 76% than with 12 dBd

08/16/01
Scenario 3: TMAsScenario 3: TMAs
Tower-Mounted Amplifiers (TMAs) Also called Tower-Top Amplifiers (TTAs) or
Mast Head Amplifiers (MHAs) Essentially a Low-Noise Amplifier (LNA) mounted
most often at the top of the tower Use TMA if high cable loss
TMA gain “eliminates” the losses due to the cable Total system gain reduced through equation below TMA noise figure must be lower than the cable loss About 200 ft or taller implies 1.5 dB, so TMA useful
cableTMA
RBS
TMA
cableTMAt GG
F
G
FFF
11

08/16/01
Scenario 3: TMAsScenario 3: TMAs
Disadvantages Intermodulation products may be
amplified causing more interference Excessive gain amplifies intermodulation effects
more than it amplifies the desired signal Want gain = losses, so include attenuators if
necessary
Band filters typical Advantage: helps reduce intermodulation
interference Disadvantage: slightly different frequency bands
replace TMA
More logistics to replace or troubleshoot Moderately high cost

08/16/01
Scenario 3: TMAsScenario 3: TMAs
Min. input powerBase Mobile
Uplink Downlink
Channel BW (kHz) 30.0 kHz 30.0 kHzAmbient Temperature (deg F) 70 deg F 70 deg FThermal Noise (Kelvin) 294.1 K 294.1 KNoise Floor (dBm) -129.1 dBm -129.1 dBm ARBS Noise Figure (dB) 4.0 dB 9.0 dB BNoise Floor (dBm) -125.1 dBm -120.1 dBm C = A + BCable Length (ft) 220.0 ftCable Loss per 100 ft (dB/100-ft) 0.8 dBReceiver Cable Loss (dB) 1.7 dB DEffective Noise Floor no TMA -123.5 dBm AA = C + DTMA Gain 12.0 dBTMA Noise Figure 1.2 dB BBSystem Noise Figure with TMA 5.1 dB CCEffective Gain of using TMA 0.6 dB DD = C + D - BBEffective Noise Floor (dBm) -124.0 dBm -120.1 dBm E = C + CC (mobile = C)C/N (3% BER) (dB) 15.0 dB 15.0 dB FMin. Radio Input (dBm) -109.0 dBm -105.1 dBm G = E + FBody Loss (dB) 3.0 dB HVehicle Loss (dB) 5.0 dB IOther: in building coverage (dB) 0.0 dB JReceiver Antenna Gain (dBd) 12.0 dBd 0.0 dBd KReceiver Diversity Gain (dB) 5.0 dB LEffective Min. Input (dBm) -126.0 dBm -97.1 dBm M = G + H + I + J - K - L

08/16/01
Scenario 3: TMAsScenario 3: TMAs
Max. path loss and max. transmit powerMobile BaseUplink Downlink
Transmit PA (W) 0.6 W 19.3 WTransmit PA (dBm) 27.8 dBm 42.9 dBm ATransmit Cable Loss Total (dB) 1.7 dB BTransmit Combiner Loss (dB) 4.5 dB CTransmit Antenna Gain (dBd) 0.0 dBd 12.0 dBd DTransmit ERP (dBm) 27.8 dBm 48.7 dBm E = A - B - C + DTransmit ERP (W) 0.6 W 73.6 WBody Loss (dB) 3.0 dB FVehicle Loss (dB) 5.0 dB GOther: in building coverage (dB) 0.0 dB HSlow fade margin (dB) 5.4 dB 5.4 dB IEffective Transmit Power (dBm) 14.4 dBm 43.3 dBm J = E - F - G - H - I
Effective Min. Input (dBm) -126.0 dBm -97.1 dBm
Max. Path Loss (dB) 140.4 dB 140.4 dB
08/16/01
SummarySummary
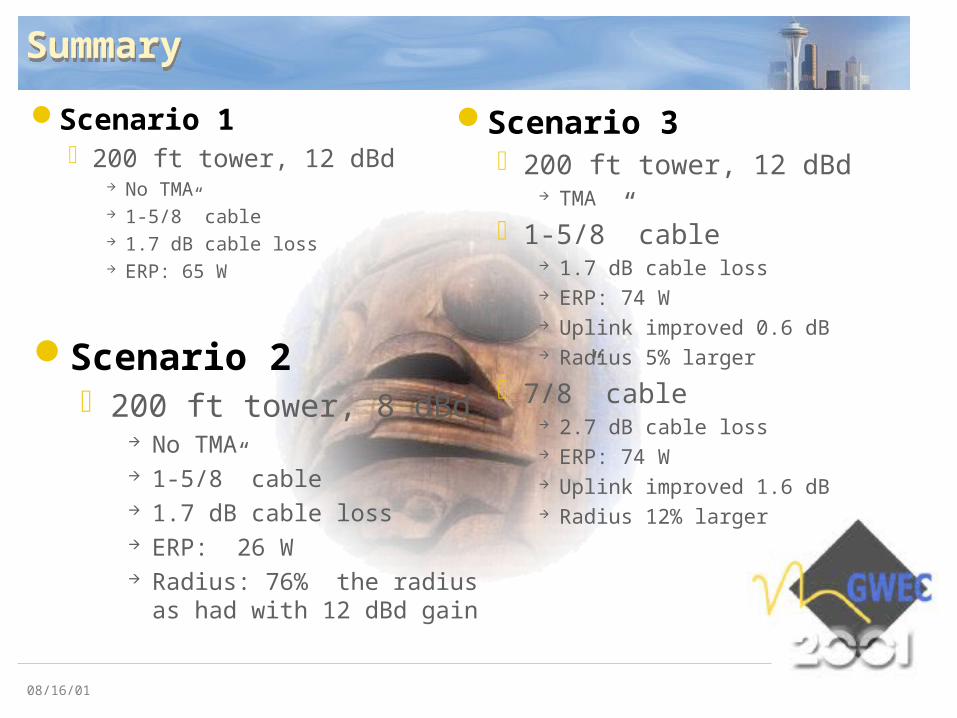
Scenario 1 200 ft tower, 12 dBd
No TMA 1-5/8” cable 1.7 dB cable loss ERP: 65 W
Scenario 2 200 ft tower, 8 dBd
No TMA 1-5/8” cable 1.7 dB cable loss ERP: 26 W Radius: 76% the radius
as had with 12 dBd gain
Scenario 3 200 ft tower, 12 dBd
TMA
1-5/8” cable 1.7 dB cable loss ERP: 74 W Uplink improved 0.6 dB Radius 5% larger
7/8” cable 2.7 dB cable loss ERP: 74 W Uplink improved 1.6 dB Radius 12% larger
08/16/01
SummarySummary
Challenges in a Link Budget Parameters vary by user
experience Verify interference is lower
than noise floor Choosing antenna with as
much gain as possible that will still adequately cover area

08/16/01
Questions?Questions?


