142
Pushing Productivity Weatherford International 2009 Annual Report

Pushing ProductivityWeatherford International 2009 Annual ReportWeatherford International Ltd.4-6 Rue Jean-François Bartholoni1204 GenevaSwitzerland+41 22 816 1500
weatherford.com
Weatherford International Ltd.
20
09
An
nu
al Rep
ort

Financial Highlights 2
Letter to Shareholders 3
Productivity Profiles 11
Product and Service Portfolio 19
Leadership 22
Financial Report 23
Corporate Information Inside back cover
Corporate Information
Independent Registered Accounting Firm
Ernst & Young LLP5 Houston Center1401 McKinney, Suite 1200Houston, TX 77010
Swiss Auditor
Ernst & Young Ltd.Bleicherweg 21CH-8002 Zurich, Switzerland
Legal Counsel
Andrews & Kurth LLP600 Travis, Suite 4200Houston, TX 77002
Stock Data
New York Stock ExchangeSymbol: WFTNYSE Euronext ParisSymbol: WFT
Financial Information
Financial analysts and shareholders seeking information about Weatherford International Ltd. should contact our U.S. Investor Relations department at 515 Post Oak Boulevard, Houston, TX77027. Our telephone number at that location is 713-693-4000. We will provide to any shareholder a copy of ourannual report, without charge, upon writtenrequest. Financial information may also be obtained by visiting our website athttp://www.weatherford.com.
Corporate Headquarters
Weatherford International Ltd.4-6 Rue Jean-François Bartholoni1204 GenevaSwitzerland+41 22 816 1500
Regional Offices
Asia Pacific14th Floor, West WingRohas PerkasaNo. 8, Jalan PerakKuala Lumpur 50450Malaysia+60 3 2168 6000
Canada333 5th Avenue S.W., Suite 1100Calgary, AlbertaT2P 3B6Canada+1 403 693 7500
Middle East /North Africa4th Interchange, Al BarshaSheikh Zayed RoadAl-Khaimah Building IIDubai UAE+9 71 4 312 5000
United States515 Post Oak BoulevardHouston, TX 77027USA+1 713 693 4000
Latin AmericaBlvd. Manuel Avila Camancho 4023rd FloorCol. Lomas de ChapultepecMexico D.F., CP11100+52 55 91384800
Russia, Europe & Sub-Sahara AfricaCarlton House33 Robert Adam StreetLondon W1U 3HRUK+44 2075631500
SGS-COC-003505

Weatherford International Ltd. (NYSE: WFT) is aSwiss-based, multinational oilfield service company.We are one of the largest global providers of innova-tive mechanical solutions, technology and servicesfor the drilling and production sectors of the oil andgas industry. We operate in over 100 countries andemploy over 52,000 people worldwide.
We are committed to balancing good businesswith sound, socially responsible engagement. Thiscommitment includes applying efficient resourcemanagement methods and practicing sustainable
development in the communities where our employees and clients operate and live.
We also pursue the highest standards of excellence in all of our business processes and partnerships. This includes complying with all applicable laws and regulations in the areas wherewe do business; promoting safe work practices andminimizing risk to our employees, our communitiesand the environment; and implementing programs,training and internal controls necessary to achieveour goals.
1
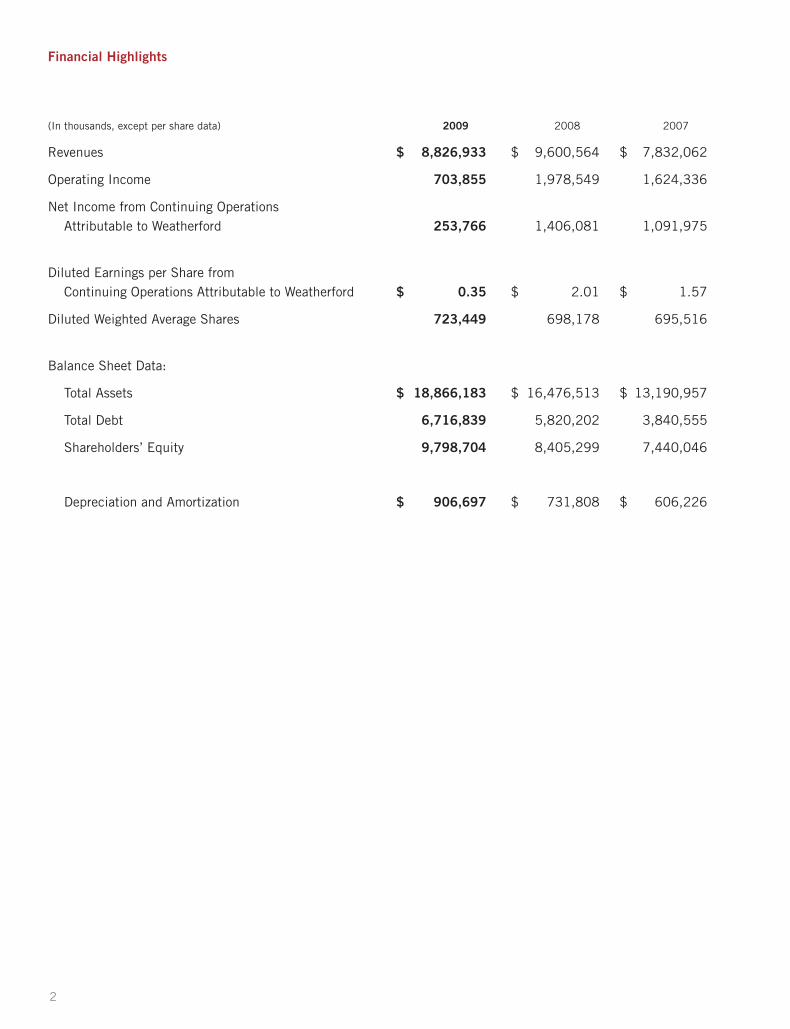
Financial Highlights
(In thousands, except per share data) 2009 2008 2007
Revenues $ 8,826,933 $ 9,600,564 $ 7,832,062
Operating Income 703,855 1,978,549 1,624,336
Net Income from Continuing OperationsAttributable to Weatherford 253,766 1,406,081 1,091,975
Diluted Earnings per Share fromContinuing Operations Attributable to Weatherford $ 0.35 $ 2.01 $ 1.57
Diluted Weighted Average Shares 723,449 698,178 695,516
Balance Sheet Data:
Total Assets $ 18,866,183 $ 16,476,513 $ 13,190,957
Total Debt 6,716,839 5,820,202 3,840,555
Shareholders’ Equity 9,798,704 8,405,299 7,440,046
Depreciation and Amortization $ 906,697 $ 731,808 $ 606,226
2

2009 was a year of turbulence but also one in which we laid further foundations
for long-term shareholder value creation.
We traditionally have one of the highest growth rates in the industry. For exam-
ple, over the past six years, we outperformed our peers in percentage growth of
revenue, revenue per rig and EBITDA. We intended 2009 to be no different.
We set ambitious growth targets, both top line and earnings, to continue on the
same historical development path, and we prepared for it with supply chain and
organizational commitments. The abrupt decline in economic activity that began
in September 2008 had a major impact on these plans.
The collapse of the global economy, plummeting commodity prices, and a
vertical drop-off in both activity and spend by our clients forced us to slam on
the brakes as fast and efficiently as we could. We had to quickly transition out
of a rapid-growth path, one in which we had remained consistently ahead of the
growth curve by aggressively investing in equipment and infrastructure.
Results for fiscal year 2009 reflect the underlying difficulties of a collapsed
market and our own rapid deceleration of our growth thrust. North America in
particular had a rough year, with revenue down 38 percent and operating income
down 82 percent. A swift and significant decline in the active rig count, including
unprecedented rock-bottom levels in Canada, produced an extremely challenging
business environment for service companies. We responded by methodically and
permanently lowering our cost structure. We took more than $500 million in costs out of
our North American business and made our operations more efficient. We also attempted
to improve focus by restructuring the former two regions (Canada and the U.S.) into four
smaller districts with dedicated management.
In spite of what can be best described as a depressed environment, we also successfully
introduced several new technologies and services into the North American market,
particularly in the growing applications of shale gas and deepwater. These included
the debut of surface logging systems into deepwater Gulf of Mexico and new wireline
technologies used in unconventional plays such as the Haynesville Shale.
The concurrent international prognosis was also strained, but to a much lesser degree.
International revenues managed to rise by 18 percent; but operating income fell
20 percent, reflecting severe pricing pressures and costs associated with a large
number of contract startup delays.
Another issue needs to be highlighted, which is at a variance with our decisions for the
North American segment. During the early days of the year, and in spite of the apparent
upstream capital spending collapse, we decided to protect and preserve the investments
we had made in the areas of international infrastructure, personnel, technology and
training. This was going to strain our 2009 international results further, and it did.
While this decision has impacted short-term profitability, these investments will leave
us well positioned as recovery occurs. The barriers to entry for service work in many
international markets are very high; protecting and enhancing our infrastructure and
organizational capabilities there are strategic to our long-term value.
Bernard J. Duroc-Danner
Chairman, President and
Chief Executive Officer
3
Letter to Shareholders

Internationally, Mexico and the Former Soviet Union were the major contributors to
growth. In Mexico, despite the backdrop of a difficult economic environment, we
transformed ourselves from a relatively unknown and minor contender into one of the
important providers of integrated services and project management. This transformation
began when we were awarded three significant land-based integrated
contracts for Chicontepec, a large heavy-oil reservoir development project
east and southeast of Mexico City.
In the space of less than six months, we established and opened a major
operating base at Poza Rica, rapidly deploying an integrated service
package that included, at its peak, over 40 drilling rigs and a wide scope
of drilling and oilfield services, ranging from directional drilling, fracturing
and cementing to drilling and completion engineering support. This initial
investment ultimately helped us pursue and win additional work in Mexico’s
other land and offshore reservoirs. It also established our legitimacy as
proficient integrated project managers throughout Latin America.
In the Former Soviet Union, the July acquisition of TNK-BP’s oilfield
service arm, called OFS, added 75 drilling rigs (roughly 8.5 percent of
the total rigs in the region), 150 workover units and a well developed
cementation pressure pumping capability to our Russian region.
It positioned us as one of the three largest independent oilfield service
providers in the Former Soviet Union. The bases and support facilities
of TNK-BP are excellent and widespread, and they fit well with our existing,
technically advanced, nascent infrastructure in Russia. The TNK-BP
acquisition provides us with high-quality operating bases in critical
Russian regions, plus 6,000 trained, skilled individuals working to modern
ISO 9000 certified standards.
The combination of conveyance (the rigs) and infrastructure (bases) plus
the full spectrum of our products and services (toolbox) will be powerful
and pivotal to our future in the Russian market. How we manage this in
the years ahead will matter to shareholder value. Russia is a large market
and will play an increasingly important role in the future development
of hydrocarbons.
In other international regional markets, we planted significant seeds for
growth in the Middle East, North Africa and Asia that we hope will flourish in 2010
and beyond. We kicked off our first integrated, turnkey heavy-oil project in China.
This project involves drilling and completing 165 wells with seven rigs on four man-made
islands in the Yuedong oil field in Bohai Bay. We are supplying a wide scope of services,
ranging from project management and engineering design to completion and well testing.
We are the first international energy service company to deliver integrated drilling and
completion services of this scale in the China market, and it represents our largest
integrated project in Asia to date.
We have started a number of other integrated projects in Algeria, Ethiopia, Iraq and
Oman. These projects range from providing rigs with fully integrated drilling and well
construction services in Algeria and Iraq to a full-service integrated exploration project
in Ethiopia that includes everything from directional drilling to wellheads.
Both energy consumption and global E&P spend haveshifted internationally duringthe past decade. Increases in international revenues and international revenues per rigmirror these trends.
4

We continued our momentum in technology deployment. We achieved several very
successful first deployments and set new world records in 2009 for a broad range of
technologies, ranging from rotary-steerable systems (RSS) to intelligent completion.
In the eastern hemisphere, for example, we ran the world’s longest expandable reservoir
completion installation in Saudi Arabia. In Brunei, we set a new record for the largest
number of optical pressure/temperature gauges installed in a single well on a single
optical cable. In the North Sea, we completed the world’s first complete Renaissance™
system installation, which enables the reclamation of failed subsurface safety valves
without rig intervention.
In the western hemisphere, our drilling services set a new highest-temperature record for
tool pulsing at 399°F (204°C) in the Gulf of Mexico. In offshore California, we success-
fully ran a world record-length liner using our OverDrive™ casing running and drilling
system. We also were the only company to successfully run RSS with an electromagnetic
hostile-environment logging system in an air-drilled underbalanced well.
These milestones, along with other successes, were examples of good execution in
spite of a difficult economic environment.
Additionally, we did not curtail our commitment to or our investment in technology
development, whether organic R&D or acquired. We added differentiating sensing
capabilities to our highest-growth-area technology platforms: RSS; logging-while-
drilling (LWD)/measurement-while-drilling (MWD) systems; managed pressure drilling;
and drilling with casing. These incremental improvements included developing new
RSS tools for high-pressure/high-temperature environments, new LWD systems that
improve real-time data correlation and measurement quality, and new openhole
wireline imaging tools to guarantee that geomechanical data are acquired, regardless
of borehole conditions.
We also continued evolving our technology portfolio in many of our traditional
drilling offerings, such as the high-performance RipTide™ drilling reamer. This
technology targets hole-enlargement-while-drilling operations in the worldwide
offshore and deepwater markets.
We invested in acquisitions that are strategic to improving our
current product line offerings. For example, we acquired
Secure Drilling Systems in June 2009, completing our
pre-eminent position in managed pressure drilling. Secure
Drilling brings patented revolutionary pressure drilling
tools and software to Weatherford’s existing systems and
expertise in the same field. Managed pressure drilling
improves drilling efficiency, enables drilling of high-pressure and
complex wells, enhances safety and minimizes reservoir formation
damage. As part of our new offering, the system already has enabled clients to
drill to depths never reached previously; enabled exploration wells to be drilled
where conventional drilling could not be done; and, finally, mitigated drilling hazards
in formations that were notoriously difficult to drill.
To add to our extensive line of pressure pumping, cementing services and engineered
chemicals portfolio, we acquired Integrity, a leading manufacturer of advanced drilling-
fluid products and oilfield specialty chemicals. The addition of Integrity’s novel
Technologies such as Weatherford’s SeaLance™
subsea drilling-with-casing system will enable applicationsin the growing market of deep-water subsalt plays.
5
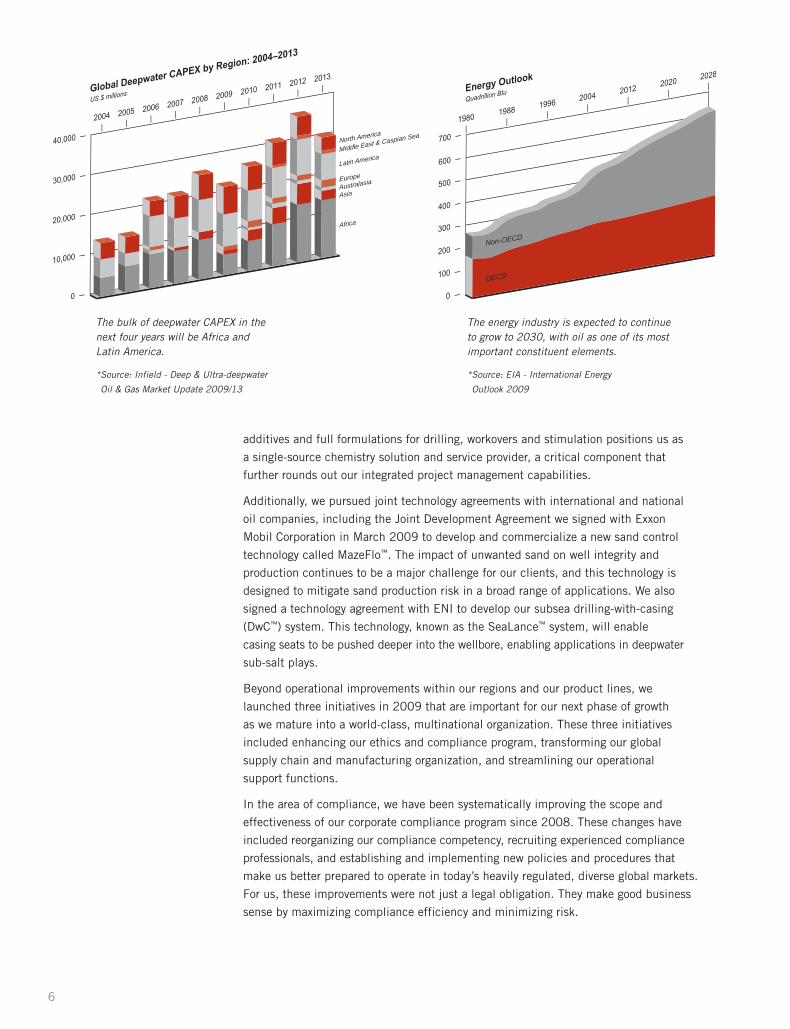
North America
MIddle East & Caspian Sea
Latin America
Europe
Asia
Africa
Australasia
OECD
Non-OECD
The bulk of deepwater CAPEX in thenext four years will be Africa andLatin America.
*Source: Infield - Deep & Ultra-deepwater
Oil & Gas Market Update 2009/13
The energy industry is expected to continueto grow to 2030, with oil as one of its mostimportant constituent elements.
*Source: EIA - International Energy
Outlook 2009
additives and full formulations for drilling, workovers and stimulation positions us as
a single-source chemistry solution and service provider, a critical component that
further rounds out our integrated project management capabilities.
Additionally, we pursued joint technology agreements with international and national
oil companies, including the Joint Development Agreement we signed with Exxon
Mobil Corporation in March 2009 to develop and commercialize a new sand control
technology called MazeFlo™. The impact of unwanted sand on well integrity and
production continues to be a major challenge for our clients, and this technology is
designed to mitigate sand production risk in a broad range of applications. We also
signed a technology agreement with ENI to develop our subsea drilling-with-casing
(DwC™) system. This technology, known as the SeaLance™ system, will enable
casing seats to be pushed deeper into the wellbore, enabling applications in deepwater
sub-salt plays.
Beyond operational improvements within our regions and our product lines, we
launched three initiatives in 2009 that are important for our next phase of growth
as we mature into a world-class, multinational organization. These three initiatives
included enhancing our ethics and compliance program, transforming our global
supply chain and manufacturing organization, and streamlining our operational
support functions.
In the area of compliance, we have been systematically improving the scope and
effectiveness of our corporate compliance program since 2008. These changes have
included reorganizing our compliance competency, recruiting experienced compliance
professionals, and establishing and implementing new policies and procedures that
make us better prepared to operate in today’s heavily regulated, diverse global markets.
For us, these improvements were not just a legal obligation. They make good business
sense by maximizing compliance efficiency and minimizing risk.
6
The drive for additional efficiencies also is core to another initiative. Late in the year,
we started a long-term effort to gradually restructure our global supply chain and
manufacturing. We strive to increase the geographic diversity of our supply chain capabilities,
lower our overall cost structure and improve our flexibility and agility in response to
market demand changes. In so doing, we will not compromise on quality or safety.
2010 Outlook
The economic events of the past one-and-a-half years will continue to resonate in 2010.
Energy demand is still reduced from the peaks of July 2008, when strong economic
growth, coupled with a relatively inelastic oil supply, increased oil prices to as
high as $147 per barrel. Prices escalated to the extent they did during that
time because non-OECD oil consumption growth outstripped spare oil production
capacity. Oil production capacity was growing slowly in part because economically
and efficiently extracting hydrocarbons was becoming more difficult. This is a long-
term reality, reflecting structural factors. On average, oil reservoirs are maturing in
their exploitation phase, meaning they are, in a sense, further along their production
life span. Furthermore, newly exploited reservoirs tend to be more remotely located,
more difficult in geological structure, and more unconventional (for example, heavy oil) in
nature. All of the above suggests slower and more laborious progression in oil production.
Ultimately, the pronounced and severe slowdown in world economic growth sharply
decreased both end-product consumption and, in turn, petroleum demand. A sustained
recovery in our industry will occur once oil and gas supply and demand rebalance.
We are one derivative away from the oil and gas markets.
There are initial signs that we are slowly headed in this direction. While world oil
consumption was down in 2009 by about 1.7 million barrels per day from 2008,
recent economic growth indicators in non-OECD countries, where most of the increase in
world demand will come from, is contributing already to the beginnings of a rebound in
world oil consumption. Should these demand trends be confirmed, our industry will need
to restart a number of mothballed projects to secure further hydrocarbon spare capacity.
What does this mean for Weatherford?
Broadly, it means that most likely the industry is on the cusp of a multi-year upturn,
and 2010 will lay the groundwork. We expect 2010 to be a healthy recovery year,
behaving almost as the perfect inverse of 2009: starting at modest levels while finish-
ing the year strongly. The ensuing period from 2011 through 2015 should see solid
incremental growth and a corresponding financial harvesting for our shareholders.
North America has already shown the way forward with a healthy recovery in activity
late last year and into the first months of 2010.
From this point forward, international growth will lead the way.
The bulk of our growth will be international and should remain materially above market
rates of activity improvements consistent with our historical record. The broad global
infrastructure we have built, our experience in executing integrated projects, our strong
presence in nascent high-growth markets, and young technologies with immature share
penetrating across markets will all contribute to Weatherford’s growth.
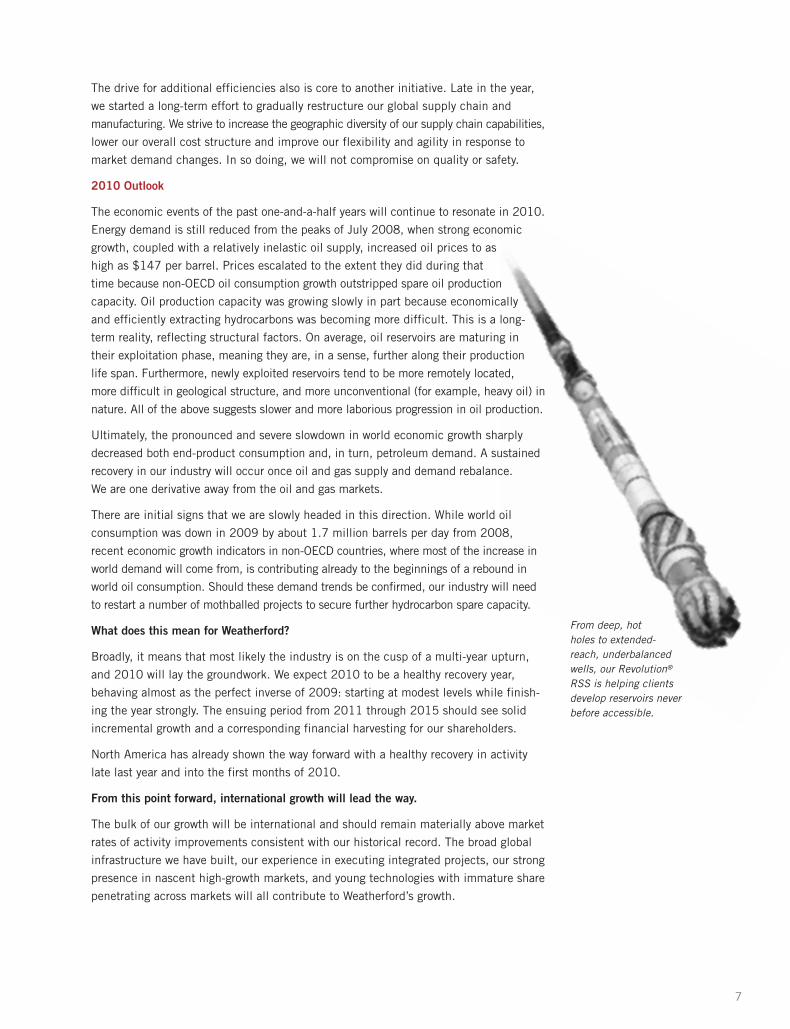
From deep, hot holes to extended-reach, underbalancedwells, our Revolution®
RSS is helping clientsdevelop reservoirs neverbefore accessible.
7
For 2010, we believe the Eastern Hemisphere will provide the company’s greatest
expansion with anticipated growth rates of 30 percent year-on-year, significantly
weighted to the second half of 2010. All segments will contribute to this objective,
but most likely the Middle East and Russia will be at the forefront.
Latin America will be mixed. After a year of considerable growth in 2009, bucking the
general decline, our revenues here will taper off with the completion of a number of projects
in Mexico. We will consolidate our position in the region, continuing with existing projects in
Mexico and beginning new projects in other Latin American countries. Brazil and Colombia,
in particular, will be sources of strength for Weatherford as we continue to develop our
position across all segments. We expect Latin America to join the Eastern Hemisphere
on similar growth patterns in 2011 and thereafter.
The prognosis for North America is healthy but is limited in scope and scale by the
remarkable elasticity of the gas supply curve. The emergence of shale gas as an
economic and prolific source of gas has changed the dynamics of the North American
market in a profound way. Shale gas reservoirs provide a long-term source of production
growth to fuel the U.S. and Canadian economies. Conventional sources of gas could
not do this. As a derivative result, we view the North American market as less likely to
rise in oilfield activity to prior peak levels and, conversely, not to fall as low and as
long in down cycles. In historically relative terms, volatility will drop. Of added note,
we expect the recent quiet rise of the oil-related markets in the U.S., as well as that of
the heavy-oil segment in Canada, to persist, suggesting a new phase of expansion after
years of inertia.
The Next Phase of Growth
Our next growth phase will come primarily from harvesting the scope, depth and
breadth of what we built – a thrust of organic leveraging. In particular, we will
focus on making ourselves a fully integrated service company.
The extent of our success in scale and profitability will depend on four focal areas:
• Bring our product and service lines to full maturation in terms of breadth and
distribution. Breadth has to do with extension of product lines to their natural limits;
while distribution means complete seeding of our extensive infrastructure with the
full range of our portfolio.
• Extend the technological depth of our product and service lines. Our commitment to
technology is unwavering, whether organic through R&D or acquisitive. Technology is
one of two factors of productivity for our clients. Productivity gains are ultimately what
will differentiate this company from its peers if we are successful in our objectives.
• Raise the quality and efficiency of product and service delivery. This is an organizational
and cultural issue that will remain for years to come as one of our core objectives. It cuts
through all facets of our company’s operations. Quality and efficiency in delivery comprise
the second critical factor of productivity.
• Lower our intensity of use of capital, which is another way of expressing the drive for
greater efficacy in the use of capital.
We are committed to making progress on all four fronts, and we shall.
8
In closing, Weatherford remains at its roots a growth company and one that has
transformed itself over the past 23 years from very humble beginnings to the extraordinary
company our shareholders have allowed its management to build. Weatherford, your
company, is young and new in its size, complexity and status. We lack in maturity what
our peers mastered many years ago. We will learn how to exploit and harvest what we
have assembled and will do so without diluting the energy, drive and enthusiasm that
characterize young companies dedicated to the pursuit of growth.
We do not write off 2009 as a “bad” year. It was by all measures an important year
in terms of the investments and inroads we made for the future. We will continue this
evolution in 2010.
Our purpose, or, as is expressed in my native language, “raison d’être,” is shareholder
wealth generation. We are acutely aware of this and understand the responsibility and
trust inherent in being the custodian of your capital. Ultimately, shareholder value
generation is the only yardstick that matters within a value system of strict respect
of ethics, compassion and individual responsibility.
We are deeply grateful to our clients, without whose support nothing is possible.
We will endeavor to do all in our power to be of value and earn their loyalty.
A heartfelt thank you also goes to all of our employees for their unwavering dedication
to Weatherford. The employees make the company. It is a privilege to be given the
responsibility to lead this organization.
You have Weatherford’s commitment. In 2010, we will collectively drive for our
shareholders the very best performance Weatherford is capable of while building
further the limits of your company’s potential. We will do so with our long-term
aspirations for Weatherford and its shareholders squarely and solely in mind.
Respectfully,
Bernard J. Duroc-DannerChairman, President and Chief Executive Officer
9

10

For more than a decade, Weatherford has expanded substantially both our international infrastructure andproduct/service portfolio in all of the major oil- and gas-producing regions of the world.
We have expanded our global footprint to be closer toour clients’ specific reservoir issues, to be more efficient with our supply chain, and to pull through lower-market-share product lines that are technology rich but havelacked widespread adoption in key global markets. Wehave expanded our product/service portfolio to help ourclients deal with the ongoing issues of lowering capitaland operating costs, increasing production rates and,ultimately, improving reservoir recovery.
The following seven profiles show how these expan-sions are helping us combine field-level execution andtechnology in ways that yield incremental efficiencies in time, resources, safety and quality.
ProductivityProfiles
11
Productivity Profiles: Countries
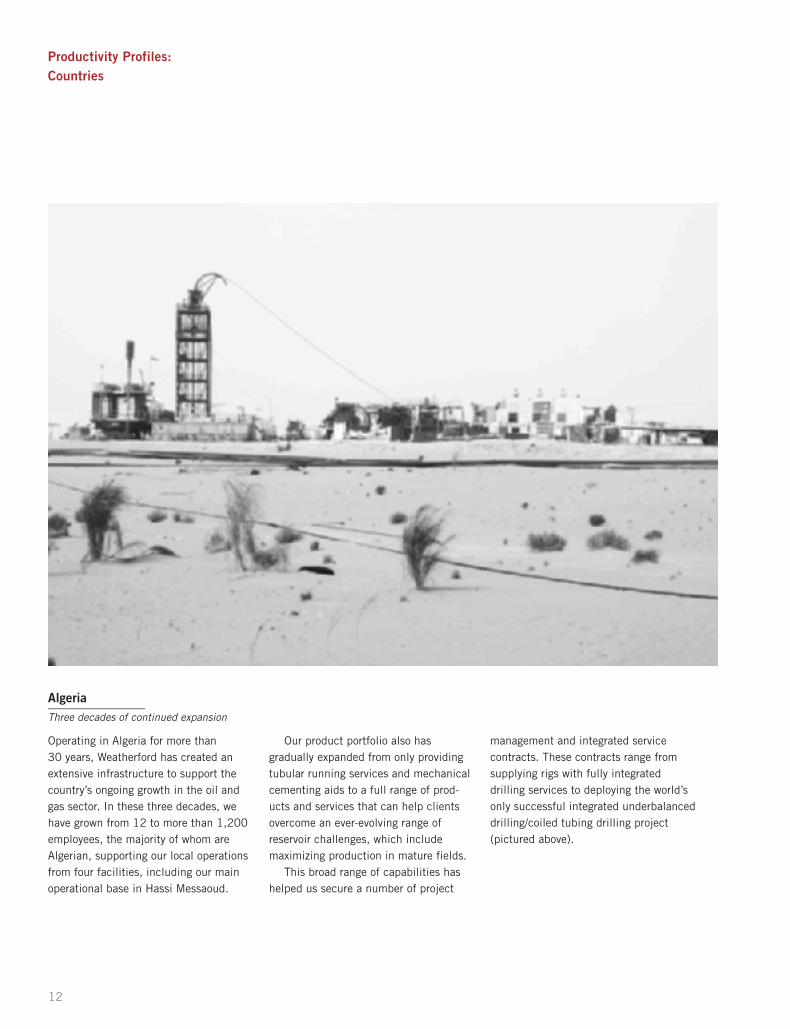
Algeria_______________Three decades of continued expansion
12
Operating in Algeria for more than 30 years, Weatherford has created an extensive infrastructure to support thecountry’s ongoing growth in the oil andgas sector. In these three decades, wehave grown from 12 to more than 1,200employees, the majority of whom are Algerian, supporting our local operationsfrom four facilities, including our mainoperational base in Hassi Messaoud.
Our product portfolio also has gradually expanded from only providingtubular running services and mechanicalcementing aids to a full range of prod-ucts and services that can help clientsovercome an ever-evolving range of reservoir challenges, which include maximizing production in mature fields.
This broad range of capabilities hashelped us secure a number of project
management and integrated service contracts. These contracts range fromsupplying rigs with fully integrateddrilling services to deploying the world’sonly successful integrated underbalanceddrilling/coiled tubing drilling project (pictured above).
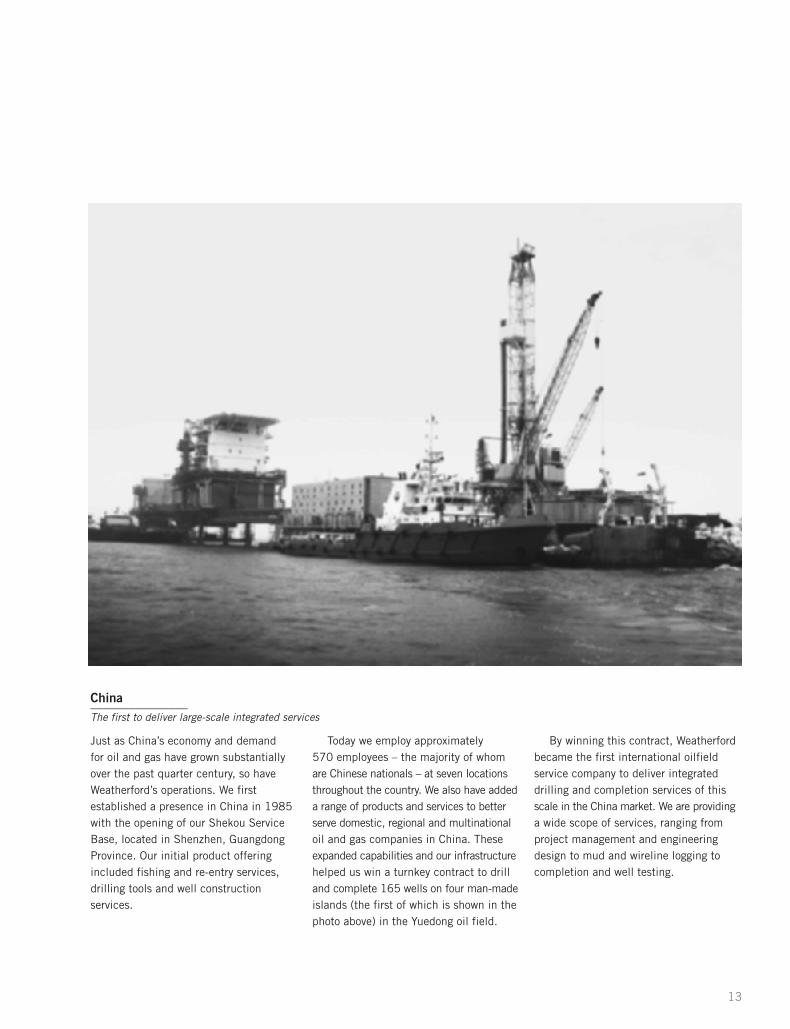
China_______________The first to deliver large-scale integrated services
13
Just as China’s economy and demand for oil and gas have grown substantiallyover the past quarter century, so haveWeatherford’s operations. We first established a presence in China in 1985with the opening of our Shekou ServiceBase, located in Shenzhen, GuangdongProvince. Our initial product offering included fishing and re-entry services,drilling tools and well construction services.
Today we employ approximately 570 employees – the majority of whomare Chinese nationals – at seven locationsthroughout the country. We also have addeda range of products and services to betterserve domestic, regional and multinationaloil and gas companies in China. Theseexpanded capabilities and our infrastructurehelped us win a turnkey contract to drilland complete 165 wells on four man-madeislands (the first of which is shown in thephoto above) in the Yuedong oil field.
By winning this contract, Weatherfordbecame the first international oilfieldservice company to deliver integrateddrilling and completion services of thisscale in the China market. We are providinga wide scope of services, ranging fromproject management and engineeringdesign to mud and wireline logging to completion and well testing.

Productivity Profiles: Countries
Iraq_______________The largest multinational oilfield services provider
With the world’s second-largest proven oilreserves, Iraq will be a significant growthmarket, due to the rebuilding and infra-structure upgrades that the country is beginning to undertake.
Operating in Iraq since 2005, Weatherford is best positioned to capitalizeon this potential. We have more recentexperience in Iraq than any other multinational oilfield services company,and we are the country’s largest multi -
national oilfield services provider. We have built an extensive infrastructure that employs more than 500 permanentemployees – predominantly nationals –and includes three major facilities inBasra, Erbil and Baghdad. In 2010 we areconstructing a fourth facility in Rumaila tosupport client activity in the massiveRumaila oil field in southern Iraq.
This infrastructure has helped us win and complete 12 projects in Iraq,
ranging from a 228-well, multi-field wireline and production logging campaignto installing the first early productionfacility, pictured above. Our current integrated project work includes drillingand completing 20 wells in the SouthRumaila field. This project encompasses11 different products and services, spanning from drilling rigs to wellheadsystems.
14
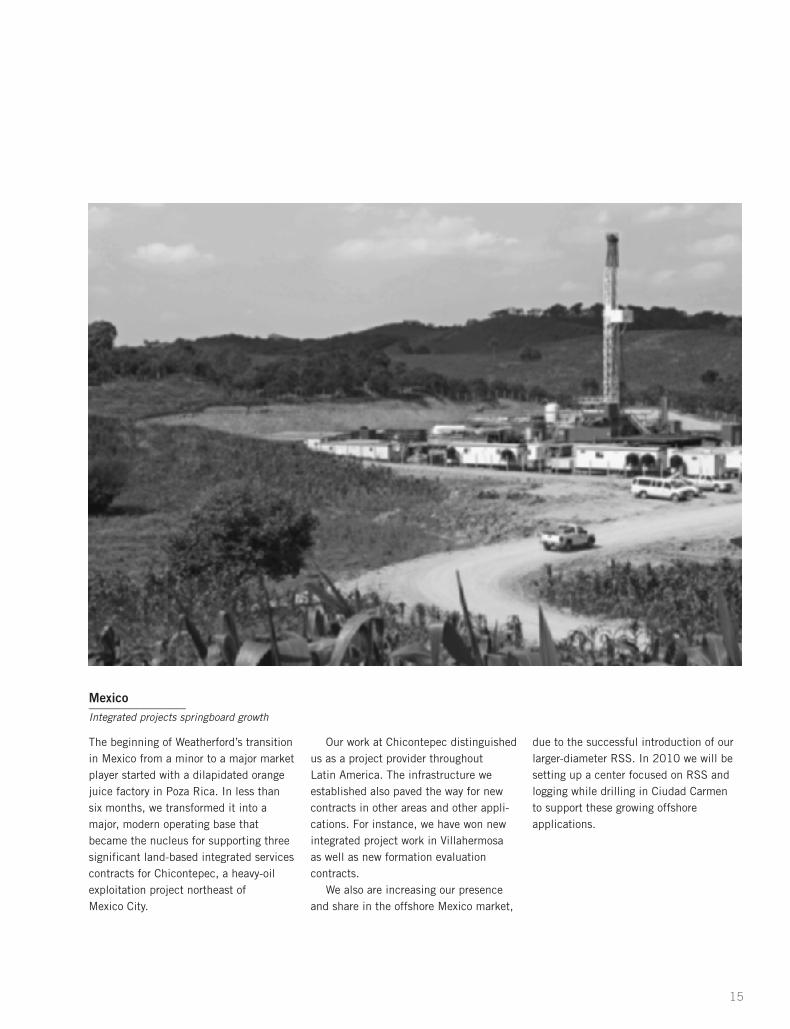
Mexico_______________Integrated projects springboard growth
The beginning of Weatherford’s transitionin Mexico from a minor to a major marketplayer started with a dilapidated orangejuice factory in Poza Rica. In less thansix months, we transformed it into amajor, modern operating base thatbecame the nucleus for supporting threesignificant land-based integrated servicescontracts for Chicontepec, a heavy-oil exploitation project northeast of Mexico City.
Our work at Chicontepec distinguishedus as a project provider throughout Latin America. The infrastructure we established also paved the way for newcontracts in other areas and other appli-cations. For instance, we have won newintegrated project work in Villahermosaas well as new formation evaluation contracts.
We also are increasing our presenceand share in the offshore Mexico market,
due to the successful introduction of ourlarger-diameter RSS. In 2010 we will besetting up a center focused on RSS andlogging while drilling in Ciudad Carmento support these growing offshore applications.
15
Productivity Profiles: New Technologies
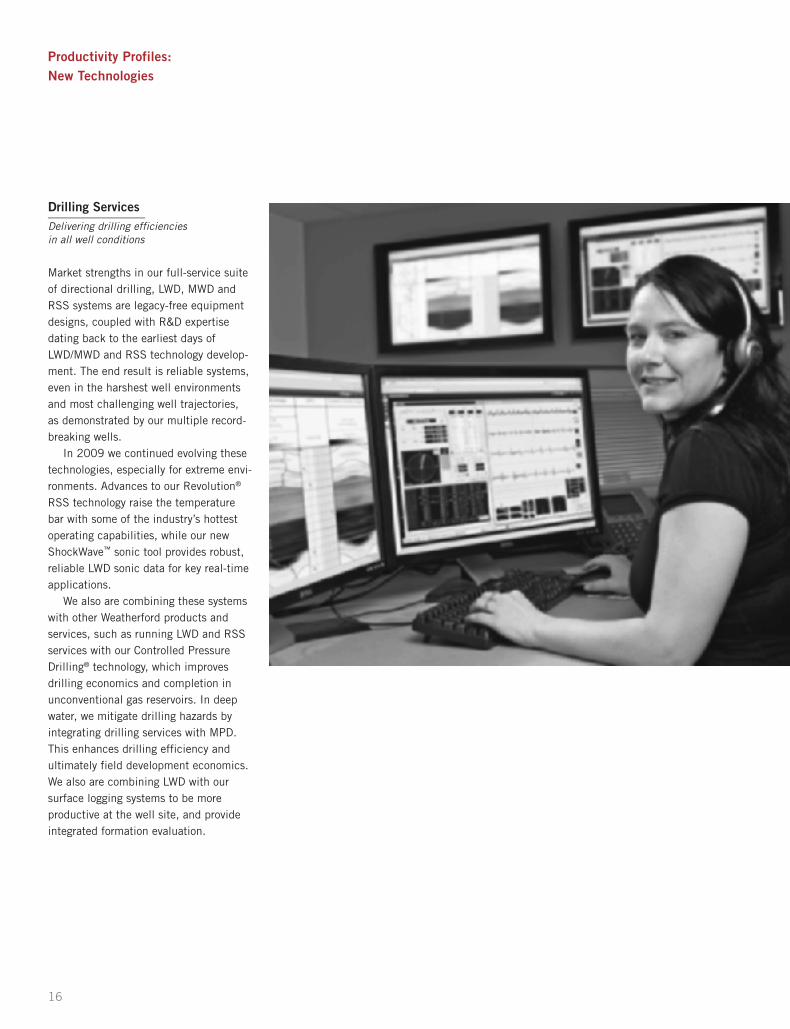
Drilling Services_______________Delivering drilling efficiencies in all well conditions
Market strengths in our full-service suiteof directional drilling, LWD, MWD andRSS systems are legacy-free equipmentdesigns, coupled with R&D expertise dating back to the earliest days ofLWD/MWD and RSS technology develop-ment. The end result is reliable systems,even in the harshest well environmentsand most challenging well trajectories, as demonstrated by our multiple record-breaking wells.
In 2009 we continued evolving thesetechnologies, especially for extreme envi-ronments. Advances to our Revolution®
RSS technology raise the temperaturebar with some of the industry’s hottestoperating capabilities, while our newShockWave™ sonic tool provides robust,reliable LWD sonic data for key real-timeapplications.
We also are combining these systemswith other Weatherford products andservices, such as running LWD and RSSservices with our Controlled PressureDrilling® technology, which improvesdrilling economics and completion in unconventional gas reservoirs. In deepwater, we mitigate drilling hazards by integrating drilling services with MPD.This enhances drilling efficiency and ultimately field development economics.We also are combining LWD with our surface logging systems to be more productive at the well site, and provideintegrated formation evaluation.
16
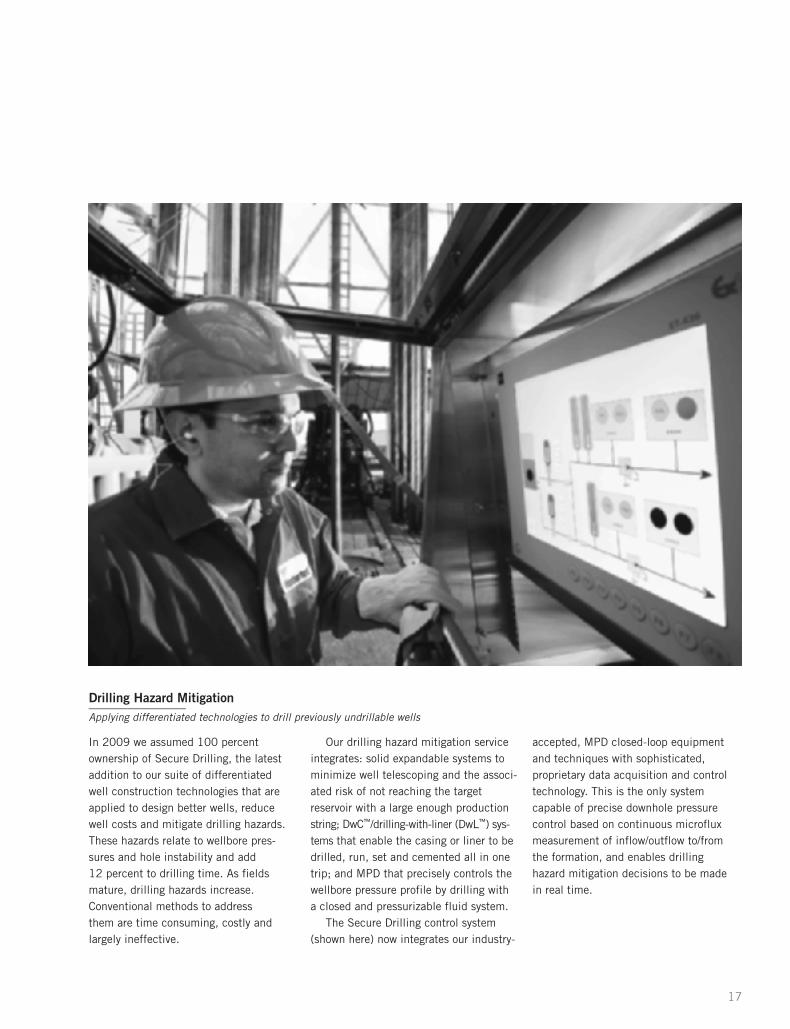
Drilling Hazard Mitigation_______________Applying differentiated technologies to drill previously undrillable wells
In 2009 we assumed 100 percent ownership of Secure Drilling, the latestaddition to our suite of differentiated well construction technologies that are applied to design better wells, reducewell costs and mitigate drilling hazards.These hazards relate to wellbore pres-sures and hole instability and add 12 percent to drilling time. As fields mature, drilling hazards increase. Conventional methods to address them are time consuming, costly andlargely ineffective.
Our drilling hazard mitigation serviceintegrates: solid expandable systems tominimize well telescoping and the associ-ated risk of not reaching the target reservoir with a large enough productionstring; DwC™/drilling-with-liner (DwL™) sys-tems that enable the casing or liner to bedrilled, run, set and cemented all in onetrip; and MPD that precisely controls thewellbore pressure profile by drilling witha closed and pressurizable fluid system.
The Secure Drilling control system(shown here) now integrates our industry-
accepted, MPD closed-loop equipmentand techniques with sophisticated, proprietary data acquisition and controltechnology. This is the only system capable of precise downhole pressurecontrol based on continuous microfluxmeasurement of inflow/outflow to/fromthe formation, and enables drilling hazard mitigation decisions to be madein real time.
17
Productivity Profiles: New Technologies
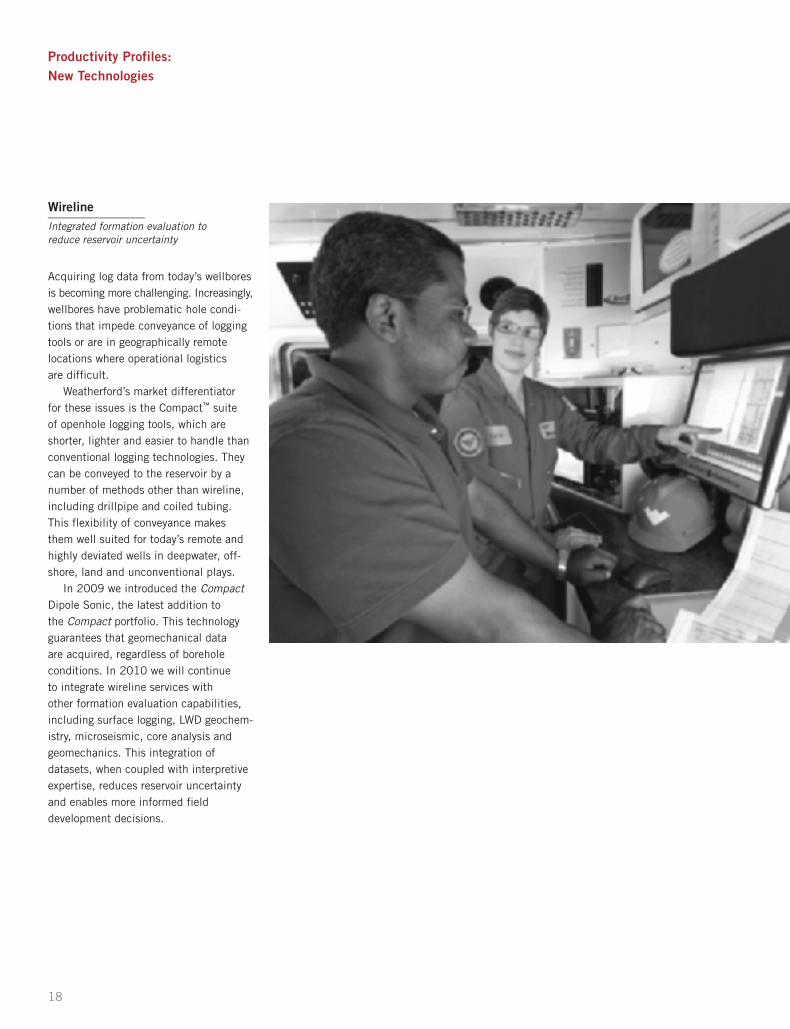
Wireline_______________Integrated formation evaluation to reduce reservoir uncertainty
Acquiring log data from today’s wellboresis becoming more challenging. Increasingly,wellbores have problematic hole condi-tions that impede conveyance of loggingtools or are in geographically remotelocations where operational logistics are difficult.
Weatherford’s market differentiator for these issues is the Compact™ suite of openhole logging tools, which areshorter, lighter and easier to handle thanconventional logging technologies. Theycan be conveyed to the reservoir by anumber of methods other than wireline,including drillpipe and coiled tubing.This flexibility of conveyance makesthem well suited for today’s remote andhighly deviated wells in deepwater, off-shore, land and unconventional plays.
In 2009 we introduced the CompactDipole Sonic, the latest addition to the Compact portfolio. This technologyguarantees that geomechanical data are acquired, regardless of borehole conditions. In 2010 we will continue to integrate wireline services with other formation evaluation capabilities,including surface logging, LWD geochem-istry, microseismic, core analysis andgeomechanics. This integration ofdatasets, when coupled with interpretiveexpertise, reduces reservoir uncertaintyand enables more informed field development decisions.
18

Product andService Portfolio
19

Product and Service Portfolio
20
21
Leadership Board of Directors
Bernard J. Duroc-DannerChairman of the Board, President and Chief Executive OfficerWeatherford International Ltd.
Nicholas F. BradyChairmanDarby Overseas Investments (Private investment company)
David J. ButtersPresident, Chairman and CEONavigator Holdings Ltd. (International shipping company)
William E. MacaulayChairman and Chief Executive OfficerFirst Reserve Corporation (Private equity firm focusing on the energy industry)
Robert B. MillardManaging Member and Chief Investment OfficerRealm Partnership LLC (Private investment partnership)
Robert K. Moses, Jr.Private InvestorBlack Jack Resources, Inc. (Private investment company)
The Hon. Robert A. RayneChairmanLondon Merchant Securities plc(Property development and venture capital company)
Corporate Officers
Bernard J. Duroc-DannerChairman of the Board, President and Chief Executive Officer
Andrew P. BecnelSenior Vice President and Chief Financial Officer
Keith R. MorleySenior Vice President – Well Construction and Operations and Chief Safety Officer
Peter T. FontanaSenior Vice President – Western Hemisphere
Carel W. J. HoyerSenior Vice President – Well Construction and Reservoir Evaluation
Jessica AbarcaVice President – Accounting and Chief Accounting Officer
M. David ColleyVice President – Artificial Lift Global Business Unit
Nicholas W. GeeGroup Vice President – Completion & Production
Joseph C. HenryVice President, Co-General Counsel and Secretary
James M. HudginsVice President – Tax
William B. JacobsonVice President, Co-General Counsel and Chief Compliance Officer
22

Weatherford International Ltd.
Index to Annual Report
For the Year Ended December 31, 2009
Page
PART IItem 1 Business . . . . . . . . . . . . . . . . . . . . . . . . . . . . . . . . . . . . . . . . . . . . . . . . . . . . . . . . . . . AR-1
Item 1A Risk Factors . . . . . . . . . . . . . . . . . . . . . . . . . . . . . . . . . . . . . . . . . . . . . . . . . . . . . . . . AR-13
Item 1B Unresolved Staff Comments. . . . . . . . . . . . . . . . . . . . . . . . . . . . . . . . . . . . . . . . . . . . . AR-16
Item 2 Properties . . . . . . . . . . . . . . . . . . . . . . . . . . . . . . . . . . . . . . . . . . . . . . . . . . . . . . . . . . AR-17
Item 3 Legal Proceedings . . . . . . . . . . . . . . . . . . . . . . . . . . . . . . . . . . . . . . . . . . . . . . . . . . . . AR-17
Item 4 Submission of Matters to a Vote of Security Holders . . . . . . . . . . . . . . . . . . . . . . . . . . AR-18
PART IIItem 5 Market for Registrant’s Common Equity, Related Shareholder Matters and Issuer
Purchases of Equity Securities . . . . . . . . . . . . . . . . . . . . . . . . . . . . . . . . . . . . . . . . . . . AR-18
Item 6 Selected Financial Data . . . . . . . . . . . . . . . . . . . . . . . . . . . . . . . . . . . . . . . . . . . . . . . . AR-20
Item 7 Management’s Discussion and Analysis of Financial Condition and Results ofOperations. . . . . . . . . . . . . . . . . . . . . . . . . . . . . . . . . . . . . . . . . . . . . . . . . . . . . . . . . . AR-21
Item 7A Quantitative and Qualitative Disclosures about Market Risk . . . . . . . . . . . . . . . . . . . . . AR-34
Item 8 Financial Statements and Supplementary Data . . . . . . . . . . . . . . . . . . . . . . . . . . . . . . . AR-37
Item 9 Changes in and Disagreements with Accountants on Accounting and FinancialDisclosure . . . . . . . . . . . . . . . . . . . . . . . . . . . . . . . . . . . . . . . . . . . . . . . . . . . . . . . . . . AR-88
Item 9A Controls and Procedures . . . . . . . . . . . . . . . . . . . . . . . . . . . . . . . . . . . . . . . . . . . . . . . AR-88
Item 9B Other Information . . . . . . . . . . . . . . . . . . . . . . . . . . . . . . . . . . . . . . . . . . . . . . . . . . . . AR-88
PART IIIItem 10 Directors, Executive Officers and Corporate Governance. . . . . . . . . . . . . . . . . . . . . . . . AR-88
Item 11 Executive Compensation . . . . . . . . . . . . . . . . . . . . . . . . . . . . . . . . . . . . . . . . . . . . . . . AR-88
Item 12(a) Security Ownership of Certain Beneficial Owners . . . . . . . . . . . . . . . . . . . . . . . . . . . . AR-88
Item 12(b) Security Ownership of Management . . . . . . . . . . . . . . . . . . . . . . . . . . . . . . . . . . . . . . . AR-89
Item 12(d) Securities Authorized for Issuance under Equity Compensation Plans . . . . . . . . . . . . . . AR-89
Item 13 Certain Relationships and Related Transactions and Director Independence . . . . . . . . . . AR-90
Item 14 Principal Accountant Fees and Services . . . . . . . . . . . . . . . . . . . . . . . . . . . . . . . . . . . . AR-90
PART IVItem 15 Exhibits, Financial Statement Schedules . . . . . . . . . . . . . . . . . . . . . . . . . . . . . . . . . . . . AR-91SIGNATURES . . . . . . . . . . . . . . . . . . . . . . . . . . . . . . . . . . . . . . . . . . . . . . . . . . . . . . . . . . . . . . . . AR-100

PART I
Item 1. Business
Weatherford International Ltd. (NYSE:WFT) is one of the world’s leading providers of equipment andservices used in the drilling, evaluation, completion, production and intervention of oil and natural gas wells. Manyof our businesses, including those of our predecessor companies, have been operating for more than 50 years.
We were originally incorporated in Delaware in 1972 and moved our incorporation to Bermuda in 2002. InFebruary 2009, we completed a share exchange transaction in which Weatherford International Ltd., a Bermudaexempted company (“Weatherford Bermuda”) became a wholly-owned subsidiary of Weatherford InternationalLtd., a Swiss joint stock corporation (“Weatherford Switzerland”) for purposes of changing the Company’s place ofincorporation from Bermuda to Switzerland (collectively, the “Transaction”). Pursuant to the Transaction, eachcommon share, par value U.S. $1.00 per share, of Weatherford Bermuda was exchanged for one registered share, parvalue 1.16 Swiss francs (“CHF”) per share, of Weatherford Switzerland.
When referring to Weatherford and using phrases such as “we” and “us,” our intent is to refer to WeatherfordInternational Ltd. and its subsidiaries as a whole or on a regional basis, depending on the context in which thestatements are made.
We operate in over 100 countries, which are located in nearly all of the oil and natural gas producing regions inthe world. Our operational performance is segmented and reviewed on a geographic basis, and we report thefollowing regions as reporting segments: (1) North America, (2) Latin America, (3) Europe/West Africa/the FormerSoviet Union (“FSU”) and (4) Middle East/North Africa/Asia.
Our headquarters are located at 4-6 Rue Jean-Francois Bartholoni, 1204 Geneva, Switzerland and ourtelephone number at that location is 41.22.816.1500. Our Internet address is www.weatherford.com. Generalinformation about us, including our Corporate Governance Policies and charters for the committees of our board ofdirectors, can be found on our Web site. On our Web site we make available, free of charge, our annual reports onForm 10-K, quarterly reports on Form 10-Q, current reports on Form 8-K, and amendments to those reports filed orfurnished pursuant to Section 13(a) or 15(d) of the Exchange Act as soon as reasonably practicable after weelectronically file or furnish them to the SEC. The public may read and copy any materials we have filed with theSEC at the SEC’s Public Reference Room at 100 F Street, NE, Room 1580, Washington, DC 20549. Information onthe operation of the Public Reference Room may be obtained by calling the SEC at 1-800-SEC-0330. The SECmaintains an Internet site that contains our reports, proxy and information statements, and our other SEC filings.The address of that site is www.sec.gov.
The following is a summary of our business strategies and the markets we serve. We have also included adescription of our products and services offered and our competitors. Segment financial information appears in“Item 8. Financial Statements and Supplementary Data — Notes to Consolidated Financial Statements — Note 19.”
Strategy
Our primary objective is to provide our shareholders with above-average returns on their investment throughincome growth.
Principal components of our strategy include:
• Continuously improving the efficiency, productivity and quality of our products and services and theirrespective delivery in order to grow revenues and operating margins in all of our geographic markets at a rateexceeding underlying market activity;
• Through a commitment to innovation and invention, developing and commercializing new products andservices capable of meeting evolving needs of our customers; and
• Further extending our global infrastructure in scope and scale at a level consistent with meeting customerdemand for our products and services in an efficient manner.
AR-1
Markets
We are a leading provider of equipment and services to the oil and natural gas exploration and productionindustry. Demand for our industry’s services and products depends upon the number of oil and natural gas wellsbeing drilled, the depth and drilling conditions of wells, the number of well completions and the level of workoveractivity worldwide.
As a result of the maturity of the world’s oil and natural gas reservoirs, accelerating production decline ratesand the focus on complex deepwater prospects, technology has become increasingly critical to the marketplace.Clients continue to seek, test and prove production-enabling technologies at an increasing rate. Technology is animportant aspect of our products and services as it helps us provide our clients with more efficient tools to find andproduce oil and natural gas. We have invested a substantial amount of our time and resources in building ourtechnology offerings. We believe our products and services enable our clients to reduce their costs of drilling andproduction and/or increase production rates. Furthermore, these offerings afford us additional opportunities to sellour traditional core products and services to our clients.
Product Offerings
Our product offerings can be grouped into ten service lines: 1) artificial lift systems; 2) drilling services;3) well construction; 4) drilling tools; 5) completion systems; 6) wireline and evaluation services; 7) re-entry andfishing; 8) stimulation and chemicals; 9) integrated drilling; and 10) pipeline and specialty services. The followingdiscussion provides an overview of our various product offerings. With the exception of integrated drilling, ourservice line offerings are provided in all of our regional segments. Our integrated drilling service line is offered onlyoutside of North America.
Artificial Lift Systems
Artificial lift systems are installed in oil wells and, to a lesser extent, natural gas wells that do not havesufficient reservoir pressure to raise the produced hydrocarbon to the surface. These systems supplement the naturalreservoir pressures to produce oil or natural gas from the well. There are six principal types of artificial lifttechnologies used in the industry. With the exception of our electrical submersible pumps business, which we soldto an equity investment partner in January 2008, we are able to provide all forms of lift, including progressing cavitypumps, reciprocating rod lift systems, gas lift systems, hydraulic lift systems, plunger lift systems and hybrid liftsystems. We also offer wellhead systems and production optimization.
Progressing Cavity Pumps — A progressing cavity pump (PCP) is a downhole pump driven by an above-ground electric motor system connected to it by a coupled rod or continuous rod string. PCPs are particularly usefulin heavy-oil-producing basins around the world.
Reciprocating Rod Lift Systems — A reciprocating rod lift system is an artificial lift pumping system that usesan above-ground mechanical unit connected to a sucker rod and a downhole pump. It uses an up-and-down suctionprocess to lift the oil from the reservoir.
Gas Lift Systems — Gas lift is a form of artificial lift that uses natural gas to lift oil in a producing reservoir tothe surface. The process of gas lift involves the injection of natural gas into the well through an above-groundinjection system and a series of downhole mandrels and gas lift valves in the production tubing string. The injectedgas acts as the lifting agent for the oil. Gas lift systems are used primarily for offshore wells (including deepwaterand ultra-deepwater) and for wells that have a high component of gas in the produced fluid or have a gas supply nearthe well.
Hydraulic Lift Systems — A hydraulic lift oil pumping system uses an above-ground surface power unit tooperate a downhole hydraulic pump (jet or piston) to lift oil from the reservoir. Hydraulic pumps are well suited forwells with high volumes and low solids.
Plunger Lift Systems — Plunger lift is the only artificial lift method that requires no assistance from outsideenergy sources. The typical system consists of a plunger (or piston), top and bottom bumper springs, a lubricator anda surface controller. As the plunger travels to the surface, it creates a solid interface between the lifted gas below and
AR-2
produced fluid above to maximize lift energy. Plunger lift is a low-cost, easily maintained method of lift. It isparticularly useful for dewatering gas wells and increasing production from wells with emulsion problems.
Hybrid Lift Systems — We offer a variety of hybrid artificial lift systems which are engineered for specialapplications and may incorporate two or more of the artificial lift methods described above.
Wellhead Systems — We offer a line of conventional wellhead equipment and valves manufactured to the latestAPI industry specifications and client requirements, including conventional surface wellheads through 20,000 psi;gate valves from 2,000 to 20,000 psi; complete wellhead systems (drill-through, multi-bowl, unitized and mud-line); and all the accessories and aftermarket services to go with them.
Production Optimization — Production optimization is the process of monitoring oil and natural gas fields,and interpreting the resulting data to inform production and reservoir management decisions. The ultimate goal is toassist operators in making better decisions that maximize profits through improved optimized well production andmaximized reservoir recovery. The major benefits of production optimization are increased production withdecreased operating costs resulting in increased bottom-line profits for producers.
Weatherford offers products for optimizing at the well, reservoir and field level. Both hardware and softwareare combined into solutions that fit the customer’s specific needs for optimizing production.
Well Optimization — For wellsite intelligence, we offer specific controllers for each type of artificial lift.These controllers contain computers with specific logic to control the well in response to changes in the reservoir,artificial-lift equipment or well completion. The desktop software provides advanced analytical tools that allow theoperator to make changes by controlling the well directly or by changing the parameters that the controller is usingto operate the well. In 2007, we enhanced our plunger lift controller and added a new variable speed drive forprogressing cavity pumps (PCP), rod pumping, and electric submersible pumps (ESP).
Flow Measurement — Our Production Optimization group develops metering and software solutions to supplyreal-time production information to the operator, allowing accurate production measurements as a part of individualwell and field optimization.
Field Optimization — We provide tools for optimizing workflow. These software tools assist the operator intracking the operations needed for optimal field management. Tasks such as chemical injection, well workovers andallocation of injection gas can easily generate unnecessary expenses by inefficient prioritization of tasks, poorrecordkeeping and lack of analysis of the effectiveness of the total field operations. The combination of ourexperienced consultants and advanced software tools help the operator optimize operations for entire fields.
Heavy-oil Production Optimization Equipment — We provide mechanical production treators and sandmanagement systems to improve heavy-oil flow to and separation in sit-storage tanks. Sands removed from thestorage tanks can be used as environmentally friendly, field-road base material without any special treatment orprocessing.
Drilling Services
These capabilities include directional drilling, Controlled Pressure Drilling» (CPD») & Well Testing, drilling-with-casing (DwCTM) and drilling-with-liner (DwLTM) systems and surface logging systems.
Directional drilling involves the personnel, equipment and engineering required to actively control thedirection of a wellbore and its eventual optimal position in the target reservoir. Directional drilling allows drilling ofmultiple wells from a single offshore platform or a land-based pad site. It also allows drilling of horizontal wells andpenetration of multiple reservoir pay zones from a single wellbore. We supply a range of specialized, patentedequipment for directional drilling, and real-time wellbore logging, including:
• Measurement while drilling (MWD) and logging while drilling (LWD) — MWD and LWD measure,respectively, wellbore trajectory and formation properties, in real time, while the well is being drilled,to enable it to be steered into its optimum position.
• Rotary steerable systems (RSS) — These systems allow control of wellbore trajectory while drilling at thesurface with continuous rotation of the drillstring at the surface. RSS technology is crucial for enabling long,
AR-3

step-out, directional wells and for reducing completion-running complications resulting from abrupt small-scale hole-angle changes caused by conventional drilling methods.
• Directional drilling services — These services include surveying, design and operational support fordirectional and horizontal drilling and performance drilling in vertical wells; products include drillingmotors and other associated equipment, software and expertise required to deliver the well on target asefficiently as possible.
Our directional drilling capabilities are supported by our engineering facilities in Houston and other locationsglobally, which house and support qualified engineers, scientists and technicians, all focused on developingtechnologies for the MWD/LWD and directional drilling markets, both land based and offshore.
Controlled Pressure Drilling» (CPD») — Weatherford’s CPD offerings are provided through three tech-niques: 1) Managed Pressure Drilling, 2) Underbalanced Drilling and 3) Air Drilling.
• Managed Pressure Drilling (MPD) — This technique provides an advanced form of primary well control,using a closed, pressurized fluid system that more precisely controls the wellbore pressure profile than mudweight adjustments alone. The main objective of MPD is to optimize drilling processes by decreasing non-productive time and mitigating drilling hazards.
• Underbalanced Drilling (UBD) — This technique is used in development, exploration and mature fieldapplications to minimize formation damage and maximize productivity. UBD is drilling with bottomholepressure that is maintained below reservoir pressure to intentionally invite fluid influx. This techniquepermits the reservoir to flow while drilling takes place, thereby improving well productivity by protectingthe formation from damage by the drilling fluids.
• Air Drilling — This technique applies reduced density fluid systems to drill sub-hydrostatically. Air drillingis used primarily in hard rock applications to reduce drilling costs by increasing the rate of penetration.
A full range of downhole equipment, such as high temperature motors, wireline steering tools, drillpipe, airrotary hammer drills, casing exit systems, downhole deployment valves and downhole data acquisition equipment,make our product offerings unique.
Well Testing — Well testing uses specialized equipment and procedures to obtain essential information aboutoil and gas wells after the drilling process has been completed. Typical information derived may include reservoirperformance, reservoir pressure, formation permeability, formation porosity and formation fluid composition.
A related application is our separation business, which supplies personnel and equipment on a wellsite torecover a mixture of solids, liquids and gases from oil and gas wells. These services are used during drilling, afterstimulation or after re-completion to clean up wells. The operator requires that a well be properly cleaned beforeundertaking a well test to ensure that the true deliverability of the well is attained and that debris and spentstimulation chemicals do not ultimately flow to the process plant.
Drilling-with-casing and drilling-with-liner systems - These systems allow operators to simultaneously drilland case oil and natural gas wells. Our DwC and DwL techniques eliminate downhole complexity, reducingexpensive rig modifications and the number of trips downhole. Consequently, drilling hazards are mitigated, wellconstruction is simplified, and productivity can be improved when drilling through the reservoir.
Surface Logging Systems — Often referred to as mud logging, this is a well-site service that uses fluid and gassamples along with drilling cuttings to evaluate the geology and geo chemistry of the formation as it is being drilled.The derived data and interpretation is used to help geologists and drillers ensure that the well is placed in the mostproductive formation to maximize ultimate well productivity.
Well Construction
This grouping includes the primary services and products required to construct a well and spans tubularrunning services, cementation tools, liner systems, solid tubular expandable technologies and aluminum alloytubular products.
AR-4

Tubular Running Services — These services consist of a wide variety of tubular connection and installationservices for the drilling, completion and workover of an oil or natural gas well. We provide tubular handling,preparation, inspection and wellsite installation services from a single source. We offer a suite of products andservices for improving rig floor operations by reducing personnel exposure, increasing operational efficiency andimproving safety. We also specialize in critical-service installations where operating conditions, such as downholeenvironments and/or metallurgical characteristics, call for specific handling technology.
Cementation Tools — Cementing operations comprise one of the most expensive phases of well completion.We produce specialized equipment that allows operators to centralize the casing throughout the wellbore andcontrol the displacement of cement and other fluids. Our cementing engineers also analyze complex wells andprovide recommendations to help optimize cementing results.
Liner Systems — Liner hangers allow suspension of strings of casing within a wellbore without the need toextend the casing to the surface. Most directional wells include one or more liners to optimize casing programs. Weoffer both drilling and production liner hangers. Drilling liners are used to isolate areas within the well duringdrilling operations. Production liners are used in the producing area of the well to support the wellbore and to isolatevarious sections of the well.
Solid Tubular Expandable Technologies — Proprietary expandable tools are being developed for downholesolid tubular applications in well remediation, well completion and well construction. Our solid tubular expandableproducts include the MetalSkin» line and the HydraSkinTM System, MetalSkin systems are used for well cladding toshut off zones, retro-fit corroded sections of casing and strengthen existing casing. MetalSkin open-hole cladsystems are used for controlling drilling hazards such as unwanted fluid loss or influx and as slim-bore drillingliners. Slim-bore and, ultimately, monobore liner systems are designed to allow significant cost reductions byreducing consumables for drilling and completion of wells, allowing use of smaller rigs and reducing cuttingsremoval needs. The benefits are derived because of the potential of expandable technologies to significantly reduceor eliminate the reverse-telescoping architecture inherent in traditional well construction. The HydraSkin system isa hydraulic bottom-up expansion system that can be used for increased diameter efficiency in either planned orcontingency operations.
Aluminum Alloy Tubular Products — We design and manufacture aluminum alloy (AA) tubular goods fordrilling, production and completion. Unique physical and mechanical properties of aluminum alloys provide anumber of benefits, especially superior corrosion resistance in various aggressive environments and enhancedstrength-to-weight ratio, resulting in better drilling performance. Products range from Aluminum Alloy Drill Pipe,which is used in most drilling applications, but especially recommended for ultra deep and extended reach wells andrigs with limited load capacity, to drillpipe risers designed for drilling, production and completion operations. Theselarge diameter products possess high strength and significant corrosion resistance properties essential in aggressiveenvironments, such as deepwater wells.
Drilling Tools
We design and manufacture patented tools, including our drilling jars, rotating control devices and otherpressure-control equipment used in drilling oil and natural gas wells. We also offer a broad selection of in-house orthird-party manufactured equipment for the drilling, completion and workover of oil and natural gas wells. We offerthese proprietary and nonproprietary drilling tools to our clients — primarily operators and drilling contractors —on a rental basis, allowing the clients to use unique equipment to improve drilling efficiency without the cost ofholding that equipment in inventory.
Our drilling tools include the following:
• Drillpipe and related drillstem tools, drill collars, heavyweight pipe and drilling jars;
• Downhole tools;
• Pressure-control equipment such as blowout preventers, high-pressure valves, accumulators, adapters andchoke-and-kill manifolds; and
• Tubular handling equipment such as elevators, spiders, slips, tongs and kelly spinners.
AR-5
Completion Systems
We offer our clients a comprehensive line of completion tools and sand screens. These products and servicesinclude the following:
Completion Tools — These tools are incorporated into the tubing string used to transport hydrocarbons fromthe reservoir to the surface. We offer a wide range of devices for enhancing the safety and functionality of theproduction string, including permanent and retrievable packer systems, subsurface safety systems, flow controlsystems and tool strings, specialized downhole isolation valves and associated servicing equipment. Over the pastdecade, we have evolved our portfolio from one of basic cased-hole commodity products to one that focuses moreheavily on premium offerings for deepwater and high-pressure/high-temperature environments.
Sand Screens — Sand production often results in premature failure of artificial-lift and other downhole andsurface equipment and can obstruct the flow of oil and natural gas. To remedy this issue, we provide two differentsand screen approaches: conventional and expandable.
• Conventional sand screens — These products are used in the fluid-solid separation processes and have avariety of product applications. Our primary application of well screens is for the control of sand inunconsolidated formations. We offer premium, pre-pack and wire-wrap sand screens. We also offer aFloRegTM line of inflow control devices that balance horizontal wellbore production, ultimately maximizingreservoir drainage. We also operate the water well and industrial screen business of Johnson Screens. Servedmarkets include water well, petrochemical, wastewater treatment and surface water intake, mining andgeneral industrial applications.
• Expandable Sand Screens (ESS) — Our ESS» systems are proprietary step-change sand-control devices thatreduce cost and improve production. An ESS system consists of three layers, including slotted base pipe,filtration screens and an outer protective shroud. The system can be expanded using a fixed cone and/orcompliantly using our proprietary axial and rotary expansion system. This system aids productivity becauseit stabilizes the wellbore, prevents sand migration and has a larger inner diameter. ESS technology canreplace complex gravel-packing techniques in many sand-control situations.
Reservoir Optimization — Our intelligent completion technology (ICT) uses downhole optical and electronicsensing to allow operators to remotely monitor the downhole pressure, temperature, flow rate, phase fraction andseismic activity of each well and the surrounding reservoir. This advanced monitoring capability allows the operatorto monitor the reaction of the reservoir to the production of the well. Combining this monitoring with multiple-zonedownhole flow control allows field pressure management and shutoff of unwanted flows of water or gas.
Wireline and Evaluation Services
Wireline and evaluation services, in concert with surface logging systems and LWD, form a data acquisitionand interpretation capability that enables clients with an integrated approach to formation evaluation and reservoircharacterization. Open-hole wireline services and logging while drilling compliment laboratory-derived analysis ofcore and reservoir fluid samples. When combined with geosciences consulting, this integrated capability providesthe data and interpretation to reduce reservoir uncertainty and ultimately optimize production and maximizerecovery.
Wireline services — Wireline services measure the physical properties of underground formations to helpdetermine the location and potential deliverability of oil and gas from a reservoir. Wireline services are providedfrom surface logging units, which lower tools and sensors into the wellbore mainly on a single or multiple conductorwireline.
The provision of wireline and associated interpretation services is divided into four categories: open holewireline, geoscience services, cased hole wireline and slickline services:
• Open Hole Wireline — This service helps locate oil and gas by measuring certain characteristics ofgeological formations and providing permanent records called “logs.” Open hole logging can be performedat different intervals during the well drilling process or immediately after a well is drilled. The logging dataprovides a valuable benchmark to which future well management decisions may be referenced. The open
AR-6
hole sensors are used to determine well lithology and the presence of hydrocarbons. Formation charac-teristics such as resistivity, density and porosity are measured using electrical, nuclear, acoustic, magneticand mechanical technologies.
The formation characteristics are then used to characterize the reservoir and describe it in terms of porosity,permeability, oil, gas or water content and an estimation of productivity. Wireline services can relay thisinformation from the wellsite on a real-time basis via a secure satellite transmission network and secureInternet connection to the client’s office for faster evaluation and decision making.
• Geoscience Services — This capability, consisting of geologists, geophysicists, and drilling, completion,production and reservoir engineers, serves as the interpretive bridge across diverse data sources to supportclient efforts to maximize their oil and gas assets for the life of the well — from well planning throughdrilling, evaluation, completion, production, intervention and, finally, abandonment.
Major computing centers in Calgary and Houston, along with branches in Europe, the Middle East, LatinAmerica and Asia Pacific, use the latest technology to deliver data to our clients — from real-time (LWD)“geosteering” for critical well placement decisions to ongoing reservoir monitoring with permanent“intelligent completion” sensors. We provide advanced reservoir solutions by incorporating open hole,cased hole and production data.
• Cased Hole Wireline — This service is performed at various times throughout the life of the well andincludes perforating, completion logging, production logging and casing integrity services. Perforatingcreates the flow path between the reservoir and the wellbore. Production logging can be performedthroughout the life of the well to measure temperature, fluid type, flow rate, pressure and other reservoircharacteristics. In addition, cased hole services may involve wellbore diagnostics and remediation, whichcould include the positioning and installation of various plugs and packers to maintain production or repairwell problems, and casing inspection for internal or external abnormalities in the casing string.
• Slickline Services — This service uses a solid steel or braided nonconductor line, in place of a single ormultiple conductor braided line used in electric logging, to run downhole memory tools, manipulatedownhole production devices and provide fishing services primarily in producing wells.
Integrated Evaluation Services — These services help clients plan the development of new and existing oiland gas production fields. Specifically, a global network of laboratories provide support in terms of fluid andreservoir characterization, specialized core and fluid testing, enhanced oil recovery, rock strength and character-ization, sour richness and maturity, sorption properties assessment and reservoir flow studies.
Re-entry and Fishing
Our re-entry, fishing and thru-tubing services help clients repair wells that have mechanical problems or thatneed work to prolong production of oil and natural gas reserves.
Re-entry Services — Our re-entry services include casing exit services and advanced multilateral systems.Conventional and advanced casing exit systems allow sidetrack and lateral drilling solutions for clients who eithercannot proceed down the original well track or want to drill lateral wells from the main or parent wellbore.
Fishing Services — Fishing services are provided through teams of experienced fishing tool supervisors and acomprehensive line of fishing and milling tools. Our teams provide conventional fishing services, such as removingwellbore obstructions, including stuck or dropped equipment, tools, drillstring components and other debris, thathave been lost downhole unintentionally during the drilling, completion or workover of new and old wells.Specialty fishing tools required in these activities include fishing jars, milling tools, casing cutters, overshots andspears. Our Fishing Services business unit also provides well patches and extensive plug-and-abandonmentproducts.
Thru-tubing Services — Thru-tubing services are used in well re-entry activity to allow operators to performcomplex drilling, completion and cementing activities from existing wellbores without removing existing pro-duction systems. We provide a full range of thru-tubing services and products, including drilling motors, casingexits, fishing and milling, zonal isolation packers and other well remediation services.
AR-7

Stimulation and Chemicals
We offer our clients advanced chemical technology and services for safer and more effective productionenhancement. These products and services include the following:
Fracturing Technologies — Hydraulic reservoir fracturing is a stimulation method routinely performed on oiland natural gas wells in low-permeability reservoirs to increase productivity and oil and gas recovery. Our offeringsinclude the latest in equipment design and technology.
Coiled Tubing Technologies — Our services include a line of equipment designed with the latest technology toensure effective results during operations that require coiled tubing intervention. Offerings include coiled tubingunits, appropriate crane trucks and nitrogen tanks and pumpers (trailer or skid formats).
Cement Services — Includes CHEMVIEW and CHEMPRO software to analyze each job to ensure the bestapplication for each situation. Our new fleet of cement pumping equipment includes high-horsepower pumptrailers, batch mixers, two-pod blended cement trailers and a four-pod sand storage trailer; all with the latest intechnology and design features for improved operation and performance.
Chemical Systems — Our Engineered Chemistry» business combines proprietary chemical solutions withinternally developed oilfield equipment technologies. Our high-performance chemistry solutions include: cus-tomized chemical solutions for drilling, completion, production, intervention, refining, water treatment as well asmany industrial processes; a total service package (product selection, application and optimization); and preciseformulations and multi-functional chemical formulations that include the only formulas certified for capillaryinjection.
Drilling Fluids — Our drilling fluids service line is engaged in the provision of drilling fluids, completionfluids and other related services. The main functions of drilling fluids include providing hydrostatic pressure toprevent formation fluids from entering into the well bore, keeping the drill bit cool and clean during drilling,carrying out drill cuttings and suspending the drill cuttings while drilling is paused and the drilling assembly isbrought in and out of the hole. We also provide waste management services which separate and manage drillcuttings produced by the drilling process. Drill cuttings are usually contaminated with petroleum or drilling fluids,and must be disposed of in an environmentally safe manner.
Integrated Drilling
We have the ability to offer project management services to our clients, in which we provide a number ofproducts and services needed to drill and complete a well, including the rig. All of our land drilling rigs are locatedoutside of North America.
Pipeline and Specialty Services
We provide a range of services used throughout the life cycle of pipelines and process facilities, onshore andoffshore. Our pipeline group can meet all the requirements of the pipeline, process, industrial and energy marketsworldwide. We also can provide any service (or package of services) carried out on permanently installed clientequipment that involves inspecting, cleaning, drying, testing, improving production, running or establishingintegrity from the wellhead out.
Other Business Data
Competition
We provide our products and services worldwide, and compete in a variety of distinct segments with a numberof competitors. Our principal competitors include Baker Hughes, BJ Services, Halliburton, Schlumberger andSmith International. We also compete with various other regional suppliers that provide a limited range ofequipment and services tailored for local markets. Competition is based on a number of factors, includingperformance, safety, quality, reliability, service, price, response time and, in some cases, breadth of products.
AR-8

Raw Materials
We purchase a wide variety of raw materials as well as parts and components made by other manufacturers andsuppliers for use in our manufacturing. Many of the products sold by us are manufactured by other parties. We arenot dependent on any single source of supply for any of our raw materials or purchased components.
Customers
Our principal customers consist of major and independent oil and natural gas producing companies. Revenuefrom Petroleos Mexicanos (“Pemex”) accounted for approximately 13% of our revenues during 2009 and no otherindividual customer accounted for more than 10% of our consolidated revenues. During 2008 and 2007, there wasno individual customer who accounted for more than 10% of our consolidated revenues.
Research and Development and Patents
We maintain world-class technology and training centers throughout the world. Our 34 research, developmentand engineering facilities are focused on improving existing products and services and developing new technologiesto meet customer demands for improved drilling performance and enhanced reservoir productivity. Our expen-ditures for research and development totaled $195 million in 2009, $193 million in 2008 and $169 million in 2007.
As many areas of our business rely on patents and proprietary technology, we seek patent protection bothinside and outside the U.S. for products and methods that appear to have commercial significance. In the U.S., wecurrently have 1,229 patents issued and over 463 pending. We have 2,470 patents issued in internationaljurisdictions and over 1,255 pending. We amortize patents over the years expected to be benefited, ranging fromthree to 20 years.
Although in the aggregate our patents are important to the manufacturing and marketing of many of ourproducts and services, we do not believe that the loss of any one of our patents would have a material adverse effecton our business.
Seasonality
Weather and natural phenomena can temporarily affect level of demand for our products and services. Springmonths in Canada and winter months in the North Sea and Russia tend to affect operations negatively. In thesummers of 2005 and 2008, the Gulf of Mexico suffered an unusually high number of hurricanes that adverselyimpacted our operations. In addition, unfavorable weather conditions in Mexico could reduce our operations andrevenues from that area. The widespread geographical locations of our operations serve to mitigate the impact of theseasonal nature of our business.
Federal Regulation and Environmental Matters
Our operations are subject to federal, state and local laws and regulations relating to the energy industry ingeneral and the environment in particular.
Our 2009 expenditures to comply with environmental laws and regulations were not material, and we currentlydo not expect the cost of compliance with environmental laws and regulations for 2010 to be material.
Employees
At December 31, 2009, we employed approximately 52,000 employees. Certain of our operations are subjectto union contracts. These contracts cover approximately two percent of our employees. We believe that ourrelationship with our employees is generally satisfactory.
Forward-Looking Statements
This report, as well as other filings made by us with the Securities and Exchange Commission (“SEC”), andour releases issued to the public contain various statements relating to future results, including certain projectionsand business trends. We believe these statements constitute “Forward-Looking Statements” as defined in the Private
AR-9
Securities Litigation Reform Act of 1995. These forward-looking statements generally are identified by the words“believe,” “project,” “expect,” “anticipate,” “estimate,” “intend,” “strategy,” “plan,” “may,” “should,” “will,”“would,” “will be,” “will continue,” “will likely result,” and similar expressions, although not all forward-lookingstatements contain these identifying words.
From time to time, we update the various factors we consider in making our forward-looking statements andthe assumptions we use in those statements. However, we undertake no obligation to publicly update or revise anyforward-looking events or circumstances that may arise after the date of this report. The following sets forth thevarious assumptions we use in our forward-looking statements, as well as risks and uncertainties relating to thosestatements. Certain of the risks and uncertainties may cause actual results to be materially different from projectedresults contained in forward-looking statements in this report and in our other disclosures. These risks anduncertainties include, but are not limited to, the following:
• Global political, economic and market conditions could affect projected results. Our operating results andthe forward-looking information we provide are based on our current assumptions about oil and natural gassupply and demand, oil and natural gas prices, rig count and other market trends. Our assumptions on thesematters are in turn based on currently available information, which is subject to change. The oil and naturalgas industry is extremely volatile and subject to change based on political and economic factors outside ourcontrol. Worldwide drilling activity, as measured by average worldwide rig counts, increased in each yearfrom 2002 to 2008. However, activity began declining in the fourth quarter of 2008, particularly in NorthAmerica. The weakened global economic climate has resulted in lower demand and lower prices for oil andnatural gas, which has reduced drilling and production activity, which has in turn resulted in lower thanexpected revenues and income in 2009 and may affect our future revenues and income. Our projectionsassume that the decline in North America rig activity reached its trough during 2009. However, we are notcertain as to the timing of the recovery in activity. We cannot accurately predict how much lower commodityprices and drilling activity may go, or when they may recover. Worldwide drilling activity and globaldemand for oil and natural gas may also be affected by changes in governmental policies and debt loads, lawsand regulations related to environmental or energy security matters, including those addressing alternativeenergy sources and the risks of global climate change. We have assumed global demand will continue to bedown in 2010 compared to 2008 and only slightly up compared to 2009. In 2010, worldwide demand may besignificantly weaker than we have assumed.
• We may be unable to recognize our expected revenues from current and future contracts. Our customers,many of whom are national oil companies, often have significant bargaining leverage over us and may electto cancel or revoke contracts, not renew contracts, modify the scope of contracts or delay contracts, in somecases preventing us from realizing expected revenues and/or profits. Our projections assume that ourcustomers will honor the contracts we have been awarded and that those contracts and the business that webelieve is otherwise substantially firm will result in anticipated revenues in the periods for which they arescheduled.
• Currency fluctuations could have a material adverse financial impact on our business. A material changein currency rates in our markets, including the devaluation of the Venezuelan Bolivar (See Item 7A.Quantitative and Qualitative Disclosure About Market Risk) could affect our future results as well as affectthe carrying values of our assets. World currencies have been subject to much volatility. As we are not able topredict changes in currency valuations, our forward-looking statements assume no material impact fromfuture changes in currency exchange rates.
• Our ability to manage our workforce could affect our projected results. In a climate of decreasing demand,we are faced with managing our workforce levels to control costs without impairing our ability to provideservice to our customers. Our forward-looking statements assume we will be able to do so.
• Increases in the prices and availability of our raw materials could affect our results of operations. We uselarge amounts of raw materials for manufacturing our products. The price of these raw materials has asignificant impact on our cost of producing products for sale or producing fixed assets used in our business.We have assumed that the prices of our raw materials will remain within a manageable range and will bereadily available. If we are unable to obtain necessary raw materials or if we are unable to minimize the
AR-10
impact of increased raw material costs or to realize the benefit of cost decreases in a timely fashion throughour supply chain initiatives or pricing, our margins and results of operations could be adversely affected.
• Our ability to manage our supply chain could affect our projected results. We have undertaken efforts toimprove our supply chain, invoicing and collection processes and procedures. These undertakings includecosts, which we expect will result in long-term benefits of our business processes. Our forward-lookingstatements assume we will realize the benefits of these efforts.
• Our long-term growth depends upon technological innovation and commercialization. Our ability todeliver our long-term growth strategy depends in part on the commercialization of new technology. A centralaspect of our growth strategy is to improve our products and services through innovation, to obtaintechnologically advanced products through internal research and development and/or acquisitions, to protectproprietary technology from unauthorized use and to expand the markets for new technology by leveragingour worldwide infrastructure. The key to our success will be our ability to commercialize the technology thatwe have acquired and demonstrate the enhanced value our technology brings to our customers’ operations.Our major technological advances include, but are not limited to, those related to controlled pressure drillingand testing systems, expandable solid tubulars, expandable sand screens and intelligent well completion.Our forward-looking statements have assumed successful commercialization of, and above-average growthfrom, these new products and services, as well as legal protection of our intellectual property rights.
• Nonrealization of expected benefits from our redomestication could affect our projected results. Weoperate through our various subsidiaries in numerous countries throughout the world including the UnitedStates. During the first quarter of 2009, we completed a transaction in which our former parent Bermudacompany became a wholly-owned subsidiary of Weatherford International Ltd., a Swiss joint-stockcorporation, and holders of common shares of the Bermuda company received one registered share ofthe Swiss company in exchange for each common share that they held. Consequently, we are or may becomesubject to changes in tax laws, treaties or regulations or the interpretation or enforcement thereof in the U.S.,Bermuda, Switzerland or any other jurisdictions in which we or any of our subsidiaries operates or isresident. Our income tax expense is based upon our interpretation of the tax laws in effect in variouscountries at the time that the expense was incurred. If the U.S. Internal Revenue Service or other taxingauthorities do not agree with our assessment of the effects of such laws, treaties and regulations, this couldhave a material adverse effect on us including the imposition of a higher effective tax rate on our worldwideearnings or a reclassification of the tax impact of our significant corporate restructuring transactions.
• Nonrealization of expected benefits from our acquisitions could affect our projected results. We expect togain certain business, financial and strategic advantages as a result of business acquisitions we undertake,including synergies and operating efficiencies. Our forward-looking statements assume that we willsuccessfully integrate our business acquisitions and realize the benefits of those acquisitions.
• The downturn in our industry could affect the carrying value of our goodwill. As of December 31, 2009,we had approximately $4.2 billion of goodwill. Our estimates of the value of our goodwill could be reducedin the future as a result of various factors, including market factors, some of which are beyond our control.Our forward-looking statements do not assume any future goodwill impairment. Any reduction in the fairvalue of our businesses may result in an impairment charge and therefore adversely affect our results.
• Adverse weather conditions in certain regions could adversely affect our operations. In the summers of 2005and 2008, the Gulf of Mexico suffered several significant hurricanes. These hurricanes and associated hurricanethreats reduced the number of days on which we and our customers could operate, which resulted in lowerrevenues than we otherwise would have achieved. In parts of 2006, and particularly in the second quarters of2007 and 2008, climatic conditions in Canada were not as favorable to drilling as we anticipated, which limitedour potential results in that region. Similarly, unfavorable weather in Russia, Mexico and in the North Sea couldreduce our operations and revenues from that area during the relevant period. Our forward-looking statementsassume weather patterns in our primary areas of operations will be conducive to our operations.
• U.S. Government and internal investigations could affect our results of operations. We are currentlyinvolved in government and internal investigations involving various of our operations. These investigations
AR-11
are not yet resolved, and we cannot anticipate the timing, outcome or possible impact of the ultimateresolution of these investigations, financial or otherwise. The governmental agencies involved in theseinvestigations have a broad range of civil and criminal penalties they may seek to impose againstcorporations and individuals for violations of trading sanctions laws, the Foreign Corrupt Practices Actand other federal statutes including, but not limited to, injunctive relief, disgorgement, fines, penalties andmodifications to business practices and compliance programs. In recent years, these agencies and authoritieshave entered into agreements with, and obtained a range of penalties against, several public corporations andindividuals in similar investigations, under which civil and criminal penalties were imposed, including insome cases fines and other penalties and sanctions in the tens and hundreds of millions of dollars. Theseagencies likely will seek to impose penalties of some amount against us for past conduct, but the ultimateamount of any penalties we may pay currently cannot be reasonably estimated. Under trade sanctions laws,the U.S. Department of Justice may also seek to impose modifications to business practices, includingimmediate cessation of all business activities in specific countries or other limitations that decrease ourbusiness, and modifications to compliance programs, which may increase compliance costs. Any injunctiverelief, disgorgement, fines, penalties, sanctions or imposed modifications to business practices resultingfrom these investigations could adversely affect our results of operations. Additionally, during 2008, weincurred $56 million for costs in connection with our exit from certain sanctioned countries and, to date, wehave incurred $106 million for legal and professional fees in connection with complying with andconducting these on-going investigations. This amount excludes the costs we have incurred to augmentand improve our compliance function in 2008 and 2009. We may have additional charges related to thesematters in future periods, which costs may include labor claims, contractual claims, penalties assessed bycustomers, and costs, fines, taxes and penalties assessed by the local governments, but we cannot quantifythose charges or be certain of the timing of them.
• Failure in the future to ensure ongoing compliance with certain laws could affect our results of operations. In2009, we substantially augmented our compliance infrastructure with increased staff and more rigorouspolicies, procedures and training of our employees regarding compliance with applicable anti-corruption laws,trade sanctions laws and import/export laws. As part of this effort, we now undertake audits of our complianceperformance in various countries. Our forward-looking statements assume that our compliance efforts will besuccessful and that we will comply with our internal policies and applicable laws regarding these issues. Ourfailure to do so could result in additional enforcement action in the future.
• Political disturbances, war, or terrorist attacks and changes in global trade policies could adversely impactour operations. We operate in over 100 countries, and as such are at risk of various types of politicalactivities, including acts of insurrections, war, terrorism, nationalization of assets and changes in tradepolicies. We have assumed there will be no material political disturbances or terrorist attacks and there willbe no material changes in global trade policies that affect our business. Any further military actionundertaken by the U.S. or other countries or political disturbances in the countries in which we conductbusiness could adversely affect our results of operations.
• Current turmoil in the credit markets may reduce our access to capital or reduce the availability of financialrisk-mitigation tools. The worldwide credit markets have experienced turmoil and uncertainty since mid-2008. Our forward-looking statements assume that the financial institutions that have committed to extendus credit will honor their commitments under our credit facilities. If one or more of those institutionsbecomes unwilling or unable to honor its commitments, our access to liquidity could be impaired and ourcost of capital to fund growth could further increase. We use interest-rate and foreign-exchange swaptransactions with financial institutions to mitigate certain interest-rate and foreign-exchange risks associatedwith our capital structure and our business. Our forward-looking statements assume that those tools willcontinue to be available to us. However, the failure of any counter party to honor a swap agreement couldreduce the availability of these financial risk-mitigation tools or could result in the loss of expected financialbenefits. In response to credit market conditions and the global economic and business environment, we haveundertaken measures to reduce our use of capital going forward. Our forward-looking statements assumethat we will operate with lower capital expenditures in 2010 than in 2009. However, as the business climate
AR-12
changes and if attractive opportunities for organic or acquisitive growth become available, we may spendcapital selectively above the amounts we have budgeted.
Finally, our future results will depend upon various other risks and uncertainties, including, but not limited to,those detailed in our other filings with the SEC. For additional information regarding risks and uncertainties, see ourother filings with the SEC under the Securities Exchange Act of 1934, as amended, and the Securities Act of 1933,as amended, available free of charge at the SEC’s website at www.sec.gov.
Item 1A. Risk Factors
An investment in our common shares involves various risks. When considering an investment in our company,you should consider carefully all of the risk factors described below, the matters discussed on the foregoing pagesunder “Business-Forward-Looking Statements”, as well as other information included and incorporated byreference in this report.
We have significant operations that would be adversely impacted in the event of war, political disruption,civil disturbance, economic and legal sanctions or changes in global trade policies.
Like most multinational oilfield service companies, we have operations in certain international areas,including parts of the Middle East, Africa, Latin America, the Asia Pacific region and the FSU, that are subjectto risks of war, political disruption, civil disturbance, economic and legal sanctions (such as restrictions againstcountries that the U.S. government may deem to sponsor terrorism) and changes in global trade policies. Ouroperations may be restricted or prohibited in any country in which the foregoing risks occur.
In particular, the occurrence of any of these risks could result in the following events, which in turn, couldmaterially and adversely impact our results of operations:
• disruption of oil and natural gas exploration and production activities;
• restriction of the movement and exchange of funds;
• our inability to collect receivables;
• enactment of additional or stricter U.S. government or international sanctions; and
• limitation of our access to markets for periods of time.
We are involved in several governmental and internal investigations, which are costly to conduct, haveresulted in a loss of revenue and may result in substantial financial penalties.
We are currently involved in government and internal investigations involving various areas of our operations.
Until 2003, we participated in the United Nations oil-for-food program governing sales of goods and servicesinto Iraq. The U.S. Department of Justice (“DOJ”) and the SEC have undertaken investigations of our participationin the oil-for-food program and have subpoenaed certain documents in connection with these investigations. Wehave cooperated fully with these investigations. We have retained legal counsel, reporting to our audit committee, toinvestigate this matter. These investigations are not yet resolved, and we cannot anticipate the timing, outcome orpossible impact of the ultimate resolution of the investigations, financial or otherwise.
The U.S. Department of Commerce, Bureau of Industry & Security, Office of Foreign Assets Control(“OFAC”), DOJ and SEC have undertaken investigations of allegations of improper sales of products and servicesby the Company and its subsidiaries in certain sanctioned countries. We have cooperated fully with this inves-tigation. We have retained legal counsel, reporting to our audit committee, to investigate these matters and tocooperate fully with these agencies. This investigation is not yet resolved, and we cannot anticipate the timing,outcome or possible impact of the ultimate resolution of the investigation, financial or otherwise.
In light of this investigation and of the current U.S. and foreign policy environment and the inherentuncertainties surrounding these countries, we decided in September 2007 to direct our foreign subsidiaries todiscontinue doing business in countries that are subject to comprehensive U.S. economic and trade sanctions,
AR-13
specifically Cuba, Iran, and Sudan, as well as Syria. Effective September 2007, we ceased entering into any newcontracts in these countries and began an orderly discontinuation and winding down of our existing business in thesesanctioned countries. Effective March 31, 2008, we substantially completed our winding down of business in thesecountries. We can complete the withdrawal process only pursuant to licenses issued by OFAC. Our remainingactivities in Iran, Sudan and Syria include ongoing withdrawal activities such as attempts to collect accountsreceivable, attempts to settle tax liabilities or legal claims and attempts to recover or liquidate assets, includingequipment and funds. Certain of our subsidiaries continue to conduct business in countries such as Myanmar thatare subject to more limited U.S. trading sanctions.
The DOJ and SEC are investigating the embezzlement of approximately $175,000 at a European subsidiaryand the possible improper use of these funds, including possible payments to government officials in Europe, duringthe period from 2000 to 2004, and our compliance with the Foreign Corrupt Practices Act (“FCPA”) and other lawsworldwide. We have retained legal counsel, reporting to our audit committee, to investigate these matters and tocooperate fully with the DOJ and SEC. As part of our investigations, we have uncovered potential violations ofU.S. law in connection with activities in West Africa. These investigations are not yet resolved, and we cannotanticipate the timing, outcome or possible impact of the ultimate resolution of the investigations, financial orotherwise.
The DOJ, SEC and other agencies and authorities have a broad range of civil and criminal penalties they mayseek to impose against corporations and individuals for violations of trade sanctions laws, the FCPA and otherfederal statutes including, but not limited to, injunctive relief, disgorgement, fines, penalties and modifications tobusiness practices and compliance programs. In recent years, these agencies and authorities have entered intoagreements with, and obtained a range of penalties against, several public corporations and individuals in similarinvestigations, under which civil and criminal penalties were imposed, including in some cases fines and otherpenalties and sanctions in the tens and hundreds of millions of dollars. These agencies are seeking to imposepenalties against us for past conduct, but the ultimate amount of any penalties we may pay currently cannot bereasonably estimated. Under trade sanctions laws, the DOJ may also seek to impose modifications to businesspractices, including immediate cessation of all business activities in specific countries or other limitations thatdecrease our business, and modifications to compliance programs, which may increase compliance costs. Anyinjunctive relief, disgorgement, fines, penalties, sanctions or imposed modifications to business practices resultingfrom these investigations could adversely affect our results of operations. In addition, our activities in sanctionedcountries, such as Sudan and Iran, could result in certain investors, such as government sponsored pension funds,divesting or not investing in our registered shares. Based on available information, we cannot predict what, if any,actions the DOJ, SEC or other authorities will take in our situation or the effect any such actions will have on ourconsolidated financial position or results of operations. To the extent we have violated trade sanctions laws, theFCPA, or other laws or regulations, fines and other penalties may be imposed. Because these matters are nowpending before the indicated agencies, there can be no assurance that actual fines or penalties, if any, will not have amaterial adverse affect on our business, financial condition, liquidity or results of operations.
During 2009 and 2008, we incurred $45 million and $47 million, respectively, in connection with these on-going investigations. In addition, we incurred $56 million for costs incurred in connection with our exit from certainsanctioned countries during 2008.
Our significant operations in foreign countries expose us to currency fluctuation risks or devaluation.
A portion of our net assets are located outside the U.S. and are carried on our books in local currencies.Changes in those currencies in relation to the U.S. dollar result in translation adjustments, which are reflected asaccumulated other comprehensive income in the shareholders’ equity section in our Consolidated Balance Sheets.We recognize remeasurement and transactional gains and losses on currencies in our Consolidated Statements ofIncome, which may adversely impact our results of operations. We enter into foreign currency forward contractsand other derivative instruments as an effort to reduce our exposure to currency fluctuations; however, there can beno assurance that these hedging activities will be effective in reducing or eliminating foreign currency risks.
In certain foreign countries, a component of our cost structure is denominated in a different currency than ourrevenues. In those cases, currency fluctuations could adversely impact our operating margins.
AR-14

Uninsured claims and litigation could adversely impact our results.
In the ordinary course of business, we become the subject of various claims and litigation. We maintaininsurance to cover many of our potential losses and we are subject to various self-retentions and deductibles withrespect to our insurance. Although we are subject to various ongoing items of litigation, we do not believe any of ourcurrent items of litigation are likely to result in any material uninsured losses to us. However, it is possible anunexpected judgment could be rendered against us in cases in which we could be uninsured and beyond the amountswe currently have reserved or anticipate incurring, and in some cases those losses could be material.
We currently carry a variety of insurance for our operations. We are partially self-insured for certain claims inamounts we believe to be customary and reasonable. Although we believe we maintain insurance coverage adequatefor the risks of our business, our insurance may not be sufficient to cover any particular loss, or our insurance maynot cover all losses. For example, while we maintain product liability insurance, this type of insurance is limited incoverage and it is possible an adverse claim could arise in excess of our coverage. Finally, insurance rates have in thepast been subject to wide fluctuation, and in the current global economic environment could increase significantlyin the near future. Changes in coverage, insurance markets and our industry may result in further increases in ourcost and higher deductibles and retentions.
We are also subject to various federal, state and local laws and regulations relating to the energy industry ingeneral and the environment in particular. Environmental laws have in recent years become more stringent and havegenerally sought to impose greater liability on a larger number of potentially responsible parties. While we are notcurrently aware of any situation involving an environmental claim that would be likely to have a material adverseeffect on our business, it is always possible that an environmental claim with respect to one or more of our currentbusinesses or a business or property that one of our predecessors owned or used could arise and could involvematerial expenditures.
Customer credit risks could result in losses.
The concentration of our customers in the energy industry may impact our overall exposure to credit risk ascustomers may be similarly affected by prolonged changes in economic and industry conditions. Those countriesthat rely heavily upon income from hydrocarbon exports will be hit particularly hard given the drop in oil prices.Further, laws in some jurisdictions in which we operate could make collection difficult or time consuming. Weperform ongoing credit evaluations of our customers and do not generally require collateral in support of our tradereceivables. While we maintain reserves for potential credit losses, we cannot assure such reserves will be sufficientto meet write-offs of uncollectible receivables or that our losses from such receivables will be consistent with ourexpectations.
Any capital financing that may be necessary to fund growth may not be available to us at economicrates.
Turmoil in the credit markets and the potential impact on liquidity of major financial institutions may have anadverse effect on our ability to fund growth opportunities through borrowings, under either existing or newlycreated instruments in the public or private markets on terms we believe to be reasonable.
A terrorist attack could have a material and adverse effect on our business.
We operate in many dangerous countries, such as Iraq, in which acts of terrorism or political violence are asubstantial and frequent risk. Such acts could result in kidnappings or the loss of life of our employees orcontractors, a loss of equipment, which may or may not be insurable in all cases, or a cessation of business in anaffected area. We cannot be certain that our security efforts will in all cases be sufficient to deter or prevent acts ofpolitical violence or terrorist strikes against us or our customers’ operations.
Changes in tax laws could adversely impact our results
On June 26, 2002, the stockholders and Board of Directors of Weatherford International, Inc. (“Weatherford-Delaware”) approved our corporate reorganization, and Weatherford International Ltd. (“Weatherford-Bermuda”),
AR-15
a newly formed Bermuda company, became the parent holding company of Weatherford International, Inc. Duringthe first quarter of 2009, we completed a transaction in which Weatherford Bermuda company became a wholly-owned subsidiary of Weatherford International Ltd., a Swiss joint-stock company (“Weatherford-Switzerland”),and holders of our common shares received one registered share of Weatherford Switzerland for each commonshare of Weatherford Bermuda that they held. We refer to this transaction as the “redomestication.” The realizationof the tax benefit of this reorganization could be impacted by changes in tax laws, tax treaties or tax regulations orthe interpretation or enforcement thereof or differing interpretation or enforcement of applicable law by theU.S. Internal Revenue Service or other taxing jurisdictions. The inability to realize this benefit could have a materialimpact on our financial statements.
The anticipated benefits of moving our principal executive offices to Switzerland may not be realized,and difficulties in connection with moving our principal executive offices could have an adverse effecton us.
In connection with the redomestication, we relocated our principal executive offices from Houston, Texas toGeneva, Switzerland. Most of our executive officers, including our Chief Executive Officer, and other key decisionmakers have relocated or will relocate to Switzerland. We may face significant challenges in relocating ourexecutive offices to a different country, including difficulties in retaining and attracting officers, key personnel andother employees and challenges in maintaining our executive offices in a country different from the country whereother employees, including corporate support staff, are located. Employees may be uncertain about their future roleswithin our organization as a result of the redomestication. Management may also be required to devote substantialtime to the redomestication and related matters, which could otherwise be devoted to focusing on ongoing businessoperations and other initiatives and opportunities. In addition, we may not realize the benefits we anticipate from theredomestication, including the benefit of moving to a location that is more centrally located within our area ofworldwide operations. Any such difficulties could have an adverse effect on our business, results of operations orfinancial condition.
The rights of our shareholders are governed by Swiss law and documents following theredomestication.
Following the redomestication, the rights of our shareholders are governed by Swiss law and Weatherford-Switzerland’s articles of association and organizational regulations. The rights of shareholders under Swiss lawdiffer from the rights of shareholders of companies incorporated in other jurisdictions. For example, directors ofWeatherford-Switzerland may be removed by shareholders with or without cause, but such removal requires thevote of shareholders holding at least 662⁄3% of the voting rights and the absolute majority of the par value of theregistered shares represented at the meeting as well as a quorum of at least two-thirds of the registered sharesrecorded in the share register.
We intend to hold future shareholder meetings in Switzerland, and our required quorum for thosemeetings is lower.
We intend to hold future shareholders meetings in Switzerland, which may make attendance in person moredifficult for some investors. For shareholders meetings for Weatherford-Switzerland for the transaction of anybusiness other than removal of a director or certain other specified resolutions, a quorum comprises at least one-third of the registered shares recorded in the share register and entitled to vote (and at least two-thirds of theregistered shares recorded in the share register and entitled to vote for the removal of directors and certain otherspecified resolutions).
Item 1B. Unresolved Staff Comments
None.
AR-16

Item 2. Properties
Our operations are conducted in approximately 100 countries and we have manufacturing facilities and sales,service and distribution locations throughout the world. The following table describes our material facilities as ofDecember 31, 2009:
LocationOwned/Leased
Principal Services and ProductsOffered or Manufactured
North America:Houston, Texas . . . . . . . . . . . . . . . . . . . . . . . Owned Research and development
Houston, Texas . . . . . . . . . . . . . . . . . . . . . . . Owned Sand screens
Houma, Louisiana . . . . . . . . . . . . . . . . . . . . . Owned Cementing products
New Brighton, Minnesota. . . . . . . . . . . . . . . . Owned Water well and industrial screensNisku, Alberta, Canada . . . . . . . . . . . . . . . . . Owned Reciprocating rod lift
Nisku, Alberta, Canada . . . . . . . . . . . . . . . . . Owned Drilling equipment, fishing, wireline, controlledpressure drilling and testing services
Pearland, Texas . . . . . . . . . . . . . . . . . . . . . . . Owned Fishing, drilling equipment
Schriever, Louisiana . . . . . . . . . . . . . . . . . . . . Owned Cementation mfg. plant, well constructionservices
Latin America:Ciudad Del Carmen, Campeche, Mexico. . . . . Leased Wireline
Reynosa,Tamaulipas, Mexico . . . . . . . . . . . . . Leased Casing exit, cementation equipment & systems,directional drilling, fishing , managed pressuredrilling
Reynosa,Tamaulipas, Mexico . . . . . . . . . . . . . Leased Service center
Europe/West Africa/FSU:Aberdeen, Scotland . . . . . . . . . . . . . . . . . . . . Leased Expandable slotted tubulars
Langenhagen, Germany . . . . . . . . . . . . . . . . . Leased Manufacturing
Nizhnevartovsk, Russia(2) . . . . . . . . . . . . . . . Owned Drilling, sidetracking, wireline, fishing, wellworkover and tool rental
Nyagan, Russia . . . . . . . . . . . . . . . . . . . . . . . Owned Drilling, sidetracking, wireline, fishing, wellworkover and tool rental
Middle East/North Africa/Asia:Awjila, Libya . . . . . . . . . . . . . . . . . . . . . . . . . Leased Warehouse and service
Deyang, China . . . . . . . . . . . . . . . . . . . . . . . . Owned Pump jacks and wellhead
Dongyin, Shangdong, China . . . . . . . . . . . . . . Leased Progressing cavity pumping
Hassi Messaoud, Algeria . . . . . . . . . . . . . . . . Owned Fishing, liner hangers, controlled pressuredrilling and testing services
Corporate:Geneva, Switzerland . . . . . . . . . . . . . . . . . . . Leased Headquarters
Houston, Texas . . . . . . . . . . . . . . . . . . . . . . . Leased Corporate offices
Item 3. Legal Proceedings
In the ordinary course of business, we become the subject of various claims and litigation. We maintaininsurance to cover many of our potential losses, and we are subject to various self-retention limits and deductibleswith respect to our insurance.
See “Item 1. Business — Other Business Data — Federal Regulation and Environmental Matters”, which isincorporated by reference into this item.
AR-17
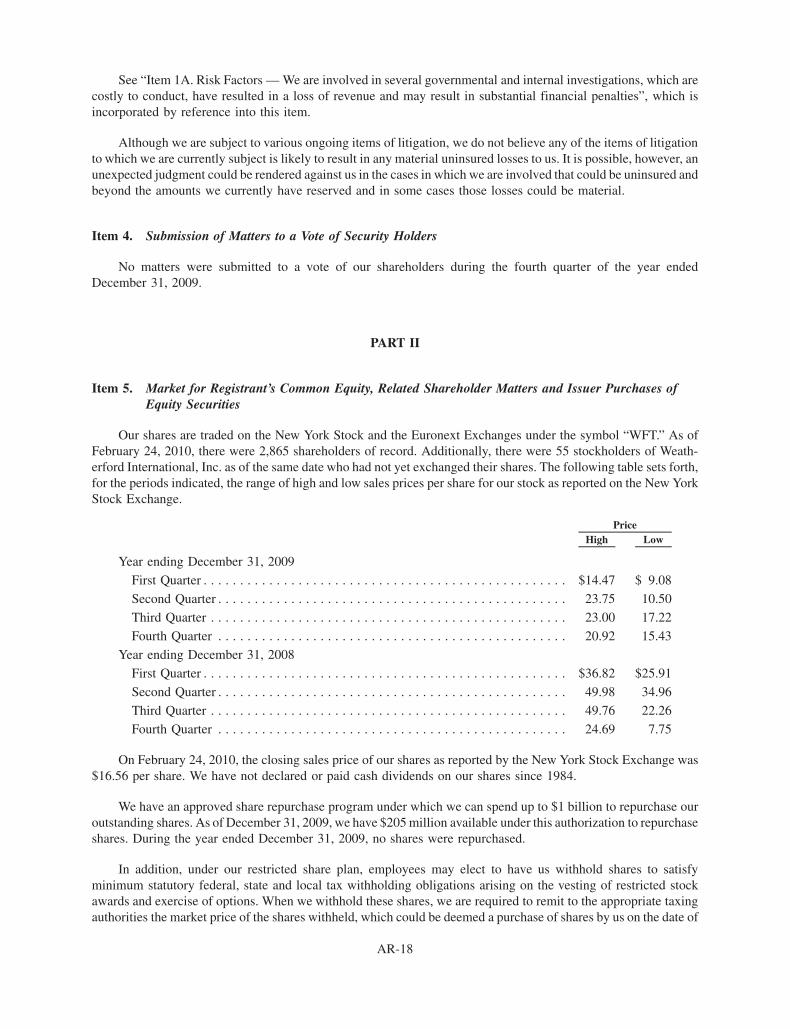
See “Item 1A. Risk Factors — We are involved in several governmental and internal investigations, which arecostly to conduct, have resulted in a loss of revenue and may result in substantial financial penalties”, which isincorporated by reference into this item.
Although we are subject to various ongoing items of litigation, we do not believe any of the items of litigationto which we are currently subject is likely to result in any material uninsured losses to us. It is possible, however, anunexpected judgment could be rendered against us in the cases in which we are involved that could be uninsured andbeyond the amounts we currently have reserved and in some cases those losses could be material.
Item 4. Submission of Matters to a Vote of Security Holders
No matters were submitted to a vote of our shareholders during the fourth quarter of the year endedDecember 31, 2009.
PART II
Item 5. Market for Registrant’s Common Equity, Related Shareholder Matters and Issuer Purchases ofEquity Securities
Our shares are traded on the New York Stock and the Euronext Exchanges under the symbol “WFT.” As ofFebruary 24, 2010, there were 2,865 shareholders of record. Additionally, there were 55 stockholders of Weath-erford International, Inc. as of the same date who had not yet exchanged their shares. The following table sets forth,for the periods indicated, the range of high and low sales prices per share for our stock as reported on the New YorkStock Exchange.
High LowPrice
Year ending December 31, 2009
First Quarter . . . . . . . . . . . . . . . . . . . . . . . . . . . . . . . . . . . . . . . . . . . . . . . . . . $14.47 $ 9.08
Second Quarter . . . . . . . . . . . . . . . . . . . . . . . . . . . . . . . . . . . . . . . . . . . . . . . . 23.75 10.50
Third Quarter . . . . . . . . . . . . . . . . . . . . . . . . . . . . . . . . . . . . . . . . . . . . . . . . . 23.00 17.22
Fourth Quarter . . . . . . . . . . . . . . . . . . . . . . . . . . . . . . . . . . . . . . . . . . . . . . . . 20.92 15.43
Year ending December 31, 2008
First Quarter . . . . . . . . . . . . . . . . . . . . . . . . . . . . . . . . . . . . . . . . . . . . . . . . . . $36.82 $25.91
Second Quarter . . . . . . . . . . . . . . . . . . . . . . . . . . . . . . . . . . . . . . . . . . . . . . . . 49.98 34.96
Third Quarter . . . . . . . . . . . . . . . . . . . . . . . . . . . . . . . . . . . . . . . . . . . . . . . . . 49.76 22.26
Fourth Quarter . . . . . . . . . . . . . . . . . . . . . . . . . . . . . . . . . . . . . . . . . . . . . . . . 24.69 7.75
On February 24, 2010, the closing sales price of our shares as reported by the New York Stock Exchange was$16.56 per share. We have not declared or paid cash dividends on our shares since 1984.
We have an approved share repurchase program under which we can spend up to $1 billion to repurchase ouroutstanding shares. As of December 31, 2009, we have $205 million available under this authorization to repurchaseshares. During the year ended December 31, 2009, no shares were repurchased.
In addition, under our restricted share plan, employees may elect to have us withhold shares to satisfyminimum statutory federal, state and local tax withholding obligations arising on the vesting of restricted stockawards and exercise of options. When we withhold these shares, we are required to remit to the appropriate taxingauthorities the market price of the shares withheld, which could be deemed a purchase of shares by us on the date of
AR-18
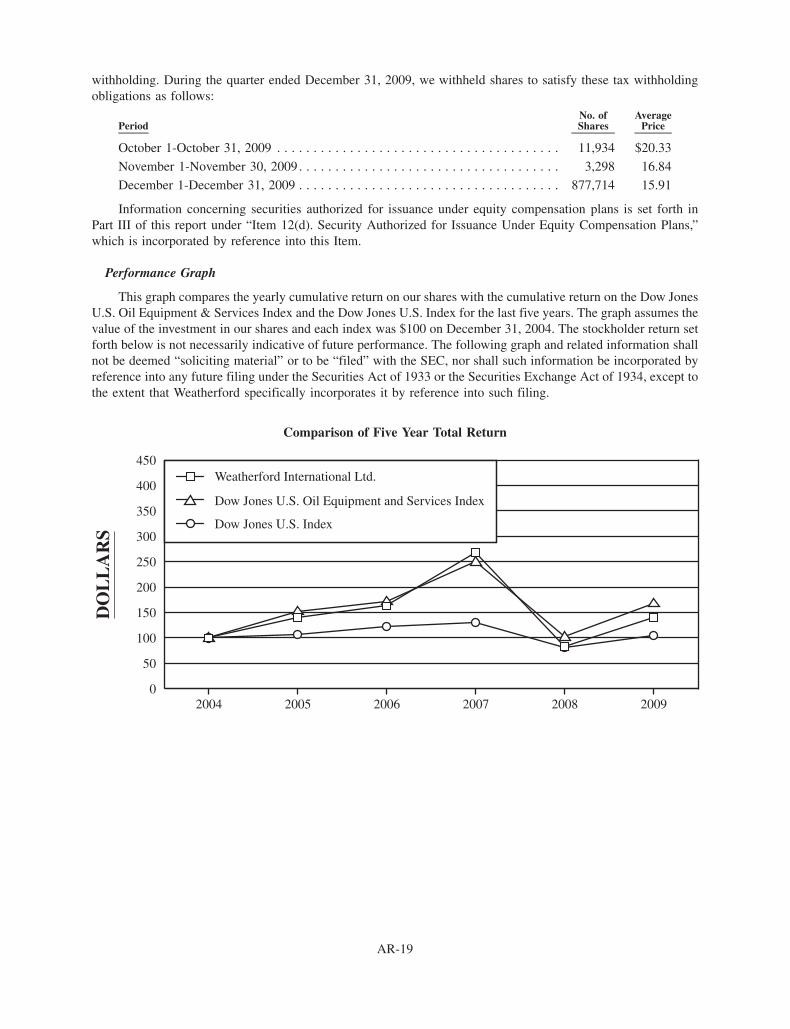
withholding. During the quarter ended December 31, 2009, we withheld shares to satisfy these tax withholdingobligations as follows:
PeriodNo. ofShares
AveragePrice
October 1-October 31, 2009 . . . . . . . . . . . . . . . . . . . . . . . . . . . . . . . . . . . . . . . 11,934 $20.33
November 1-November 30, 2009. . . . . . . . . . . . . . . . . . . . . . . . . . . . . . . . . . . . 3,298 16.84
December 1-December 31, 2009 . . . . . . . . . . . . . . . . . . . . . . . . . . . . . . . . . . . . 877,714 15.91
Information concerning securities authorized for issuance under equity compensation plans is set forth inPart III of this report under “Item 12(d). Security Authorized for Issuance Under Equity Compensation Plans,”which is incorporated by reference into this Item.
Performance Graph
This graph compares the yearly cumulative return on our shares with the cumulative return on the Dow JonesU.S. Oil Equipment & Services Index and the Dow Jones U.S. Index for the last five years. The graph assumes thevalue of the investment in our shares and each index was $100 on December 31, 2004. The stockholder return setforth below is not necessarily indicative of future performance. The following graph and related information shallnot be deemed “soliciting material” or to be “filed” with the SEC, nor shall such information be incorporated byreference into any future filing under the Securities Act of 1933 or the Securities Exchange Act of 1934, except tothe extent that Weatherford specifically incorporates it by reference into such filing.
Comparison of Five Year Total Return
200920082007200620052004
DO
LL
AR
S
Weatherford International Ltd.
Dow Jones U.S. Oil Equipment and Services Index
Dow Jones U.S. Index
0
50
100
150
200
250
300
350
400
450
AR-19
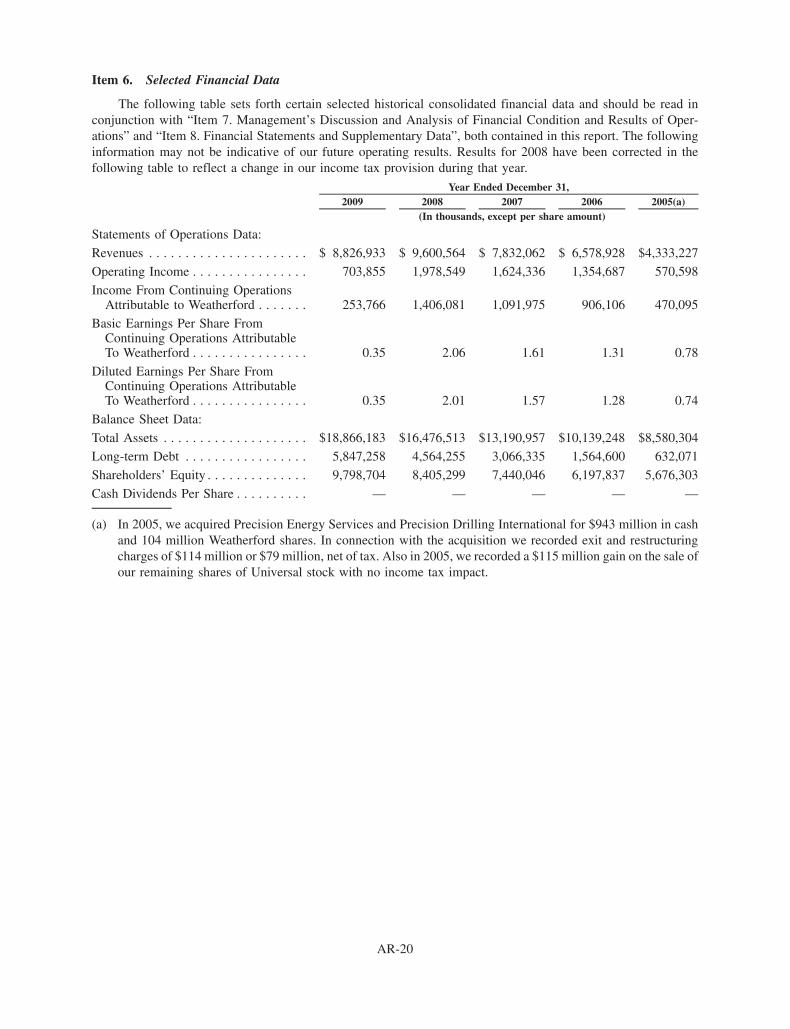
Item 6. Selected Financial Data
The following table sets forth certain selected historical consolidated financial data and should be read inconjunction with “Item 7. Management’s Discussion and Analysis of Financial Condition and Results of Oper-ations” and “Item 8. Financial Statements and Supplementary Data”, both contained in this report. The followinginformation may not be indicative of our future operating results. Results for 2008 have been corrected in thefollowing table to reflect a change in our income tax provision during that year.
2009 2008 2007 2006 2005(a)Year Ended December 31,
(In thousands, except per share amount)
Statements of Operations Data:
Revenues . . . . . . . . . . . . . . . . . . . . . . $ 8,826,933 $ 9,600,564 $ 7,832,062 $ 6,578,928 $4,333,227
Operating Income . . . . . . . . . . . . . . . . 703,855 1,978,549 1,624,336 1,354,687 570,598Income From Continuing Operations
Attributable to Weatherford . . . . . . . 253,766 1,406,081 1,091,975 906,106 470,095Basic Earnings Per Share From
Continuing Operations AttributableTo Weatherford . . . . . . . . . . . . . . . . 0.35 2.06 1.61 1.31 0.78
Diluted Earnings Per Share FromContinuing Operations AttributableTo Weatherford . . . . . . . . . . . . . . . . 0.35 2.01 1.57 1.28 0.74
Balance Sheet Data:
Total Assets . . . . . . . . . . . . . . . . . . . . $18,866,183 $16,476,513 $13,190,957 $10,139,248 $8,580,304Long-term Debt . . . . . . . . . . . . . . . . . 5,847,258 4,564,255 3,066,335 1,564,600 632,071
Shareholders’ Equity . . . . . . . . . . . . . . 9,798,704 8,405,299 7,440,046 6,197,837 5,676,303
Cash Dividends Per Share . . . . . . . . . . — — — — —
(a) In 2005, we acquired Precision Energy Services and Precision Drilling International for $943 million in cashand 104 million Weatherford shares. In connection with the acquisition we recorded exit and restructuringcharges of $114 million or $79 million, net of tax. Also in 2005, we recorded a $115 million gain on the sale ofour remaining shares of Universal stock with no income tax impact.
AR-20

Item 7. Management’s Discussion and Analysis of Financial Condition and Results of Operations
Our Management’s Discussion and Analysis of Financial Condition and Results of Operations (“MD&A”)begins with an executive overview which provides a general description of our company today, a synopsis ofindustry market trends, insight into management’s perspective of the opportunities and challenges we face and ouroutlook for 2010. Next, we analyze the results of our operations for the last three years, including the trends in ourbusiness. Then we review our cash flows and liquidity, capital resources and contractual commitments. Weconclude with an overview of our critical accounting judgments and estimates and a summary of recently issuedaccounting pronouncements.
The “Company,” “we”, “us” and “our” refer to Weatherford International Ltd., a Swiss joint stock corporation,or, prior to February 26, 2009, to Weatherford International Ltd., a Bermuda exempted company, which, as of thatdate, became a direct, wholly owned subsidiary of Weatherford International Ltd., a Swiss joint stock corporation,in either case on a consolidated basis.
The following discussion should be read in conjunction with our Consolidated Financial Statements and Notesthereto included in “Item 8. Financial Statements and Supplementary Data.” Our discussion includes variousforward-looking statements about our markets, the demand for our products and services and our future results.These statements are based on certain assumptions we consider reasonable. For information about these assump-tions, you should refer to the section entitled “Item 1. Business — Forward-Looking Statements.”
Overview
General
We provide equipment and services used for drilling, completion and production of oil and natural gas wellsthroughout the world. We conduct operations in approximately 100 countries and have service and sales locations innearly all of the oil and natural gas producing regions in the world. Our product offerings can be grouped into tenservice lines: 1) drilling services; 2) artificial lift systems; 3) well construction; 4) completion systems; 5) integrateddrilling; 6) drilling tools: 7) re-entry and fishing; 8) stimulation and chemicals services; 9) wireline and evaluationservices; and 10) pipeline and specialty services.
Our operational performance is segmented and reviewed on a geographic basis and we report the followingregions as separate, distinct reporting segments (1) North America, (2) Latin America, (3) Europe/West Africa/FSUand (4) Middle East/North Africa/Asia.
In July 2009, we acquired the Oilfield Services Division (“OFS”) of TNK-BP for 24.3 million shares valued atapproximately $450 million plus contingent and other consideration. In this transaction, we acquired drilling, wellworkover and cementing services operations in West Siberia, East Siberia and the Volga-Urals region.
AR-21
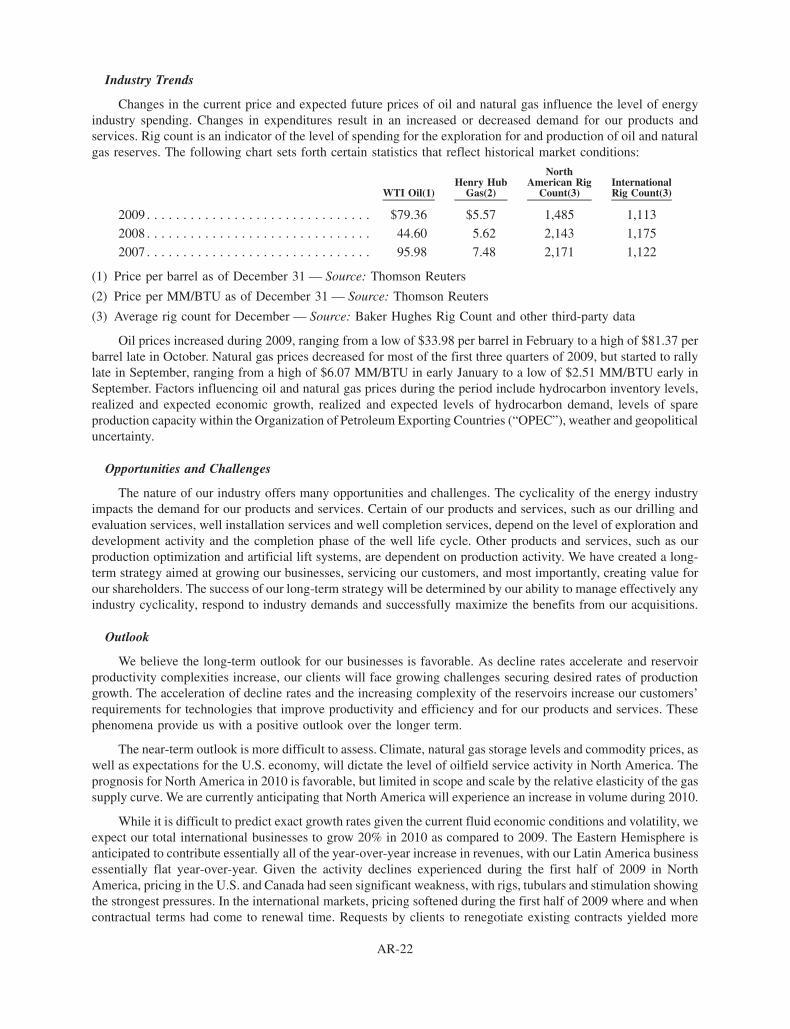
Industry Trends
Changes in the current price and expected future prices of oil and natural gas influence the level of energyindustry spending. Changes in expenditures result in an increased or decreased demand for our products andservices. Rig count is an indicator of the level of spending for the exploration for and production of oil and naturalgas reserves. The following chart sets forth certain statistics that reflect historical market conditions:
WTI Oil(1)Henry Hub
Gas(2)
NorthAmerican Rig
Count(3)InternationalRig Count(3)
2009 . . . . . . . . . . . . . . . . . . . . . . . . . . . . . . . $79.36 $5.57 1,485 1,113
2008 . . . . . . . . . . . . . . . . . . . . . . . . . . . . . . . 44.60 5.62 2,143 1,175
2007 . . . . . . . . . . . . . . . . . . . . . . . . . . . . . . . 95.98 7.48 2,171 1,122
(1) Price per barrel as of December 31 — Source: Thomson Reuters
(2) Price per MM/BTU as of December 31 — Source: Thomson Reuters
(3) Average rig count for December — Source: Baker Hughes Rig Count and other third-party data
Oil prices increased during 2009, ranging from a low of $33.98 per barrel in February to a high of $81.37 perbarrel late in October. Natural gas prices decreased for most of the first three quarters of 2009, but started to rallylate in September, ranging from a high of $6.07 MM/BTU in early January to a low of $2.51 MM/BTU early inSeptember. Factors influencing oil and natural gas prices during the period include hydrocarbon inventory levels,realized and expected economic growth, realized and expected levels of hydrocarbon demand, levels of spareproduction capacity within the Organization of Petroleum Exporting Countries (“OPEC”), weather and geopoliticaluncertainty.
Opportunities and Challenges
The nature of our industry offers many opportunities and challenges. The cyclicality of the energy industryimpacts the demand for our products and services. Certain of our products and services, such as our drilling andevaluation services, well installation services and well completion services, depend on the level of exploration anddevelopment activity and the completion phase of the well life cycle. Other products and services, such as ourproduction optimization and artificial lift systems, are dependent on production activity. We have created a long-term strategy aimed at growing our businesses, servicing our customers, and most importantly, creating value forour shareholders. The success of our long-term strategy will be determined by our ability to manage effectively anyindustry cyclicality, respond to industry demands and successfully maximize the benefits from our acquisitions.
Outlook
We believe the long-term outlook for our businesses is favorable. As decline rates accelerate and reservoirproductivity complexities increase, our clients will face growing challenges securing desired rates of productiongrowth. The acceleration of decline rates and the increasing complexity of the reservoirs increase our customers’requirements for technologies that improve productivity and efficiency and for our products and services. Thesephenomena provide us with a positive outlook over the longer term.
The near-term outlook is more difficult to assess. Climate, natural gas storage levels and commodity prices, aswell as expectations for the U.S. economy, will dictate the level of oilfield service activity in North America. Theprognosis for North America in 2010 is favorable, but limited in scope and scale by the relative elasticity of the gassupply curve. We are currently anticipating that North America will experience an increase in volume during 2010.
While it is difficult to predict exact growth rates given the current fluid economic conditions and volatility, weexpect our total international businesses to grow 20% in 2010 as compared to 2009. The Eastern Hemisphere isanticipated to contribute essentially all of the year-over-year increase in revenues, with our Latin America businessessentially flat year-over-year. Given the activity declines experienced during the first half of 2009 in NorthAmerica, pricing in the U.S. and Canada had seen significant weakness, with rigs, tubulars and stimulation showingthe strongest pressures. In the international markets, pricing softened during the first half of 2009 where and whencontractual terms had come to renewal time. Requests by clients to renegotiate existing contracts yielded more
AR-22

modest price erosion with significant differences between international regions. On a global basis, we believe thatthese pricing moves are now behind us.
Overall, the level of improvements for our businesses for 2010 will continue to depend heavily on volumeincreases and our ability to further penetrate existing markets with our younger technologies as well as tosuccessfully introduce these technologies to new markets. In addition, our ability to continue to grow our businessaggressively will rely on our continued demonstration of a high level of operational efficacy for our clients onproject management opportunities. The recruitment, training and retention of personnel will also be a critical factorin growing our businesses. The continued strength of the industry will be highly dependent on many externalfactors, such as world economic and political conditions, member country quota compliance within OPEC andweather conditions, including the factors described above under “— Forward-Looking Statements”.
Results of Operations
The following charts contain selected financial data comparing our consolidated and segment results fromoperations for 2009, 2008 and 2007. Results for 2008 have been corrected in the following chart to reflect a changein our income tax provision during that year.
2009 2008 2007Year Ended December 31,
(In thousands, except percentages andper share data)
Revenues:
North America . . . . . . . . . . . . . . . . . . . . . . . . . . . . . . . . . . . . . . $2,765,707 $4,460,147 $3,937,456
Middle East/North Africa/Asia . . . . . . . . . . . . . . . . . . . . . . . . . . 2,368,118 2,391,520 1,823,769
Europe/West Africa/FSU . . . . . . . . . . . . . . . . . . . . . . . . . . . . . . . 1,616,460 1,539,190 1,188,519
Latin America . . . . . . . . . . . . . . . . . . . . . . . . . . . . . . . . . . . . . . 2,076,648 1,209,707 882,318
8,826,933 9,600,564 7,832,062
Operating Income (Expense):
North America . . . . . . . . . . . . . . . . . . . . . . . . . . . . . . . . . . . . . . 197,211 1,125,199 1,013,088
Middle East/North Africa/Asia . . . . . . . . . . . . . . . . . . . . . . . . . . 441,974 561,012 416,263
Europe/West Africa/FSU . . . . . . . . . . . . . . . . . . . . . . . . . . . . . . . 251,991 382,772 293,846
Latin America . . . . . . . . . . . . . . . . . . . . . . . . . . . . . . . . . . . . . . 281,590 277,094 203,211
Research and Development . . . . . . . . . . . . . . . . . . . . . . . . . . . . . (194,650) (192,659) (169,317)
Corporate . . . . . . . . . . . . . . . . . . . . . . . . . . . . . . . . . . . . . . . . . . (173,695) (135,012) (101,968)
Exit and Restructuring . . . . . . . . . . . . . . . . . . . . . . . . . . . . . . . . (100,566) (39,857) (30,787)
703,855 1,978,549 1,624,336
Interest Expense, Net . . . . . . . . . . . . . . . . . . . . . . . . . . . . . . . . . . . (366,748) (243,679) (171,281)
Other, Net . . . . . . . . . . . . . . . . . . . . . . . . . . . . . . . . . . . . . . . . . . . (37,633) (44,956) (8,569)
Effective Tax Rate . . . . . . . . . . . . . . . . . . . . . . . . . . . . . . . . . . . . . 6.5% 14.8% 23.0%
Net Income from Continuing Operations Per Diluted Share . . . . . . . $ 0.35 $ 2.01 $ 1.57
Loss from Discontinued Operation per Diluted Share . . . . . . . . . . . . — (0.02) (0.03)
Net Income per Diluted Share . . . . . . . . . . . . . . . . . . . . . . . . . . . . . $ 0.35 $ 1.99 $ 1.54
Depreciation and Amortization . . . . . . . . . . . . . . . . . . . . . . . . . . . . 906,697 731,808 606,226
AR-23
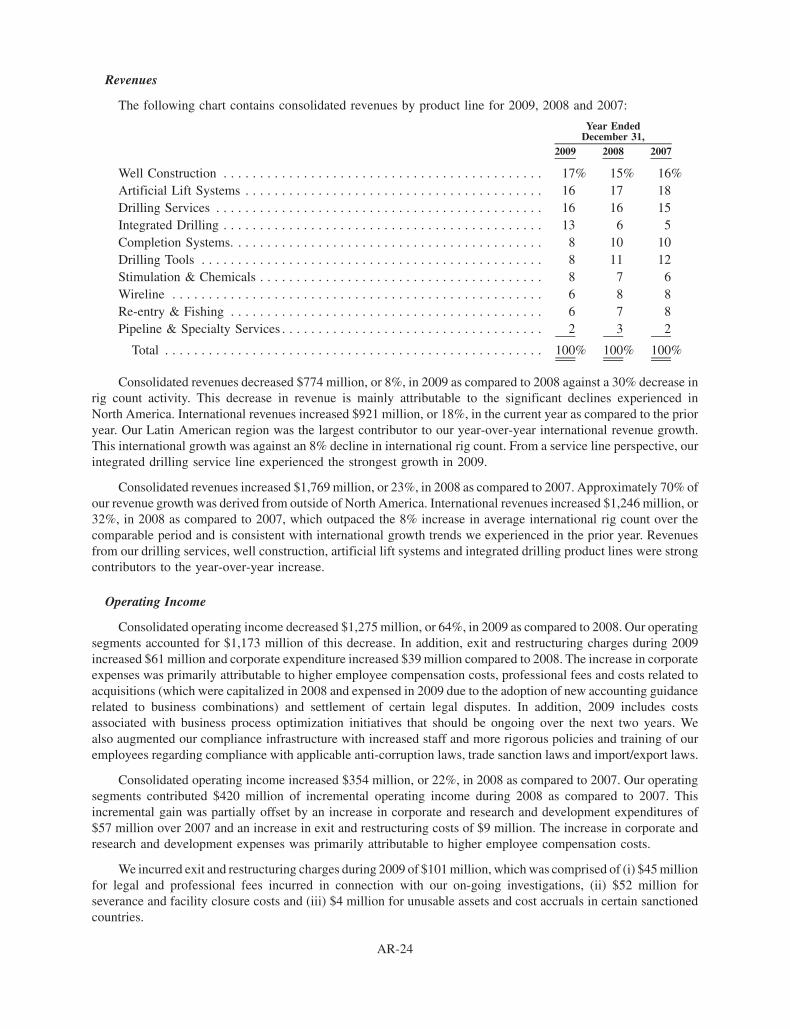
Revenues
The following chart contains consolidated revenues by product line for 2009, 2008 and 2007:
2009 2008 2007
Year EndedDecember 31,
Well Construction . . . . . . . . . . . . . . . . . . . . . . . . . . . . . . . . . . . . . . . . . . . . 17% 15% 16%Artificial Lift Systems . . . . . . . . . . . . . . . . . . . . . . . . . . . . . . . . . . . . . . . . . 16 17 18Drilling Services . . . . . . . . . . . . . . . . . . . . . . . . . . . . . . . . . . . . . . . . . . . . . 16 16 15Integrated Drilling . . . . . . . . . . . . . . . . . . . . . . . . . . . . . . . . . . . . . . . . . . . . 13 6 5Completion Systems. . . . . . . . . . . . . . . . . . . . . . . . . . . . . . . . . . . . . . . . . . . 8 10 10Drilling Tools . . . . . . . . . . . . . . . . . . . . . . . . . . . . . . . . . . . . . . . . . . . . . . . 8 11 12Stimulation & Chemicals . . . . . . . . . . . . . . . . . . . . . . . . . . . . . . . . . . . . . . . 8 7 6Wireline . . . . . . . . . . . . . . . . . . . . . . . . . . . . . . . . . . . . . . . . . . . . . . . . . . . 6 8 8Re-entry & Fishing . . . . . . . . . . . . . . . . . . . . . . . . . . . . . . . . . . . . . . . . . . . 6 7 8Pipeline & Specialty Services . . . . . . . . . . . . . . . . . . . . . . . . . . . . . . . . . . . . 2 3 2
Total . . . . . . . . . . . . . . . . . . . . . . . . . . . . . . . . . . . . . . . . . . . . . . . . . . . . 100% 100% 100%
Consolidated revenues decreased $774 million, or 8%, in 2009 as compared to 2008 against a 30% decrease inrig count activity. This decrease in revenue is mainly attributable to the significant declines experienced inNorth America. International revenues increased $921 million, or 18%, in the current year as compared to the prioryear. Our Latin American region was the largest contributor to our year-over-year international revenue growth.This international growth was against an 8% decline in international rig count. From a service line perspective, ourintegrated drilling service line experienced the strongest growth in 2009.
Consolidated revenues increased $1,769 million, or 23%, in 2008 as compared to 2007. Approximately 70% ofour revenue growth was derived from outside of North America. International revenues increased $1,246 million, or32%, in 2008 as compared to 2007, which outpaced the 8% increase in average international rig count over thecomparable period and is consistent with international growth trends we experienced in the prior year. Revenuesfrom our drilling services, well construction, artificial lift systems and integrated drilling product lines were strongcontributors to the year-over-year increase.
Operating Income
Consolidated operating income decreased $1,275 million, or 64%, in 2009 as compared to 2008. Our operatingsegments accounted for $1,173 million of this decrease. In addition, exit and restructuring charges during 2009increased $61 million and corporate expenditure increased $39 million compared to 2008. The increase in corporateexpenses was primarily attributable to higher employee compensation costs, professional fees and costs related toacquisitions (which were capitalized in 2008 and expensed in 2009 due to the adoption of new accounting guidancerelated to business combinations) and settlement of certain legal disputes. In addition, 2009 includes costsassociated with business process optimization initiatives that should be ongoing over the next two years. Wealso augmented our compliance infrastructure with increased staff and more rigorous policies and training of ouremployees regarding compliance with applicable anti-corruption laws, trade sanction laws and import/export laws.
Consolidated operating income increased $354 million, or 22%, in 2008 as compared to 2007. Our operatingsegments contributed $420 million of incremental operating income during 2008 as compared to 2007. Thisincremental gain was partially offset by an increase in corporate and research and development expenditures of$57 million over 2007 and an increase in exit and restructuring costs of $9 million. The increase in corporate andresearch and development expenses was primarily attributable to higher employee compensation costs.
We incurred exit and restructuring charges during 2009 of $101 million, which was comprised of (i) $45 millionfor legal and professional fees incurred in connection with our on-going investigations, (ii) $52 million forseverance and facility closure costs and (iii) $4 million for unusable assets and cost accruals in certain sanctionedcountries.
AR-24
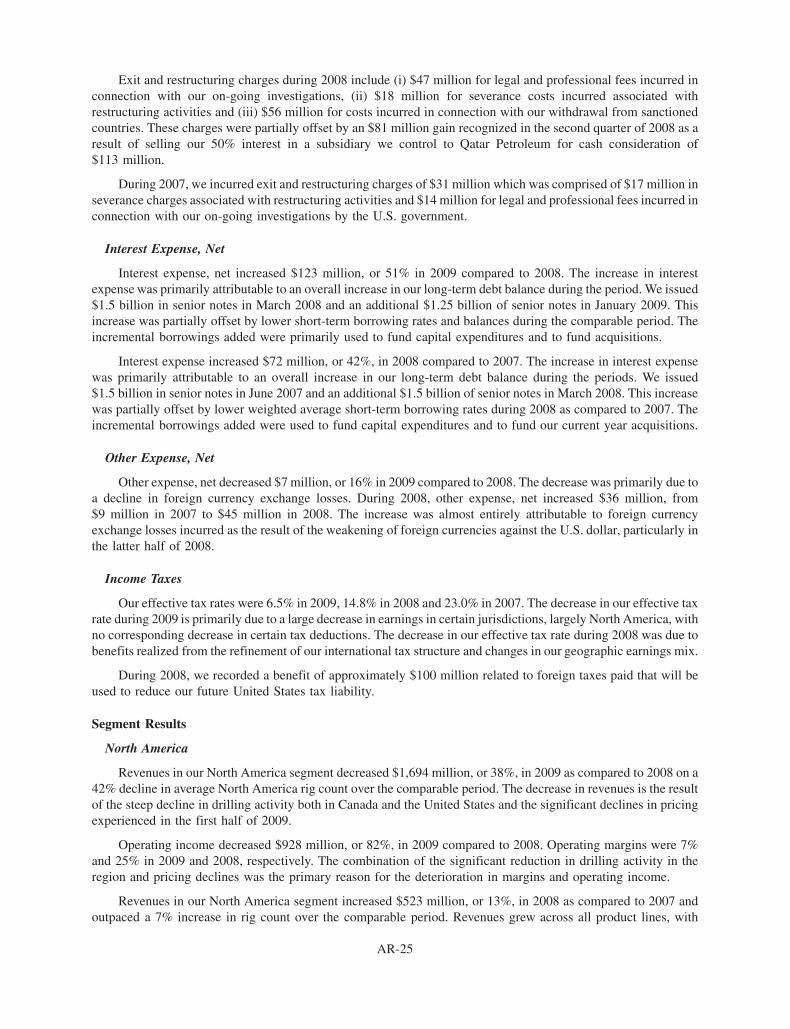
Exit and restructuring charges during 2008 include (i) $47 million for legal and professional fees incurred inconnection with our on-going investigations, (ii) $18 million for severance costs incurred associated withrestructuring activities and (iii) $56 million for costs incurred in connection with our withdrawal from sanctionedcountries. These charges were partially offset by an $81 million gain recognized in the second quarter of 2008 as aresult of selling our 50% interest in a subsidiary we control to Qatar Petroleum for cash consideration of$113 million.
During 2007, we incurred exit and restructuring charges of $31 million which was comprised of $17 million inseverance charges associated with restructuring activities and $14 million for legal and professional fees incurred inconnection with our on-going investigations by the U.S. government.
Interest Expense, Net
Interest expense, net increased $123 million, or 51% in 2009 compared to 2008. The increase in interestexpense was primarily attributable to an overall increase in our long-term debt balance during the period. We issued$1.5 billion in senior notes in March 2008 and an additional $1.25 billion of senior notes in January 2009. Thisincrease was partially offset by lower short-term borrowing rates and balances during the comparable period. Theincremental borrowings added were primarily used to fund capital expenditures and to fund acquisitions.
Interest expense increased $72 million, or 42%, in 2008 compared to 2007. The increase in interest expensewas primarily attributable to an overall increase in our long-term debt balance during the periods. We issued$1.5 billion in senior notes in June 2007 and an additional $1.5 billion of senior notes in March 2008. This increasewas partially offset by lower weighted average short-term borrowing rates during 2008 as compared to 2007. Theincremental borrowings added were used to fund capital expenditures and to fund our current year acquisitions.
Other Expense, Net
Other expense, net decreased $7 million, or 16% in 2009 compared to 2008. The decrease was primarily due toa decline in foreign currency exchange losses. During 2008, other expense, net increased $36 million, from$9 million in 2007 to $45 million in 2008. The increase was almost entirely attributable to foreign currencyexchange losses incurred as the result of the weakening of foreign currencies against the U.S. dollar, particularly inthe latter half of 2008.
Income Taxes
Our effective tax rates were 6.5% in 2009, 14.8% in 2008 and 23.0% in 2007. The decrease in our effective taxrate during 2009 is primarily due to a large decrease in earnings in certain jurisdictions, largely North America, withno corresponding decrease in certain tax deductions. The decrease in our effective tax rate during 2008 was due tobenefits realized from the refinement of our international tax structure and changes in our geographic earnings mix.
During 2008, we recorded a benefit of approximately $100 million related to foreign taxes paid that will beused to reduce our future United States tax liability.
Segment Results
North America
Revenues in our North America segment decreased $1,694 million, or 38%, in 2009 as compared to 2008 on a42% decline in average North America rig count over the comparable period. The decrease in revenues is the resultof the steep decline in drilling activity both in Canada and the United States and the significant declines in pricingexperienced in the first half of 2009.
Operating income decreased $928 million, or 82%, in 2009 compared to 2008. Operating margins were 7%and 25% in 2009 and 2008, respectively. The combination of the significant reduction in drilling activity in theregion and pricing declines was the primary reason for the deterioration in margins and operating income.
Revenues in our North America segment increased $523 million, or 13%, in 2008 as compared to 2007 andoutpaced a 7% increase in rig count over the comparable period. Revenues grew across all product lines, with
AR-25

artificial lift systems, drilling services and stimulation & chemicals product lines being the strongest contributors tothe year-over-year increase.
Operating income increased $112 million, or 11%, from $1,013 million in 2007 to $1,125 million in 2008.Operating margins declined slightly to 25% in 2008 compared to 26% in 2007.
Middle East/North Africa/Asia
Middle East/North Africa/Asia revenues decreased $23 million, or 1%, in 2009 as compared to 2008 on a 6%decline in rig count over the comparable period. Integrated drilling was the strongest performer from a service lineperspective.
Operating income decreased $119 million, or 21%, during 2009 compared to the prior year. Operating marginswere 19% and 23% in 2009 and 2008, respectively. The deterioration in operating income and margins during 2009was primarily the result of delays in startups and deliveries as well as pricing declines experienced in the region.
Revenues in our Middle East/North Africa/Asia segment increased $568 million, or 31%, in 2008 as comparedto 2007. This region contributed approximately 32% of our total revenue growth for 2008 and exceeded the averagerig count increase of 6% for this region over the comparable period. Revenues from our drilling services andintegrated drilling product lines were among the strongest contributors to the year-over-year increase.
Operating income increased $145 million, or 35%, from $416 million in 2007 to $561 million in 2008.Operating margins were 23% in both 2008 and 2007.
Europe/West Africa/FSU
Revenues in our Europe/West Africa/FSU segment increased $77 million, or 5%, in 2009 compared to 2008against a 16% rig count decrease over the comparable period. Our acquisition of OFS in July 2009 contributedapproximately $180 million in revenues during the year. This increase was partially offset by activity declinesexperienced in the region. Integrated drilling and stimulation and chemicals were the strongest performers from aservice line perspective.
Operating income decreased $131 million, or 34%, during the current year compared to the prior year.Operating margins were 16% in 2009 and 25% in 2008. The current year’s operating income includes $21 millionrelated to a gain recorded in connection with the revaluation of contingent consideration included as part of theacquisition of OFS. This gain was offset by activity and pricing declines experienced in the region.
Revenues in our Europe/West Africa/FSU segment increased $351 million, or 30%, in 2008 as compared to2007. The region contributed approximately 20% of our total revenue growth for 2008 and exceeded the 20%increase in average rig count in the region over the comparable period. Revenues from our well construction anddrilling services product lines were the strongest contributors to the year-over-year increase.
Operating income increased $89 million, or 30%, from $294 million in 2007 to $383 million in 2008.Operating margins were 25% in both 2008 and 2007.
Latin America
Revenues in our Latin America segment increased $867 million, or 71%, in 2009 as compared to the prior yearagainst an average rig count decrease of 7% over the comparable period. Mexico was the strongest contributor torevenue growth. From a service line perspective, our integrated drilling and stimulation and chemicals service linesexperienced the strongest growth in 2009.
Operating income increased $5 million, or 2%, during 2009 as compared to 2008 and operating marginsdecreased from 23% in 2008 to 14% in 2009. A significant change in product mix, together with unforeseen delays,shifts in customer focus and market declines in Venezuela, Argentina and Colombia negatively impacted margins.In addition, weather issues and a reduction in gas activity in Mexico contributed to the decline in margins.
Revenues in our Latin America segment increased $327 million, or 37%, in 2008 as compared to 2007. Theregion contributed approximately 19% of our total revenue growth for 2008 and outpaced the 8% increase in Latin
AR-26

American rig count over the comparable period. Revenues from our drilling services, completion systems, artificiallift systems and integrated drilling service lines were the strongest contributors to the year-over-year increase.
Operating income increased $74 million, or 36%, from $203 million in 2007 to $277 million in 2008.Operating margins were 23% in both 2008 and 2007.
Discontinued Operation
We finalized the divestiture of our discontinued operation consisting of our oil and gas development andproduction company during the second quarter of 2008. We recorded a gain of $11 million, net of taxes, inconnection with the finalization of the divestiture. On a year-to-date basis, we had a loss from our discontinuedoperation, net of taxes, of $13 million, which included approximately $21 million incurred in connection with thesettlement of a legal dispute regarding the business. This loss was partially offset by the gain recognized in thesecond quarter of 2008.
Equity Investment Acquisition
We acquired a 33% ownership interest in Premier Business Solutions (“PBS”) in June 2007 for approximately$330 million. PBS conducts business in Russia and is an electric submersible pump manufacturer. In January 2008,we sold our electrical submersible pumps product line to PBS and received a combination of cash and an additionalequity investment in PBS in consideration of the sale. This transaction increased our ownership percentage toapproximately 40%. In September 2009, we converted a $38 million note plus accrued interest due from PBS for anadditional equity investment. Our ownership percentage was unchanged as the other joint venture partner alsoconverted its notes receivable for an additional equity investment.
Liquidity and Capital Resources
Sources of Liquidity
Our sources of liquidity include current cash and cash equivalent balances, cash generated from operations,and committed availabilities under bank lines of credit. We also historically have accessed banks for short-termloans from uncommitted borrowing arrangements and the capital markets with debt, equity and convertibleofferings.
Committed Borrowing Facilities
We maintain various revolving credit facilities with syndicates of banks that can be used for a combination ofborrowings, support for our commercial paper program and issuances of letters of credit. At December 31, 2009,these facilities allow for an aggregate availability of $1.8 billion and mature in May 2011. The weighted averageinterest rate on outstanding borrowings of these facilities at December 31, 2009, was 1.3%.
Our committed borrowing facilities require us to maintain a debt-to-capitalization ratio of less than 60% andcontains other covenants and representations customary for an investment-grade commercial credit. Our debt-to-ca-pitalization ratio was 41% at December 31, 2009, which is in compliance with these covenants. The following is arecap of our availability under our committed borrowing facilities at December 31, 2009 (in millions):
Facilities . . . . . . . . . . . . . . . . . . . . . . . . . . . . . . . . . . . . . . . . . . . . . . . . . . . . . . . . . . . . . . $1,750
Less uses of facility:
Amount drawn . . . . . . . . . . . . . . . . . . . . . . . . . . . . . . . . . . . . . . . . . . . . . . . . . . . . . . . . . . 799
Commercial paper . . . . . . . . . . . . . . . . . . . . . . . . . . . . . . . . . . . . . . . . . . . . . . . . . . . . . . . —
Letters of credit . . . . . . . . . . . . . . . . . . . . . . . . . . . . . . . . . . . . . . . . . . . . . . . . . . . . . . . . . 72
Availability . . . . . . . . . . . . . . . . . . . . . . . . . . . . . . . . . . . . . . . . . . . . . . . . . . . . . . . . . . . . $ 879
AR-27
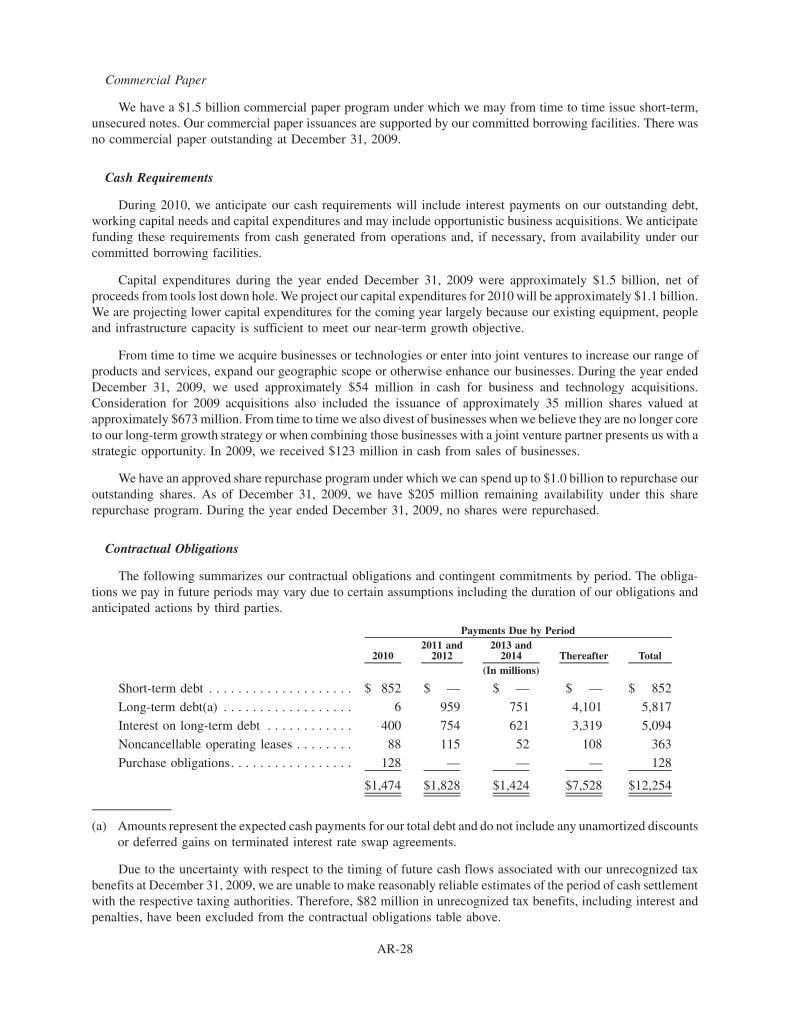
Commercial Paper
We have a $1.5 billion commercial paper program under which we may from time to time issue short-term,unsecured notes. Our commercial paper issuances are supported by our committed borrowing facilities. There wasno commercial paper outstanding at December 31, 2009.
Cash Requirements
During 2010, we anticipate our cash requirements will include interest payments on our outstanding debt,working capital needs and capital expenditures and may include opportunistic business acquisitions. We anticipatefunding these requirements from cash generated from operations and, if necessary, from availability under ourcommitted borrowing facilities.
Capital expenditures during the year ended December 31, 2009 were approximately $1.5 billion, net ofproceeds from tools lost down hole. We project our capital expenditures for 2010 will be approximately $1.1 billion.We are projecting lower capital expenditures for the coming year largely because our existing equipment, peopleand infrastructure capacity is sufficient to meet our near-term growth objective.
From time to time we acquire businesses or technologies or enter into joint ventures to increase our range ofproducts and services, expand our geographic scope or otherwise enhance our businesses. During the year endedDecember 31, 2009, we used approximately $54 million in cash for business and technology acquisitions.Consideration for 2009 acquisitions also included the issuance of approximately 35 million shares valued atapproximately $673 million. From time to time we also divest of businesses when we believe they are no longer coreto our long-term growth strategy or when combining those businesses with a joint venture partner presents us with astrategic opportunity. In 2009, we received $123 million in cash from sales of businesses.
We have an approved share repurchase program under which we can spend up to $1.0 billion to repurchase ouroutstanding shares. As of December 31, 2009, we have $205 million remaining availability under this sharerepurchase program. During the year ended December 31, 2009, no shares were repurchased.
Contractual Obligations
The following summarizes our contractual obligations and contingent commitments by period. The obliga-tions we pay in future periods may vary due to certain assumptions including the duration of our obligations andanticipated actions by third parties.
20102011 and
20122013 and
2014 Thereafter Total
Payments Due by Period
(In millions)
Short-term debt . . . . . . . . . . . . . . . . . . . . $ 852 $ — $ — $ — $ 852
Long-term debt(a) . . . . . . . . . . . . . . . . . . 6 959 751 4,101 5,817
Interest on long-term debt . . . . . . . . . . . . 400 754 621 3,319 5,094
Noncancellable operating leases . . . . . . . . 88 115 52 108 363
Purchase obligations. . . . . . . . . . . . . . . . . 128 — — — 128
$1,474 $1,828 $1,424 $7,528 $12,254
(a) Amounts represent the expected cash payments for our total debt and do not include any unamortized discountsor deferred gains on terminated interest rate swap agreements.
Due to the uncertainty with respect to the timing of future cash flows associated with our unrecognized taxbenefits at December 31, 2009, we are unable to make reasonably reliable estimates of the period of cash settlementwith the respective taxing authorities. Therefore, $82 million in unrecognized tax benefits, including interest andpenalties, have been excluded from the contractual obligations table above.
AR-28
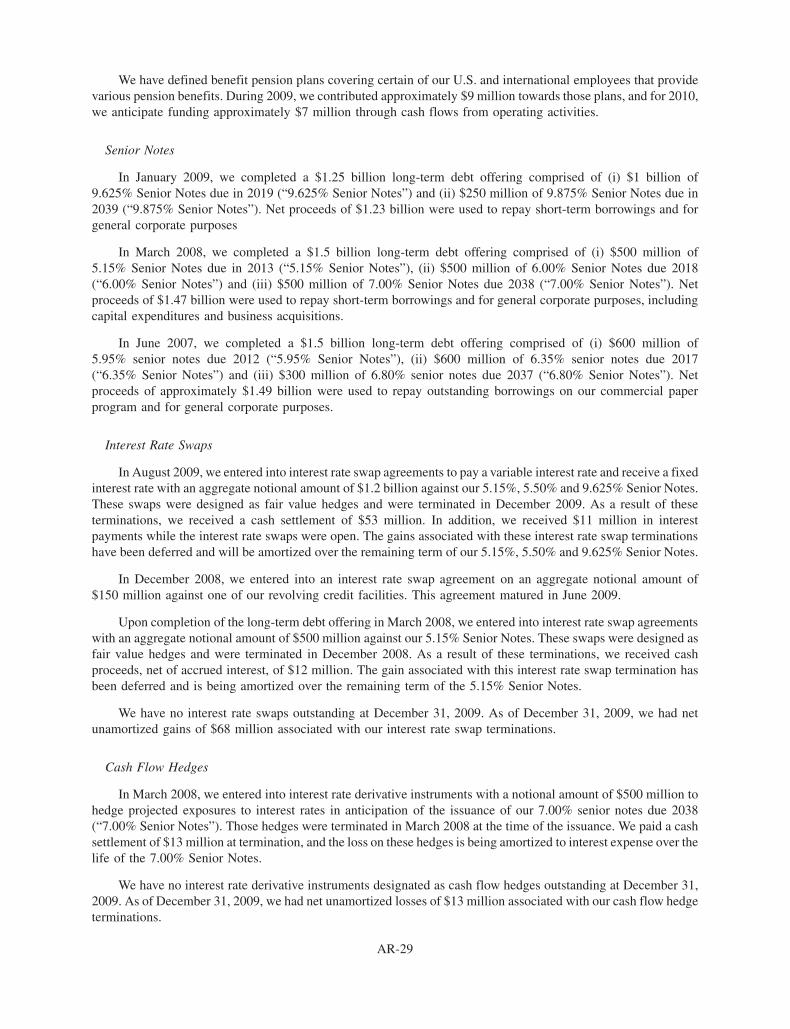
We have defined benefit pension plans covering certain of our U.S. and international employees that providevarious pension benefits. During 2009, we contributed approximately $9 million towards those plans, and for 2010,we anticipate funding approximately $7 million through cash flows from operating activities.
Senior Notes
In January 2009, we completed a $1.25 billion long-term debt offering comprised of (i) $1 billion of9.625% Senior Notes due in 2019 (“9.625% Senior Notes”) and (ii) $250 million of 9.875% Senior Notes due in2039 (“9.875% Senior Notes”). Net proceeds of $1.23 billion were used to repay short-term borrowings and forgeneral corporate purposes
In March 2008, we completed a $1.5 billion long-term debt offering comprised of (i) $500 million of5.15% Senior Notes due in 2013 (“5.15% Senior Notes”), (ii) $500 million of 6.00% Senior Notes due 2018(“6.00% Senior Notes”) and (iii) $500 million of 7.00% Senior Notes due 2038 (“7.00% Senior Notes”). Netproceeds of $1.47 billion were used to repay short-term borrowings and for general corporate purposes, includingcapital expenditures and business acquisitions.
In June 2007, we completed a $1.5 billion long-term debt offering comprised of (i) $600 million of5.95% senior notes due 2012 (“5.95% Senior Notes”), (ii) $600 million of 6.35% senior notes due 2017(“6.35% Senior Notes”) and (iii) $300 million of 6.80% senior notes due 2037 (“6.80% Senior Notes”). Netproceeds of approximately $1.49 billion were used to repay outstanding borrowings on our commercial paperprogram and for general corporate purposes.
Interest Rate Swaps
In August 2009, we entered into interest rate swap agreements to pay a variable interest rate and receive a fixedinterest rate with an aggregate notional amount of $1.2 billion against our 5.15%, 5.50% and 9.625% Senior Notes.These swaps were designed as fair value hedges and were terminated in December 2009. As a result of theseterminations, we received a cash settlement of $53 million. In addition, we received $11 million in interestpayments while the interest rate swaps were open. The gains associated with these interest rate swap terminationshave been deferred and will be amortized over the remaining term of our 5.15%, 5.50% and 9.625% Senior Notes.
In December 2008, we entered into an interest rate swap agreement on an aggregate notional amount of$150 million against one of our revolving credit facilities. This agreement matured in June 2009.
Upon completion of the long-term debt offering in March 2008, we entered into interest rate swap agreementswith an aggregate notional amount of $500 million against our 5.15% Senior Notes. These swaps were designed asfair value hedges and were terminated in December 2008. As a result of these terminations, we received cashproceeds, net of accrued interest, of $12 million. The gain associated with this interest rate swap termination hasbeen deferred and is being amortized over the remaining term of the 5.15% Senior Notes.
We have no interest rate swaps outstanding at December 31, 2009. As of December 31, 2009, we had netunamortized gains of $68 million associated with our interest rate swap terminations.
Cash Flow Hedges
In March 2008, we entered into interest rate derivative instruments with a notional amount of $500 million tohedge projected exposures to interest rates in anticipation of the issuance of our 7.00% senior notes due 2038(“7.00% Senior Notes”). Those hedges were terminated in March 2008 at the time of the issuance. We paid a cashsettlement of $13 million at termination, and the loss on these hedges is being amortized to interest expense over thelife of the 7.00% Senior Notes.
We have no interest rate derivative instruments designated as cash flow hedges outstanding at December 31,2009. As of December 31, 2009, we had net unamortized losses of $13 million associated with our cash flow hedgeterminations.
AR-29
Other Derivative Instruments
As of December 31, 2009 and 2008, we had several foreign currency forward and option contracts withnotional amounts aggregating $1,062 million and $503 million, respectively, which were entered into to hedgeexposure to currency fluctuations in various foreign currencies, including, but not limited to, the British poundsterling, the Canadian dollar, the euro and the Norwegian krone. The total estimated fair value of these contracts atDecember 31, 2009 resulted in a net liability of approximately $9 million and at December 31, 2008 resulted in aliability of approximately $2 million. These derivative instruments were not designated as hedges and the changesin fair value of the contracts are recorded each period in current earnings.
We have cross-currency swaps between the U.S. dollar and Canadian dollar to hedge certain exposures to theCanadian dollar. At December 31, 2009 and 2008, we had notional amounts outstanding of $263 million and$280 million, respectively. The total estimated fair value of these contracts at December 31, 2009 and 2008 resultedin a liability of $26 million and an asset of $1 million, respectively. These derivative instruments were notdesignated as hedges and the changes in fair value of the contracts are recorded each period in current earnings.
Warrants
We have outstanding warrants to purchase up to 12.9 million of our shares at a price of $15.00 per share. Thewarrants remain exercisable until February 28, 2012 and are subject to adjustment for changes in our capitalstructure or the issuance of dividends in cash, securities or property. Upon exercise by the holders, settlement mayoccur through physical delivery, net share settlement, net cash settlement or a combination of those methods. Thenet cash settlement option upon exercise is at our sole discretion.
Off Balance Sheet Arrangements
Guarantees
During the first quarter of 2009, we completed a transaction that changed our place of incorporation fromBermuda to Switzerland. A new Swiss corporation named Weatherford International Ltd. was formed and is nowthe ultimate parent (“Weatherford Switzerland”) of the Weatherford group and guarantees the obligations ofWeatherford International Ltd. incorporated in Bermuda (“Weatherford Bermuda”) and Weatherford International,Inc. incorporated in Delaware (“Weatherford Delaware”) noted below.
The following obligations of Weatherford Delaware were guaranteed by Weatherford Bermuda atDecember 31, 2009: (i) the 6.625% Senior Notes, (ii) the 5.95% Senior Notes, (iii) the 6.35% Senior Notesand (iv) the 6.80% Senior Notes.
The following obligations of Weatherford Bermuda were guaranteed by Weatherford Delaware atDecember 31, 2009: (i) the revolving credit facilities, (ii) the 4.95% Senior Notes, (iii) the 5.50% Senior Notes,(iv) the 6.50% Senior Notes, (v) the 5.15% Senior Notes, (vi) the 6.00% Senior Notes, (vii) the 7.00% Senior Notes,(viii) the 9.625% Senior Notes, (ix) the 9.875% Senior Notes and (x) issuances of notes under the commercial paperprogram.
Letters of Credit
We execute letters of credit in the normal course of business. While these obligations are not normally called,these obligations could be called by the beneficiaries at any time before the expiration date should we breach certaincontractual or payment obligations. As of December 31, 2009, we had $282 million of letters of credit and bid andperformance bonds outstanding, consisting of $210 million outstanding under various uncommitted credit facilitiesand $72 million letters of credit outstanding under our committed facilities. If the beneficiaries called these letters ofcredit, the called amount would become an on-balance sheet liability, and our available liquidity would be reducedby the amount called. To the extent we are successful in being awarded large contracts in the future, ourrequirements for posting letters of credit and bid and performance bonds could increase.
AR-30

Critical Accounting Policies and Estimates
Our discussion and analysis of our financial condition and results of operation is based upon our consolidatedfinancial statements. We prepare these financial statements in conformity with U.S. generally accepted accountingprinciples. As such, we are required to make certain estimates, judgments and assumptions that affect the reportedamounts of assets and liabilities at the date of the financial statements and the reported amounts of revenues andexpenses during the periods presented. We base our estimates on historical experience, available information andvarious other assumptions we believe to be reasonable under the circumstances. On an on-going basis, we evaluateour estimates; however, actual results may differ from these estimates under different assumptions or conditions.The accounting policies we believe require management’s most difficult, subjective or complex judgments and arethe most critical to our reporting of results of operations and financial position are as follows:
Business Combinations and Goodwill and Indefinite-Lived Intangible Assets
Goodwill and intangible assets acquired in connection with business combinations represent the excess ofconsideration over the fair value of tangible net assets acquired. Certain assumptions and estimates are employed indetermining the fair value of assets acquired, the fair value of liabilities assumed, as well as in determining theallocation of goodwill to the appropriate reporting unit.
We perform an impairment test for goodwill and indefinite-lived intangible assets annually as of October 1, orearlier if indicators of potential impairment exist.
We have indefinite-lived intangible assets totaling $20 million and $16 million as of December 31, 2009 and2008, respectively. Our impairment test for indefinite-lived intangible assets involves the comparison of the fairvalue of the intangible asset and its carrying value. We have determined that no impairment exists related to theseassets.
We have goodwill totaling $4.2 billion and $3.5 billion as of December 31, 2009 and 2008, respectively.Goodwill impairment is evaluated using a two-step process. The first step of the goodwill impairment test involves acomparison of the fair value of each of our reporting units with their carrying values. Our reporting units are basedon our regional structure and consist of the United States, Canada, Latin America, Europe, West Africa, FSU,Middle East/North Africa and Asia Pacific. If the carrying amount of a reporting unit exceeds its fair value, thesecond step of the goodwill impairment test shall be performed. The second step compares the implied fair value ofthe reporting unit’s goodwill to the carrying amount of its goodwill to measure the amount of impairment loss.
The fair value of our reporting units are determined using discounted cash flows using a discount rate adjustedfor the credit risk of the regional reporting unit tested. Certain estimates and judgments are required in theapplication of these fair value models. The discounted cash flow analysis consists of estimating the future revenue,operating margins, capital expenditures, working capital and cash flows that are directly associated with each of ourreporting units.
Many of the assumptions used in our discounted cash flow analysis are based upon our annual financialforecast. This annual planning process takes into consideration many factors including historical results andoperating performance, related industry trends, pricing strategies, customer analysis, operational issues, competitoranalysis, and marketplace data, among others. Assumptions are also made for growth rates for periods beyond thefinancial forecast period. Our estimates of fair value are sensitive to changes in all of these variables, certain ofwhich relate to conditions outside our control.
None of our reporting units failed the first step of our impairment test during 2009. In addition, all reportingunit’s fair values were substantially in excess of their carrying value with the exception of the FSU reporting unit.This reporting unit had an excess of fair value over carrying value of 12% and has approximately $249 million ofgoodwill.
Long-Lived Assets
Long-lived assets, which includes property, plant and equipment and definite-lived intangibles, comprise asignificant amount of our assets. In accounting for long-lived assets, we must make estimates about the expected
AR-31
useful lives of the assets and the potential for impairment based on the fair value of the assets and the cash flows theyare expected to generate. The value of the long-lived assets is then amortized over its expected useful life. A changein the estimated useful lives of our long-lived assets would have an impact on our results of operations. We estimatethe useful lives of our long-lived asset groups as follows:
Useful Lives
Buildings and leasehold improvements . . . . . . . . . . . . . . . . . . . . . . . . . . 10-40 years or lease term
Rental and service equipment . . . . . . . . . . . . . . . . . . . . . . . . . . . . . . . . . 2-20 years
Machinery and other . . . . . . . . . . . . . . . . . . . . . . . . . . . . . . . . . . . . . . . 2-12 years
Intangible assets . . . . . . . . . . . . . . . . . . . . . . . . . . . . . . . . . . . . . . . . . . . 2-20 years
In estimating the useful lives of our property, plant and equipment, we rely primarily on our actual experiencewith the same or similar assets. The useful lives of our intangible assets are determined by the years over which weexpect the assets to generate a benefit based on legal, contractual or regulatory terms.
Long-lived assets to be held and used by us are reviewed to determine whether any events or changes incircumstances indicate that we may not be able to recover the carrying amount of the asset. Factors that mightindicate a potential impairment may include, but are not limited to, significant decreases in the market value of thelong-lived asset, a significant change in the long-lived asset’s physical condition, the introduction of competingtechnologies, legal challenges, a change in industry conditions or a reduction in cash flows associated with the useof the long-lived asset. If these or other factors exist that indicate the carrying amount of the asset may not berecoverable, we determine whether an impairment has occurred through the use of an undiscounted cash flowanalysis. The undiscounted cash flow analysis consists of estimating the future cash flows that are directlyassociated with and expected to arise from the use and eventual disposition of the asset over its remaining useful life.These cash flows are inherently subjective and require significant estimates based upon historical experience andfuture expectations such as budgets and internal projections. If the undiscounted cash flows do not exceed thecarrying value of the long-lived asset, an impairment has occurred, and we recognize a loss for the differencebetween the carrying amount and the estimated fair value of the asset. The fair value of the asset is measured usingmarket prices, or in the absence of market prices, is based on an estimate of discounted cash flows. Cash flows aregenerally discounted at an interest rate commensurate with our weighted average cost of capital for a similar asset.
Pension and Other Postretirement Benefits
We recognize the overfunded or underfunded status of a defined benefit pension or other postretirement benefitplan as an asset or liability in the financial statements, measure plan assets and obligations as of the end of our fiscalyear, and recognize gains/losses, prior service credits/costs, and transition assets/obligations in accumulated othercomprehensive income until they are recognized as components of net periodic benefit cost.
Amounts recognized in the financial statements are determined on an actuarial basis. Two of the more criticalassumptions in the actuarial calculations are the discount rate for determining the current value of plan benefits and theexpected rate of return on plan assets. Discount rates are based on the yields of government bonds or high qualitycorporate bonds in the respective country or economic market. The expected long-term rates of return on plan assetsare based on a combination of historical experience and anticipated future returns in each of the asset categories. As wehave both domestic and international plans, the assumptions, though the same in nature, are based on varying factorsspecific to each particular country or economic environment. Changes in any of the assumptions used could impact ourprojected benefit obligations and benefit costs as well as other pension and postretirement benefit calculations.
Due to the significance of the discount rates and expected long-term rates of return, the following sensitivityanalysis demonstrates the effect that a 50 basis point change in those assumptions will have on annual pension expense:
50 Basis PointIncrease
50 Basis PointDecrease
Increase (Decrease) of AnnualPension Expense
(In millions)
Discount rate . . . . . . . . . . . . . . . . . . . . . . . . . . . . . . . . . . . . . . . . . . . $(0.8) $1.5
Expected long-term rate of return . . . . . . . . . . . . . . . . . . . . . . . . . . . . (0.5) 0.5
AR-32
Percentage of Completion
Revenue from long-term contracts, primarily for our integrated project management services, is reported onthe percentage-of-completion method of accounting. This method of accounting requires us to calculate contractprofit to be recognized in each reporting period for each contract based upon our projections of future outcomes,which include:
• estimates of the total cost to complete the project;
• estimates of project schedule and completion date;
• estimates of the extent of progress toward completion; and
• amounts of any change orders or claims included in revenue.
Measurements of progress are generally output based related to physical progress. At the outset of eachcontract, we prepare a detailed analysis of our estimated cost to complete the project. Risks related to servicedelivery, usage, productivity, and other factors are considered in the estimation process. Our personnel periodicallyevaluate the estimated costs, claims, change orders, and percentage of completion at the contract level. Therecording of profits and losses on long-term contracts requires an estimate of the total profit or loss over the life ofeach contract. This estimate requires consideration of total contract value, change orders, and claims, less costsincurred and estimated costs to complete. There are many factors that impact future costs, including but not limitedto weather, inflation, labor and community disruptions, timely availability of materials, productivity, and otherfactors as outlined in our “Risk Factors.” Anticipated losses on contracts are recorded in full in the period in whichthey become evident. Profits are recorded based upon the total estimated contract profit times the current percentagecomplete for the contract.
Income Taxes
We take into account the differences between the financial statement treatment and tax treatment of certaintransactions. Deferred tax assets and liabilities are recognized for the future tax consequences attributable todifferences between the financial statement carrying amounts of existing assets and liabilities and their respectivetax bases. Deferred tax assets and liabilities are measured using enacted tax rates expected to apply to taxableincome in the years in which those temporary differences are expected to be recovered or settled. The effect of achange in tax rates is recognized as income or expense in the period that includes the enactment date. Our effectivetax rates for 2009, 2008 and 2007 were 6.5%, 14.8% and 23.0%, respectively.
We recognize the impact of an uncertain tax position taken or expected to be taken on an income tax return inthe financial statements at the largest amount that is more likely than not to be sustained upon examination by therelevant taxing authority.
We operate in approximately 100 countries through various legal entities. As a result, we are subject tonumerous domestic and foreign tax jurisdictions and tax agreements and treaties among the various taxingauthorities. Our operations in these jurisdictions are taxed on various bases: income before taxes, deemed profits(which is generally determined using a percentage of revenues rather than profits) and withholding taxes based onrevenue. The calculation of our tax liabilities involves consideration of uncertainties in the application andinterpretation of complex tax regulations in a multitude of jurisdictions across our global operations. We recognizepotential liabilities and record tax liabilities for anticipated tax audit issues in the U.S. and other tax jurisdictionsbased on our estimate of whether, and the extent to which, additional taxes will be due. The tax liabilities arereflected net of realized tax loss carryforwards. We adjust these reserves upon specific events; however, due to thecomplexity of some of these uncertainties, the ultimate resolution may result in a payment that is different from ourcurrent estimate of the tax liabilities. If our estimate of tax liabilities proves to be less than the ultimate assessment,an additional charge to expense would result. If payment of these amounts ultimately proves to be less than therecorded amounts, the reversal of the liabilities would result in tax benefits being recognized in the period when thecontingency has been resolved and the liabilities are no longer necessary. Changes in tax laws, regulations,agreements and treaties, foreign currency exchange restrictions or our level of operations or profitability in eachtaxing jurisdiction could have an impact upon the amount of income taxes that we provide during any given year.
AR-33

Valuation Allowance for Deferred Tax Assets
We record a valuation allowance to reduce the carrying value of our deferred tax assets when it is more likelythan not that a portion or all of the deferred tax assets will expire before realization of the benefit or that futuredeductibility is not probable. The ultimate realization of the deferred tax assets depends on the ability to generatesufficient taxable income of the appropriate character and in the related jurisdiction in the future. In evaluating ourability to recover our deferred tax assets, we consider reasonably available positive and negative evidence,including our past operating results, the existence of cumulative losses in the most recent years and our forecast offuture taxable income. In estimating future taxable income, we develop assumptions, including the amount of futurestate, federal and international pretax operating income, the reversal of temporary differences and the implemen-tation of feasible and prudent tax planning strategies. These assumptions require significant judgment.
We have identified various domestic and international tax planning strategies that we would implement, ifnecessary, to enable the realization of our deferred tax assets; however, when the likelihood of the realization ofexisting deferred tax assets changes, adjustments to the valuation allowance are charged to our income tax provisionin the period in which the determination is made.
As of December 31, 2009, our net deferred tax assets were $297 million before a related valuation allowance of$70 million. As of December 31, 2008, our net deferred tax assets were $173 million before a related valuationallowance of $69 million.
For a more comprehensive list of our accounting policies, see “Item 8. Financial Statements and Supple-mentary Data — Notes to Consolidated Financial Statements — Note 1.”
New Accounting Pronouncements
Effective July 1, 2009, the Financial Accounting Standards Board’s (“FASB”) Accounting Standards Cod-ification (“ASC”) became the single official source of authoritative, nongovernmental generally accepted account-ing principles (“GAAP”) in the U.S. The historical GAAP hierarchy was eliminated and the ASC became the onlylevel of authoritative GAAP, other than guidance issued by the SEC. Our accounting policies were not affected bythe conversion to the ASC. However, any references to specific accounting standards have been changed to refer tothe appropriate section of the ASC.
Item 7A. Quantitative and Qualitative Disclosures about Market Risk
We are currently exposed to market risk from changes in foreign currency and changes in interest rates. Fromtime to time, we may enter into derivative financial instrument transactions to manage or reduce our market risk, butwe do not enter into derivative transactions for speculative purposes. A discussion of our market risk exposure inthese financial instruments follows.
Foreign Currency Exchange Rates
We operate in virtually every oil and natural gas exploration and production region in the world. In some partsof the world, such as the Middle East and Southeast Asia, the currency of our primary economic environment is theU.S. dollar. We use this as our functional currency. In other parts of the world, we conduct our business in currenciesother than the U.S. dollar and the functional currency is the applicable local currency. In those countries in which weoperate in the local currency, the effects of foreign currency fluctuations are largely mitigated because localexpenses of such foreign operations are also generally denominated in the same currency.
In January 2010, the Venezuelan government announced its intention to devalue its currency (“Bolivar”) andmove to a two tier exchange structure. The official exchange rate is expected to move from 2.15 to 2.60 for essentialgoods and 4.30 for non-essential goods and services. While we are still evaluating the impact of these actions, ourpreliminary assessment of the impact of the devaluation is that we will incur a one-time loss of approximately$50 million in the first quarter of 2010 for the remeasurement of the local balance sheet at the date of thedevaluation.
AR-34

Assets and liabilities of which the functional currency is the local currency are translated into U.S. dollarsusing the exchange rates in effect at the balance sheet date, resulting in translation adjustments that are reflected asAccumulated Other Comprehensive Income in the shareholders’ equity section on our Consolidated BalanceSheets. A portion of our net assets are impacted by changes in foreign currencies in relation to the U.S. dollar. Werecorded a $377 million adjustment to increase our equity account for the year ended December 31, 2009 to reflectthe net impact of the weakening of the U.S. dollar against various foreign currencies.
As of December 31, 2009 and 2008, we had several foreign currency forward and option contracts withnotional amounts aggregating $1,062 million and $503 million, respectively, which were entered into to hedgeexposure to currency fluctuations in various foreign currencies, including, but not limited to, the British poundsterling, the Canadian dollar, the euro and the Norwegian krone. The total estimated fair value of these contracts atDecember 31, 2009 resulted in a net liability of approximately $9 million and at December 31, 2008, resulted in aliability of approximately $2 million. These derivative instruments were not designated as hedges and the changesin fair value of the contracts are recorded each period in current earnings.
We have cross-currency swaps between the U.S. dollar and Canadian dollar to hedge certain exposures to theCanadian dollar. At December 31, 2009 and 2008, we had notional amounts outstanding of $263 million and$280 million, respectively. The estimated fair value of these contracts at December 31, 2009 and 2008 resulted in aliability of $26 million and an asset of $1 million, respectively. These derivative instruments were not designated ashedges and the changes in fair value of the contracts are recorded each period in current earnings.
Interest Rates
We are subject to interest rate risk on our long-term fixed-interest rate debt and variable-interest rateborrowings. Variable rate debt, where the interest rate fluctuates periodically, exposes us to short-term changesin market interest rates. Fixed rate debt, where the interest rate is fixed over the life of the instrument, exposes us tochanges in market interest rates reflected in the fair value of the debt and to the risk that we may need to refinancematuring debt with new debt at a higher rate. All other things being equal, the fair value of our fixed rate debt willincrease or decrease as interest rates change.
Our long-term borrowings that were outstanding at December 31, 2009 and 2008 subject to interest rate riskconsist of the following:
CarryingAmount
FairValue
CarryingAmount
FairValue
2009 2008December 31,
(In millions)
6.625% Senior Notes due 2011 . . . . . . . . . . . . . . . . . . . . . . $ 353 $ 380 $354 $330
5.95% Senior Notes due 2012 . . . . . . . . . . . . . . . . . . . . . . . 599 648 599 585
5.15% Senior Notes due 2013 . . . . . . . . . . . . . . . . . . . . . . . 511 526 511 4634.95% Senior Notes due 2013 . . . . . . . . . . . . . . . . . . . . . . . 253 263 254 213
5.50% Senior Notes due 2016 . . . . . . . . . . . . . . . . . . . . . . . 360 351 349 306
6.35% Senior Notes due 2017 . . . . . . . . . . . . . . . . . . . . . . . 600 647 600 513
6.00% Senior Notes due 2018 . . . . . . . . . . . . . . . . . . . . . . . 498 514 498 456
9.625% Senior Notes due 2019 . . . . . . . . . . . . . . . . . . . . . . 1,034 1,236 — —
6.50% Senior Notes due 2036 . . . . . . . . . . . . . . . . . . . . . . . 596 574 596 495
6.80% Senior Notes due 2037 . . . . . . . . . . . . . . . . . . . . . . . 298 303 298 227
7.00% Senior Notes due 2038 . . . . . . . . . . . . . . . . . . . . . . . 498 517 498 394
9.875% Senior Notes due 2039 . . . . . . . . . . . . . . . . . . . . . . 247 326 — —
We have various other long-term debt instruments of $18 million at December 31, 2009, but believe the impactof changes in interest rates in the near term will not be material to these instruments. The carrying value of our short-term borrowings of $852 million at December 31, 2009 approximates their fair value.
AR-35
As it relates to our variable rate debt, if market interest rates average 1% more in 2010 than the rates as ofDecember 31, 2009, interest expense for 2010 would increase by $9 million. This amount was determined bycalculating the effect of the hypothetical interest rate on our variable rate debt. This sensitivity analysis assumesthere are no changes in our financial structure.
Interest Rate Swaps and Derivatives
We manage our debt portfolio to achieve an overall desired position of fixed and floating rates and may employinterest rate swaps as a tool to achieve that goal. The major risks from interest rate derivatives include changes in theinterest rates affecting the fair value of such instruments, potential increases in interest expense due to marketincreases in floating interest rates and the creditworthiness of the counterparties in such transactions. Thecounterparties to our interest rate swaps are multinational commercial banks. In light of events in the globalcredit markets and the potential impact of these events on the liquidity of the banking industry, we continue tomonitor the creditworthiness of our counterparties.
We use interest rate swaps to take advantage of available short-term interest rates. Amounts received upontermination of the swaps represent the fair value of the agreements at the time of termination and are recorded as anadjustment to the carrying value of the related debt. These amounts are being amortized as a reduction to interestexpense over the remaining term of the debt.
In August 2009, we entered into interest rate swap agreements to pay a variable interest rate and receive a fixedinterest rate with an aggregate notional amount of $1.2 billion against our 5.15%, 5.50% and 9.625% Senior Notes.These swaps were designed as fair value hedges and were terminated in December 2009. As a result of theseterminations, we received a cash settlement of $53 million. In addition, we received $11 million in interestpayments while the interest rate swaps were open. The gains associated with these interest rate swap terminationshave been deferred and will be amortized over the remaining term of our 5.15%, 5.50% and 9.625% Senior Notes.
In December 2008, we entered into an interest rate swap agreement on an aggregate notional amount of$150 million against one of our revolving credit facilities. This agreement matured in June 2009.
Upon completion of the long-term debt offering in March 2008, we entered into interest rate swap agreementson an aggregate notional amount of $500 million against our 5.15% Senior Notes. These swaps were designed asfair value hedges and were terminated in December 2008. As a result of these terminations, we received cashproceeds, net of accrued interest, of $12 million. The gain associated with this interest rate swap termination hasbeen deferred and is being amortized over the remaining term of the 5.15% Senior Notes.
We have no interest rate swaps outstanding at December 31, 2009. As of December 31, 2009 and 2008, we hadnet unamortized gains of $68 million and $21 million, respectively, associated with interest rate swap terminations.
AR-36

Item 8. Financial Statements and Supplementary Data
INDEX TO FINANCIAL STATEMENTS AND FINANCIAL STATEMENT SCHEDULE
Page
Management’s Report on Internal Control Over Financial Reporting. . . . . . . . . . . . . . . . . . . . . . . . . . AR-38
Report of Independent Registered Public Accounting Firm on Internal Control Over FinancialReporting . . . . . . . . . . . . . . . . . . . . . . . . . . . . . . . . . . . . . . . . . . . . . . . . . . . . . . . . . . . . . . . . . . . AR-39
Report of Independent Registered Public Accounting Firm. . . . . . . . . . . . . . . . . . . . . . . . . . . . . . . . . AR-40
Report of Statutory Auditor. . . . . . . . . . . . . . . . . . . . . . . . . . . . . . . . . . . . . . . . . . . . . . . . . . . . . . . . AR-41
Consolidated Balance Sheets as of December 31, 2009 and 2008 . . . . . . . . . . . . . . . . . . . . . . . . . . . . AR-42
Consolidated Statements of Income for each of the three years in the period ended December 31,2009 . . . . . . . . . . . . . . . . . . . . . . . . . . . . . . . . . . . . . . . . . . . . . . . . . . . . . . . . . . . . . . . . . . . . . . . AR-43
Consolidated Statements of Shareholders’ Equity for each of the three years in the period endedDecember 31, 2009 . . . . . . . . . . . . . . . . . . . . . . . . . . . . . . . . . . . . . . . . . . . . . . . . . . . . . . . . . . . . AR-44
Consolidated Statements of Cash Flows for each of the three years in the period ended December 31,2009 . . . . . . . . . . . . . . . . . . . . . . . . . . . . . . . . . . . . . . . . . . . . . . . . . . . . . . . . . . . . . . . . . . . . . . . AR-45
Notes to Consolidated Financial Statements . . . . . . . . . . . . . . . . . . . . . . . . . . . . . . . . . . . . . . . . . . . . AR-46
Financial Statement Schedule II:
Valuation and Qualifying Accounts and Allowances . . . . . . . . . . . . . . . . . . . . . . . . . . . . . . . . . . . . AR-99
AR-37
MANAGEMENT’S REPORT ON INTERNAL CONTROL OVER FINANCIAL REPORTING
Management of the Company is responsible for establishing and maintaining adequate internal control overfinancial reporting as such term is defined in the Securities Exchange Act of 1934 Rule 13a-15(f). The Company’sinternal controls were designed to provide reasonable assurance as to the reliability of its financial reporting and thepreparation of financial statements for external purposes in accordance with U.S. generally accepted accountingprinciples.
Because of its inherent limitations, internal control over financial reporting may not prevent or detectmisstatements. Also, projections of any evaluation of effectiveness to future periods are subject to the risk thatcontrols may become inadequate because of changes in conditions, or that the degree of compliance with thepolicies or procedures may deteriorate.
Management assessed the effectiveness of the Company’s internal control over financial reporting as ofDecember 31, 2009. In making its assessment, management has utilized the criteria set forth by the Committee ofSponsoring Organizations of the Treadway Commission in Internal Control-Integrated Framework. Based on thisassessment, management concluded that as of December 31, 2009 the Company’s internal control over financialreporting is effective.
The effectiveness of the Company’s internal control over financial reporting as of December 31, 2009, hasbeen audited by Ernst & Young LLP, an independent registered public accounting firm, as stated in their reportwhich appears herein.
AR-38
Report of Independent Registered Public Accounting Firm
The Board of Directors and Shareholders ofWeatherford International Ltd. and subsidiaries
We have audited Weatherford International Ltd.’s internal control over financial reporting as of December 31,2009, based on criteria established in Internal Control — Integrated Framework issued by the Committee ofSponsoring Organizations of the Treadway Commission (the COSO criteria). Weatherford International Ltd.’smanagement is responsible for maintaining effective internal control over financial reporting, and for its assessmentof the effectiveness of internal control over financial reporting included in the accompanying Management’s Reporton Internal Control Over Financial Reporting. Our responsibility is to express an opinion on the company’s internalcontrol over financial reporting based on our audit.
We conducted our audit in accordance with the standards of the Public Company Accounting Oversight Board(United States). Those standards require that we plan and perform the audit to obtain reasonable assurance aboutwhether effective internal control over financial reporting was maintained in all material respects. Our auditincluded obtaining an understanding of internal control over financial reporting, assessing the risk that a materialweakness exists, testing and evaluating the design and operating effectiveness of internal control based on theassessed risk, and performing such other procedures as we considered necessary in the circumstances. We believethat our audit provides a reasonable basis for our opinion.
A company’s internal control over financial reporting is a process designed to provide reasonable assuranceregarding the reliability of financial reporting and the preparation of financial statements for external purposes inaccordance with generally accepted accounting principles. A company’s internal control over financial reportingincludes those policies and procedures that (1) pertain to the maintenance of records that, in reasonable detail,accurately and fairly reflect the transactions and dispositions of the assets of the company; (2) provide reasonableassurance that transactions are recorded as necessary to permit preparation of financial statements in accordancewith generally accepted accounting principles, and that receipts and expenditures of the company are being madeonly in accordance with authorizations of management and directors of the company; and (3) provide reasonableassurance regarding prevention or timely detection of unauthorized acquisition, use, or disposition of the company’sassets that could have a material effect on the financial statements.
Because of its inherent limitations, internal control over financial reporting may not prevent or detectmisstatements. Also, projections of any evaluation of effectiveness to future periods are subject to the risk thatcontrols may become inadequate because of changes in conditions, or that the degree of compliance with thepolicies or procedures may deteriorate.
In our opinion, Weatherford International Ltd. and subsidiaries maintained, in all material respects, effectiveinternal control over financial reporting as of December 31, 2009 based on the COSO criteria.
We also have audited, in accordance with the standards of the Public Company Accounting Oversight Board(United States), the consolidated balance sheets of Weatherford International Ltd. and subsidiaries as ofDecember 31, 2009 and 2008, and the related consolidated statements of income, shareholders’ equity, and cashflows for each of the three years in the period ended December 31, 2009 of Weatherford International Ltd. andsubsidiaries and our report dated March 1, 2010 expressed an unqualified opinion thereon.
/s/ Ernst & Young LLPHouston, TexasMarch 1, 2010
AR-39

Report of Independent Registered Public Accounting Firm
The Board of Directors and Shareholders ofWeatherford International Ltd. and subsidiaries
We have audited the accompanying consolidated balance sheets of Weatherford International Ltd. andsubsidiaries as of December 31, 2009 and 2008, and the related consolidated statements of income, shareholders’equity, and cash flows for each of the three years in the period ended December 31, 2009. Our audits also includedthe financial statement schedule listed in the Index at Item 15. These financial statements and schedule are theresponsibility of the Company’s management. Our responsibility is to express an opinion on these financialstatements and schedule based on our audits.
We conducted our audits in accordance with the standards of the Public Company Accounting Oversight Board(United States). Those standards require that we plan and perform the audit to obtain reasonable assurance aboutwhether the financial statements are free of material misstatement. An audit includes examining, on a test basis,evidence supporting the amounts and disclosures in the financial statements. An audit also includes assessing theaccounting principles used and significant estimates made by management, as well as evaluating the overallfinancial statement presentation. We believe that our audits provide a reasonable basis for our opinion.
In our opinion, the financial statements referred to above present fairly, in all material respects, theconsolidated financial position of Weatherford International Ltd. and subsidiaries at December 31, 2009 and2008, and the consolidated results of their operations and their cash flows for each of the three years in the periodended December 31, 2009, in conformity with U.S. generally accepted accounting principles. Also, in our opinion,the related financial statement schedule, when considered in relation to the basic financial statements taken as awhole, presents fairly in all material respects the information set forth therein.
As discussed in Note 1 to the consolidated financial statements, the Company changed its method ofaccounting for noncontrolling interests.
We also have audited, in accordance with the standards of the Public Company Accounting Oversight Board(United States), Weatherford International Ltd.’s internal control over financial reporting as of December 31, 2009,based on criteria established in Internal Control-Integrated Framework issued by the Committee of SponsoringOrganizations of the Treadway Commission and our report dated March 1, 2010 expressed an unqualified opinionthereon.
/s/ Ernst & Young LLPHouston, TexasMarch 1, 2010
AR-40

Ernst & Young LtdBleicherweg 21CH-8002 Zurich
Phone +41 58 286 31 11Fax +41 58 286 30 04www.ey.com/ch
To the General Meeting ofWeatherford International Ltd., Zug
Zurich, March 1, 2010Report of the statutory auditor on the consolidated financial statements
As statutory auditor, we have audited the consolidated financial statements of Weatherford International Ltd., whichcomprise the consolidated balance sheet as of December 31, 2009 and the related consolidated statements of income,shareholders’ equity and cash flows, and notes thereto (pages AR-42 to AR-87) for the year then ended.
Board of Directors’ responsibility
The Board of Directors is responsible for the preparation and fair presentation of the consolidated financialstatements in accordance with accounting principles generally accepted in the United States and the requirements ofSwiss law. This responsibility includes designing, implementing and maintaining an internal control system relevant tothe preparation and fair presentation of consolidated financial statements that are free from material misstatement,whether due to fraud or error. The Board of Directors is further responsible for selecting and applying appropriateaccounting policies and making accounting estimates that are reasonable in the circumstances.
Auditor’s responsibility
Our responsibility is to express an opinion on these consolidated financial statements based on our audit. Weconducted our audit in accordance with Swiss law, Swiss Auditing Standards and auditing standards generally accepted inthe United States. Those standards require that we plan and perform the audit to obtain reasonable assurance whether theconsolidated financial statements are free from material misstatement.
An audit involves performing procedures to obtain audit evidence about the amounts and disclosures in theconsolidated financial statements. The procedures selected depend on the auditor’s judgment, including the assessment ofthe risks of material misstatement of the consolidated financial statements, whether due to fraud or error. In making thoserisk assessments, the auditor considers the internal control system relevant to the entity’s preparation and fair presentationof the consolidated financial statements in order to design audit procedures that are appropriate in the circumstances, butnot for the purpose of expressing an opinion on the effectiveness of the entity’s internal control system. An audit alsoincludes evaluating the appropriateness of the accounting policies used and the reasonableness of accounting estimatesmade, as well as evaluating the overall presentation of the consolidated financial statements. We believe that the auditevidence we have obtained is sufficient and appropriate to provide a basis for our audit opinion.
Opinion
In our opinion, the consolidated financial statements for the year ended December 31, 2009 present fairly in allmaterial respects, the financial position, the results of operations and the cash flows in accordance with accountingprinciples generally accepted in the United States and comply with Swiss law.
Report on other legal requirements
We confirm that we meet the legal requirements on licensing according to the Auditor Over-sight Act (AOA) andindependence (article 728 CO and article 11 AOA) and that there are no circumstances incompatible with ourindependence.
In accordance with article 728a paragraph 1 item 3 CO and Swiss Auditing Standard 890, we confirm that an internalcontrol system exists, which has been designed for the preparation of consolidated financial statements according to theinstructions of the Board of Directors.
We recommend that the consolidated financial statements submitted to you be approved.
Ernst & Young Ltd
/s/ Robin Errico /s/ Rico FehrLicensed audit expert Licensed audit expert(Auditor in charge)
AR-41
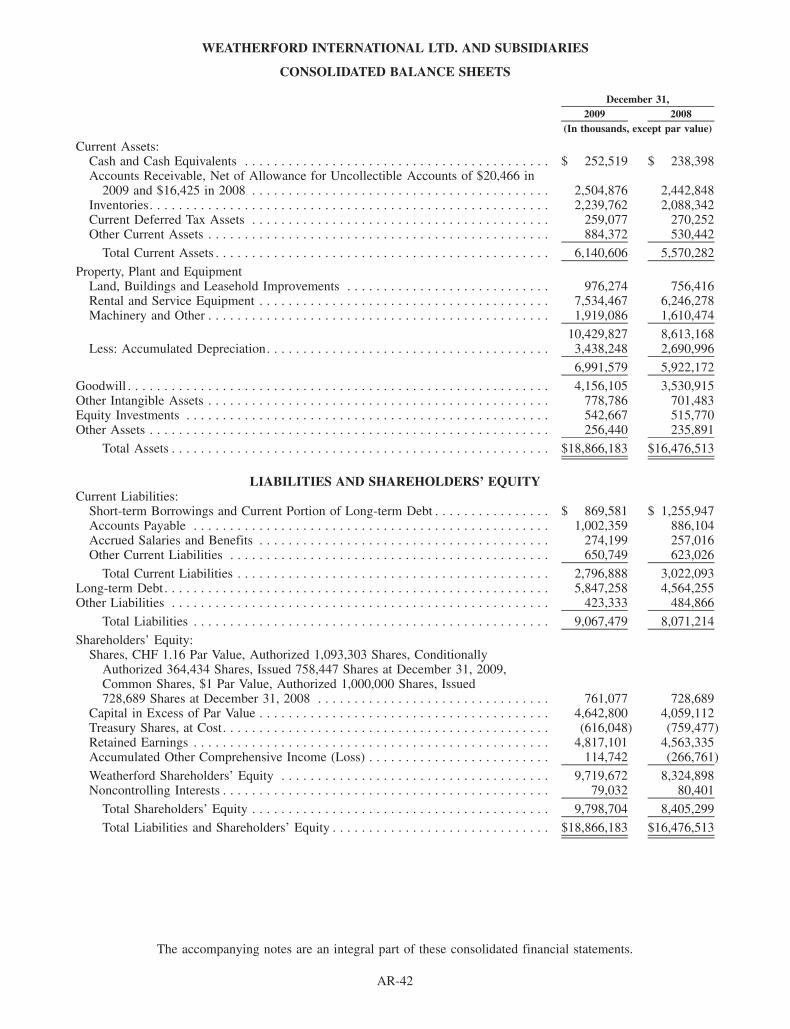
WEATHERFORD INTERNATIONAL LTD. AND SUBSIDIARIES
CONSOLIDATED BALANCE SHEETS
2009 2008December 31,
(In thousands, except par value)
Current Assets:Cash and Cash Equivalents . . . . . . . . . . . . . . . . . . . . . . . . . . . . . . . . . . . . . . . . . . $ 252,519 $ 238,398Accounts Receivable, Net of Allowance for Uncollectible Accounts of $20,466 in
2009 and $16,425 in 2008 . . . . . . . . . . . . . . . . . . . . . . . . . . . . . . . . . . . . . . . . . 2,504,876 2,442,848Inventories. . . . . . . . . . . . . . . . . . . . . . . . . . . . . . . . . . . . . . . . . . . . . . . . . . . . . . . 2,239,762 2,088,342Current Deferred Tax Assets . . . . . . . . . . . . . . . . . . . . . . . . . . . . . . . . . . . . . . . . . 259,077 270,252Other Current Assets . . . . . . . . . . . . . . . . . . . . . . . . . . . . . . . . . . . . . . . . . . . . . . . 884,372 530,442
Total Current Assets . . . . . . . . . . . . . . . . . . . . . . . . . . . . . . . . . . . . . . . . . . . . . . 6,140,606 5,570,282
Property, Plant and EquipmentLand, Buildings and Leasehold Improvements . . . . . . . . . . . . . . . . . . . . . . . . . . . . 976,274 756,416Rental and Service Equipment . . . . . . . . . . . . . . . . . . . . . . . . . . . . . . . . . . . . . . . . 7,534,467 6,246,278Machinery and Other . . . . . . . . . . . . . . . . . . . . . . . . . . . . . . . . . . . . . . . . . . . . . . . 1,919,086 1,610,474
10,429,827 8,613,168Less: Accumulated Depreciation. . . . . . . . . . . . . . . . . . . . . . . . . . . . . . . . . . . . . . . 3,438,248 2,690,996
6,991,579 5,922,172
Goodwill . . . . . . . . . . . . . . . . . . . . . . . . . . . . . . . . . . . . . . . . . . . . . . . . . . . . . . . . . . 4,156,105 3,530,915Other Intangible Assets . . . . . . . . . . . . . . . . . . . . . . . . . . . . . . . . . . . . . . . . . . . . . . . 778,786 701,483Equity Investments . . . . . . . . . . . . . . . . . . . . . . . . . . . . . . . . . . . . . . . . . . . . . . . . . . 542,667 515,770Other Assets . . . . . . . . . . . . . . . . . . . . . . . . . . . . . . . . . . . . . . . . . . . . . . . . . . . . . . . 256,440 235,891
Total Assets . . . . . . . . . . . . . . . . . . . . . . . . . . . . . . . . . . . . . . . . . . . . . . . . . . . . $18,866,183 $16,476,513
LIABILITIES AND SHAREHOLDERS’ EQUITYCurrent Liabilities:
Short-term Borrowings and Current Portion of Long-term Debt . . . . . . . . . . . . . . . . $ 869,581 $ 1,255,947Accounts Payable . . . . . . . . . . . . . . . . . . . . . . . . . . . . . . . . . . . . . . . . . . . . . . . . . 1,002,359 886,104Accrued Salaries and Benefits . . . . . . . . . . . . . . . . . . . . . . . . . . . . . . . . . . . . . . . . 274,199 257,016Other Current Liabilities . . . . . . . . . . . . . . . . . . . . . . . . . . . . . . . . . . . . . . . . . . . . 650,749 623,026
Total Current Liabilities . . . . . . . . . . . . . . . . . . . . . . . . . . . . . . . . . . . . . . . . . . . 2,796,888 3,022,093Long-term Debt. . . . . . . . . . . . . . . . . . . . . . . . . . . . . . . . . . . . . . . . . . . . . . . . . . . . . 5,847,258 4,564,255Other Liabilities . . . . . . . . . . . . . . . . . . . . . . . . . . . . . . . . . . . . . . . . . . . . . . . . . . . . 423,333 484,866
Total Liabilities . . . . . . . . . . . . . . . . . . . . . . . . . . . . . . . . . . . . . . . . . . . . . . . . . 9,067,479 8,071,214
Shareholders’ Equity:Shares, CHF 1.16 Par Value, Authorized 1,093,303 Shares, Conditionally
Authorized 364,434 Shares, Issued 758,447 Shares at December 31, 2009,Common Shares, $1 Par Value, Authorized 1,000,000 Shares, Issued728,689 Shares at December 31, 2008 . . . . . . . . . . . . . . . . . . . . . . . . . . . . . . . . 761,077 728,689
Capital in Excess of Par Value . . . . . . . . . . . . . . . . . . . . . . . . . . . . . . . . . . . . . . . . 4,642,800 4,059,112Treasury Shares, at Cost. . . . . . . . . . . . . . . . . . . . . . . . . . . . . . . . . . . . . . . . . . . . . (616,048) (759,477)Retained Earnings . . . . . . . . . . . . . . . . . . . . . . . . . . . . . . . . . . . . . . . . . . . . . . . . . 4,817,101 4,563,335Accumulated Other Comprehensive Income (Loss) . . . . . . . . . . . . . . . . . . . . . . . . . 114,742 (266,761)
Weatherford Shareholders’ Equity . . . . . . . . . . . . . . . . . . . . . . . . . . . . . . . . . . . . . 9,719,672 8,324,898Noncontrolling Interests . . . . . . . . . . . . . . . . . . . . . . . . . . . . . . . . . . . . . . . . . . . . . 79,032 80,401
Total Shareholders’ Equity . . . . . . . . . . . . . . . . . . . . . . . . . . . . . . . . . . . . . . . . . 9,798,704 8,405,299
Total Liabilities and Shareholders’ Equity . . . . . . . . . . . . . . . . . . . . . . . . . . . . . . $18,866,183 $16,476,513
The accompanying notes are an integral part of these consolidated financial statements.
AR-42
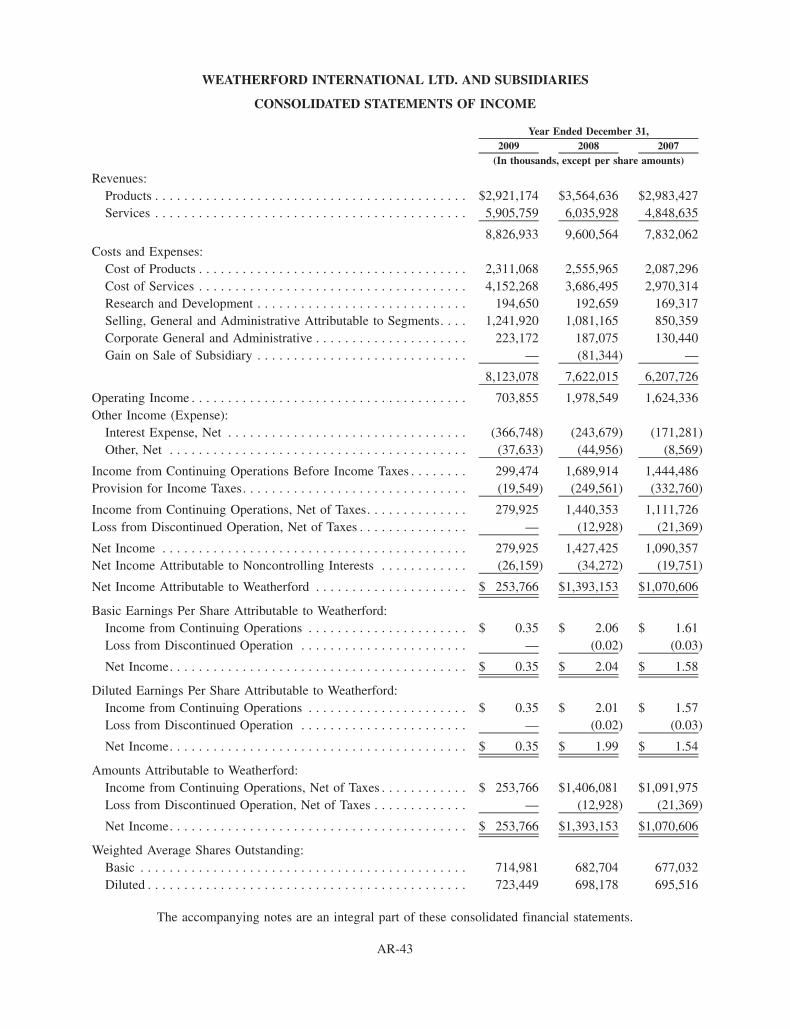
WEATHERFORD INTERNATIONAL LTD. AND SUBSIDIARIES
CONSOLIDATED STATEMENTS OF INCOME
2009 2008 2007Year Ended December 31,
(In thousands, except per share amounts)
Revenues:Products . . . . . . . . . . . . . . . . . . . . . . . . . . . . . . . . . . . . . . . . . . . $2,921,174 $3,564,636 $2,983,427Services . . . . . . . . . . . . . . . . . . . . . . . . . . . . . . . . . . . . . . . . . . . 5,905,759 6,035,928 4,848,635
8,826,933 9,600,564 7,832,062Costs and Expenses:
Cost of Products . . . . . . . . . . . . . . . . . . . . . . . . . . . . . . . . . . . . . 2,311,068 2,555,965 2,087,296Cost of Services . . . . . . . . . . . . . . . . . . . . . . . . . . . . . . . . . . . . . 4,152,268 3,686,495 2,970,314Research and Development . . . . . . . . . . . . . . . . . . . . . . . . . . . . . 194,650 192,659 169,317Selling, General and Administrative Attributable to Segments. . . . 1,241,920 1,081,165 850,359Corporate General and Administrative . . . . . . . . . . . . . . . . . . . . . 223,172 187,075 130,440Gain on Sale of Subsidiary . . . . . . . . . . . . . . . . . . . . . . . . . . . . . — (81,344) —
8,123,078 7,622,015 6,207,726
Operating Income . . . . . . . . . . . . . . . . . . . . . . . . . . . . . . . . . . . . . . 703,855 1,978,549 1,624,336Other Income (Expense):
Interest Expense, Net . . . . . . . . . . . . . . . . . . . . . . . . . . . . . . . . . (366,748) (243,679) (171,281)Other, Net . . . . . . . . . . . . . . . . . . . . . . . . . . . . . . . . . . . . . . . . . (37,633) (44,956) (8,569)
Income from Continuing Operations Before Income Taxes . . . . . . . . 299,474 1,689,914 1,444,486Provision for Income Taxes. . . . . . . . . . . . . . . . . . . . . . . . . . . . . . . (19,549) (249,561) (332,760)
Income from Continuing Operations, Net of Taxes. . . . . . . . . . . . . . 279,925 1,440,353 1,111,726Loss from Discontinued Operation, Net of Taxes . . . . . . . . . . . . . . . — (12,928) (21,369)
Net Income . . . . . . . . . . . . . . . . . . . . . . . . . . . . . . . . . . . . . . . . . . 279,925 1,427,425 1,090,357Net Income Attributable to Noncontrolling Interests . . . . . . . . . . . . (26,159) (34,272) (19,751)
Net Income Attributable to Weatherford . . . . . . . . . . . . . . . . . . . . . $ 253,766 $1,393,153 $1,070,606
Basic Earnings Per Share Attributable to Weatherford:Income from Continuing Operations . . . . . . . . . . . . . . . . . . . . . . $ 0.35 $ 2.06 $ 1.61Loss from Discontinued Operation . . . . . . . . . . . . . . . . . . . . . . . — (0.02) (0.03)
Net Income. . . . . . . . . . . . . . . . . . . . . . . . . . . . . . . . . . . . . . . . . $ 0.35 $ 2.04 $ 1.58
Diluted Earnings Per Share Attributable to Weatherford:Income from Continuing Operations . . . . . . . . . . . . . . . . . . . . . . $ 0.35 $ 2.01 $ 1.57Loss from Discontinued Operation . . . . . . . . . . . . . . . . . . . . . . . — (0.02) (0.03)
Net Income. . . . . . . . . . . . . . . . . . . . . . . . . . . . . . . . . . . . . . . . . $ 0.35 $ 1.99 $ 1.54
Amounts Attributable to Weatherford:Income from Continuing Operations, Net of Taxes . . . . . . . . . . . . $ 253,766 $1,406,081 $1,091,975Loss from Discontinued Operation, Net of Taxes . . . . . . . . . . . . . — (12,928) (21,369)
Net Income. . . . . . . . . . . . . . . . . . . . . . . . . . . . . . . . . . . . . . . . . $ 253,766 $1,393,153 $1,070,606
Weighted Average Shares Outstanding:Basic . . . . . . . . . . . . . . . . . . . . . . . . . . . . . . . . . . . . . . . . . . . . . 714,981 682,704 677,032Diluted . . . . . . . . . . . . . . . . . . . . . . . . . . . . . . . . . . . . . . . . . . . . 723,449 698,178 695,516
The accompanying notes are an integral part of these consolidated financial statements.
AR-43
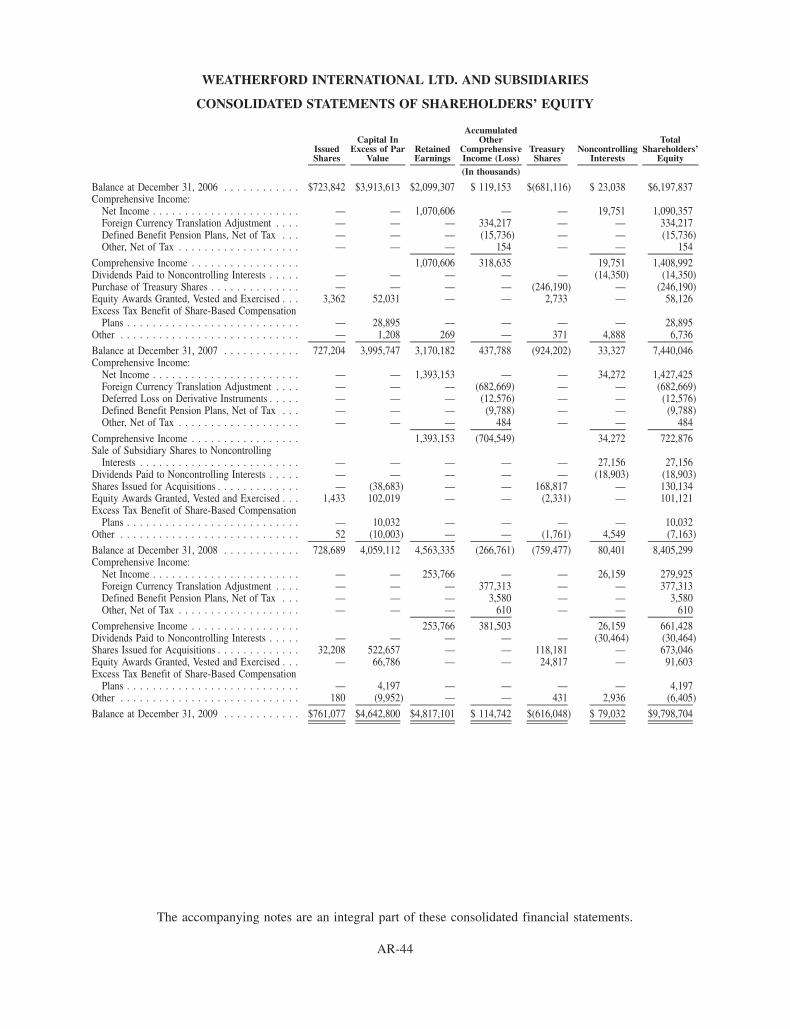
WEATHERFORD INTERNATIONAL LTD. AND SUBSIDIARIES
CONSOLIDATED STATEMENTS OF SHAREHOLDERS’ EQUITY
IssuedShares
Capital InExcess of Par
ValueRetainedEarnings
AccumulatedOther
ComprehensiveIncome (Loss)
TreasuryShares
NoncontrollingInterests
TotalShareholders’
Equity(In thousands)
Balance at December 31, 2006 . . . . . . . . . . . . $723,842 $3,913,613 $2,099,307 $ 119,153 $(681,116) $ 23,038 $6,197,837Comprehensive Income:
Net Income . . . . . . . . . . . . . . . . . . . . . . . — — 1,070,606 — — 19,751 1,090,357Foreign Currency Translation Adjustment . . . . — — — 334,217 — — 334,217Defined Benefit Pension Plans, Net of Tax . . . — — — (15,736) — — (15,736)Other, Net of Tax . . . . . . . . . . . . . . . . . . . — — — 154 — — 154
Comprehensive Income . . . . . . . . . . . . . . . . . 1,070,606 318,635 19,751 1,408,992Dividends Paid to Noncontrolling Interests . . . . . — — — — — (14,350) (14,350)Purchase of Treasury Shares . . . . . . . . . . . . . . — — — — (246,190) — (246,190)Equity Awards Granted, Vested and Exercised . . . 3,362 52,031 — — 2,733 — 58,126Excess Tax Benefit of Share-Based Compensation
Plans . . . . . . . . . . . . . . . . . . . . . . . . . . . — 28,895 — — — — 28,895Other . . . . . . . . . . . . . . . . . . . . . . . . . . . . — 1,208 269 — 371 4,888 6,736
Balance at December 31, 2007 . . . . . . . . . . . . 727,204 3,995,747 3,170,182 437,788 (924,202) 33,327 7,440,046Comprehensive Income:
Net Income . . . . . . . . . . . . . . . . . . . . . . . — — 1,393,153 — — 34,272 1,427,425Foreign Currency Translation Adjustment . . . . — — — (682,669) — — (682,669)Deferred Loss on Derivative Instruments . . . . . — — — (12,576) — — (12,576)Defined Benefit Pension Plans, Net of Tax . . . — — — (9,788) — — (9,788)Other, Net of Tax . . . . . . . . . . . . . . . . . . . — — — 484 — — 484
Comprehensive Income . . . . . . . . . . . . . . . . . 1,393,153 (704,549) 34,272 722,876Sale of Subsidiary Shares to Noncontrolling
Interests . . . . . . . . . . . . . . . . . . . . . . . . . — — — — — 27,156 27,156Dividends Paid to Noncontrolling Interests . . . . . — — — — — (18,903) (18,903)Shares Issued for Acquisitions . . . . . . . . . . . . . — (38,683) — — 168,817 — 130,134Equity Awards Granted, Vested and Exercised . . . 1,433 102,019 — — (2,331) — 101,121Excess Tax Benefit of Share-Based Compensation
Plans . . . . . . . . . . . . . . . . . . . . . . . . . . . — 10,032 — — — — 10,032Other . . . . . . . . . . . . . . . . . . . . . . . . . . . . 52 (10,003) — — (1,761) 4,549 (7,163)
Balance at December 31, 2008 . . . . . . . . . . . . 728,689 4,059,112 4,563,335 (266,761) (759,477) 80,401 8,405,299Comprehensive Income:
Net Income . . . . . . . . . . . . . . . . . . . . . . . — — 253,766 — — 26,159 279,925Foreign Currency Translation Adjustment . . . . — — — 377,313 — — 377,313Defined Benefit Pension Plans, Net of Tax . . . — — — 3,580 — — 3,580Other, Net of Tax . . . . . . . . . . . . . . . . . . . — — — 610 — — 610
Comprehensive Income . . . . . . . . . . . . . . . . . 253,766 381,503 26,159 661,428Dividends Paid to Noncontrolling Interests . . . . . — — — — — (30,464) (30,464)Shares Issued for Acquisitions . . . . . . . . . . . . . 32,208 522,657 — — 118,181 — 673,046Equity Awards Granted, Vested and Exercised . . . — 66,786 — — 24,817 — 91,603Excess Tax Benefit of Share-Based Compensation
Plans . . . . . . . . . . . . . . . . . . . . . . . . . . . — 4,197 — — — — 4,197Other . . . . . . . . . . . . . . . . . . . . . . . . . . . . 180 (9,952) — — 431 2,936 (6,405)
Balance at December 31, 2009 . . . . . . . . . . . . $761,077 $4,642,800 $4,817,101 $ 114,742 $(616,048) $ 79,032 $9,798,704
The accompanying notes are an integral part of these consolidated financial statements.
AR-44

WEATHERFORD INTERNATIONAL LTD. AND SUBSIDIARIES
CONSOLIDATED STATEMENTS OF CASH FLOWS
2009 2008 2007Year Ended December 31,
(In thousands)
Cash Flows From Operating Activities:Net Income . . . . . . . . . . . . . . . . . . . . . . . . . . . . . . . . . . . . . . . . . . . . . . . $ 279,925 $ 1,427,425 $ 1,090,357Adjustments to Reconcile Net Income to Net Cash Provided by Operating
Activities:Depreciation and Amortization . . . . . . . . . . . . . . . . . . . . . . . . . . . . . . . . 906,697 731,808 606,226Gain on Sale of Assets and Businesses, Net . . . . . . . . . . . . . . . . . . . . . . . . (13,841) (110,326) (41,185)Fair Value Adjustments on Contingent Consideration . . . . . . . . . . . . . . . . . (21,073) — —Loss from Discontinued Operation . . . . . . . . . . . . . . . . . . . . . . . . . . . . . . — 12,928 21,369Employee Share-Based Compensation Expense . . . . . . . . . . . . . . . . . . . . . 110,359 101,416 64,901Excess Tax Benefits from Share-Based Compensation . . . . . . . . . . . . . . . . . (4,197) (10,032) (28,895)Deferred Income Tax Provision (Benefit) . . . . . . . . . . . . . . . . . . . . . . . . . (110,326) (80,692) 28,873Other, Net . . . . . . . . . . . . . . . . . . . . . . . . . . . . . . . . . . . . . . . . . . . . . . (17,507) (12,587) 4,608Change in Operating Assets and Liabilities, Net of Effect of Businesses
Acquired:Accounts Receivable . . . . . . . . . . . . . . . . . . . . . . . . . . . . . . . . . . . . . 100,205 (461,239) (296,120)Inventories . . . . . . . . . . . . . . . . . . . . . . . . . . . . . . . . . . . . . . . . . . . . (46,030) (581,981) (417,305)Other Current Assets . . . . . . . . . . . . . . . . . . . . . . . . . . . . . . . . . . . . . (312,950) (168,140) (45,794)Accounts Payable. . . . . . . . . . . . . . . . . . . . . . . . . . . . . . . . . . . . . . . . 41,277 230,596 74,815Other Current Liabilities . . . . . . . . . . . . . . . . . . . . . . . . . . . . . . . . . . . (178,751) 62,715 (108,362)Other, Net. . . . . . . . . . . . . . . . . . . . . . . . . . . . . . . . . . . . . . . . . . . . . (119,466) (31,104) (70,833)
Net Cash Provided by Operating Activities-Continuing Operations . . . . . 614,322 1,110,787 882,655Net Cash Used by Operating Activities-Discontinued Operation . . . . . . . — (6,219) (10,149)
Net Cash Provided by Operating Activities . . . . . . . . . . . . . . . . . . . . . 614,322 1,104,568 872,506
Cash Flows from Investing Activities:Acquisitions of Businesses, Net of Cash Acquired . . . . . . . . . . . . . . . . . . . . . (9,695) (798,530) (275,149)Capital Expenditures for Property, Plant and Equipment for Continuing
Operations . . . . . . . . . . . . . . . . . . . . . . . . . . . . . . . . . . . . . . . . . . . . . . (1,569,477) (2,484,163) (1,635,041)Acquisition of Intellectual Property . . . . . . . . . . . . . . . . . . . . . . . . . . . . . . . (34,210) (24,079) (23,035)Acquisition of Equity Investments in Unconsolidated Affiliates . . . . . . . . . . . . (26,999) (11,568) (335,220)Proceeds from Sale of Assets and Businesses, Net . . . . . . . . . . . . . . . . . . . . . 123,445 297,285 84,476Other Investing Activities . . . . . . . . . . . . . . . . . . . . . . . . . . . . . . . . . . . . . — — (38,500)
Net Cash Used by Investing Activities-Continuing Operations . . . . . . . . (1,516,936) (3,021,055) (2,222,469)Net Cash Provided (Used) by Investing Activities-Discontinued
Operation . . . . . . . . . . . . . . . . . . . . . . . . . . . . . . . . . . . . . . . . . . — 11,000 (10,579)
Net Cash Used by Investing Activities . . . . . . . . . . . . . . . . . . . . . . . . (1,516,936) (3,010,055) (2,233,048)
Cash Flows From Financing Activities:Borrowings of (Repayments on) Short-term Debt, Net . . . . . . . . . . . . . . . . . . (392,920) 477,821 117,865Borrowings of Long-term Debt . . . . . . . . . . . . . . . . . . . . . . . . . . . . . . . . . . 1,240,300 1,498,874 1,488,934Repayments on Long-term Debt . . . . . . . . . . . . . . . . . . . . . . . . . . . . . . . . . (13,714) (20,541) (18,171)Purchase of Treasury Shares . . . . . . . . . . . . . . . . . . . . . . . . . . . . . . . . . . . . — — (246,190)Proceeds from Exercise of Stock Options . . . . . . . . . . . . . . . . . . . . . . . . . . . 5,721 9,942 34,192Excess Tax Benefits from Share-Based Compensation . . . . . . . . . . . . . . . . . . 4,197 10,032 28,895Proceeds from Interest Rate Derivatives . . . . . . . . . . . . . . . . . . . . . . . . . . . . 63,544 (638) —Other Financing Activities, Net . . . . . . . . . . . . . . . . . . . . . . . . . . . . . . . . . . (973) 2,041 (3,896)
Net Cash Provided by Financing Activities-Continuing Operations . . . . . 906,155 1,977,531 1,401,629Net Cash Provided by Financing Activities-Discontinued Operation . . . . — — —
Net Cash Provided by Financing Activities . . . . . . . . . . . . . . . . . . . . . 906,155 1,977,531 1,401,629
Effect of Exchange Rate Changes on Cash and Cash Equivalents. . . . . . . . . . . . . 10,580 (4,360) 3,340Net Increase in Cash and Cash Equivalents . . . . . . . . . . . . . . . . . . . . . . . . . . . 14,121 67,684 44,427Cash and Cash Equivalents at Beginning of Year . . . . . . . . . . . . . . . . . . . . . . . 238,398 170,714 126,287
Cash and Cash Equivalents at End of Year . . . . . . . . . . . . . . . . . . . . . . . . . . . . $ 252,519 $ 238,398 $ 170,714
The accompanying notes are an integral part of these consolidated financial statements.
AR-45

WEATHERFORD INTERNATIONAL LTD. AND SUBSIDIARIES
NOTES TO CONSOLIDATED FINANCIAL STATEMENTS
1. Summary of Significant Accounting Policies
Basis of Presentation
In February 2009, Weatherford International Ltd., a Bermuda exempted company (“Weatherford Bermuda”)became a wholly-owned subsidiary of Weatherford International Ltd., a Swiss joint stock corporation (“Weath-erford Switzerland”) for purposes of changing the Company’s place of incorporation from Bermuda to Switzerland(collectively, the “Transaction”). Pursuant to the transaction, each common share, par value U.S. $1.00 per share, ofWeatherford Bermuda was exchanged for one registered share, par value 1.16 Swiss francs (“CHF”) per share, ofWeatherford Switzerland.
Principles of Consolidation
The consolidated financial statements include the accounts of Weatherford International Ltd., all majority-owned subsidiaries, all controlled joint ventures and variable interest entities where the Company has determined itis the primary beneficiary (collectively, “the Company”). When referring to Weatherford and using phrases such as“we” ,“us,” and “our,” the intent is to refer to Weatherford International Ltd. and its subsidiaries as a whole or on aregional basis, depending on the context in which the statements are made.
Investments in affiliates in which we exercise significant influence over operating and financial policies areaccounted for using the equity method. All material intercompany accounts and transactions have been eliminatedin consolidation.
Nature of Operations
We are one of the largest global providers of innovative mechanical solutions, technology and services for thedrilling and production sectors of the oil and natural gas industry.
Reclassifications
Certain reclassifications have been made to conform prior year financial information to the current periodpresentation.
Correction of an Immaterial Error in the Financial Statements
We have corrected our historical consolidated financial statements for the year ended December 31, 2008 forthe impact of an error in accounting for deferred taxes totaling $39 million. The result of this correction was anincrease of net income by the same amount. This error was identified in 2009 through the operation of our internalcontrols over financial reporting as it relates to our tax provision system. Using the guidance of Staff AccountingBulletin No. 99, “Materiality” and Staff Accounting Bulletin No. 108, “Considering the Effects of Prior YearMisstatements when Quantifying Misstatements in Current Year Financial Statements,” the determination tocorrect these consolidated financial statements was made as a result of our assessment that these items, althoughimmaterial to the consolidated financial statements for the year ended December 31, 2008, would be consideredmaterial to the consolidated financial statements for the year ended December 31, 2009.
The information included in this Form 10-K sets forth the effects of this correction on the previously reportedfinancial statements of operations for the year ended December 31, 2008.
AR-46
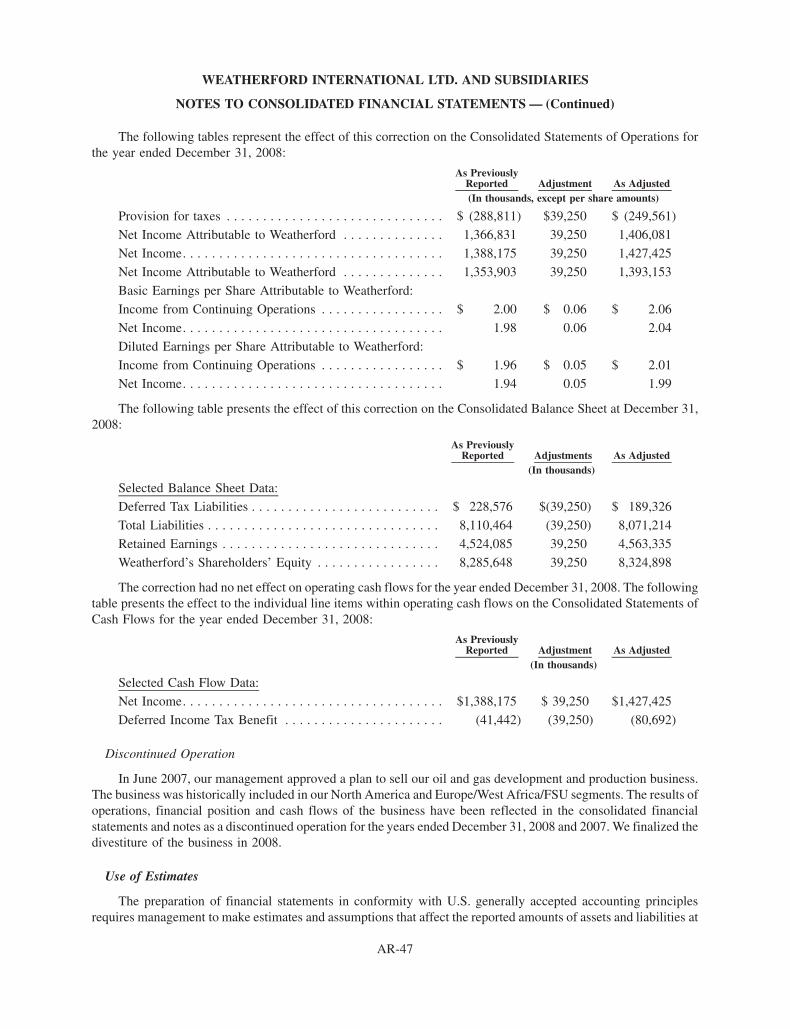
The following tables represent the effect of this correction on the Consolidated Statements of Operations forthe year ended December 31, 2008:
As PreviouslyReported Adjustment As Adjusted(In thousands, except per share amounts)
Provision for taxes . . . . . . . . . . . . . . . . . . . . . . . . . . . . . . $ (288,811) $39,250 $ (249,561)
Net Income Attributable to Weatherford . . . . . . . . . . . . . . 1,366,831 39,250 1,406,081
Net Income. . . . . . . . . . . . . . . . . . . . . . . . . . . . . . . . . . . . 1,388,175 39,250 1,427,425
Net Income Attributable to Weatherford . . . . . . . . . . . . . . 1,353,903 39,250 1,393,153
Basic Earnings per Share Attributable to Weatherford:
Income from Continuing Operations . . . . . . . . . . . . . . . . . $ 2.00 $ 0.06 $ 2.06
Net Income. . . . . . . . . . . . . . . . . . . . . . . . . . . . . . . . . . . . 1.98 0.06 2.04
Diluted Earnings per Share Attributable to Weatherford:
Income from Continuing Operations . . . . . . . . . . . . . . . . . $ 1.96 $ 0.05 $ 2.01
Net Income. . . . . . . . . . . . . . . . . . . . . . . . . . . . . . . . . . . . 1.94 0.05 1.99
The following table presents the effect of this correction on the Consolidated Balance Sheet at December 31,2008:
As PreviouslyReported Adjustments As Adjusted
(In thousands)
Selected Balance Sheet Data:
Deferred Tax Liabilities . . . . . . . . . . . . . . . . . . . . . . . . . . $ 228,576 $(39,250) $ 189,326
Total Liabilities . . . . . . . . . . . . . . . . . . . . . . . . . . . . . . . . 8,110,464 (39,250) 8,071,214
Retained Earnings . . . . . . . . . . . . . . . . . . . . . . . . . . . . . . 4,524,085 39,250 4,563,335
Weatherford’s Shareholders’ Equity . . . . . . . . . . . . . . . . . 8,285,648 39,250 8,324,898
The correction had no net effect on operating cash flows for the year ended December 31, 2008. The followingtable presents the effect to the individual line items within operating cash flows on the Consolidated Statements ofCash Flows for the year ended December 31, 2008:
As PreviouslyReported Adjustment As Adjusted
(In thousands)
Selected Cash Flow Data:
Net Income. . . . . . . . . . . . . . . . . . . . . . . . . . . . . . . . . . . . $1,388,175 $ 39,250 $1,427,425
Deferred Income Tax Benefit . . . . . . . . . . . . . . . . . . . . . . (41,442) (39,250) (80,692)
Discontinued Operation
In June 2007, our management approved a plan to sell our oil and gas development and production business.The business was historically included in our North America and Europe/West Africa/FSU segments. The results ofoperations, financial position and cash flows of the business have been reflected in the consolidated financialstatements and notes as a discontinued operation for the years ended December 31, 2008 and 2007. We finalized thedivestiture of the business in 2008.
Use of Estimates
The preparation of financial statements in conformity with U.S. generally accepted accounting principlesrequires management to make estimates and assumptions that affect the reported amounts of assets and liabilities at
AR-47
WEATHERFORD INTERNATIONAL LTD. AND SUBSIDIARIES
NOTES TO CONSOLIDATED FINANCIAL STATEMENTS — (Continued)
the date of the financial statements and the reported amounts of revenues and expenses during the reporting periodand disclosure of contingent liabilities. On an ongoing basis, we evaluate our estimates, including those related touncollectible accounts receivable, lower of cost or market value of inventories, equity investments, intangible assetsand goodwill, property, plant and equipment, income taxes, percentage-of-completion accounting for long-termcontracts, self-insurance, pension and postretirement benefit plans and contingent liabilities. We base our estimateson historical experience and on various other assumptions that are believed to be reasonable under the circum-stances, the results of which form the basis for making judgments about the carrying values of assets and liabilitiesnot readily apparent from other sources. Actual results could differ from those estimates.
Cash and Cash Equivalents
We consider all highly liquid investments with original maturities of three months or less to be cashequivalents.
Accounts Receivable and Allowance for Uncollectible Accounts
Accounts receivable are stated at the historical carrying amount net of allowances for uncollectible accounts.We establish an allowance for uncollectible accounts based on specific customer collection issues we haveidentified. Uncollectible accounts receivable are written off when a settlement is reached for an amount less than theoutstanding historical balance or when we determine the balance will not be collected.
Major Customers and Credit Risk
Substantially all of our customers are engaged in the energy industry. This concentration of customers mayimpact our overall exposure to credit risk, either positively or negatively, in that customers may be similarly affectedby changes in economic and industry conditions. We perform ongoing credit evaluations of our customers and donot generally require collateral in support of our trade receivables. We maintain reserves for potential credit losses,and actual losses have historically been within our expectations. International sales also present various risks,including risks of war, civil disturbances and governmental activities that may limit or disrupt markets, restrict themovement of funds, result in the deprivation of contract rights or the taking of property without fair consideration.Most of our international sales, however, are to large international or national companies. Revenue from PetroleosMexicanos (“Pemex”) accounted for approximately 13% of our revenues during 2009 and is included in our LatinAmerica segment (see Note 19). No other individual customer accounted for more than 10% of our consolidatedrevenues. During 2008 and 2007, no individual customer accounted for more than 10% of our consolidatedrevenues.
Inventories
We value our inventories at lower of cost or market using either the first-in, first-out (“FIFO”) or average costmethods. Cost represents third-party invoice or production cost. Production cost includes material, labor andmanufacturing overhead.
Property, Plant and Equipment
We carry our property, plant and equipment, both owned and under capital lease, at cost less accumulateddepreciation. The carrying values are based on our estimates and judgments relative to capitalized costs, useful livesand salvage value, where applicable. We expense maintenance and repairs as incurred. We capitalize expendituresfor renewals, replacements and improvements. We depreciate our fixed assets on a straight-line basis over theirestimated useful lives, allowing for salvage value where applicable. Our depreciation expense for the years ended
AR-48
WEATHERFORD INTERNATIONAL LTD. AND SUBSIDIARIES
NOTES TO CONSOLIDATED FINANCIAL STATEMENTS — (Continued)

December 31, 2009, 2008 and 2007 was $826 million, $669 million and $553 million, respectively. The estimateduseful lives of our major classes of property, plant and equipment are as follows:
EstimatedUseful Lives
Buildings and leasehold improvements . . . . . . . . . . . . . . . . . . . . . . . . . . 10-40 years or lease term
Rental and service equipment . . . . . . . . . . . . . . . . . . . . . . . . . . . . . . . . . 2-20 years
Machinery and other . . . . . . . . . . . . . . . . . . . . . . . . . . . . . . . . . . . . . . . 2-12 years
We classify our rig assets as Rental and Service Equipment on the Consolidated Balance Sheets.
Goodwill and Indefinite-Lived Intangible Assets
We test for the impairment of goodwill and other intangible assets with indefinite lives on at least an annualbasis. Our goodwill impairment test involves a comparison of the fair value of each of our reporting units with itscarrying amount. Our indefinite-lived asset impairment test involves a comparison of the fair value of the intangibleasset and its carrying value. Fair value is estimated using discounted cash flows using a discount rate adjusted for thecredit risk of the regional reporting unit tested. If the fair value is less than the carrying value, the asset is consideredimpaired. The amount of the impairment, if any, is then determined based on an allocation of the reporting unit fairvalues to individual assets and liabilities.
Intangible Assets
Our intangible assets, excluding goodwill, are acquired technology, licenses, patents, customer relationshipsand other identifiable intangible assets. Intangible assets are amortized on a straight-line basis over their estimatedeconomic lives generally ranging from two to 20 years, except for intangible assets with indefinite lives, which arenot amortized. As many areas of our business rely on patents and proprietary technology, we seek patent protectionboth inside and outside the U.S. for products and methods that appear to have commercial significance. Wecapitalize patent defense costs when we determine that a successful defense is probable.
Long-Lived Assets
We review our long-lived assets to determine whether any events or changes in circumstances indicate thecarrying amount of the assets may not be recoverable. Factors that might indicate a potential impairment mayinclude, but are not limited to, significant decreases in the market value of the long-lived asset, a significant changein the long-lived asset’s physical condition, a change in industry conditions or a reduction in cash flows associatedwith the use of the long-lived asset. If these or other factors indicate the carrying amount of the asset may not berecoverable, we determine whether an impairment has occurred through analysis of undiscounted cash flow of theasset at the lowest level that has an identifiable cash flow. If an impairment has occurred, we recognize a loss for thedifference between the carrying amount and the fair value of the asset. We measure the fair value of the asset usingmarket prices or, in the absence of market prices, based on an estimate of discounted cash flows. Cash flows aregenerally discounted using an interest rate commensurate with a weighted average cost of capital for a similar asset.
Pension and Postretirement Benefit Plans
We have defined benefit pension and other postretirement benefit plans covering certain of our employees.Costs of the plan are charged to income and consist of several components, known collectively as net periodicpension cost, which are based on various actuarial assumptions regarding future experience of the plans. Amountsrecorded for these defined benefit plans reflect estimates related to future interest rates, investment rates of return,employee turnover and wage increases. We review all assumptions and estimates on an ongoing basis. As ofDecember 31, 2009 and 2008, we have recognized the overfunded or underfunded status of our plans as an asset orliability in the Consolidated Balance Sheets.
AR-49
WEATHERFORD INTERNATIONAL LTD. AND SUBSIDIARIES
NOTES TO CONSOLIDATED FINANCIAL STATEMENTS — (Continued)
Research and Development Expenditures
Research and development expenditures are expensed as incurred.
Environmental Expenditures
Environmental expenditures that relate to the remediation of an existing condition caused by past operationand that do not contribute to future revenues are expensed. Liabilities for these expenditures are recorded when it isprobable that obligations have been incurred and costs can be reasonably estimated. Estimates are based onavailable facts and technology, enacted laws and regulations and our prior experience in remediation of contam-inated sites.
Insurance
We are self-insured up to certain retention limits for general liability, vehicle liability, group medical and forworkers’ compensation claims for certain of our employees. The amounts in excess of the self-insured levels arefully insured, up to a limit. Self-insurance accruals are based on claims filed and an estimate for significant claimsincurred but not reported.
Derivative Financial Instruments
We record derivative instruments at fair value in the balance sheet as either an asset or a liability. Changes inthe fair value of derivatives are recorded each period in current earnings or other comprehensive income, dependingon whether the derivative is designated as part of a hedge relationship, and if so, the type of hedge transaction. Anygain or loss associated with the termination of an interest rate swap that was accounted for as a hedge instrument isdeferred and amortized as an adjustment to interest expense over the remaining debt term.
Foreign Currency
Results of operations for our foreign subsidiaries with functional currencies other than the U.S. dollar aretranslated using average exchange rates during the period. Assets and liabilities of these foreign subsidiaries aretranslated using the exchange rates in effect at the balance sheet dates, and the resulting translation adjustments areincluded as Accumulated Other Comprehensive Income, a component of shareholders’ equity.
For our non-U.S. subsidiaries where the functional currency is the U.S. dollar, inventories, property, plant andequipment and other non-monetary assets and liabilities, together with their related elements of expense or income,are translated at historical exchange rates. All other assets and liabilities are translated at current exchange rates. Allother revenues and expenses are translated at average exchange rates. Translation gains and losses for thesesubsidiaries are recognized in our results of operations during the period incurred. The gain or loss related toindividual foreign currency transactions are included in results of operations when incurred. These currency gainsand losses are included in Other, Net in our Consolidated Statements of Income.
Employee Share-Based Compensation
We account for all share-based payment awards, including shares issued under employee stock purchase plans,stock options, restricted stock and stock appreciation rights by measuring the fair value of employee stock-basedawards granted at the grant date and recognizing it as an expense over the service period, which is usually thevesting period.
Income Taxes
Income taxes have been provided based upon the tax laws and rates in the countries in which our operations areconducted and income is earned. Deferred tax assets and liabilities are recognized for the future tax consequences
AR-50
WEATHERFORD INTERNATIONAL LTD. AND SUBSIDIARIES
NOTES TO CONSOLIDATED FINANCIAL STATEMENTS — (Continued)
attributable to differences between the financial statement carrying amounts of existing assets and liabilities andtheir respective tax bases. A valuation allowance for deferred tax assets is recorded when it is more likely than notthat some or all of the benefit from the deferred tax asset will not be realized. The impact of an uncertain tax positiontaken or expected to be taken on an income tax return are recognized in the financial statements at the largestamount that is more likely than not to be sustained upon examination by the relevant taxing authority.
Revenue Recognition
Revenue is recognized when all of the following criteria have been met: a) evidence of an arrangement exists,b) delivery to and acceptance by the customer has occurred, c) the price to the customer is fixed or determinable andd) collectability is reasonably assured.
Both contract drilling and pipeline service revenue is contractual by nature and both are day-rate basedcontracts. We recognize revenue for these contracts based on the criteria outlined above, which is consistent withour other product offerings.
From time to time, we may receive revenues for preparation and mobilization of equipment and personnel. Inconnection with new drilling contracts, revenues earned and incremental costs incurred directly related topreparation and mobilization are deferred and recognized over the primary contract term of the project usingthe straight-line method. Costs of relocating equipment without contracts to more promising market areas areexpensed as incurred. Demobilization fees received are recognized, along with any related expenses, uponcompletion of contracts.
We incur rebillable expenses including shipping and handling, third-party inspection and repairs, and customand duties. We recognize the revenue associated with these rebillable expenses as Products Revenues and all relatedcosts as Cost of Products in the accompanying Consolidated Statements of Income.
Percentage of Completion
Revenue from long-term contracts, primarily for our integrated project management services, is reported onthe percentage-of-completion method of accounting. This method of accounting requires us to calculate contractprofit to be recognized in each reporting period for each contract based upon our projections of future outcomes,which include:
• estimates of the total cost to complete the project;
• estimates of project schedule and completion date;
• estimates of the extent of progress toward completion; and
• amounts of any change orders or claims included in revenue.
Measurements of progress are generally output based related to physical progress. At the outset of eachcontract, we prepare a detailed analysis of our estimated cost to complete the project. Risks related to servicedelivery, usage, productivity, and other factors are considered in the estimation process. We periodically evaluatethe estimated costs, claims, change orders, and percentage of completion at the contract level. The recording ofprofits and losses on long-term contracts requires an estimate of the total profit or loss over the life of each contract.This estimate requires consideration of total contract value, change orders, and claims, less costs incurred andestimated costs to complete. Anticipated losses on contracts are recorded in full in the period in which they becomeevident. Profits are recorded based upon the total estimated contract profit times the current percentage complete forthe contract.
AR-51
WEATHERFORD INTERNATIONAL LTD. AND SUBSIDIARIES
NOTES TO CONSOLIDATED FINANCIAL STATEMENTS — (Continued)
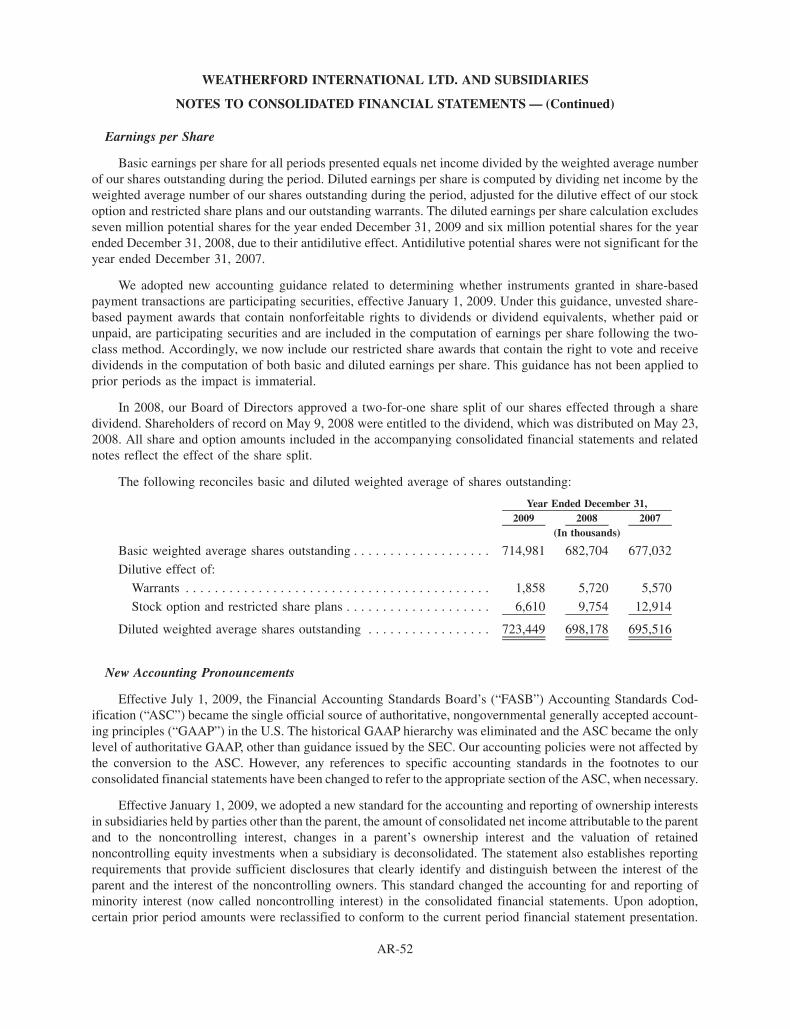
Earnings per Share
Basic earnings per share for all periods presented equals net income divided by the weighted average numberof our shares outstanding during the period. Diluted earnings per share is computed by dividing net income by theweighted average number of our shares outstanding during the period, adjusted for the dilutive effect of our stockoption and restricted share plans and our outstanding warrants. The diluted earnings per share calculation excludesseven million potential shares for the year ended December 31, 2009 and six million potential shares for the yearended December 31, 2008, due to their antidilutive effect. Antidilutive potential shares were not significant for theyear ended December 31, 2007.
We adopted new accounting guidance related to determining whether instruments granted in share-basedpayment transactions are participating securities, effective January 1, 2009. Under this guidance, unvested share-based payment awards that contain nonforfeitable rights to dividends or dividend equivalents, whether paid orunpaid, are participating securities and are included in the computation of earnings per share following the two-class method. Accordingly, we now include our restricted share awards that contain the right to vote and receivedividends in the computation of both basic and diluted earnings per share. This guidance has not been applied toprior periods as the impact is immaterial.
In 2008, our Board of Directors approved a two-for-one share split of our shares effected through a sharedividend. Shareholders of record on May 9, 2008 were entitled to the dividend, which was distributed on May 23,2008. All share and option amounts included in the accompanying consolidated financial statements and relatednotes reflect the effect of the share split.
The following reconciles basic and diluted weighted average of shares outstanding:
2009 2008 2007Year Ended December 31,
(In thousands)
Basic weighted average shares outstanding . . . . . . . . . . . . . . . . . . . 714,981 682,704 677,032
Dilutive effect of:
Warrants . . . . . . . . . . . . . . . . . . . . . . . . . . . . . . . . . . . . . . . . . . 1,858 5,720 5,570
Stock option and restricted share plans . . . . . . . . . . . . . . . . . . . . 6,610 9,754 12,914
Diluted weighted average shares outstanding . . . . . . . . . . . . . . . . . 723,449 698,178 695,516
New Accounting Pronouncements
Effective July 1, 2009, the Financial Accounting Standards Board’s (“FASB”) Accounting Standards Cod-ification (“ASC”) became the single official source of authoritative, nongovernmental generally accepted account-ing principles (“GAAP”) in the U.S. The historical GAAP hierarchy was eliminated and the ASC became the onlylevel of authoritative GAAP, other than guidance issued by the SEC. Our accounting policies were not affected bythe conversion to the ASC. However, any references to specific accounting standards in the footnotes to ourconsolidated financial statements have been changed to refer to the appropriate section of the ASC, when necessary.
Effective January 1, 2009, we adopted a new standard for the accounting and reporting of ownership interestsin subsidiaries held by parties other than the parent, the amount of consolidated net income attributable to the parentand to the noncontrolling interest, changes in a parent’s ownership interest and the valuation of retainednoncontrolling equity investments when a subsidiary is deconsolidated. The statement also establishes reportingrequirements that provide sufficient disclosures that clearly identify and distinguish between the interest of theparent and the interest of the noncontrolling owners. This standard changed the accounting for and reporting ofminority interest (now called noncontrolling interest) in the consolidated financial statements. Upon adoption,certain prior period amounts were reclassified to conform to the current period financial statement presentation.
AR-52
WEATHERFORD INTERNATIONAL LTD. AND SUBSIDIARIES
NOTES TO CONSOLIDATED FINANCIAL STATEMENTS — (Continued)

2. Business Combinations
Effective January 1, 2009, we adopted a new standard on accounting for business combinations. This standardestablished principles and requirements for how a company recognizes assets acquired, liabilities assumed,contingencies and contingent consideration measured at fair value at the acquisition date. The statement alsoestablishes disclosure requirements which will enable users to evaluate the nature and financial effect of thebusiness combination.
We have acquired businesses we feel are important to our long-term growth strategy. Results of operations foracquisitions are included in the accompanying Consolidated Statements of Income from the date of acquisition. Thebalances included in the Consolidated Balance Sheets related to recent acquisitions are based on preliminaryinformation and are subject to change when final asset valuations are obtained and the potential for liabilities hasbeen evaluated. Purchase price is allocated to the net assets acquired based upon their estimated fair values at thedate of acquisition.
In July 2009, we acquired the Oilfield Services Division (“OFS”) of TNK-BP. In this transaction, we acquireddrilling, well workover and cementing services operations in West Siberia, East Siberia and the Volga-Urals region.We issued 24.3 million shares valued at approximately $450 million and expect to pay $45 million in additional cashconsideration related to working capital adjustments during the first quarter of 2010. In addition, if TNK-BP sellsthe shares it received in consideration for the transaction for a price less than $18.50 per share prior to June 29, 2010,we are obligated to pay TNK-BP additional consideration in an amount equal to the difference between the price atwhich the shares were sold and $18.50. We will pay any additional consideration in cash or, at our option in certaininstances, in additional shares following such date. We made a preliminary allocation of the purchase price as of thedate of the acquisition. We will continue to adjust the allocations until final valuation of the assets and liabilities arecompleted.
The new accounting guidance adopted on business combinations requires contingent consideration to berecognized at its acquisition date fair value. Based on the terms of the arrangement, we classified the contingentconsideration as a liability. This new guidance requires such liabilities to be remeasured to fair value at eachreporting date until the contingency is resolved, with changes in fair value being recognized in earnings. Weestimated the fair value of the contingent consideration for the OFS acquisition at the date of acquisition to be aliability of $84 million. This liability was estimated to have a fair value of $63 million at December 31, 2009,resulting in the recognition of a $21 million gain during 2009. This gain was recorded in the Selling, General andAdministrative Attributable to Segments line in the Consolidated Statements of Income. The valuation of thecontingent consideration was determined using a lattice-based model incorporating the term of the contingency, theprice of our shares over the relevant periods and the volatility of our stock price.
In November 2008, we acquired a group of affiliated companies in Latin America, which provide projectmanagement services, drilling fluids, contract drilling and environmental services in that region. Consideration forthe transaction totaled approximately $160 million, which was comprised of approximately six million sharesvalued at approximately $65 million, non-cash consideration of approximately $75 million and cash of approx-imately $20 million. An additional $65 million in cash consideration for this acquisition is contingent on theoccurrence of future events and circumstances and will be recorded by us when and if these events occur.
In August 2008, we acquired International Logging, Inc. (“ILI”), a provider of surface logging and formationand evaluation and drilling related services for approximately $400 million. We allocated approximately $140 mil-lion of the purchase price to intangible assets (See Note 8).
We also acquired various other businesses during the years ended December 31, 2009, 2008 and 2007 for cashconsideration of approximately $54 million, $380 million and $253 million, respectively. In addition, other 2009acquisitions included the issuance of approximately 11 million shares valued at $222 million and other 2008acquisitions included the issuance of approximately two million shares valued at approximately $65 million.
AR-53
WEATHERFORD INTERNATIONAL LTD. AND SUBSIDIARIES
NOTES TO CONSOLIDATED FINANCIAL STATEMENTS — (Continued)
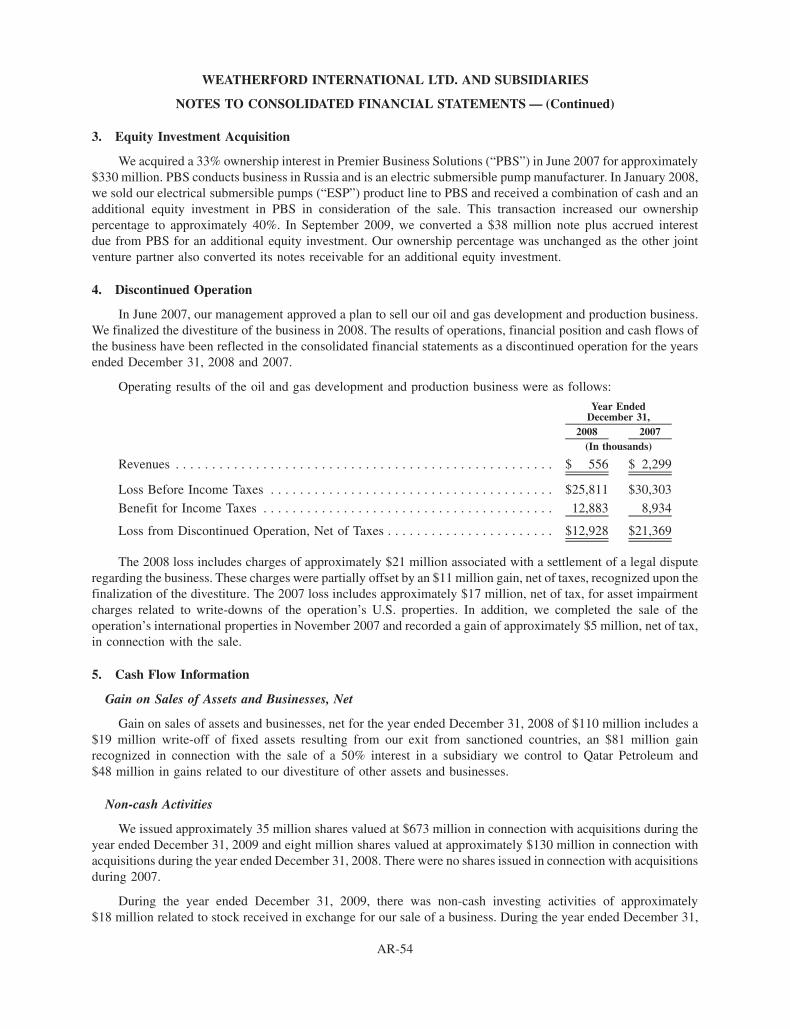
3. Equity Investment Acquisition
We acquired a 33% ownership interest in Premier Business Solutions (“PBS”) in June 2007 for approximately$330 million. PBS conducts business in Russia and is an electric submersible pump manufacturer. In January 2008,we sold our electrical submersible pumps (“ESP”) product line to PBS and received a combination of cash and anadditional equity investment in PBS in consideration of the sale. This transaction increased our ownershippercentage to approximately 40%. In September 2009, we converted a $38 million note plus accrued interestdue from PBS for an additional equity investment. Our ownership percentage was unchanged as the other jointventure partner also converted its notes receivable for an additional equity investment.
4. Discontinued Operation
In June 2007, our management approved a plan to sell our oil and gas development and production business.We finalized the divestiture of the business in 2008. The results of operations, financial position and cash flows ofthe business have been reflected in the consolidated financial statements as a discontinued operation for the yearsended December 31, 2008 and 2007.
Operating results of the oil and gas development and production business were as follows:
2008 2007
Year EndedDecember 31,
(In thousands)
Revenues . . . . . . . . . . . . . . . . . . . . . . . . . . . . . . . . . . . . . . . . . . . . . . . . . . . . $ 556 $ 2,299
Loss Before Income Taxes . . . . . . . . . . . . . . . . . . . . . . . . . . . . . . . . . . . . . . . $25,811 $30,303
Benefit for Income Taxes . . . . . . . . . . . . . . . . . . . . . . . . . . . . . . . . . . . . . . . . 12,883 8,934
Loss from Discontinued Operation, Net of Taxes . . . . . . . . . . . . . . . . . . . . . . . $12,928 $21,369
The 2008 loss includes charges of approximately $21 million associated with a settlement of a legal disputeregarding the business. These charges were partially offset by an $11 million gain, net of taxes, recognized upon thefinalization of the divestiture. The 2007 loss includes approximately $17 million, net of tax, for asset impairmentcharges related to write-downs of the operation’s U.S. properties. In addition, we completed the sale of theoperation’s international properties in November 2007 and recorded a gain of approximately $5 million, net of tax,in connection with the sale.
5. Cash Flow Information
Gain on Sales of Assets and Businesses, Net
Gain on sales of assets and businesses, net for the year ended December 31, 2008 of $110 million includes a$19 million write-off of fixed assets resulting from our exit from sanctioned countries, an $81 million gainrecognized in connection with the sale of a 50% interest in a subsidiary we control to Qatar Petroleum and$48 million in gains related to our divestiture of other assets and businesses.
Non-cash Activities
We issued approximately 35 million shares valued at $673 million in connection with acquisitions during theyear ended December 31, 2009 and eight million shares valued at approximately $130 million in connection withacquisitions during the year ended December 31, 2008. There were no shares issued in connection with acquisitionsduring 2007.
During the year ended December 31, 2009, there was non-cash investing activities of approximately$18 million related to stock received in exchange for our sale of a business. During the year ended December 31,
AR-54
WEATHERFORD INTERNATIONAL LTD. AND SUBSIDIARIES
NOTES TO CONSOLIDATED FINANCIAL STATEMENTS — (Continued)

2008, there were non-cash investing activities of approximately $75 million related to our consideration for anacquisition. During the year ended December 31, 2007, there was a non-cash investing activity of $20 millionrelated to a note received in exchange for our sale of a business.
Supplemental Cash Flow Information
Cash paid for interest and income taxes, net of refunds, was as follows:
2009 2008 2007Year Ended December 31,
(In thousands)
Interest paid, net of capitalized interest . . . . . . . . . . . . . . . . . . . $331,862 $233,468 $184,093
Income taxes paid, net of refunds . . . . . . . . . . . . . . . . . . . . . . . 389,652 271,418 372,025
6. Inventories
Inventories by category were as follows:
2009 2008December 31,
(In thousands)
Raw materials, components and supplies . . . . . . . . . . . . . . . . . . . . . . . . $ 328,253 $ 346,258
Work in process . . . . . . . . . . . . . . . . . . . . . . . . . . . . . . . . . . . . . . . . . . . 115,564 152,864
Finished goods . . . . . . . . . . . . . . . . . . . . . . . . . . . . . . . . . . . . . . . . . . . 1,795,945 1,589,220
$2,239,762 $2,088,342
Work in process and finished goods inventories include the cost of materials, labor and plant overhead.
7. Goodwill
Goodwill is evaluated for impairment on at least an annual basis. We perform our annual goodwill impairmenttest as of October 1. Our 2009 impairment test indicated goodwill was not impaired. We will continue to test ourgoodwill annually as of October 1 unless events occur or circumstances change between annual tests that wouldmore likely than not reduce the fair value of a reporting unit below its carrying amount.
Our operating segments consist of the following reporting units:
• North America — (i) United States and (ii) Canada
• Middle East/North Africa/Asia — (i) Middle East/North Africa and (ii) Asia Pacific
• Europe/West Africa/FSU — (i) Europe, (ii) West Africa and (iii) FSU
• Latin America
AR-55
WEATHERFORD INTERNATIONAL LTD. AND SUBSIDIARIES
NOTES TO CONSOLIDATED FINANCIAL STATEMENTS — (Continued)
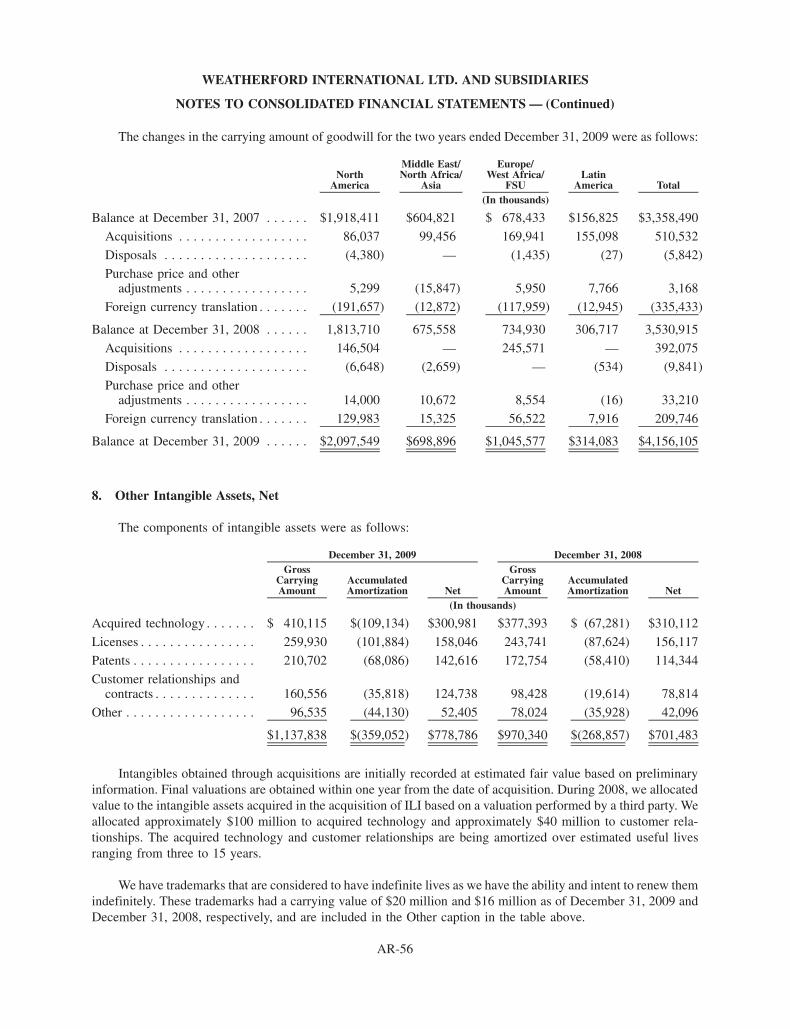
The changes in the carrying amount of goodwill for the two years ended December 31, 2009 were as follows:
NorthAmerica
Middle East/North Africa/
Asia
Europe/West Africa/
FSULatin
America Total(In thousands)
Balance at December 31, 2007 . . . . . . $1,918,411 $604,821 $ 678,433 $156,825 $3,358,490
Acquisitions . . . . . . . . . . . . . . . . . . 86,037 99,456 169,941 155,098 510,532
Disposals . . . . . . . . . . . . . . . . . . . . (4,380) — (1,435) (27) (5,842)
Purchase price and otheradjustments . . . . . . . . . . . . . . . . . 5,299 (15,847) 5,950 7,766 3,168
Foreign currency translation . . . . . . . (191,657) (12,872) (117,959) (12,945) (335,433)
Balance at December 31, 2008 . . . . . . 1,813,710 675,558 734,930 306,717 3,530,915
Acquisitions . . . . . . . . . . . . . . . . . . 146,504 — 245,571 — 392,075
Disposals . . . . . . . . . . . . . . . . . . . . (6,648) (2,659) — (534) (9,841)
Purchase price and otheradjustments . . . . . . . . . . . . . . . . . 14,000 10,672 8,554 (16) 33,210
Foreign currency translation . . . . . . . 129,983 15,325 56,522 7,916 209,746
Balance at December 31, 2009 . . . . . . $2,097,549 $698,896 $1,045,577 $314,083 $4,156,105
8. Other Intangible Assets, Net
The components of intangible assets were as follows:
GrossCarryingAmount
AccumulatedAmortization Net
GrossCarryingAmount
AccumulatedAmortization Net
December 31, 2009 December 31, 2008
(In thousands)
Acquired technology . . . . . . . $ 410,115 $(109,134) $300,981 $377,393 $ (67,281) $310,112
Licenses . . . . . . . . . . . . . . . . 259,930 (101,884) 158,046 243,741 (87,624) 156,117
Patents . . . . . . . . . . . . . . . . . 210,702 (68,086) 142,616 172,754 (58,410) 114,344
Customer relationships andcontracts . . . . . . . . . . . . . . 160,556 (35,818) 124,738 98,428 (19,614) 78,814
Other . . . . . . . . . . . . . . . . . . 96,535 (44,130) 52,405 78,024 (35,928) 42,096
$1,137,838 $(359,052) $778,786 $970,340 $(268,857) $701,483
Intangibles obtained through acquisitions are initially recorded at estimated fair value based on preliminaryinformation. Final valuations are obtained within one year from the date of acquisition. During 2008, we allocatedvalue to the intangible assets acquired in the acquisition of ILI based on a valuation performed by a third party. Weallocated approximately $100 million to acquired technology and approximately $40 million to customer rela-tionships. The acquired technology and customer relationships are being amortized over estimated useful livesranging from three to 15 years.
We have trademarks that are considered to have indefinite lives as we have the ability and intent to renew themindefinitely. These trademarks had a carrying value of $20 million and $16 million as of December 31, 2009 andDecember 31, 2008, respectively, and are included in the Other caption in the table above.
AR-56
WEATHERFORD INTERNATIONAL LTD. AND SUBSIDIARIES
NOTES TO CONSOLIDATED FINANCIAL STATEMENTS — (Continued)

Amortization expense was $81 million, $63 million and $54 million for the years ended December 31, 2009,2008 and 2007, respectively. Future estimated amortization expense for the carrying amount of intangible assets asof December 31, 2009 is expected to be as follows (in thousands):
2010 . . . . . . . . . . . . . . . . . . . . . . . . . . . . . . . . . . . . . . . . . . . . . . . . . . . . . . . . . . . . . . . . $87,033
2011 . . . . . . . . . . . . . . . . . . . . . . . . . . . . . . . . . . . . . . . . . . . . . . . . . . . . . . . . . . . . . . . . 84,470
2012 . . . . . . . . . . . . . . . . . . . . . . . . . . . . . . . . . . . . . . . . . . . . . . . . . . . . . . . . . . . . . . . . 81,496
2013 . . . . . . . . . . . . . . . . . . . . . . . . . . . . . . . . . . . . . . . . . . . . . . . . . . . . . . . . . . . . . . . . 78,585
2014 . . . . . . . . . . . . . . . . . . . . . . . . . . . . . . . . . . . . . . . . . . . . . . . . . . . . . . . . . . . . . . . . 72,294
9. Short-term Borrowings and Current Portion of Long-term Debt
2009 2008December 31,
(In thousands)
Revolving credit facility . . . . . . . . . . . . . . . . . . . . . . . . . . . . . . . . . . . . . . $798,500 $1,068,000
Commercial paper program. . . . . . . . . . . . . . . . . . . . . . . . . . . . . . . . . . . . — 127,884
Other short-term bank loans . . . . . . . . . . . . . . . . . . . . . . . . . . . . . . . . . . . 53,007 44,205
Total short-term borrowings . . . . . . . . . . . . . . . . . . . . . . . . . . . . . . . . . . . 851,507 1,240,089
Current portion of long-term debt . . . . . . . . . . . . . . . . . . . . . . . . . . . . . . . 18,074 15,858
Short-term borrowings and current portion of long-term debt . . . . . . . . . . . $869,581 $1,255,947
Weighted average interest rate on short-term borrowings outstanding atend of year . . . . . . . . . . . . . . . . . . . . . . . . . . . . . . . . . . . . . . . . . . . . . . 1.39% 1.07%
We maintain various revolving credit facilities with syndicates of banks that can be used for a combination ofborrowings, support for our commercial paper program and issuances of letters of credit. At December 31, 2009,these facilities allow for an aggregate availability of $1.8 billion and mature in May 2011. The weighted averageinterest rate on outstanding borrowings of these facilities at December 31, 2009 was 1.3%. There were $72 millionin outstanding letters of credit under these facilities at December 31, 2009.
These borrowing facilities require us to maintain a debt-to-capitalization ratio of less than 60% and containother covenants and representations customary for an investment-grade commercial credit. We are in compliancewith these covenants at December 31, 2009.
We have a $1.5 billion commercial paper program under which we may from time to time issue short-termunsecured notes. The commercial paper program is supported by our revolving credit facilities. There was nocommercial paper outstanding at December 31, 2009.
We have short-term borrowings with various domestic and international institutions pursuant to uncommittedfacilities. At December 31, 2009, we had $53 million in short-term borrowings under these arrangements with aweighted average interest rate of 2.7%. In addition, we had $210 million of letters of credit and bid and performancebonds under these uncommitted facilities.
The carrying value of our short-term borrowings approximates their fair value as of December 31, 2009.
AR-57
WEATHERFORD INTERNATIONAL LTD. AND SUBSIDIARIES
NOTES TO CONSOLIDATED FINANCIAL STATEMENTS — (Continued)
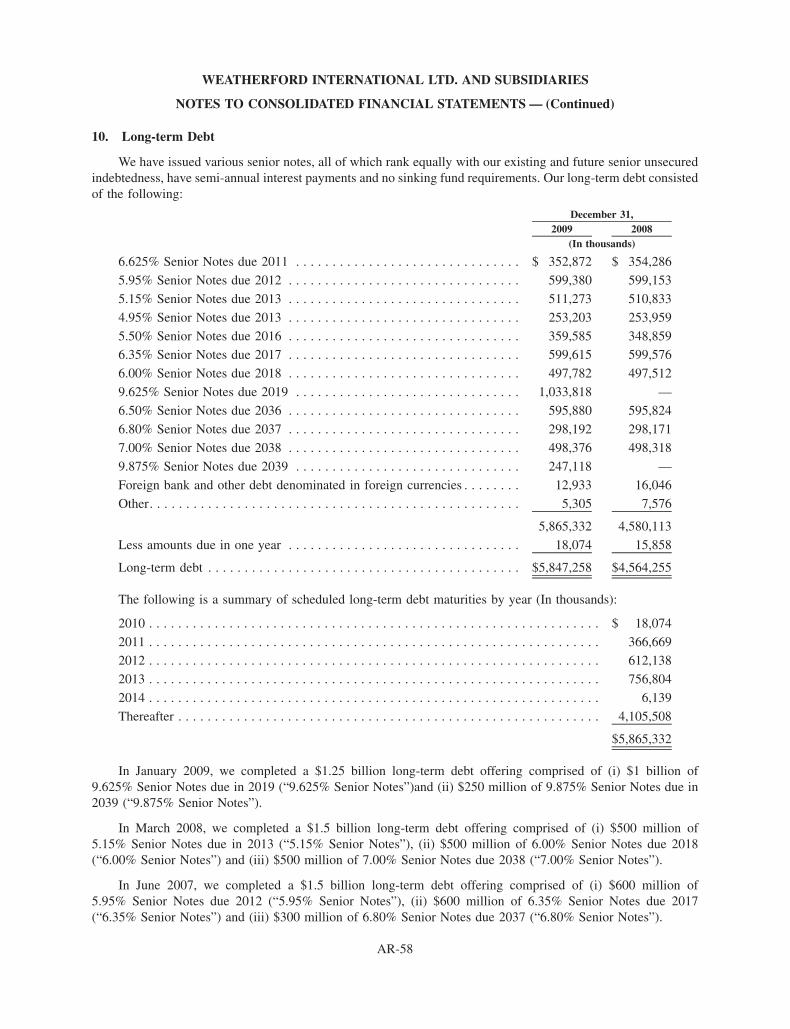
10. Long-term Debt
We have issued various senior notes, all of which rank equally with our existing and future senior unsecuredindebtedness, have semi-annual interest payments and no sinking fund requirements. Our long-term debt consistedof the following:
2009 2008December 31,
(In thousands)
6.625% Senior Notes due 2011 . . . . . . . . . . . . . . . . . . . . . . . . . . . . . . . $ 352,872 $ 354,286
5.95% Senior Notes due 2012 . . . . . . . . . . . . . . . . . . . . . . . . . . . . . . . . 599,380 599,153
5.15% Senior Notes due 2013 . . . . . . . . . . . . . . . . . . . . . . . . . . . . . . . . 511,273 510,833
4.95% Senior Notes due 2013 . . . . . . . . . . . . . . . . . . . . . . . . . . . . . . . . 253,203 253,959
5.50% Senior Notes due 2016 . . . . . . . . . . . . . . . . . . . . . . . . . . . . . . . . 359,585 348,8596.35% Senior Notes due 2017 . . . . . . . . . . . . . . . . . . . . . . . . . . . . . . . . 599,615 599,576
6.00% Senior Notes due 2018 . . . . . . . . . . . . . . . . . . . . . . . . . . . . . . . . 497,782 497,512
9.625% Senior Notes due 2019 . . . . . . . . . . . . . . . . . . . . . . . . . . . . . . . 1,033,818 —
6.50% Senior Notes due 2036 . . . . . . . . . . . . . . . . . . . . . . . . . . . . . . . . 595,880 595,824
6.80% Senior Notes due 2037 . . . . . . . . . . . . . . . . . . . . . . . . . . . . . . . . 298,192 298,171
7.00% Senior Notes due 2038 . . . . . . . . . . . . . . . . . . . . . . . . . . . . . . . . 498,376 498,318
9.875% Senior Notes due 2039 . . . . . . . . . . . . . . . . . . . . . . . . . . . . . . . 247,118 —
Foreign bank and other debt denominated in foreign currencies . . . . . . . . 12,933 16,046
Other. . . . . . . . . . . . . . . . . . . . . . . . . . . . . . . . . . . . . . . . . . . . . . . . . . . 5,305 7,576
5,865,332 4,580,113
Less amounts due in one year . . . . . . . . . . . . . . . . . . . . . . . . . . . . . . . . 18,074 15,858
Long-term debt . . . . . . . . . . . . . . . . . . . . . . . . . . . . . . . . . . . . . . . . . . . $5,847,258 $4,564,255
The following is a summary of scheduled long-term debt maturities by year (In thousands):
2010 . . . . . . . . . . . . . . . . . . . . . . . . . . . . . . . . . . . . . . . . . . . . . . . . . . . . . . . . . . . . . . $ 18,074
2011 . . . . . . . . . . . . . . . . . . . . . . . . . . . . . . . . . . . . . . . . . . . . . . . . . . . . . . . . . . . . . . 366,6692012 . . . . . . . . . . . . . . . . . . . . . . . . . . . . . . . . . . . . . . . . . . . . . . . . . . . . . . . . . . . . . . 612,138
2013 . . . . . . . . . . . . . . . . . . . . . . . . . . . . . . . . . . . . . . . . . . . . . . . . . . . . . . . . . . . . . . 756,804
2014 . . . . . . . . . . . . . . . . . . . . . . . . . . . . . . . . . . . . . . . . . . . . . . . . . . . . . . . . . . . . . . 6,139
Thereafter . . . . . . . . . . . . . . . . . . . . . . . . . . . . . . . . . . . . . . . . . . . . . . . . . . . . . . . . . . 4,105,508
$5,865,332
In January 2009, we completed a $1.25 billion long-term debt offering comprised of (i) $1 billion of9.625% Senior Notes due in 2019 (“9.625% Senior Notes”)and (ii) $250 million of 9.875% Senior Notes due in2039 (“9.875% Senior Notes”).
In March 2008, we completed a $1.5 billion long-term debt offering comprised of (i) $500 million of5.15% Senior Notes due in 2013 (“5.15% Senior Notes”), (ii) $500 million of 6.00% Senior Notes due 2018(“6.00% Senior Notes”) and (iii) $500 million of 7.00% Senior Notes due 2038 (“7.00% Senior Notes”).
In June 2007, we completed a $1.5 billion long-term debt offering comprised of (i) $600 million of5.95% Senior Notes due 2012 (“5.95% Senior Notes”), (ii) $600 million of 6.35% Senior Notes due 2017(“6.35% Senior Notes”) and (iii) $300 million of 6.80% Senior Notes due 2037 (“6.80% Senior Notes”).
AR-58
WEATHERFORD INTERNATIONAL LTD. AND SUBSIDIARIES
NOTES TO CONSOLIDATED FINANCIAL STATEMENTS — (Continued)

The weighted average effective interest rates on our Senior Notes for 2009 was 6.64%. The effective rate wasdetermined after giving consideration to the effect of interest rate derivatives accounted for as hedges and theamortization of any discounts (See Note 12).
11. Fair Value of Financial Instruments
Financial Instruments Measured and Recognized at Fair Value
On January 1, 2008, we adopted new accounting guidance on fair value measurements. The new guidancedefines fair value, establishes a framework for measuring fair value under U.S. generally accepted accountingprinciples, and expands disclosures about fair value measurements. The new guidance was effective for usbeginning January 1, 2008, for certain assets and liabilities measured at fair value on a recurring basis. The newguidance was effective for non-financial assets and liabilities recognized or disclosed at fair value on a nonrecurringbasis beginning January 1, 2009.
The accounting guidance establishes a valuation hierarchy for disclosure of the inputs to the valuations used tomeasure fair value. This hierarchy prioritizes the inputs into three broad levels as follows. Level 1 inputs are quotedprices (unadjusted) in active markets for identical assets or liabilities. Level 2 inputs are quoted prices for similarassets and liabilities in active markets or inputs that are observable for the asset or liability, either directly orindirectly through market corroboration, for substantially the full term of the financial instrument. Level 3 inputsare unobservable inputs based upon our own assumptions used to measure assets and liabilities at fair value. Afinancial asset or liability’s classification within the hierarchy is determined based on the lowest level of input that issignificant to the fair value measurement.
The following table presents our non-derivative assets and liabilities that are measured and recognized at fairvalue on a recurring basis classified under the appropriate level of the fair value hierarchy as of December 31, 2009and 2008:
Level 1 Level 2 Level 3 TotalDecember 31, 2009
(In thousands)
Other Assets:
Other investments . . . . . . . . . . . . . . . . . . . . . . . . . . . . $— $40,822 $ — $40,822
Other Current Liabilities:
Contingent consideration on acquisition (See Note 2) . . — — 62,763 62,763
Level 1 Level 2 Level 3 TotalDecember 31, 2008
(In thousands)
Other Assets:
Other investments . . . . . . . . . . . . . . . . . . . . . . . . . . . . . $— $30,611 $— $30,611
AR-59
WEATHERFORD INTERNATIONAL LTD. AND SUBSIDIARIES
NOTES TO CONSOLIDATED FINANCIAL STATEMENTS — (Continued)
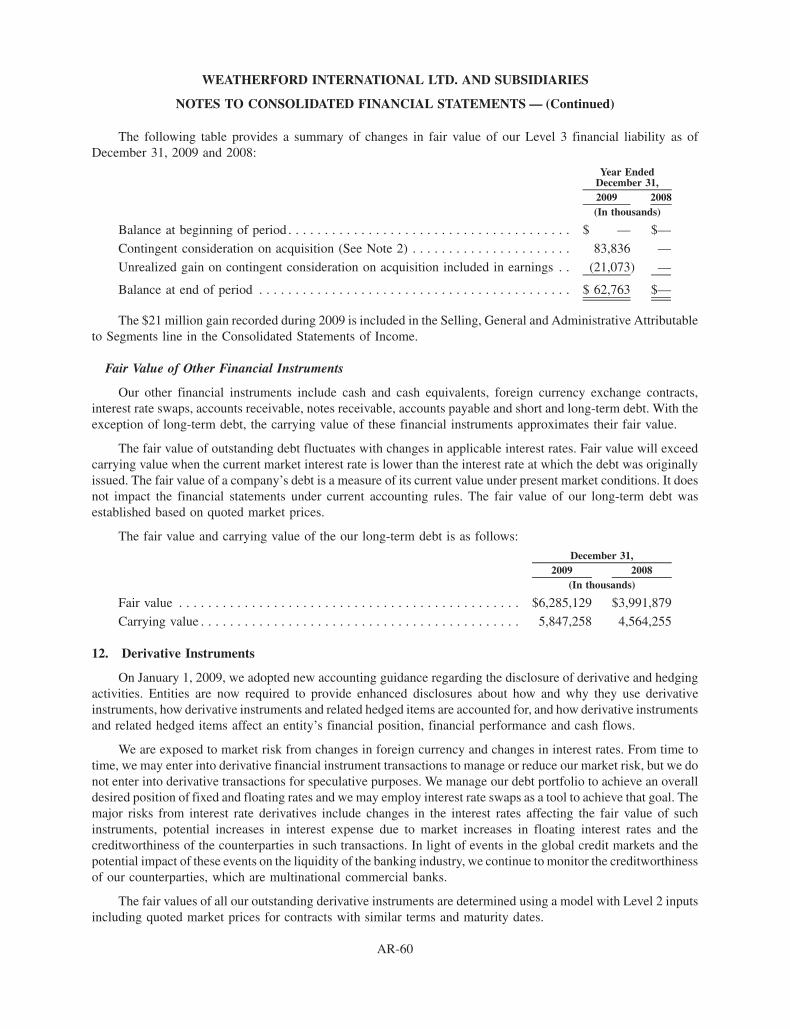
The following table provides a summary of changes in fair value of our Level 3 financial liability as ofDecember 31, 2009 and 2008:
2009 2008
Year EndedDecember 31,
(In thousands)
Balance at beginning of period . . . . . . . . . . . . . . . . . . . . . . . . . . . . . . . . . . . . . . . $ — $—
Contingent consideration on acquisition (See Note 2) . . . . . . . . . . . . . . . . . . . . . . 83,836 —
Unrealized gain on contingent consideration on acquisition included in earnings . . (21,073) —
Balance at end of period . . . . . . . . . . . . . . . . . . . . . . . . . . . . . . . . . . . . . . . . . . . $ 62,763 $—
The $21 million gain recorded during 2009 is included in the Selling, General and Administrative Attributableto Segments line in the Consolidated Statements of Income.
Fair Value of Other Financial Instruments
Our other financial instruments include cash and cash equivalents, foreign currency exchange contracts,interest rate swaps, accounts receivable, notes receivable, accounts payable and short and long-term debt. With theexception of long-term debt, the carrying value of these financial instruments approximates their fair value.
The fair value of outstanding debt fluctuates with changes in applicable interest rates. Fair value will exceedcarrying value when the current market interest rate is lower than the interest rate at which the debt was originallyissued. The fair value of a company’s debt is a measure of its current value under present market conditions. It doesnot impact the financial statements under current accounting rules. The fair value of our long-term debt wasestablished based on quoted market prices.
The fair value and carrying value of the our long-term debt is as follows:
2009 2008December 31,
(In thousands)
Fair value . . . . . . . . . . . . . . . . . . . . . . . . . . . . . . . . . . . . . . . . . . . . . . . $6,285,129 $3,991,879
Carrying value . . . . . . . . . . . . . . . . . . . . . . . . . . . . . . . . . . . . . . . . . . . . 5,847,258 4,564,255
12. Derivative Instruments
On January 1, 2009, we adopted new accounting guidance regarding the disclosure of derivative and hedgingactivities. Entities are now required to provide enhanced disclosures about how and why they use derivativeinstruments, how derivative instruments and related hedged items are accounted for, and how derivative instrumentsand related hedged items affect an entity’s financial position, financial performance and cash flows.
We are exposed to market risk from changes in foreign currency and changes in interest rates. From time totime, we may enter into derivative financial instrument transactions to manage or reduce our market risk, but we donot enter into derivative transactions for speculative purposes. We manage our debt portfolio to achieve an overalldesired position of fixed and floating rates and we may employ interest rate swaps as a tool to achieve that goal. Themajor risks from interest rate derivatives include changes in the interest rates affecting the fair value of suchinstruments, potential increases in interest expense due to market increases in floating interest rates and thecreditworthiness of the counterparties in such transactions. In light of events in the global credit markets and thepotential impact of these events on the liquidity of the banking industry, we continue to monitor the creditworthinessof our counterparties, which are multinational commercial banks.
The fair values of all our outstanding derivative instruments are determined using a model with Level 2 inputsincluding quoted market prices for contracts with similar terms and maturity dates.
AR-60
WEATHERFORD INTERNATIONAL LTD. AND SUBSIDIARIES
NOTES TO CONSOLIDATED FINANCIAL STATEMENTS — (Continued)

Interest Rate Swaps
We use interest rate swaps to help mitigate exposures related to interest rate movements. Amounts receivedupon termination of the swaps accounted for as fair value hedges represent the fair value of the agreements at thetime of termination and are recorded as an adjustment to the carrying value of the related debt. These amounts arebeing amortized as a reduction to interest expense over the remaining term of the debt.
In August 2009, we entered into interest rate swap agreements to pay a variable interest rate and receive a fixedinterest rate with an aggregate notional amount of $1.2 billion against our 5.15%, 5.50% and 9.625% Senior Notes.These swaps were designed as fair value hedges and were terminated in December 2009. As a result of theseterminations, we received a cash settlement of $53 million. In addition, we received $11 million in interestpayments while the interest rate swaps were open. The gains associated with these interest rate swap terminationshave been deferred and will be amortized over the remaining term of our 5.15%, 5.50% and 9.625% Senior Notes.
In December 2008, we entered into an interest rate swap agreement on an aggregate notional amount of$150 million against one of our revolving credit facilities. This agreement matured in June 2009.
Upon completion of the long-term debt offering in March 2008, we entered into interest rate swap agreementswith an aggregate notional amount of $500 million against our 5.15% Senior Notes. These swaps were designed asfair value hedges and were terminated in December 2008. As a result of these terminations, we received cashproceeds, net of accrued interest, of $12 million. The gain associated with these interest rate swap terminations hasbeen deferred and will be amortized over the remaining term of the 5.15% Senior Notes.
We have no interest rate swaps outstanding at December 31, 2009. As of December 31, 2009 and 2008, we hadnet unamortized gains of $68 million and $21 million, respectively, associated with interest rate swap terminations.
Cash Flow Hedges
In March 2008, we entered into interest rate derivative instruments with a notional amount of $500 million tohedge projected exposures to interest rates in anticipation of the 7.00% Senior Notes issued in March 2008. Thosehedges were terminated at the time of the issuance. We paid a cash settlement of $13 million at termination, and theloss on these hedges is being amortized from Accumulated Other Comprehensive Income to interest expense overthe life of the 7.00% Senior Notes.
As of December 31, 2009, we had net unamortized losses of $13 million associated with our cash flow hedgeterminations.
Other Derivative Instruments
As of December 31, 2009 and 2008, we had several foreign currency forward and option contracts withnotional amounts aggregating to $1,062 million and $503 million, respectively, which were entered into to hedgeexposure to currency fluctuations in various foreign currencies, including, but not limited to, the British poundsterling, the Canadian dollar, the euro and the Norwegian krone. The total estimated fair value of these contracts atDecember 31, 2009 resulted in a net liability of approximately $9 million and at December 31, 2008, resulted in aliability of approximately $2 million. These derivative instruments were not designated as hedges and the changesin fair value of the contracts are recorded each period in Other, Net in the accompanying Consolidated Statements ofIncome.
We have cross-currency swaps between the U.S. dollar and Canadian dollar to hedge certain exposures to theCanadian dollar. At December 31, 2009 and 2008, we had notional amounts outstanding of $263 million and$280 million, respectively. The total estimated fair value of these contracts at December 31, 2009 and 2008 resultedin a liability of $26 million and an asset of $1 million, respectively. These derivative instruments were notdesignated as hedges and the changes in fair value of the contracts are recorded each period in Other, Net in theaccompanying Consolidated Statements of Income.
AR-61
WEATHERFORD INTERNATIONAL LTD. AND SUBSIDIARIES
NOTES TO CONSOLIDATED FINANCIAL STATEMENTS — (Continued)

The fair values of outstanding derivative instruments are summarized as follows:
2009 2008 ClassificationsDecember 31,
(In thousands)
Derivative assets not designated as hedges:
Foreign exchange contracts . . . . . . . . . . . . . . . . . $ 9,831 $ — Other Current Assets
Cross-currency swap contracts . . . . . . . . . . . . . . . — 1,455 Other Assets
Derivative liabilities not designated as hedges:Foreign exchange contracts . . . . . . . . . . . . . . . . . 18,939 2,233 Other Current Liabilities
Cross-currency swap contracts . . . . . . . . . . . . . . . 26,170 — Other Liabilities
13. Shareholders’ Equity
Accumulated other comprehensive income is comprised of the following:
2009 2008 2007For the Years Ended December 31,
(In thousands)
Cumulative translation adjustment . . . . . . . . . . . . . . . . . . . . . . $188,768 $(190,317) $495,935
Cumulative defined benefit plan adjustments . . . . . . . . . . . . . . (60,636) (62,444) (56,239)
Deferred loss on derivative instruments, net of amortization . . . (13,390) (14,000) (1,908)
$114,742 $(266,761) $437,788
Changes in our Issued and Treasury shares during the years ended December 31, 2009, 2008 and 2007 were asfollows:
Issued Treasury(In thousands)
Balance at December 31, 2006. . . . . . . . . . . . . . . . . . . . . . . . . . . . . . . . . . . . . 723,842 (44,264)
Purchase of treasury shares . . . . . . . . . . . . . . . . . . . . . . . . . . . . . . . . . . . . . — (10,224)
Equity awards granted, vested and exercised . . . . . . . . . . . . . . . . . . . . . . . . . 3,362 5,502
Other. . . . . . . . . . . . . . . . . . . . . . . . . . . . . . . . . . . . . . . . . . . . . . . . . . . . . . — (32)
Balance at December 31, 2007. . . . . . . . . . . . . . . . . . . . . . . . . . . . . . . . . . . . . 727,204 (49,018)
Shares issued for acquisitions . . . . . . . . . . . . . . . . . . . . . . . . . . . . . . . . . . . . — 7,709
Equity awards granted, vested and exercised . . . . . . . . . . . . . . . . . . . . . . . . . 1,433 924
Other. . . . . . . . . . . . . . . . . . . . . . . . . . . . . . . . . . . . . . . . . . . . . . . . . . . . . . 52 18
Balance at December 31, 2008. . . . . . . . . . . . . . . . . . . . . . . . . . . . . . . . . . . . . 728,689 (40,367)
Shares issued for acquisitions . . . . . . . . . . . . . . . . . . . . . . . . . . . . . . . . . . . . 29,578 5,398
Equity awards granted, vested and exercised . . . . . . . . . . . . . . . . . . . . . . . . . — 6,030
Other. . . . . . . . . . . . . . . . . . . . . . . . . . . . . . . . . . . . . . . . . . . . . . . . . . . . . . 180 138
Balance at December 31, 2009. . . . . . . . . . . . . . . . . . . . . . . . . . . . . . . . . . . . . 758,447 (28,801)
Authorized Shares
At December 31, 2009, we are authorized to issue 1,093,303 registered shares and conditionally authorized toissue 364,434 registered shares.
AR-62
WEATHERFORD INTERNATIONAL LTD. AND SUBSIDIARIES
NOTES TO CONSOLIDATED FINANCIAL STATEMENTS — (Continued)

Share Repurchase Program
We have an approved share repurchase program under which we can spend up to $1 billion to repurchase ouroutstanding shares. We purchased approximately 10 million shares during the year ended December 31, 2007 at anaverage price per share of $24.08 under this program. No shares were repurchased during the years endedDecember 31, 2009 and 2008. As of December 31, 2009, we had $205 million available under this authorization torepurchase shares.
Warrants
We have outstanding warrants to purchase up to 12.9 million of our shares at a price of $15.00 per share. Thewarrants remains exercisable until February 28, 2012 and are subject to adjustment for changes in our capitalstructure or the issuance of dividends in cash, securities or property. Upon exercise by the holders, settlement mayoccur through physical delivery, net share settlement, net cash settlement or a combination of those choices. The netcash settlement option upon exercise is at our sole discretion.
14. Share-Based Compensation Plans
Incentive Plan
The Weatherford International Ltd. 2006 Omnibus Incentive Plan (“Omnibus Plan”) provides for awards ofoptions, stock appreciation rights, restricted share awards (“RSA”), restricted share units (“RSU”), performanceshare awards, performance unit awards, other share-based awards and cash-based awards to any employee or ournon-employee directors. To date, we have granted stock options, RSAs and RSUs under the Omnibus Plan. Theprovisions of each award vary based on the type of award granted and are specified by the Compensation Committeeof our Board of Directors. Those awards, such as stock options that are based on a specific contractual term, will begranted with a term not to exceed ten years. Upon grant of an RSA, the participant has the rights of a shareholder,including but not limited to the right to vote such shares and the right to receive any dividends paid on such shares.Recipients of RSU awards will not have the rights of a shareholder until such date as the shares are issued ortransferred to the recipient. As of December 31, 2009, approximately two million shares were available for grantunder the Omnibus Plan. All stock options, RSA and RSU awards have been made from the Omnibus Plan since itsapproval in 2006. The terms of the awards granted under the prior plans are consistent with the awards issued underthe Omnibus plan.
Share-Based Compensation Expense and Activity
We recognized the following employee share-based compensation expense during the years ended Decem-ber 31, 2009, 2008 and 2007:
2009 2008 2007
Year EndedDecember 31,
(In thousands)
Share-based compensation . . . . . . . . . . . . . . . . . . . . . . . . . . . . . $110,359 $101,416 $64,901
Related tax benefit . . . . . . . . . . . . . . . . . . . . . . . . . . . . . . . . . . . 38,626 35,496 22,715
The estimated fair value of our stock options is expensed over their vesting period. Our stock options generallyvest after one to four years following the date of grant. We use the Black-Scholes option pricing model to determinethe fair value of stock options awarded as of the date of grant. There were no stock options granted in 2009 or 2008.The expected volatility of stock options granted in 2007 was determined using a blended rate based upon impliedvolatility calculated on actively traded options on our shares and upon the historical volatility of our shares. Therisk-free interest rate is determined based upon the interest rate on a U.S. Treasury Bill with a term equal to theexpected life of the stock option at the time of grant. In estimating the expected lives of the stock options, we have
AR-63
WEATHERFORD INTERNATIONAL LTD. AND SUBSIDIARIES
NOTES TO CONSOLIDATED FINANCIAL STATEMENTS — (Continued)

relied primarily on actual experience with previous stock option grants. The expected life is less than the term of thestock option as holders, in our experience, exercise or forfeit the stock options during the term of the stock option.
Year EndedDecember 31, 2007
Expected volatility . . . . . . . . . . . . . . . . . . . . . . . . . . . . . . . . . . . . . . . . . . . . . . . . 31.0%
Expected dividends . . . . . . . . . . . . . . . . . . . . . . . . . . . . . . . . . . . . . . . . . . . . . . . —
Expected term (in years) . . . . . . . . . . . . . . . . . . . . . . . . . . . . . . . . . . . . . . . . . . . 5.0
Risk-free rate . . . . . . . . . . . . . . . . . . . . . . . . . . . . . . . . . . . . . . . . . . . . . . . . . . . . 4.5%
A summary of option activity for the year ended December 31, 2009, is presented below:
Options
Weighted-AverageExercise
Price
Weighted-Average
RemainingContractual
Term
AggregateIntrinsic
Value(In years) (In thousands)
Outstanding at December 31, 2008 . . . . . . . . . . . . . . . 13,995,269 $8.14
Granted . . . . . . . . . . . . . . . . . . . . . . . . . . . . . . . . . . . — —
Exercised . . . . . . . . . . . . . . . . . . . . . . . . . . . . . . . . . . (1,147,233) 4.99
Forfeited . . . . . . . . . . . . . . . . . . . . . . . . . . . . . . . . . . — —
Outstanding at December 31, 2009 . . . . . . . . . . . . . . . 12,848,036 8.42 5.08 $124,787
Vested or Expected to Vest at December 31, 2009 . . . . 12,848,036 8.42 5.08 124,787
Exercisable at December 31, 2009 . . . . . . . . . . . . . . . 12,308,386 7.89 5.02 124,787
Stock options are granted with an exercise price equal to or greater than the fair market value of our shares atthe time of grant. The weighted-average grant date fair value of stock options granted during 2007 was $7.16. Therewere no stock options granted during 2009 or 2008. The intrinsic value of stock options exercised during 2009, 2008and 2007 was $18 million, $46 million and $110 million, respectively. As of December 31, 2009, there was$2 million of unrecognized compensation expense related to our unvested stock options, which is expected to berecognized over a weighted-average period of one year.
RSAs and RSUs vest based on continued employment, generally over a two to five-year period. The fair valueof RSAs and RSUs is determined based on the closing price of our shares on the date of grant. The total fair value,less assumed forfeitures, is expensed over the vesting period. A summary of RSAs and RSUs activity for the yearended December 31, 2009 is presented below:
RSA
Weighted-AverageGrant DateFair Value RSU
Weighted-AverageGrant DateFair Value
Non-Vested at December 31, 2008 . . . . 7,378,848 $26.16 6,112,874 $27.40
Granted . . . . . . . . . . . . . . . . . . . . . . . . 3,430,302 12.74 3,435,614 14.60
Vested . . . . . . . . . . . . . . . . . . . . . . . . . (3,970,188) 20.31 (2,623,354) 21.94
Forfeited . . . . . . . . . . . . . . . . . . . . . . . (296,977) 25.86 (632,650) 23.99
Non-Vested at December 31, 2009 . . . . 6,541,985 22.84 6,292,484 23.20
The weighted-average grant date fair value of RSAs and RSUs granted during the years ended 2009, 2008 and2007 was $13.67, $32.55 and $25.42, respectively. The total fair value of RSAs and RSUs vested during the yearsended 2009, 2008 and 2007 was $99 million, $40 million and $156 million, respectively. As of December 31, 2009,there was $217 million of unrecognized compensation expense related to unvested RSAs and RSUs, which isexpected to be recognized over a weighted-average period of two years.
AR-64
WEATHERFORD INTERNATIONAL LTD. AND SUBSIDIARIES
NOTES TO CONSOLIDATED FINANCIAL STATEMENTS — (Continued)
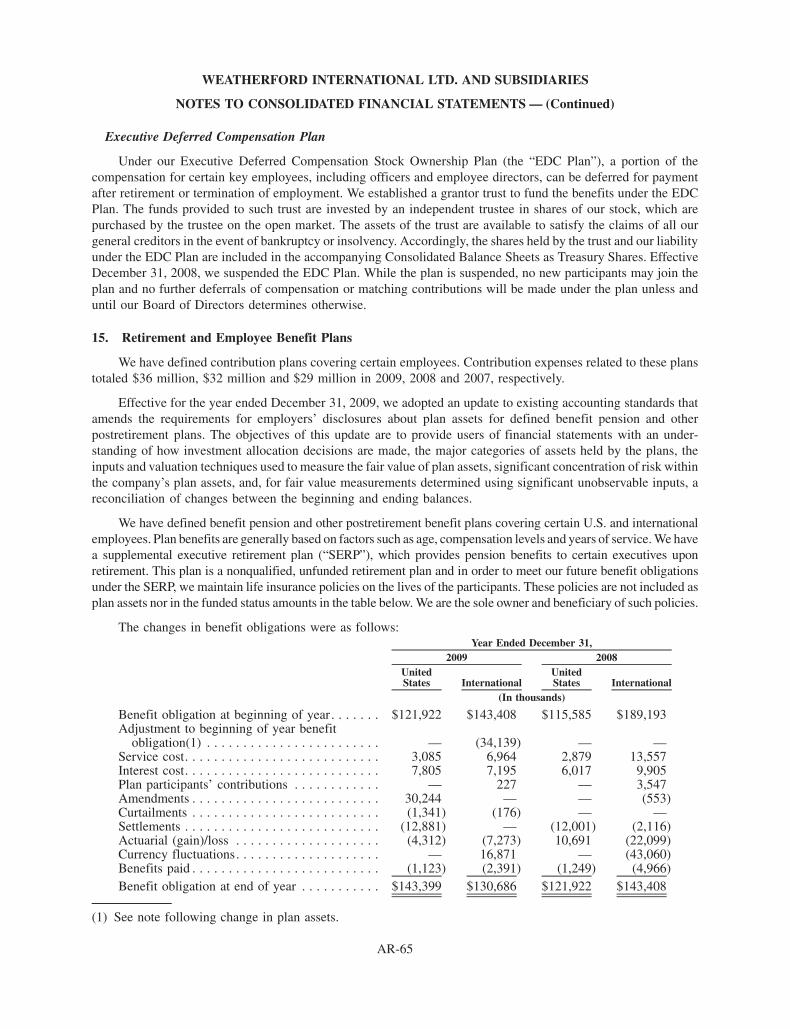
Executive Deferred Compensation Plan
Under our Executive Deferred Compensation Stock Ownership Plan (the “EDC Plan”), a portion of thecompensation for certain key employees, including officers and employee directors, can be deferred for paymentafter retirement or termination of employment. We established a grantor trust to fund the benefits under the EDCPlan. The funds provided to such trust are invested by an independent trustee in shares of our stock, which arepurchased by the trustee on the open market. The assets of the trust are available to satisfy the claims of all ourgeneral creditors in the event of bankruptcy or insolvency. Accordingly, the shares held by the trust and our liabilityunder the EDC Plan are included in the accompanying Consolidated Balance Sheets as Treasury Shares. EffectiveDecember 31, 2008, we suspended the EDC Plan. While the plan is suspended, no new participants may join theplan and no further deferrals of compensation or matching contributions will be made under the plan unless anduntil our Board of Directors determines otherwise.
15. Retirement and Employee Benefit Plans
We have defined contribution plans covering certain employees. Contribution expenses related to these planstotaled $36 million, $32 million and $29 million in 2009, 2008 and 2007, respectively.
Effective for the year ended December 31, 2009, we adopted an update to existing accounting standards thatamends the requirements for employers’ disclosures about plan assets for defined benefit pension and otherpostretirement plans. The objectives of this update are to provide users of financial statements with an under-standing of how investment allocation decisions are made, the major categories of assets held by the plans, theinputs and valuation techniques used to measure the fair value of plan assets, significant concentration of risk withinthe company’s plan assets, and, for fair value measurements determined using significant unobservable inputs, areconciliation of changes between the beginning and ending balances.
We have defined benefit pension and other postretirement benefit plans covering certain U.S. and internationalemployees. Plan benefits are generally based on factors such as age, compensation levels and years of service. We havea supplemental executive retirement plan (“SERP”), which provides pension benefits to certain executives uponretirement. This plan is a nonqualified, unfunded retirement plan and in order to meet our future benefit obligationsunder the SERP, we maintain life insurance policies on the lives of the participants. These policies are not included asplan assets nor in the funded status amounts in the table below. We are the sole owner and beneficiary of such policies.
The changes in benefit obligations were as follows:
UnitedStates International
UnitedStates International
2009 2008Year Ended December 31,
(In thousands)
Benefit obligation at beginning of year. . . . . . . $121,922 $143,408 $115,585 $189,193Adjustment to beginning of year benefit
obligation(1) . . . . . . . . . . . . . . . . . . . . . . . . — (34,139) — —Service cost. . . . . . . . . . . . . . . . . . . . . . . . . . . 3,085 6,964 2,879 13,557Interest cost. . . . . . . . . . . . . . . . . . . . . . . . . . . 7,805 7,195 6,017 9,905Plan participants’ contributions . . . . . . . . . . . . — 227 — 3,547Amendments . . . . . . . . . . . . . . . . . . . . . . . . . . 30,244 — — (553)Curtailments . . . . . . . . . . . . . . . . . . . . . . . . . . (1,341) (176) — —Settlements . . . . . . . . . . . . . . . . . . . . . . . . . . . (12,881) — (12,001) (2,116)Actuarial (gain)/loss . . . . . . . . . . . . . . . . . . . . (4,312) (7,273) 10,691 (22,099)Currency fluctuations. . . . . . . . . . . . . . . . . . . . — 16,871 — (43,060)Benefits paid . . . . . . . . . . . . . . . . . . . . . . . . . . (1,123) (2,391) (1,249) (4,966)Benefit obligation at end of year . . . . . . . . . . . $143,399 $130,686 $121,922 $143,408
(1) See note following change in plan assets.
AR-65
WEATHERFORD INTERNATIONAL LTD. AND SUBSIDIARIES
NOTES TO CONSOLIDATED FINANCIAL STATEMENTS — (Continued)
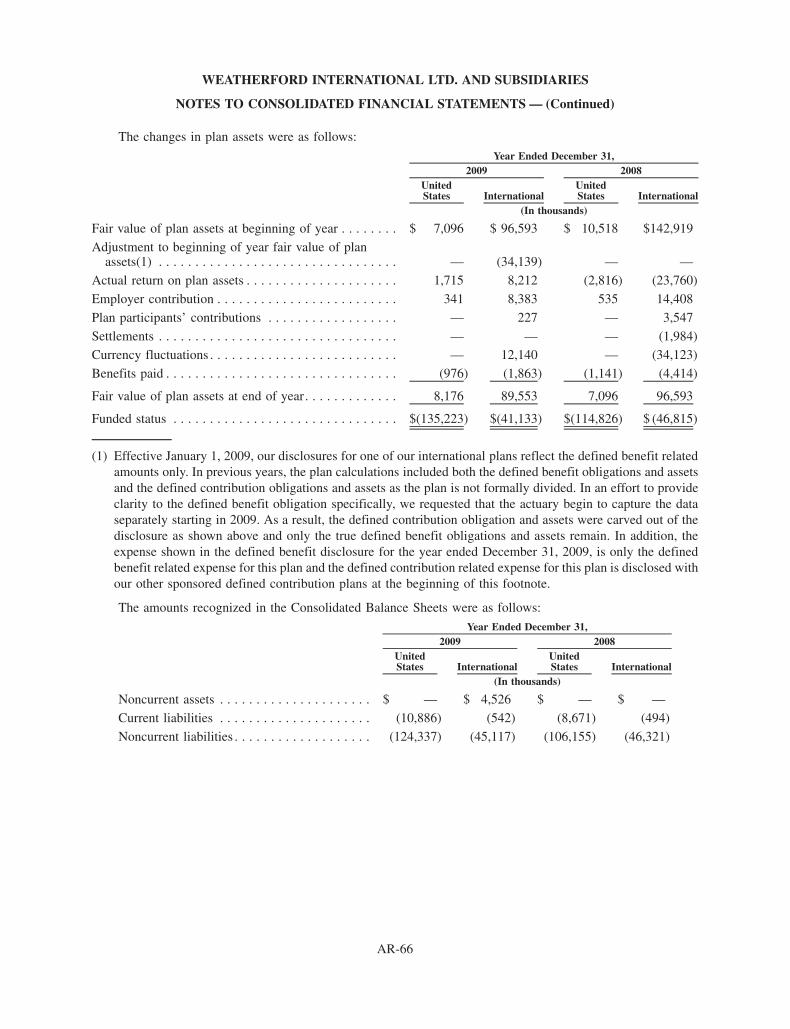
The changes in plan assets were as follows:
UnitedStates International
UnitedStates International
2009 2008Year Ended December 31,
(In thousands)
Fair value of plan assets at beginning of year . . . . . . . . $ 7,096 $ 96,593 $ 10,518 $142,919
Adjustment to beginning of year fair value of planassets(1) . . . . . . . . . . . . . . . . . . . . . . . . . . . . . . . . . — (34,139) — —
Actual return on plan assets . . . . . . . . . . . . . . . . . . . . . 1,715 8,212 (2,816) (23,760)
Employer contribution . . . . . . . . . . . . . . . . . . . . . . . . . 341 8,383 535 14,408
Plan participants’ contributions . . . . . . . . . . . . . . . . . . — 227 — 3,547
Settlements . . . . . . . . . . . . . . . . . . . . . . . . . . . . . . . . . — — — (1,984)
Currency fluctuations . . . . . . . . . . . . . . . . . . . . . . . . . . — 12,140 — (34,123)
Benefits paid . . . . . . . . . . . . . . . . . . . . . . . . . . . . . . . . (976) (1,863) (1,141) (4,414)
Fair value of plan assets at end of year. . . . . . . . . . . . . 8,176 89,553 7,096 96,593
Funded status . . . . . . . . . . . . . . . . . . . . . . . . . . . . . . . $(135,223) $(41,133) $(114,826) $ (46,815)
(1) Effective January 1, 2009, our disclosures for one of our international plans reflect the defined benefit relatedamounts only. In previous years, the plan calculations included both the defined benefit obligations and assetsand the defined contribution obligations and assets as the plan is not formally divided. In an effort to provideclarity to the defined benefit obligation specifically, we requested that the actuary begin to capture the dataseparately starting in 2009. As a result, the defined contribution obligation and assets were carved out of thedisclosure as shown above and only the true defined benefit obligations and assets remain. In addition, theexpense shown in the defined benefit disclosure for the year ended December 31, 2009, is only the definedbenefit related expense for this plan and the defined contribution related expense for this plan is disclosed withour other sponsored defined contribution plans at the beginning of this footnote.
The amounts recognized in the Consolidated Balance Sheets were as follows:
UnitedStates International
UnitedStates International
2009 2008Year Ended December 31,
(In thousands)
Noncurrent assets . . . . . . . . . . . . . . . . . . . . . $ — $ 4,526 $ — $ —
Current liabilities . . . . . . . . . . . . . . . . . . . . . (10,886) (542) (8,671) (494)
Noncurrent liabilities . . . . . . . . . . . . . . . . . . . (124,337) (45,117) (106,155) (46,321)
AR-66
WEATHERFORD INTERNATIONAL LTD. AND SUBSIDIARIES
NOTES TO CONSOLIDATED FINANCIAL STATEMENTS — (Continued)
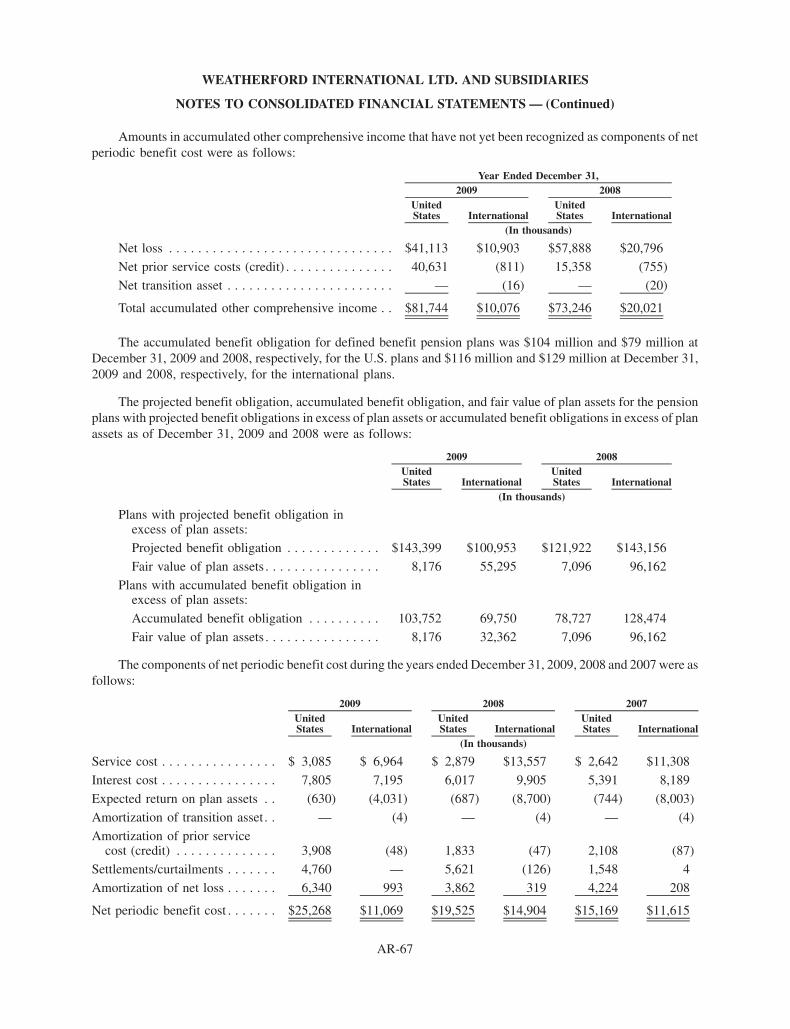
Amounts in accumulated other comprehensive income that have not yet been recognized as components of netperiodic benefit cost were as follows:
UnitedStates International
UnitedStates International
2009 2008Year Ended December 31,
(In thousands)
Net loss . . . . . . . . . . . . . . . . . . . . . . . . . . . . . . . $41,113 $10,903 $57,888 $20,796
Net prior service costs (credit) . . . . . . . . . . . . . . . 40,631 (811) 15,358 (755)
Net transition asset . . . . . . . . . . . . . . . . . . . . . . . — (16) — (20)
Total accumulated other comprehensive income . . $81,744 $10,076 $73,246 $20,021
The accumulated benefit obligation for defined benefit pension plans was $104 million and $79 million atDecember 31, 2009 and 2008, respectively, for the U.S. plans and $116 million and $129 million at December 31,2009 and 2008, respectively, for the international plans.
The projected benefit obligation, accumulated benefit obligation, and fair value of plan assets for the pensionplans with projected benefit obligations in excess of plan assets or accumulated benefit obligations in excess of planassets as of December 31, 2009 and 2008 were as follows:
UnitedStates International
UnitedStates International
2009 2008
(In thousands)
Plans with projected benefit obligation inexcess of plan assets:Projected benefit obligation . . . . . . . . . . . . . $143,399 $100,953 $121,922 $143,156
Fair value of plan assets . . . . . . . . . . . . . . . . 8,176 55,295 7,096 96,162
Plans with accumulated benefit obligation inexcess of plan assets:
Accumulated benefit obligation . . . . . . . . . . 103,752 69,750 78,727 128,474
Fair value of plan assets . . . . . . . . . . . . . . . . 8,176 32,362 7,096 96,162
The components of net periodic benefit cost during the years ended December 31, 2009, 2008 and 2007 were asfollows:
UnitedStates International
UnitedStates International
UnitedStates International
2009 2008 2007
(In thousands)
Service cost . . . . . . . . . . . . . . . . $ 3,085 $ 6,964 $ 2,879 $13,557 $ 2,642 $11,308
Interest cost . . . . . . . . . . . . . . . . 7,805 7,195 6,017 9,905 5,391 8,189
Expected return on plan assets . . (630) (4,031) (687) (8,700) (744) (8,003)
Amortization of transition asset . . — (4) — (4) — (4)
Amortization of prior servicecost (credit) . . . . . . . . . . . . . . 3,908 (48) 1,833 (47) 2,108 (87)
Settlements/curtailments . . . . . . . 4,760 — 5,621 (126) 1,548 4
Amortization of net loss . . . . . . . 6,340 993 3,862 319 4,224 208
Net periodic benefit cost . . . . . . . $25,268 $11,069 $19,525 $14,904 $15,169 $11,615
AR-67
WEATHERFORD INTERNATIONAL LTD. AND SUBSIDIARIES
NOTES TO CONSOLIDATED FINANCIAL STATEMENTS — (Continued)

Other changes in plan assets and benefit obligations recognized in other comprehensive income during theyears ended December 31, 2009 and 2008 were as follows:
UnitedStates International
UnitedStates International
2009 2008
(In thousands)
New Activity:
Net (gain) loss for the year . . . . . . . . . . . . . . . $ (6,738) $(11,550) $14,194 $10,747
Net prior service cost for the year . . . . . . . . . . 30,244 — — 90
Reclassification Adjustments:Net loss . . . . . . . . . . . . . . . . . . . . . . . . . . . . . (10,037) (993) (9,483) (193)
Prior service credit (cost) . . . . . . . . . . . . . . . . (4,971) 48 (1,833) 47
Transition asset . . . . . . . . . . . . . . . . . . . . . . . — 4 — 4
Total other comprehensive income: . . . . . . . . . . . $ 8,498 $(12,491) $ 2,878 $10,695
Amounts in accumulated other comprehensive income expected to be recognized as components of netperiodic benefit cost in 2010 are as follows:
UnitedStates International
(In thousands)
Net loss . . . . . . . . . . . . . . . . . . . . . . . . . . . . . . . . . . . . . . . . . . . . . . . . . . . . $3,086 $186
Prior service costs (credit) . . . . . . . . . . . . . . . . . . . . . . . . . . . . . . . . . . . . . . 6,049 (54)
Transition asset . . . . . . . . . . . . . . . . . . . . . . . . . . . . . . . . . . . . . . . . . . . . . . — (4)
Prior service costs are amortized using an alternative straight-line method over the average remaining serviceperiod of employees expected to receive plan benefits. Assumed long-term rates of return on plan assets, discountrates and rates of compensation increases vary for the different plans according to the local economic conditions.
The weighted average assumption rates used for benefit obligations were as follows:
2009 2008Year Ended December 31,
Discount rate:
United States plans . . . . . . . . . . . . . . . . . . . . . . . . . . . . . . . . . . . . . 5.25% 5.75 - 6.25%
International plans . . . . . . . . . . . . . . . . . . . . . . . . . . . . . . . . . . . . . . 1.68 - 8.00 2.10 - 6.00
Rate of compensation increase:
United States plans . . . . . . . . . . . . . . . . . . . . . . . . . . . . . . . . . . . . . 6.00 8.00
International plans . . . . . . . . . . . . . . . . . . . . . . . . . . . . . . . . . . . . . . 2.00 - 4.70 2.00 - 5.15
AR-68
WEATHERFORD INTERNATIONAL LTD. AND SUBSIDIARIES
NOTES TO CONSOLIDATED FINANCIAL STATEMENTS — (Continued)

The weighted average assumption rates used for net periodic benefit costs were as follows:
2009 2008 2007Year Ended December 31,
Discount rate:
United States plans . . . . . . . . . . . . . . . . . . . . . . . 5.75 - 6.25% 5.75 - 6.00% 5.00 - 5.50%International plans . . . . . . . . . . . . . . . . . . . . . . . . 1.68 - 6.00 1.94 - 5.60 1.90 - 6.60
Expected return on plan assets:
United States plans . . . . . . . . . . . . . . . . . . . . . . . 7.00 7.00 5.00 - 7.00
International plans . . . . . . . . . . . . . . . . . . . . . . . . 4.20 - 7.05 4.20 - 7.34 4.00 - 6.82
Rate of compensation increase:
United States plans . . . . . . . . . . . . . . . . . . . . . . . 8.00 8.00 8.00
International plans . . . . . . . . . . . . . . . . . . . . . . . . 2.00 - 5.15 2.00 - 4.77 2.00 - 6.50
In determining the overall expected long-term rate of return for plan assets, we take into consideration thehistorical experience as well as future expectations of the asset mix involved. As different investments yielddifferent returns, each asset category must be reviewed individually and then weighted for significance in relation tothe total portfolio.
The following table presents the fair values of the Company’s pension plan assets as of December 31, 2009.United States and International plans are combined below as there is only one United States plan with assets. For anexplanation of the various levels, see Note 11.
Level 1 Level 2 Total(In thousands)
Investment funds(1) . . . . . . . . . . . . . . . . . . . . . . . . . . . . . . . . . . . . . $ — $86,765 $86,765Common/collective trust funds(2). . . . . . . . . . . . . . . . . . . . . . . . . . . — 8,176 8,176
Cash . . . . . . . . . . . . . . . . . . . . . . . . . . . . . . . . . . . . . . . . . . . . . . . . 2,788 — 2,788
Total assets at fair value . . . . . . . . . . . . . . . . . . . . . . . . . . . . . . . . . $2,788 $94,941 $97,729
(1) These international funds invest in the following: 4% cash, 6% U.S. equities, 39% non-U.S. equities, 41%non-U.S. fixed income securities, 7% property and 3% other.
(2) These U.S. funds invest in 62% equities and 38% fixed income securities.
Common/collective trust funds are valued at the net assets value of shares in the fund as determined by theissuer which are based on the fair value of the underlying assets. Investment funds are valued by the issuer based onthe fair value of the underlying assets.
At December 31, 2008, 58% of our U.S. pension plan assets were invested in equity-based securities and 42%were invested in debt-based securities. Internationally at December 31, 2008, 62% of our pension plan assets wereinvested in equity-based securities, 23% in debt-based securities and 15% in other investments.
In the U.S., our investment strategy includes a balanced approach with target allocation percentages of 60%equity investments and 40% fixed income investments. For the international plans, the assets are invested primarilyin equity investments as they are expected to provide a higher long-term rate of return. Our pension investmentstrategy worldwide prohibits a direct investment in our own stock.
AR-69
WEATHERFORD INTERNATIONAL LTD. AND SUBSIDIARIES
NOTES TO CONSOLIDATED FINANCIAL STATEMENTS — (Continued)

In 2010, we expect to contribute less than $1 million in the U.S. and $6 million internationally to our pensionand other postretirement benefit plans. In addition, the following benefit payments, which reflect expected futureservice and anticipated settlements, as appropriate, are expected to be paid:
United States International(In thousands)
2010 . . . . . . . . . . . . . . . . . . . . . . . . . . . . . . . . . . . . . . . . . . . . . . . . . . . $12,914 $ 4,283
2011 . . . . . . . . . . . . . . . . . . . . . . . . . . . . . . . . . . . . . . . . . . . . . . . . . . . 11,737 2,494
2012 . . . . . . . . . . . . . . . . . . . . . . . . . . . . . . . . . . . . . . . . . . . . . . . . . . . 11,305 1,611
2013 . . . . . . . . . . . . . . . . . . . . . . . . . . . . . . . . . . . . . . . . . . . . . . . . . . . 15,856 2,304
2014 . . . . . . . . . . . . . . . . . . . . . . . . . . . . . . . . . . . . . . . . . . . . . . . . . . . 13,239 3,216
2015 - 2019 . . . . . . . . . . . . . . . . . . . . . . . . . . . . . . . . . . . . . . . . . . . . . . 97,252 18,365
16. Income Taxes
The components of Income from Continuing Operations Before Income Taxes were as follows:
2009 2008 2007Year Ended December 31,
(In thousands)
Domestic. . . . . . . . . . . . . . . . . . . . . . . . . . . . . . . . . . . . . . $(464,694) $ 533,942 $ 512,275
Foreign . . . . . . . . . . . . . . . . . . . . . . . . . . . . . . . . . . . . . . . 764,168 1,155,972 932,211
$ 299,474 $1,689,914 $1,444,486
Our income tax benefit (provision) from continuing operations consisted of the following:
2009 2008 2007Year Ended December 31,
(In thousands)
Current:
U.S. federal and state income taxes . . . . . . . . . . . . . . . . . . $ 63,635 $ (96,549) $(132,182)Foreign. . . . . . . . . . . . . . . . . . . . . . . . . . . . . . . . . . . . . . . (193,508) (233,704) (171,705)
Total current . . . . . . . . . . . . . . . . . . . . . . . . . . . . . . . . . (129,873) (330,253) (303,887)
Deferred:
U.S. federal . . . . . . . . . . . . . . . . . . . . . . . . . . . . . . . . . . . 43,489 76,295 (47,990)
Foreign. . . . . . . . . . . . . . . . . . . . . . . . . . . . . . . . . . . . . . . 66,835 4,397 19,117
Total deferred . . . . . . . . . . . . . . . . . . . . . . . . . . . . . . . . 110,324 80,692 (28,873)
$ (19,549) $(249,561) $(332,760)
AR-70
WEATHERFORD INTERNATIONAL LTD. AND SUBSIDIARIES
NOTES TO CONSOLIDATED FINANCIAL STATEMENTS — (Continued)
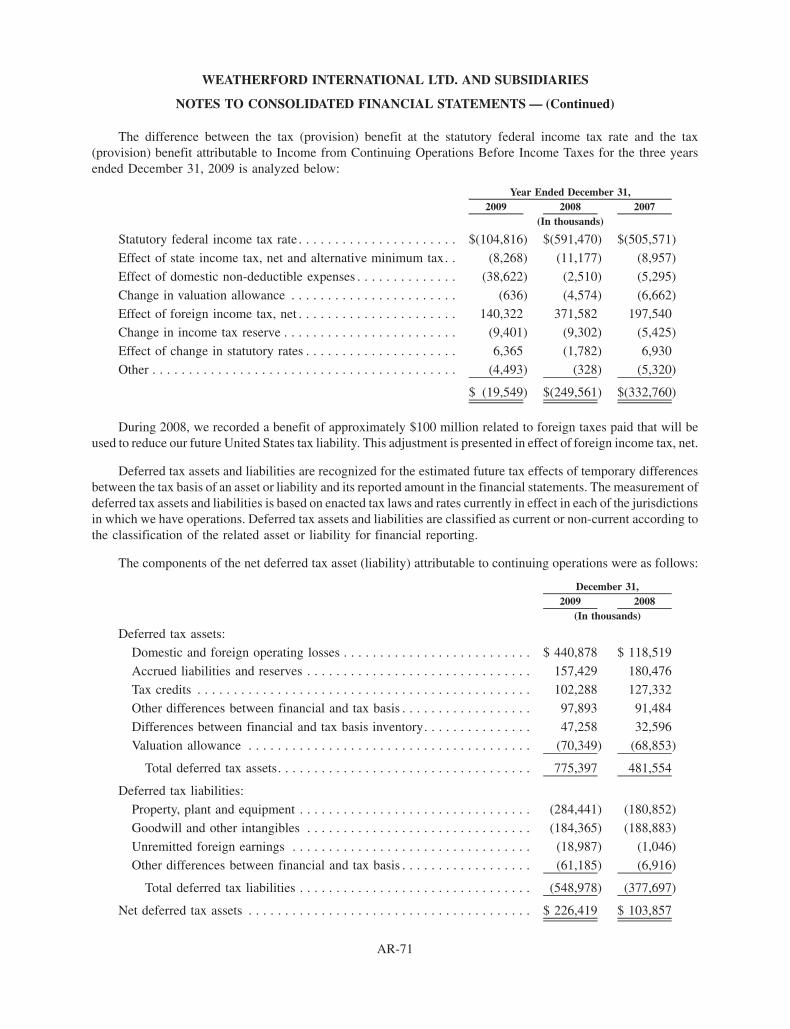
The difference between the tax (provision) benefit at the statutory federal income tax rate and the tax(provision) benefit attributable to Income from Continuing Operations Before Income Taxes for the three yearsended December 31, 2009 is analyzed below:
2009 2008 2007Year Ended December 31,
(In thousands)
Statutory federal income tax rate . . . . . . . . . . . . . . . . . . . . . . $(104,816) $(591,470) $(505,571)
Effect of state income tax, net and alternative minimum tax. . (8,268) (11,177) (8,957)
Effect of domestic non-deductible expenses . . . . . . . . . . . . . . (38,622) (2,510) (5,295)
Change in valuation allowance . . . . . . . . . . . . . . . . . . . . . . . (636) (4,574) (6,662)
Effect of foreign income tax, net . . . . . . . . . . . . . . . . . . . . . . 140,322 371,582 197,540Change in income tax reserve . . . . . . . . . . . . . . . . . . . . . . . . (9,401) (9,302) (5,425)
Effect of change in statutory rates . . . . . . . . . . . . . . . . . . . . . 6,365 (1,782) 6,930
Other . . . . . . . . . . . . . . . . . . . . . . . . . . . . . . . . . . . . . . . . . . (4,493) (328) (5,320)
$ (19,549) $(249,561) $(332,760)
During 2008, we recorded a benefit of approximately $100 million related to foreign taxes paid that will beused to reduce our future United States tax liability. This adjustment is presented in effect of foreign income tax, net.
Deferred tax assets and liabilities are recognized for the estimated future tax effects of temporary differencesbetween the tax basis of an asset or liability and its reported amount in the financial statements. The measurement ofdeferred tax assets and liabilities is based on enacted tax laws and rates currently in effect in each of the jurisdictionsin which we have operations. Deferred tax assets and liabilities are classified as current or non-current according tothe classification of the related asset or liability for financial reporting.
The components of the net deferred tax asset (liability) attributable to continuing operations were as follows:
2009 2008December 31,
(In thousands)
Deferred tax assets:
Domestic and foreign operating losses . . . . . . . . . . . . . . . . . . . . . . . . . . $ 440,878 $ 118,519
Accrued liabilities and reserves . . . . . . . . . . . . . . . . . . . . . . . . . . . . . . . 157,429 180,476Tax credits . . . . . . . . . . . . . . . . . . . . . . . . . . . . . . . . . . . . . . . . . . . . . . 102,288 127,332
Other differences between financial and tax basis . . . . . . . . . . . . . . . . . . 97,893 91,484
Differences between financial and tax basis inventory. . . . . . . . . . . . . . . 47,258 32,596
Valuation allowance . . . . . . . . . . . . . . . . . . . . . . . . . . . . . . . . . . . . . . . (70,349) (68,853)
Total deferred tax assets. . . . . . . . . . . . . . . . . . . . . . . . . . . . . . . . . . . 775,397 481,554
Deferred tax liabilities:
Property, plant and equipment . . . . . . . . . . . . . . . . . . . . . . . . . . . . . . . . (284,441) (180,852)
Goodwill and other intangibles . . . . . . . . . . . . . . . . . . . . . . . . . . . . . . . (184,365) (188,883)
Unremitted foreign earnings . . . . . . . . . . . . . . . . . . . . . . . . . . . . . . . . . (18,987) (1,046)
Other differences between financial and tax basis . . . . . . . . . . . . . . . . . . (61,185) (6,916)
Total deferred tax liabilities . . . . . . . . . . . . . . . . . . . . . . . . . . . . . . . . (548,978) (377,697)
Net deferred tax assets . . . . . . . . . . . . . . . . . . . . . . . . . . . . . . . . . . . . . . . $ 226,419 $ 103,857
AR-71
WEATHERFORD INTERNATIONAL LTD. AND SUBSIDIARIES
NOTES TO CONSOLIDATED FINANCIAL STATEMENTS — (Continued)

The overall increase in the valuation allowance in 2009 is primarily attributable to the establishment of avaluation allowance against net operating losses (“NOLs”) in various jurisdictions. Management’s assessment isthat the character and nature of future taxable income may not allow us to realize the tax benefits of the NOLs andtax credits within the allowable carryforward period. Therefore, an appropriate valuation allowance has been made.
We have provided additional taxes for the anticipated repatriation of earnings of our foreign subsidiaries whereour management has determined that the foreign subsidiaries earnings are not indefinitely reinvested. For foreignsubsidiaries whose earnings are indefinitely reinvested, no provision for U.S. federal and state income taxes hasbeen provided. If the earnings were not indefinitely reinvested, the estimated tax benefit would be approximately$15 million after application of available foreign tax credits.
At December 31, 2009, we had approximately $1.4 billion of NOLs, $70 million of which were generated bycertain domestic subsidiaries prior to their acquisition by us. The use of these acquired domestic NOLs is subject tolimitations imposed by the Internal Revenue Code and is also restricted to the taxable income of the subsidiariesgenerating these losses. Loss carryforwards, if not utilized, will expire at various dates from 2010 through 2029.
At December 31, 2009, we had approximately $86 million of foreign tax credits available to offset futurepayments of federal income taxes. The foreign tax credits expire in varying amounts through 2019.
A tabular reconciliation of the total amounts of unrecognized tax benefits at the beginning and end of theperiod is as follows:
2009 2008 2007Year Ended December 31,
(In thousands)
Balance at beginning of year . . . . . . . . . . . . . . . . . . . . . . . . . . . . . $45,262 $37,805 $33,891
Additions as a result of tax positions taken during a prior period. . . 13,007 8,904 9,451
Reductions as a result of tax positions taken during a prior period. . (2,259) (71) (3,076)
Additions as a result of tax positions taken during the currentperiod . . . . . . . . . . . . . . . . . . . . . . . . . . . . . . . . . . . . . . . . . . . . 1,298 1,391 —
Reductions relating to settlements with taxing authorities . . . . . . . . (1,633) (2,767) (2,080)
Reductions as a result of a lapse of the applicable statute oflimitations . . . . . . . . . . . . . . . . . . . . . . . . . . . . . . . . . . . . . . . . . (1,319) — (381)
Balance at end of year . . . . . . . . . . . . . . . . . . . . . . . . . . . . . . . . . . $54,356 $45,262 $37,805
All of the unrecognized benefits, if recognized in future periods, would impact our effective tax rate.
To the extent penalties and interest would be assessed on any underpayment of income tax, such amounts havebeen accrued and classified as a component of income tax expense in the financial statements. This is an accountingpolicy election made by us that is a continuation of our historical policy and will continue to be consistently appliedin the future. We recognized $8 million, $2 million and $3 million of expense relating to interest for the periodsended December 31, 2009, 2008 and 2007, respectively. We recognized $5 million of penalties for the year endedDecember 31, 2009. Penalties during the years ended December 31, 2008 and 2007 were immaterial. The amountsin the table above exclude accrued interest and penalties of $28 million, $14 million and $13 million atDecember 31, 2009, 2008 and 2007, respectively.
We are subject to income tax in many of the approximately 100 countries where we operate including majoroperations in the United States, the United Kingdom, and Canada. Many of our subsidiaries are open to examinationin the United Kingdom and Canada dating from 2003 and 2001, respectively through December 31, 2009. We areopen to examination in the United States for tax years ended December 31, 2004 through December 31, 2008.
We do not anticipate a significant change in the balance of unrecognized tax benefits within the next12 months.
AR-72
WEATHERFORD INTERNATIONAL LTD. AND SUBSIDIARIES
NOTES TO CONSOLIDATED FINANCIAL STATEMENTS — (Continued)
17. Disputes, Litigation and Contingencies
U.S. Government and Internal Investigations
We are currently involved in government and internal investigations involving various areas of our operations.
Until 2003, we participated in the United Nations oil-for-food program governing sales of goods and servicesinto Iraq. The U.S. Department of Justice (“DOJ”) and the SEC have undertaken investigations of our participationin the oil-for-food program and have subpoenaed certain documents in connection with these investigations. Wehave cooperated fully with these investigations. We have retained legal counsel, reporting to our audit committee, toinvestigate this matter. These investigations are not yet resolved, and we cannot anticipate the timing, outcome orpossible impact of the ultimate resolution of the investigations, financial or otherwise.
The U.S. Department of Commerce, Bureau of Industry & Security, Office of Foreign Assets Control(“OFAC”), DOJ and SEC have undertaken investigations of allegations of improper sales of products and servicesby the Company and its subsidiaries in certain sanctioned countries. We have cooperated fully with this inves-tigation. We have retained legal counsel, reporting to our audit committee, to investigate these matters and tocooperate fully with these agencies. This investigation is not yet resolved, and we cannot anticipate the timing,outcome or possible impact of the ultimate resolution of the investigation, financial or otherwise.
In light of this investigation and of the current U.S. and foreign policy environment and the inherentuncertainties surrounding these countries, we decided in September 2007 to direct our foreign subsidiaries todiscontinue doing business in countries that are subject to comprehensive U.S. economic and trade sanctions,specifically Cuba, Iran, and Sudan, as well as Syria. Effective September 2007, we ceased entering into any newcontracts in these countries and began an orderly discontinuation and winding down of our existing business in thesesanctioned countries. Effective March 31, 2008, we substantially completed our winding down of business in thesecountries. We can complete the withdrawal process only pursuant to licenses issued by OFAC. Our remainingactivities in Iran, Sudan and Syria include ongoing withdrawal activities such as attempts to collect accountsreceivable, attempts to settle tax liabilities or legal claims and attempts to recover or liquidate assets, includingequipment and funds. Certain of our subsidiaries continue to conduct business in countries such as Myanmar thatare subject to more limited U.S. trading sanctions.
The DOJ and SEC are investigating the embezzlement of approximately $175,000 at a European subsidiaryand the possible improper use of these funds, including possible payments to government officials in Europe, duringthe period from 2000 to 2004, and our compliance with the Foreign Corrupt Practices Act (“FCPA”) and other lawsworldwide. We have retained legal counsel, reporting to our audit committee, to investigate these matters and tocooperate fully with the DOJ and SEC. As part of our investigations, we have uncovered potential violations ofU.S. law in connection with activities in West Africa. These investigations are not yet resolved, and we cannotanticipate the timing, outcome or possible impact of the ultimate resolution, of the investigations, financial orotherwise.
The DOJ, SEC and other agencies and authorities have a broad range of civil and criminal penalties they mayseek to impose against corporations and individuals for violations of trade sanctions laws, the FCPA and otherfederal statutes including, but not limited to, injunctive relief, disgorgement, fines, penalties and modifications tobusiness practices and compliance programs. In recent years, these agencies and authorities have entered intoagreements with, and obtained a range of penalties against, several public corporations and individuals in similarinvestigations, under which civil and criminal penalties were imposed, including in some cases fines and otherpenalties and sanctions in the tens and hundreds of millions of dollars. These agencies are seeking to imposepenalties against us for past conduct, but the ultimate amount of any penalties we may pay currently cannot bereasonably estimated. Under trade sanctions laws, the DOJ may also seek to impose modifications to businesspractices, including immediate cessation of all business activities in specific countries or other limitations thatdecrease our business, and modifications to compliance programs, which may increase compliance costs. Anyinjunctive relief, disgorgement, fines, penalties, sanctions or imposed modifications to business practices resulting
AR-73
WEATHERFORD INTERNATIONAL LTD. AND SUBSIDIARIES
NOTES TO CONSOLIDATED FINANCIAL STATEMENTS — (Continued)
from these investigations could adversely affect our results of operations. In addition, our activities in sanctionedcountries, such as Sudan and Iran, could result in certain investors, such as government sponsored pension funds,divesting or not investing in our registered shares. Based on available information, we cannot predict what, if any,actions the DOJ, SEC or other authorities will take in our situation or the effect any such actions will have on ourconsolidated financial position or results of operations. To the extent we violated trade sanctions laws, the FCPA, orother laws or regulations, fines and other penalties may be imposed. Because these matters are now pending beforethe indicated agencies, there can be no assurance that actual fines or penalties, if any, will not have a materialadverse affect on our business, financial condition, liquidity or results of operations.
During 2009 and 2008, we incurred $45 million and $47 million, respectively, in connection with these on-going investigations. In addition, we incurred $56 million for costs incurred in connection with our exit from certainsanctioned countries during 2008.
Other Litigation and Disputes
We are aware of various disputes and potential claims and we are a party in various litigation involving claimsagainst us, some of which are covered by insurance. For claims, disputes and pending litigation in which we believea negative outcome is probable and a loss can be reasonably estimated, we have recorded a liability for the expectedloss. These liabilities are immaterial to our financial condition and results of operations. In addition we have certainclaims, disputes and pending litigation in which we do not believe a negative outcome is probable. If one or morenegative outcomes were to occur, the impact to our financial condition could be as high as $180 million.
Our former Senior Vice President and General Counsel (the “Executive”) left the Company in June 2009. TheExecutive had employment agreements with us that terminated on his departure. There is currently a disputebetween the Executive and us as to the amount of compensation we are obligated to pay under these employmentagreements based on the Executive’s separation. It is our belief that an unfavorable outcome regarding this disputeis not probable, and as such, we have not accrued for $9 million of the Executive’s claimed severance and otherbenefits.
18. Commitments
In association with a prior acquisition, we identified pre-acquisition contingencies related to duties and taxesassociated with the importation of certain assets to foreign jurisdictions. At December 31, 2009, we have a liabilityin the amount of $5 million for this matter. If we use the high end of the range, the aggregate potential liability wouldbe approximately $6 million higher.
We are committed under various operating lease agreements primarily related to office space and equipment.Generally, these leases include renewal provisions and rental payments, which may be adjusted for taxes, insuranceand maintenance related to the property. Future minimum rental commitments under noncancellable operatingleases are as follows (in thousands):
2010 . . . . . . . . . . . . . . . . . . . . . . . . . . . . . . . . . . . . . . . . . . . . . . . . . . . . . . . . . . . . . . . $ 88,274
2011 . . . . . . . . . . . . . . . . . . . . . . . . . . . . . . . . . . . . . . . . . . . . . . . . . . . . . . . . . . . . . . . 68,392
2012 . . . . . . . . . . . . . . . . . . . . . . . . . . . . . . . . . . . . . . . . . . . . . . . . . . . . . . . . . . . . . . . 46,706
2013 . . . . . . . . . . . . . . . . . . . . . . . . . . . . . . . . . . . . . . . . . . . . . . . . . . . . . . . . . . . . . . . 30,304
2014 . . . . . . . . . . . . . . . . . . . . . . . . . . . . . . . . . . . . . . . . . . . . . . . . . . . . . . . . . . . . . . . 22,047
Thereafter . . . . . . . . . . . . . . . . . . . . . . . . . . . . . . . . . . . . . . . . . . . . . . . . . . . . . . . . . . . 107,403
$363,126
Total rent expense incurred under operating leases was approximately $367 million, $188 million and$130 million for the years ended December 31, 2009, 2008 and 2007, respectively.
AR-74
WEATHERFORD INTERNATIONAL LTD. AND SUBSIDIARIES
NOTES TO CONSOLIDATED FINANCIAL STATEMENTS — (Continued)
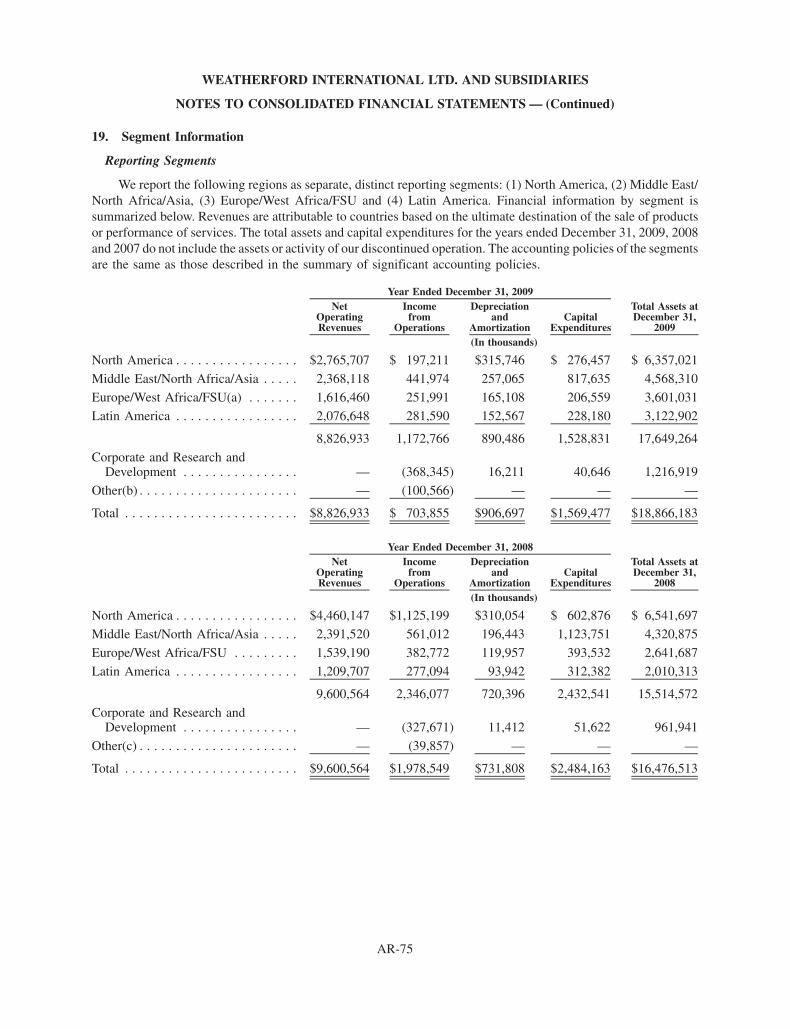
19. Segment Information
Reporting Segments
We report the following regions as separate, distinct reporting segments: (1) North America, (2) Middle East/North Africa/Asia, (3) Europe/West Africa/FSU and (4) Latin America. Financial information by segment issummarized below. Revenues are attributable to countries based on the ultimate destination of the sale of productsor performance of services. The total assets and capital expenditures for the years ended December 31, 2009, 2008and 2007 do not include the assets or activity of our discontinued operation. The accounting policies of the segmentsare the same as those described in the summary of significant accounting policies.
NetOperatingRevenues
Incomefrom
Operations
Depreciationand
AmortizationCapital
Expenditures
Total Assets atDecember 31,
2009
Year Ended December 31, 2009
(In thousands)
North America . . . . . . . . . . . . . . . . . $2,765,707 $ 197,211 $315,746 $ 276,457 $ 6,357,021
Middle East/North Africa/Asia . . . . . 2,368,118 441,974 257,065 817,635 4,568,310
Europe/West Africa/FSU(a) . . . . . . . 1,616,460 251,991 165,108 206,559 3,601,031
Latin America . . . . . . . . . . . . . . . . . 2,076,648 281,590 152,567 228,180 3,122,902
8,826,933 1,172,766 890,486 1,528,831 17,649,264
Corporate and Research andDevelopment . . . . . . . . . . . . . . . . — (368,345) 16,211 40,646 1,216,919
Other(b) . . . . . . . . . . . . . . . . . . . . . . — (100,566) — — —
Total . . . . . . . . . . . . . . . . . . . . . . . . $8,826,933 $ 703,855 $906,697 $1,569,477 $18,866,183
NetOperatingRevenues
Incomefrom
Operations
Depreciationand
AmortizationCapital
Expenditures
Total Assets atDecember 31,
2008
Year Ended December 31, 2008
(In thousands)
North America . . . . . . . . . . . . . . . . . $4,460,147 $1,125,199 $310,054 $ 602,876 $ 6,541,697
Middle East/North Africa/Asia . . . . . 2,391,520 561,012 196,443 1,123,751 4,320,875
Europe/West Africa/FSU . . . . . . . . . 1,539,190 382,772 119,957 393,532 2,641,687
Latin America . . . . . . . . . . . . . . . . . 1,209,707 277,094 93,942 312,382 2,010,313
9,600,564 2,346,077 720,396 2,432,541 15,514,572
Corporate and Research andDevelopment . . . . . . . . . . . . . . . . — (327,671) 11,412 51,622 961,941
Other(c) . . . . . . . . . . . . . . . . . . . . . . — (39,857) — — —
Total . . . . . . . . . . . . . . . . . . . . . . . . $9,600,564 $1,978,549 $731,808 $2,484,163 $16,476,513
AR-75
WEATHERFORD INTERNATIONAL LTD. AND SUBSIDIARIES
NOTES TO CONSOLIDATED FINANCIAL STATEMENTS — (Continued)
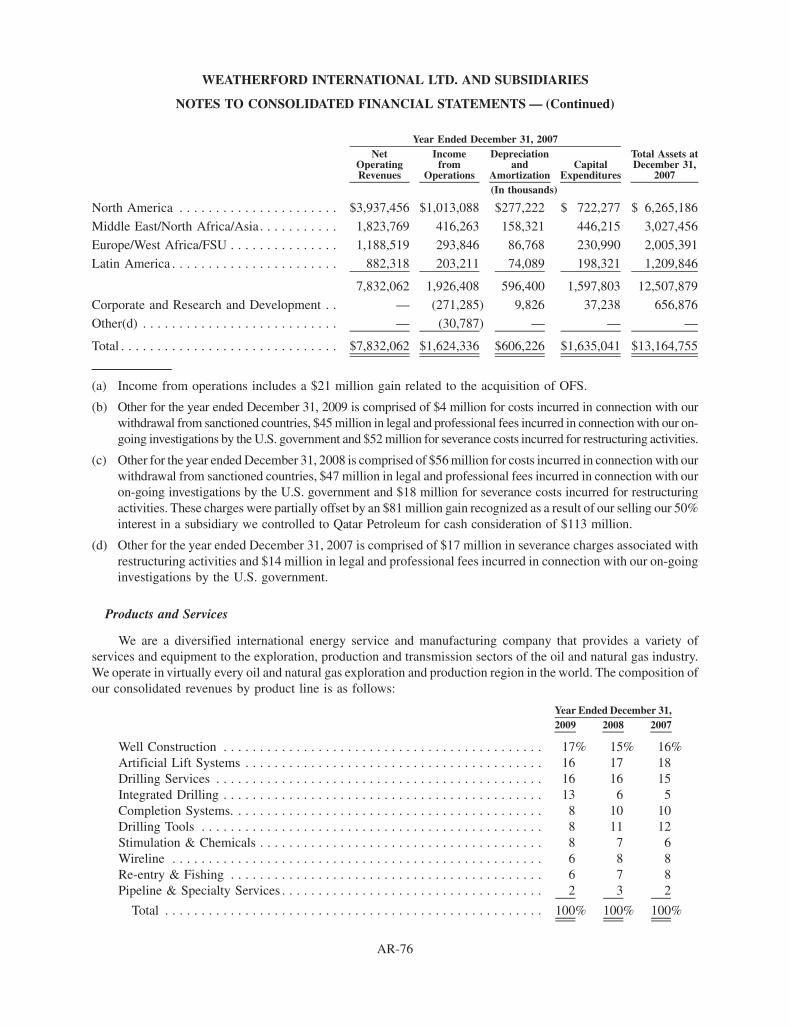
NetOperatingRevenues
Incomefrom
Operations
Depreciationand
AmortizationCapital
Expenditures
Total Assets atDecember 31,
2007
Year Ended December 31, 2007
(In thousands)
North America . . . . . . . . . . . . . . . . . . . . . . $3,937,456 $1,013,088 $277,222 $ 722,277 $ 6,265,186
Middle East/North Africa/Asia. . . . . . . . . . . 1,823,769 416,263 158,321 446,215 3,027,456
Europe/West Africa/FSU . . . . . . . . . . . . . . . 1,188,519 293,846 86,768 230,990 2,005,391
Latin America . . . . . . . . . . . . . . . . . . . . . . . 882,318 203,211 74,089 198,321 1,209,846
7,832,062 1,926,408 596,400 1,597,803 12,507,879
Corporate and Research and Development . . — (271,285) 9,826 37,238 656,876
Other(d) . . . . . . . . . . . . . . . . . . . . . . . . . . . — (30,787) — — —
Total . . . . . . . . . . . . . . . . . . . . . . . . . . . . . . $7,832,062 $1,624,336 $606,226 $1,635,041 $13,164,755
(a) Income from operations includes a $21 million gain related to the acquisition of OFS.
(b) Other for the year ended December 31, 2009 is comprised of $4 million for costs incurred in connection with ourwithdrawal from sanctioned countries, $45 million in legal and professional fees incurred in connection with our on-going investigations by the U.S. government and $52 million for severance costs incurred for restructuring activities.
(c) Other for the year ended December 31, 2008 is comprised of $56 million for costs incurred in connection with ourwithdrawal from sanctioned countries, $47 million in legal and professional fees incurred in connection with ouron-going investigations by the U.S. government and $18 million for severance costs incurred for restructuringactivities. These charges were partially offset by an $81 million gain recognized as a result of our selling our 50%interest in a subsidiary we controlled to Qatar Petroleum for cash consideration of $113 million.
(d) Other for the year ended December 31, 2007 is comprised of $17 million in severance charges associated withrestructuring activities and $14 million in legal and professional fees incurred in connection with our on-goinginvestigations by the U.S. government.
Products and Services
We are a diversified international energy service and manufacturing company that provides a variety ofservices and equipment to the exploration, production and transmission sectors of the oil and natural gas industry.We operate in virtually every oil and natural gas exploration and production region in the world. The composition ofour consolidated revenues by product line is as follows:
2009 2008 2007Year Ended December 31,
Well Construction . . . . . . . . . . . . . . . . . . . . . . . . . . . . . . . . . . . . . . . . . . . . 17% 15% 16%Artificial Lift Systems . . . . . . . . . . . . . . . . . . . . . . . . . . . . . . . . . . . . . . . . . 16 17 18Drilling Services . . . . . . . . . . . . . . . . . . . . . . . . . . . . . . . . . . . . . . . . . . . . . 16 16 15Integrated Drilling . . . . . . . . . . . . . . . . . . . . . . . . . . . . . . . . . . . . . . . . . . . . 13 6 5Completion Systems. . . . . . . . . . . . . . . . . . . . . . . . . . . . . . . . . . . . . . . . . . . 8 10 10Drilling Tools . . . . . . . . . . . . . . . . . . . . . . . . . . . . . . . . . . . . . . . . . . . . . . . 8 11 12Stimulation & Chemicals . . . . . . . . . . . . . . . . . . . . . . . . . . . . . . . . . . . . . . . 8 7 6Wireline . . . . . . . . . . . . . . . . . . . . . . . . . . . . . . . . . . . . . . . . . . . . . . . . . . . 6 8 8Re-entry & Fishing . . . . . . . . . . . . . . . . . . . . . . . . . . . . . . . . . . . . . . . . . . . 6 7 8Pipeline & Specialty Services . . . . . . . . . . . . . . . . . . . . . . . . . . . . . . . . . . . . 2 3 2
Total . . . . . . . . . . . . . . . . . . . . . . . . . . . . . . . . . . . . . . . . . . . . . . . . . . . . 100% 100% 100%
AR-76
WEATHERFORD INTERNATIONAL LTD. AND SUBSIDIARIES
NOTES TO CONSOLIDATED FINANCIAL STATEMENTS — (Continued)
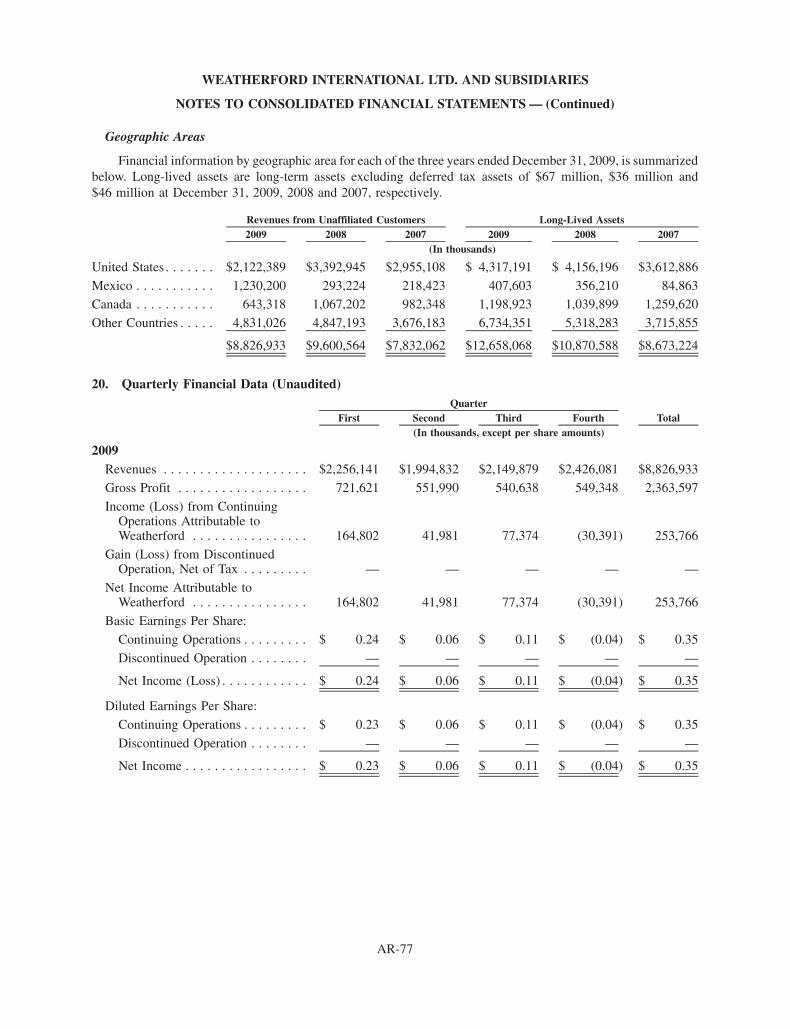
Geographic Areas
Financial information by geographic area for each of the three years ended December 31, 2009, is summarizedbelow. Long-lived assets are long-term assets excluding deferred tax assets of $67 million, $36 million and$46 million at December 31, 2009, 2008 and 2007, respectively.
2009 2008 2007 2009 2008 2007Revenues from Unaffiliated Customers Long-Lived Assets
(In thousands)
United States . . . . . . . $2,122,389 $3,392,945 $2,955,108 $ 4,317,191 $ 4,156,196 $3,612,886
Mexico . . . . . . . . . . . 1,230,200 293,224 218,423 407,603 356,210 84,863Canada . . . . . . . . . . . 643,318 1,067,202 982,348 1,198,923 1,039,899 1,259,620
Other Countries . . . . . 4,831,026 4,847,193 3,676,183 6,734,351 5,318,283 3,715,855
$8,826,933 $9,600,564 $7,832,062 $12,658,068 $10,870,588 $8,673,224
20. Quarterly Financial Data (Unaudited)
First Second Third Fourth TotalQuarter
(In thousands, except per share amounts)
2009Revenues . . . . . . . . . . . . . . . . . . . . $2,256,141 $1,994,832 $2,149,879 $2,426,081 $8,826,933
Gross Profit . . . . . . . . . . . . . . . . . . 721,621 551,990 540,638 549,348 2,363,597
Income (Loss) from ContinuingOperations Attributable toWeatherford . . . . . . . . . . . . . . . . 164,802 41,981 77,374 (30,391) 253,766
Gain (Loss) from DiscontinuedOperation, Net of Tax . . . . . . . . . — — — — —
Net Income Attributable toWeatherford . . . . . . . . . . . . . . . . 164,802 41,981 77,374 (30,391) 253,766
Basic Earnings Per Share:
Continuing Operations . . . . . . . . . $ 0.24 $ 0.06 $ 0.11 $ (0.04) $ 0.35
Discontinued Operation . . . . . . . . — — — — —
Net Income (Loss) . . . . . . . . . . . . $ 0.24 $ 0.06 $ 0.11 $ (0.04) $ 0.35
Diluted Earnings Per Share:
Continuing Operations . . . . . . . . . $ 0.23 $ 0.06 $ 0.11 $ (0.04) $ 0.35
Discontinued Operation . . . . . . . . — — — — —
Net Income . . . . . . . . . . . . . . . . . $ 0.23 $ 0.06 $ 0.11 $ (0.04) $ 0.35
AR-77
WEATHERFORD INTERNATIONAL LTD. AND SUBSIDIARIES
NOTES TO CONSOLIDATED FINANCIAL STATEMENTS — (Continued)

First Second Third Fourth TotalQuarter
(In thousands, except per share amounts)
2008Revenues . . . . . . . . . . . . . . . . . . . . $2,195,892 $2,229,250 $2,540,796 $2,634,626 $9,600,564Gross Profit . . . . . . . . . . . . . . . . . . 746,214 775,096 899,873 936,923 3,358,106
Income from Continuing OperationsAttributable to Weatherford . . . . . 284,069 364,044 370,600 387,368 1,406,081
Gain (Loss) from DiscontinuedOperation, Net of Tax . . . . . . . . . (19,868) 6,940 — — (12,928)
Net Income Attributable toWeatherford . . . . . . . . . . . . . . . . 264,201 370,984 370,600 387,368 1,393,153
Basic Earnings Per Share:
Continuing Operations . . . . . . . . . $ 0.42 $ 0.53 $ 0.54 $ 0.56 $ 2.06
Discontinued Operation . . . . . . . . (0.03) 0.01 — — (0.02)
Net Income . . . . . . . . . . . . . . . . . $ 0.39 $ 0.54 $ 0.54 $ 0.56 $ 2.04
Diluted Earnings Per Share:
Continuing Operations . . . . . . . . . $ 0.41 $ 0.52 $ 0.53 $ 0.56 $ 2.01
Discontinued Operation . . . . . . . . (0.03) 0.01 — — (0.02)
Net Income . . . . . . . . . . . . . . . . . $ 0.38 $ 0.53 $ 0.53 $ 0.56 $ 1.99
Fourth quarter 2008 results have been corrected in the table above to reflect a change in our income taxprovision (See Note 1).
21. Subsequent Events
In January 2010, the Venezuelan government announced its intention to devalue its currency (“Bolivar”) andmove to a two tier exchange structure. The official exchange rate is expected to move from 2.15 to 2.60 for essentialgoods and 4.30 for non-essential goods and services. While we are still evaluating the impact of these actions, ourpreliminary assessment of the impact of the devaluation is that we will incur a one-time loss in the first quarter of2010 of approximately $50 million for the remeasurement of the local balance sheet at the date of the devaluation.
Our compensation committee is in the process of evaluating the components of our executive officerscompensation for 2010. Changes to our Supplemental Executive Retirement Plan may occur as a result of thisreview, including the possible discontinuation of the plan. If this were to occur we would be required to record anon-cash charge of up to $30 million, while any payments vested under the plan would not be paid until theexecutive’s separation.
22. Other Disclosures Required by Swiss Law
Balance Sheet Item
Information regarding insurance coverage on our property, plant and equipment is presented in Note 15(Insurance) in the Weatherford International Ltd. stand-alone statutory financial statements.
Statement of Income Item
Information regarding our personnel expenses is presented in Note 16 (Personnel Expenses) in the Weath-erford International Ltd. stand-alone statutory financial statements.
AR-78
WEATHERFORD INTERNATIONAL LTD. AND SUBSIDIARIES
NOTES TO CONSOLIDATED FINANCIAL STATEMENTS — (Continued)

Compensation and Security Ownership of Board Members and Executive Officers
The compensation and security ownership of members of the Board of Directors of Weatherford InternationalLtd. and of Weatherford executive officers is presented in Note 8 (Board of Directors Compensation), Note 9(Executive Management Compensation) and Note 10 (Share Ownership — Board of Directors and ExecutiveManagement) in the Weatherford International Ltd. stand-alone statutory financial statements.
Risk Assessment
Weatherford International Ltd.’s risk assessment is presented in Note 11 (Risk Assessment Disclosure) of theWeatherford International Ltd. stand-alone statutory financial statements.
23. Consolidating Financial Statements
During the first quarter of 2009, we completed a transaction that changed our place of incorporation fromBermuda to Switzerland. A new Swiss corporation named Weatherford International Ltd. was formed and is nowthe ultimate parent of the Weatherford group (“Parent”). The Parent guarantees the obligations of WeatherfordInternational Ltd. incorporated in Bermuda (“Weatherford Bermuda”) and Weatherford International, Inc. incor-porated in Delaware (“Weatherford Delaware”) noted below.
The following obligations of Weatherford Delaware were guaranteed by Weatherford Bermuda as ofDecember 31, 2009 and 2008: (i) the 6.625% Senior Notes, (ii) the 5.95% Senior Notes, (iii) the 6.35% SeniorNotes and (iv) the 6.80% Senior Notes.
The following obligations of Weatherford Bermuda were guaranteed by Weatherford Delaware at Decem-ber 31, 2009: (i) the revolving credit facilities, (ii) the 4.95% Senior Notes, (iii) the 5.50% Senior Notes, (iv) the6.50% Senior Notes, (v) the 5.15% Senior Notes, (vi) the 6.00% Senior Notes, (vii) the 7.00% Senior Notes,(viii) the 9.625% Senior Notes, (ix) the 9.875% Senior Notes and (x) issuances of notes under the commercial paperprogram.
The following obligations of the Weatherford Bermuda were guaranteed by the Weatherford Delaware atDecember 31, 2008: (i) the revolving credit facilities, (ii) the 4.95% Senior Notes, (iii) the 5.50% Senior Notes,(iv) the 6.50% Senior Notes, (v) the 5.15% Senior Notes, (vi) the 6.00% Senior Notes, (vii) the 7.00% Senior Notesand (viii) issuances of notes under the commercial paper program.
As a result of these guarantee arrangements, we are required to present the following condensed consolidatingfinancial information. The accompanying guarantor financial information is presented on the equity method ofaccounting for all periods presented. Under this method, investments in subsidiaries are recorded at cost andadjusted for our share in the subsidiaries’ cumulative results of operations, capital contributions and distributionsand other changes in equity. Elimination entries relate primarily to the elimination of investments in subsidiariesand associated intercompany balances and transactions. Certain prior year amounts have been reclassified toconform to the current year presentation.
AR-79
WEATHERFORD INTERNATIONAL LTD. AND SUBSIDIARIES
NOTES TO CONSOLIDATED FINANCIAL STATEMENTS — (Continued)

Condensed Consolidating Balance SheetDecember 31, 2009
(In thousands)
Parent Bermuda DelawareOther
Subsidiaries Eliminations Consolidation
ASSETSCurrent Assets:
Cash and Cash Equivalents . . . . . $ 102 $ 47 $ 421 $ 251,949 $ — $ 252,519
Other Current Assets . . . . . . . . . 510 11,163 98,033 5,778,381 — 5,888,087
Total Current Assets . . . . . . . . 612 11,210 98,454 6,030,330 — 6,140,606
Equity Investments in Affiliates. . . . 8,615,365 15,160,748 6,754,566 12,092,950 (42,623,629) —
Shares Held in Parent. . . . . . . . . . . — — 108,268 507,780 (616,048) —
Intercompany Receivables, Net . . . . — 1,671,487 1,017,215 — (2,688,702) —
Other Assets . . . . . . . . . . . . . . . . . 9,376 68,960 190,175 12,457,066 — 12,725,577
Total Assets . . . . . . . . . . . . $8,625,353 $16,912,405 $8,168,678 $31,088,126 $(45,928,379) $18,866,183
LIABILITIES AND SHAREHOLDERS’ EQUITYCurrent Liabilities:
Short-term Borrowings andCurrent Portion of Long-TermDebt . . . . . . . . . . . . . . . . . . . $ — $ 352,373 $ 1,868 $ 515,340 $ — $ 869,581
Accounts Payable and OtherCurrent Liabilities . . . . . . . . . . 46,160 107,984 116,404 1,656,759 — 1,927,307
Total Current Liabilities . . . . . 46,160 460,357 118,272 2,172,099 — 2,796,888
Long-term Debt. . . . . . . . . . . . . . . — 3,988,162 1,848,191 10,905 — 5,847,258Intercompany Payables, Net . . . . . . 36,606 — — 2,652,096 (2,688,702) —
Other Long-term Liabilities . . . . . . 8,132 132,155 2,309 280,737 — 423,333
Total Liabilities . . . . . . . . . . 90,898 4,580,674 1,968,772 5,115,837 (2,688,702) 9,067,479
Weatherford Shareholders’ Equity . . 8,534,455 12,331,731 6,199,906 25,893,257 (43,239,677) 9,719,672
Noncontrolling Interests . . . . . . . . . — — — 79,032 — 79,032
Total Liabilities andShareholders’ Equity . . . . $8,625,353 $16,912,405 $8,168,678 $31,088,126 $(45,928,379) $18,866,183
AR-80
WEATHERFORD INTERNATIONAL LTD. AND SUBSIDIARIES
NOTES TO CONSOLIDATED FINANCIAL STATEMENTS — (Continued)
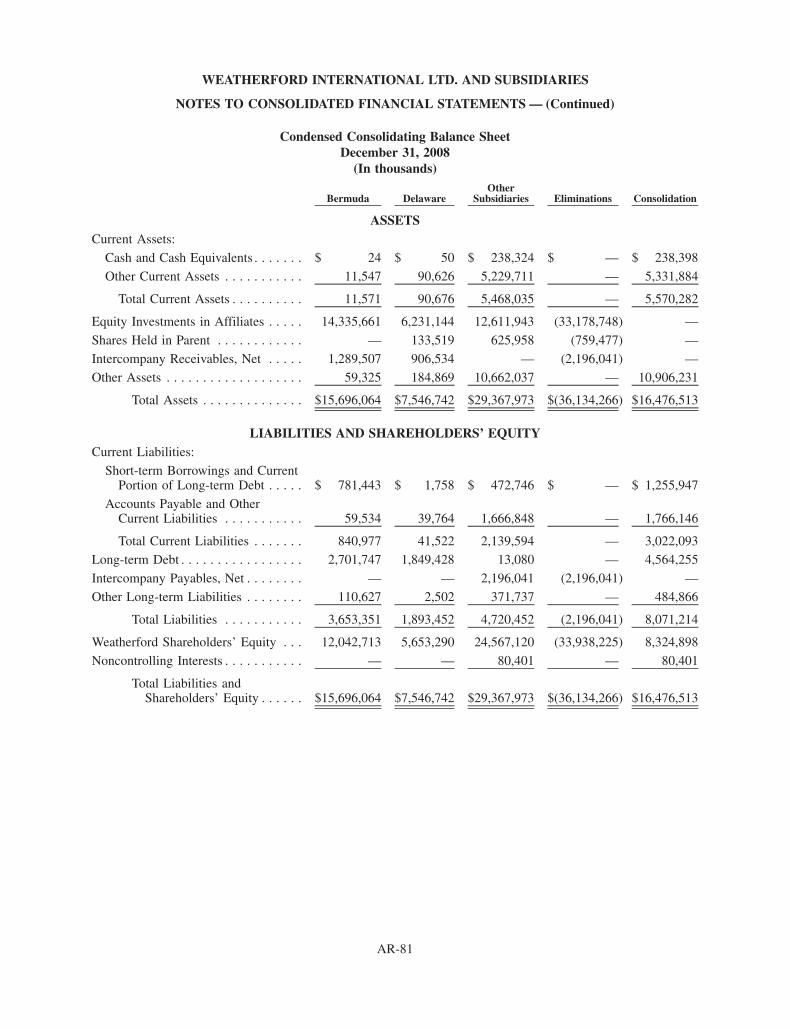
Condensed Consolidating Balance SheetDecember 31, 2008
(In thousands)
Bermuda DelawareOther
Subsidiaries Eliminations Consolidation
ASSETSCurrent Assets:
Cash and Cash Equivalents . . . . . . . $ 24 $ 50 $ 238,324 $ — $ 238,398
Other Current Assets . . . . . . . . . . . 11,547 90,626 5,229,711 — 5,331,884
Total Current Assets . . . . . . . . . . 11,571 90,676 5,468,035 — 5,570,282
Equity Investments in Affiliates . . . . . 14,335,661 6,231,144 12,611,943 (33,178,748) —
Shares Held in Parent . . . . . . . . . . . . — 133,519 625,958 (759,477) —
Intercompany Receivables, Net . . . . . 1,289,507 906,534 — (2,196,041) —
Other Assets . . . . . . . . . . . . . . . . . . . 59,325 184,869 10,662,037 — 10,906,231
Total Assets . . . . . . . . . . . . . . $15,696,064 $7,546,742 $29,367,973 $(36,134,266) $16,476,513
LIABILITIES AND SHAREHOLDERS’ EQUITYCurrent Liabilities:
Short-term Borrowings and CurrentPortion of Long-term Debt . . . . . $ 781,443 $ 1,758 $ 472,746 $ — $ 1,255,947
Accounts Payable and OtherCurrent Liabilities . . . . . . . . . . . 59,534 39,764 1,666,848 — 1,766,146
Total Current Liabilities . . . . . . . 840,977 41,522 2,139,594 — 3,022,093Long-term Debt . . . . . . . . . . . . . . . . . 2,701,747 1,849,428 13,080 — 4,564,255
Intercompany Payables, Net . . . . . . . . — — 2,196,041 (2,196,041) —
Other Long-term Liabilities . . . . . . . . 110,627 2,502 371,737 — 484,866
Total Liabilities . . . . . . . . . . . 3,653,351 1,893,452 4,720,452 (2,196,041) 8,071,214
Weatherford Shareholders’ Equity . . . 12,042,713 5,653,290 24,567,120 (33,938,225) 8,324,898
Noncontrolling Interests . . . . . . . . . . . — — 80,401 — 80,401
Total Liabilities andShareholders’ Equity . . . . . . $15,696,064 $7,546,742 $29,367,973 $(36,134,266) $16,476,513
AR-81
WEATHERFORD INTERNATIONAL LTD. AND SUBSIDIARIES
NOTES TO CONSOLIDATED FINANCIAL STATEMENTS — (Continued)

Condensed Consolidating Statement of IncomeYear Ended December 31, 2009
(In thousands)
Parent Bermuda DelawareOther
Subsidiaries Eliminations Consolidation
Revenues . . . . . . . . . . . . . . . . . . . $ — $ — $ — $ 8,826,933 $ — $ 8,826,933
Costs and Expenses . . . . . . . . . . . (10,609) (25,914) (3,011) (8,083,544) — (8,123,078)
Operating Income (Loss) . . . . . . . . (10,609) (25,914) (3,011) 743,389 — 703,855
Other Income (Expense):
Interest Income (Expense),Net . . . . . . . . . . . . . . . . . . . . (86) (253,403) (114,874) 1,615 — (366,748)
Intercompany Charges, Net . . . . (20,776) 5,430 (143,689) 159,035 — —
Equity in Subsidiary Income . . . 285,228 350,622 523,383 — (1,159,233) —
Other, Net . . . . . . . . . . . . . . . . . 9 208,493 (591) (245,544) — (37,633)
Income (Loss) from ContinuingOperations Before IncomeTaxes . . . . . . . . . . . . . . . . . . . . 253,766 285,228 261,218 658,495 (1,159,233) 299,474
Provision for Income Taxes . . . . . . — — 89,404 (108,953) — (19,549)
Income (Loss) from ContinuingOperations . . . . . . . . . . . . . . . . 253,766 285,228 350,622 549,542 (1,159,233) 279,925
Loss from Discontinued Operation,Net of Taxes . . . . . . . . . . . . . . . — — — — — —
Net Income (Loss) . . . . . . . . . . . . 253,766 285,228 350,622 549,542 (1,159,233) 279,925
Noncontrolling Interests . . . . . . . . — — — (26,159) — (26,159)
Net Income Attributable toWeatherford . . . . . . . . . . . . . . . $253,766 $ 285,228 $ 350,622 $ 523,383 $(1,159,233) $ 253,766
AR-82
WEATHERFORD INTERNATIONAL LTD. AND SUBSIDIARIES
NOTES TO CONSOLIDATED FINANCIAL STATEMENTS — (Continued)
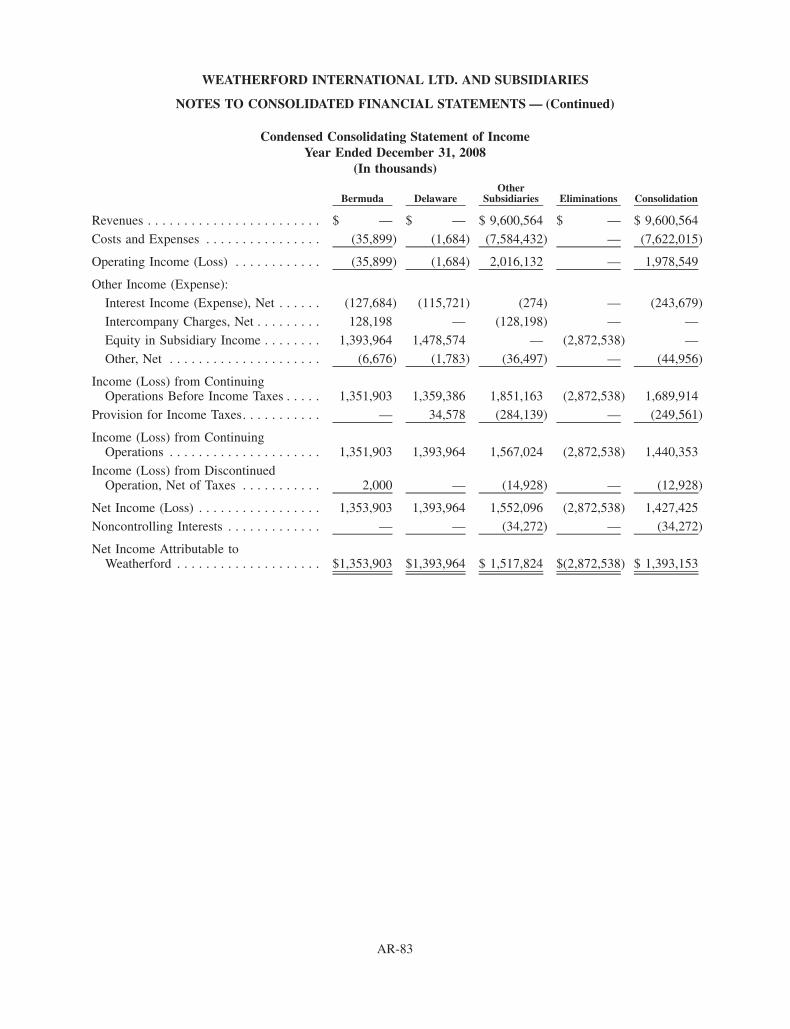
Condensed Consolidating Statement of IncomeYear Ended December 31, 2008
(In thousands)
Bermuda DelawareOther
Subsidiaries Eliminations Consolidation
Revenues . . . . . . . . . . . . . . . . . . . . . . . . $ — $ — $ 9,600,564 $ — $ 9,600,564
Costs and Expenses . . . . . . . . . . . . . . . . (35,899) (1,684) (7,584,432) — (7,622,015)
Operating Income (Loss) . . . . . . . . . . . . (35,899) (1,684) 2,016,132 — 1,978,549
Other Income (Expense):
Interest Income (Expense), Net . . . . . . (127,684) (115,721) (274) — (243,679)
Intercompany Charges, Net . . . . . . . . . 128,198 — (128,198) — —
Equity in Subsidiary Income . . . . . . . . 1,393,964 1,478,574 — (2,872,538) —
Other, Net . . . . . . . . . . . . . . . . . . . . . (6,676) (1,783) (36,497) — (44,956)
Income (Loss) from ContinuingOperations Before Income Taxes . . . . . 1,351,903 1,359,386 1,851,163 (2,872,538) 1,689,914
Provision for Income Taxes. . . . . . . . . . . — 34,578 (284,139) — (249,561)
Income (Loss) from ContinuingOperations . . . . . . . . . . . . . . . . . . . . . 1,351,903 1,393,964 1,567,024 (2,872,538) 1,440,353
Income (Loss) from DiscontinuedOperation, Net of Taxes . . . . . . . . . . . 2,000 — (14,928) — (12,928)
Net Income (Loss) . . . . . . . . . . . . . . . . . 1,353,903 1,393,964 1,552,096 (2,872,538) 1,427,425Noncontrolling Interests . . . . . . . . . . . . . — — (34,272) — (34,272)
Net Income Attributable toWeatherford . . . . . . . . . . . . . . . . . . . . $1,353,903 $1,393,964 $ 1,517,824 $(2,872,538) $ 1,393,153
AR-83
WEATHERFORD INTERNATIONAL LTD. AND SUBSIDIARIES
NOTES TO CONSOLIDATED FINANCIAL STATEMENTS — (Continued)
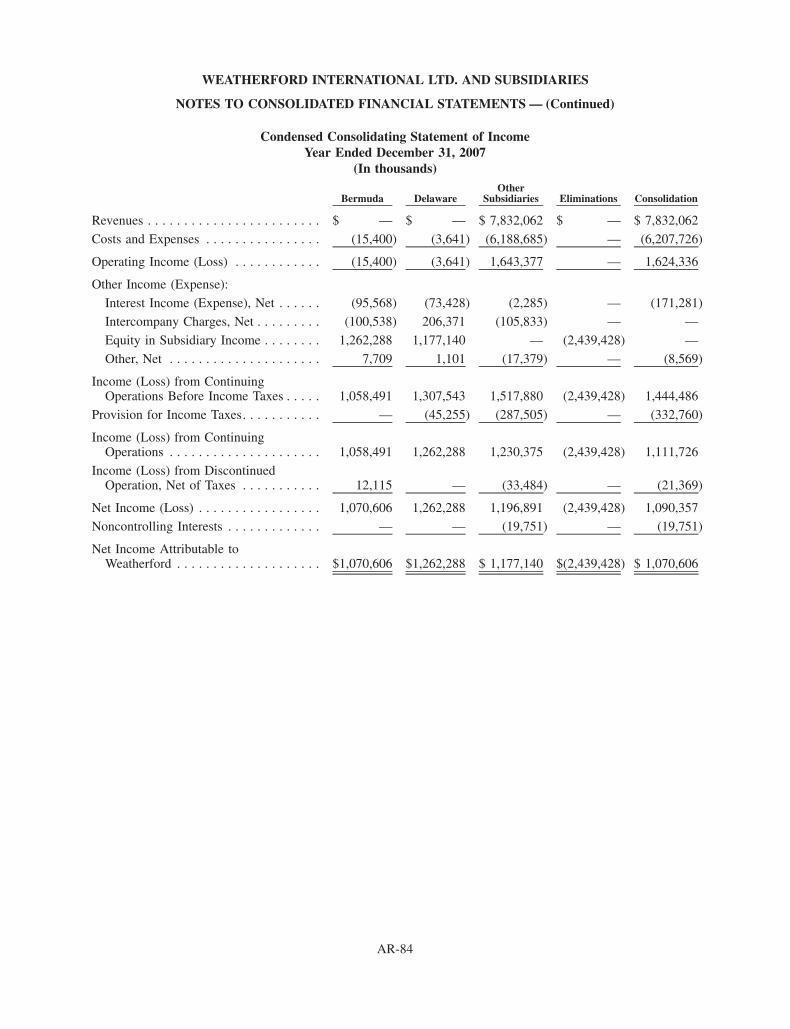
Condensed Consolidating Statement of IncomeYear Ended December 31, 2007
(In thousands)
Bermuda DelawareOther
Subsidiaries Eliminations Consolidation
Revenues . . . . . . . . . . . . . . . . . . . . . . . . $ — $ — $ 7,832,062 $ — $ 7,832,062
Costs and Expenses . . . . . . . . . . . . . . . . (15,400) (3,641) (6,188,685) — (6,207,726)
Operating Income (Loss) . . . . . . . . . . . . (15,400) (3,641) 1,643,377 — 1,624,336
Other Income (Expense):
Interest Income (Expense), Net . . . . . . (95,568) (73,428) (2,285) — (171,281)
Intercompany Charges, Net . . . . . . . . . (100,538) 206,371 (105,833) — —
Equity in Subsidiary Income . . . . . . . . 1,262,288 1,177,140 — (2,439,428) —
Other, Net . . . . . . . . . . . . . . . . . . . . . 7,709 1,101 (17,379) — (8,569)
Income (Loss) from ContinuingOperations Before Income Taxes . . . . . 1,058,491 1,307,543 1,517,880 (2,439,428) 1,444,486
Provision for Income Taxes. . . . . . . . . . . — (45,255) (287,505) — (332,760)
Income (Loss) from ContinuingOperations . . . . . . . . . . . . . . . . . . . . . 1,058,491 1,262,288 1,230,375 (2,439,428) 1,111,726
Income (Loss) from DiscontinuedOperation, Net of Taxes . . . . . . . . . . . 12,115 — (33,484) — (21,369)
Net Income (Loss) . . . . . . . . . . . . . . . . . 1,070,606 1,262,288 1,196,891 (2,439,428) 1,090,357Noncontrolling Interests . . . . . . . . . . . . . — — (19,751) — (19,751)
Net Income Attributable toWeatherford . . . . . . . . . . . . . . . . . . . . $1,070,606 $1,262,288 $ 1,177,140 $(2,439,428) $ 1,070,606
AR-84
WEATHERFORD INTERNATIONAL LTD. AND SUBSIDIARIES
NOTES TO CONSOLIDATED FINANCIAL STATEMENTS — (Continued)

Condensed Consolidating Statement of Cash FlowsYear Ended December 31, 2009
(In thousands)
Parent Bermuda DelawareOther
Subsidiaries Eliminations Consolidation
Cash Flows from Operating Activities:Net Income . . . . . . . . . . . . . . . . . . . . . . . . . . . $ 253,766 $ 285,228 $ 350,622 $ 549,542 $(1,159,233) $ 279,925Adjustments to Reconcile Net Income (Loss) to
Net Cash Provided (Used) by OperatingActivities:Charges from Parent or Subsidiary . . . . . . . . . . 20,776 (5,430) 143,689 (159,035) — —(Gain) Loss from Discontinued Operations . . . . — — — — — —Equity in (Earnings) Loss of Affiliates . . . . . . . (285,228) (350,622) (523,383) — 1,159,233 —Deferred Income Tax Provision (Benefit) . . . . . . — — (10,008) (100,318) — (110,326)Other Adjustments . . . . . . . . . . . . . . . . . . . . 7,718 (166,010) 161,307 441,708 — 444,723
Net Cash Provided (Used) by OperatingActivities — Continuing Operations . . . . . . (2,968) (236,834) 122,227 731,897 — 614,322
Net Cash Used by OperatingActivities — Discontinued Operations . . . . — — — — — —
Net Cash Provided (Used) by OperatingActivities . . . . . . . . . . . . . . . . . . . . . . . (2,968) (236,834) 122,227 731,897 — 614,322
Cash Flows from Investing Activities:Acquisitions of Businesses, Net of Cash
Acquired . . . . . . . . . . . . . . . . . . . . . . . . . . . — — — (9,695) — (9,695)Capital Expenditures for Property, Plant and
Equipment . . . . . . . . . . . . . . . . . . . . . . . . . . — — — (1,569,477) — (1,569,477)Acquisition of Intellectual Property . . . . . . . . . . . — — — (34,210) — (34,210)Purchase of Equity Investment in Unconsolidated
Affiliate . . . . . . . . . . . . . . . . . . . . . . . . . . . — — — (26,999) — (26,999)Proceeds from Sale of Assets and Businesses,
Net . . . . . . . . . . . . . . . . . . . . . . . . . . . . . . — — — 123,445 — 123,445Capital Contribution to Subsidiary . . . . . . . . . . . . — (474,465) (39) — 474,504 —
Net Cash Provided (Used) by InvestingActivities — Continuing Operations . . . . . . — (474,465) (39) (1,516,936) 474,504 (1,516,936)
Net Cash Provided by InvestingActivities — Discontinued Operations . . . . — — — — — —
Net Cash Provided (Used) by InvestingActivities . . . . . . . . . . . . . . . . . . . . . . . — (474,465) (39) (1,516,936) 474,504 (1,516,936)
Cash Flows from Financing Activities:Borrowings of (Repayments on) Short-term Debt,
Net . . . . . . . . . . . . . . . . . . . . . . . . . . . . . . — (429,070) 110 36,040 — (392,920)Borrowings of (Repayments on) Long-term Debt,
Net . . . . . . . . . . . . . . . . . . . . . . . . . . . . . . — 1,233,365 — (6,779) — 1,226,586Borrowings (Repayments) Between Subsidiaries,
Net . . . . . . . . . . . . . . . . . . . . . . . . . . . . . . 2,968 (92,973) (194,416) 284,421 — —Proceeds from Capital Contribution . . . . . . . . . . . — — — 474,504 (474,504) —Other, Net . . . . . . . . . . . . . . . . . . . . . . . . . . . — — 72,489 — — 72,489
Net Cash Provided (Used) by FinancingActivities — Continuing Operations . . . . . . 2,968 711,322 (121,817) 788,186 (474,504) 906,155
Net Cash Provided (Used) by FinancingActivities — Discontinued Operations . . . . — — — — — —
Net Cash Provided (Used) by FinancingActivities . . . . . . . . . . . . . . . . . . . . . . . 2,968 711,322 (121,817) 788,186 (474,504) 906,155
Effect of Exchange Rate Changes on Cash and CashEquivalents . . . . . . . . . . . . . . . . . . . . . . . . . . . — — — 10,580 — 10,580
Net Increase (Decrease) in Cash and CashEquivalents . . . . . . . . . . . . . . . . . . . . . . . . . . . — 23 371 13,727 — 14,121
Cash and Cash Equivalents at Beginning of Year . . . . 102 24 50 238,222 — 238,398
Cash and Cash Equivalents at End of Year . . . . . . . . $ 102 $ 47 $ 421 $ 251,949 $ — $ 252,519
AR-85
WEATHERFORD INTERNATIONAL LTD. AND SUBSIDIARIES
NOTES TO CONSOLIDATED FINANCIAL STATEMENTS — (Continued)
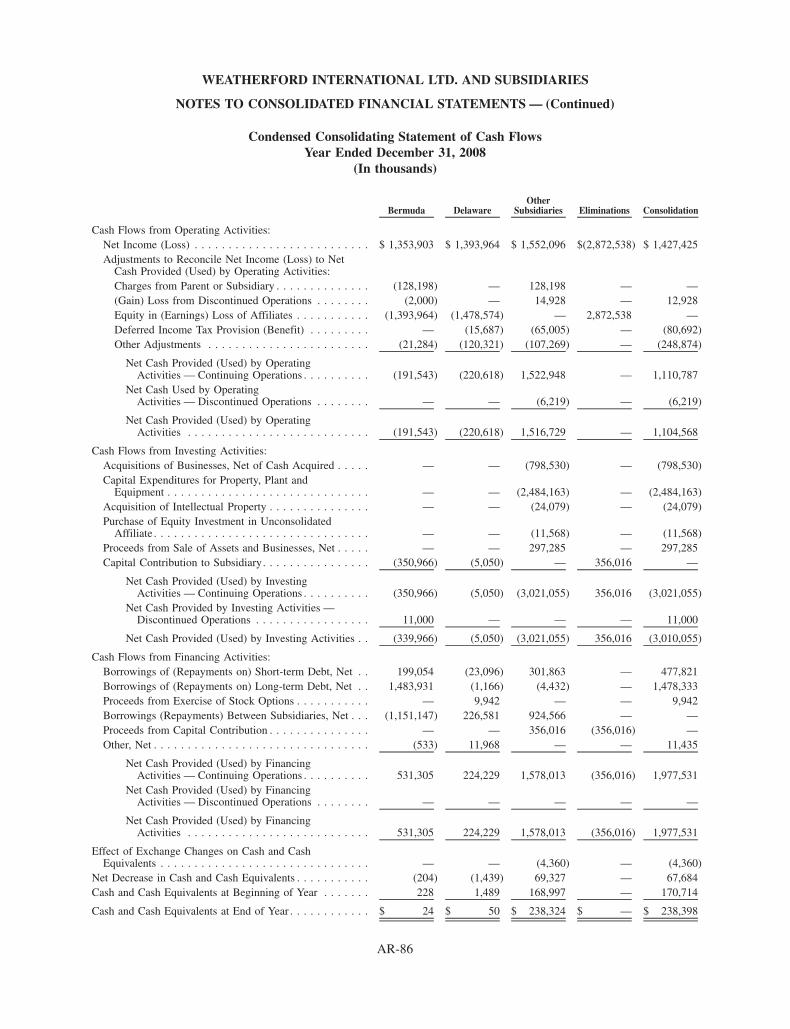
Condensed Consolidating Statement of Cash FlowsYear Ended December 31, 2008
(In thousands)
Bermuda DelawareOther
Subsidiaries Eliminations Consolidation
Cash Flows from Operating Activities:Net Income (Loss) . . . . . . . . . . . . . . . . . . . . . . . . . . $ 1,353,903 $ 1,393,964 $ 1,552,096 $(2,872,538) $ 1,427,425Adjustments to Reconcile Net Income (Loss) to Net
Cash Provided (Used) by Operating Activities:Charges from Parent or Subsidiary . . . . . . . . . . . . . . (128,198) — 128,198 — —(Gain) Loss from Discontinued Operations . . . . . . . . (2,000) — 14,928 — 12,928Equity in (Earnings) Loss of Affiliates . . . . . . . . . . . (1,393,964) (1,478,574) — 2,872,538 —Deferred Income Tax Provision (Benefit) . . . . . . . . . — (15,687) (65,005) — (80,692)Other Adjustments . . . . . . . . . . . . . . . . . . . . . . . . (21,284) (120,321) (107,269) — (248,874)
Net Cash Provided (Used) by OperatingActivities — Continuing Operations . . . . . . . . . . (191,543) (220,618) 1,522,948 — 1,110,787
Net Cash Used by OperatingActivities — Discontinued Operations . . . . . . . . — — (6,219) — (6,219)
Net Cash Provided (Used) by OperatingActivities . . . . . . . . . . . . . . . . . . . . . . . . . . . (191,543) (220,618) 1,516,729 — 1,104,568
Cash Flows from Investing Activities:Acquisitions of Businesses, Net of Cash Acquired . . . . . — — (798,530) — (798,530)Capital Expenditures for Property, Plant and
Equipment . . . . . . . . . . . . . . . . . . . . . . . . . . . . . . — — (2,484,163) — (2,484,163)Acquisition of Intellectual Property . . . . . . . . . . . . . . . — — (24,079) — (24,079)Purchase of Equity Investment in Unconsolidated
Affiliate . . . . . . . . . . . . . . . . . . . . . . . . . . . . . . . . — — (11,568) — (11,568)Proceeds from Sale of Assets and Businesses, Net . . . . . — — 297,285 — 297,285Capital Contribution to Subsidiary. . . . . . . . . . . . . . . . (350,966) (5,050) — 356,016 —
Net Cash Provided (Used) by InvestingActivities — Continuing Operations . . . . . . . . . . (350,966) (5,050) (3,021,055) 356,016 (3,021,055)
Net Cash Provided by Investing Activities —Discontinued Operations . . . . . . . . . . . . . . . . . 11,000 — — — 11,000
Net Cash Provided (Used) by Investing Activities . . (339,966) (5,050) (3,021,055) 356,016 (3,010,055)
Cash Flows from Financing Activities:Borrowings of (Repayments on) Short-term Debt, Net . . 199,054 (23,096) 301,863 — 477,821Borrowings of (Repayments on) Long-term Debt, Net . . 1,483,931 (1,166) (4,432) — 1,478,333Proceeds from Exercise of Stock Options . . . . . . . . . . . — 9,942 — — 9,942Borrowings (Repayments) Between Subsidiaries, Net . . . (1,151,147) 226,581 924,566 — —Proceeds from Capital Contribution . . . . . . . . . . . . . . . — — 356,016 (356,016) —Other, Net . . . . . . . . . . . . . . . . . . . . . . . . . . . . . . . . (533) 11,968 — — 11,435
Net Cash Provided (Used) by FinancingActivities — Continuing Operations . . . . . . . . . . 531,305 224,229 1,578,013 (356,016) 1,977,531
Net Cash Provided (Used) by FinancingActivities — Discontinued Operations . . . . . . . . — — — — —
Net Cash Provided (Used) by FinancingActivities . . . . . . . . . . . . . . . . . . . . . . . . . . . 531,305 224,229 1,578,013 (356,016) 1,977,531
Effect of Exchange Changes on Cash and CashEquivalents . . . . . . . . . . . . . . . . . . . . . . . . . . . . . . . — — (4,360) — (4,360)
Net Decrease in Cash and Cash Equivalents . . . . . . . . . . . (204) (1,439) 69,327 — 67,684Cash and Cash Equivalents at Beginning of Year . . . . . . . 228 1,489 168,997 — 170,714
Cash and Cash Equivalents at End of Year . . . . . . . . . . . . $ 24 $ 50 $ 238,324 $ — $ 238,398
AR-86
WEATHERFORD INTERNATIONAL LTD. AND SUBSIDIARIES
NOTES TO CONSOLIDATED FINANCIAL STATEMENTS — (Continued)

Condensed Consolidating Statement of Cash FlowsYear Ended December 31, 2007
(In thousands)
Bermuda DelawareOther
Subsidiaries Eliminations Consolidation
Cash Flows from Operating Activities:Net Income (Loss) . . . . . . . . . . . . . . . . . . . . . . . . . . . $ 1,070,606 $ 1,262,288 $ 1,196,891 $(2,439,428) $ 1,090,357Adjustments to Reconcile Net Income (Loss) to Net Cash
Provided (Used) by Operating Activities:Charges from Parent or Subsidiary. . . . . . . . . . . . . . . 100,538 (206,371) 105,833 — —(Income) Loss from Discontinued Operation . . . . . . . . (12,115) — 33,484 — 21,369Equity in (Earnings) Loss of Affiliates . . . . . . . . . . . . (1,262,288) (1,177,140) — 2,439,428 —Deferred Income Tax Provision (Benefit) . . . . . . . . . . — (16,788) 45,661 — 28,873Other Adjustments . . . . . . . . . . . . . . . . . . . . . . . . . 413,899 (115,003) (556,840) — (257,944)
Net Cash Provided (Used) by Operating Activities —Continuing Operations . . . . . . . . . . . . . . . . . . . 310,640 (253,014) 825,029 — 882,655
Net Cash Used by Operating Activities —Discontinued Operation . . . . . . . . . . . . . . . . . . . — — (10,149) — (10,149)
Net Cash Provided (Used) by Operating Activities . . 310,640 (253,014) 814,880 — 872,506
Cash Flows from Investing Activities:Acquisitions of Businesses, Net of Cash Acquired . . . . . . — — (275,149) — (275,149)Purchase of Equity Investments in Unconsolidated
Affiliates . . . . . . . . . . . . . . . . . . . . . . . . . . . . . . . . — — (335,220) — (335,220)Capital Expenditures for Property, Plant and Equipment . . — — (1,635,041) — (1,635,041)Acquisition of Intellectual Property . . . . . . . . . . . . . . . . — — (23,035) — (23,035)Proceeds from Sale of Assets and Businesses, Net . . . . . . — — 84,476 — 84,476Capital Contribution to Subsidiary . . . . . . . . . . . . . . . . (736,748) (36,147) — 772,895 —Distribution of Earnings from Subsidiary . . . . . . . . . . . . — (1,486,365) 1,486,365 — —Other Investing Activities . . . . . . . . . . . . . . . . . . . . . . — — (38,500) — (38,500)
Net Cash Provided (Used) by Investing Activities —Continuing Operations . . . . . . . . . . . . . . . . . . . (736,748) (1,522,512) (736,104) 772,895 (2,222,469)
Net Cash Used by Investing Activities —Discontinued Operation . . . . . . . . . . . . . . . . . . . — — (10,579) — (10,579)
Net Cash Provided (Used) by Investing Activities . . . (736,748) (1,522,512) (746,683) 772,895 (2,233,048)
Cash Flows from Financing Activities:Borrowings of (Repayments on) Short-term Debt, Net . . . (299,187) 16,361 400,691 — 117,865Borrowings of (Repayments on) Long-term Debt, Net . . . — 1,485,497 (14,734) — 1,470,763Borrowings (Repayments) Between Subsidiaries, Net . . . . 725,488 213,695 (939,183) — —Purchase of Treasury Shares . . . . . . . . . . . . . . . . . . . . — — (246,190) — (246,190)Proceeds from Exercise of Stock Options . . . . . . . . . . . . — 34,192 — — 34,192Proceeds from Capital Contribution. . . . . . . . . . . . . . . . — — 772,895 (772,895) —Other, Net . . . . . . . . . . . . . . . . . . . . . . . . . . . . . . . . — 24,999 — — 24,999
Net Cash Provided (Used) by FinancingActivities — Continuing Operations . . . . . . . . . . 426,301 1,774,744 (26,521) (772,895) 1,401,629
Net Cash Provided by Financing Activities —Discontinued Operation . . . . . . . . . . . . . . . . . . . — — — — —
Net Cash Provided (Used) by Financing Activities . . 426,301 1,774,744 (26,521) (772,895) 1,401,629
Effect of Exchange Rate Changes on Cash and CashEquivalents . . . . . . . . . . . . . . . . . . . . . . . . . . . . . . . . — — 3,340 — 3,340
Net Increase (Decrease) in Cash and Cash Equivalents . . . . 193 (782) 45,016 — 44,427Cash and Cash Equivalents at Beginning of Year . . . . . . . . 35 2,271 123,981 — 126,287
Cash and Cash Equivalents at End of Year . . . . . . . . . . . . $ 228 $ 1,489 $ 168,997 $ — $ 170,714
AR-87
WEATHERFORD INTERNATIONAL LTD. AND SUBSIDIARIES
NOTES TO CONSOLIDATED FINANCIAL STATEMENTS — (Continued)
Item 9. Changes in and Disagreement with Accountants on Accounting and Financial Disclosure
None.
Item 9A. Controls and Procedures
Evaluation of disclosure controls and procedures.
At the end of the period covered by this Annual Report on Form 10-K, we carried out an evaluation, under thesupervision and with the participation of management, including the Chief Executive Officer (“CEO”) and theChief Financial Officer (“CFO”), of the effectiveness of our disclosure controls and procedures (as defined inRules 13a-15 (e) and 15d-15 (e) under the Exchange Act). Based upon that evaluation, our CEO and CFO haveconcluded our disclosure controls and procedures are effective as of the end of the period covered by this report toensure that information required to be disclosed by us in the reports we file or submit under the Exchange Act isrecorded, processed, summarized and reported within the time periods specified in the Securities and ExchangeCommission’s rules and forms and that information relating to us (including our consolidated subsidiaries) requiredto be disclosed is accumulated and communicated to management, including the CEO and CFO, to allow timelydecisions regarding required disclosure.
Changes in internal controls.
Our management, including the CEO and CFO, identified no change in our internal control over financialreporting that occurred during our fiscal quarter ended December 31, 2009 that has materially affected, or isreasonably likely to materially affect, our internal controls over financial reporting.
Internal controls over financial reporting.
Management’s report on our internal controls over financial reporting can be found in Item 8 of this report.
Item 9B. Other Information
None
PART III
Item 10. Directors, Executive Officers and Corporate Governance
Pursuant to General Instructions G(3), information on directors and executive officers of the Registrant will befiled in an amendment to this Annual Report on Form 10-K or incorporated by reference from our definitive proxystatement for the annual meeting to be held on June 23, 2010.
The Company has adopted a code of ethics entitled “Code of Business Conduct,” which applies to all ouremployees, officers and directors and our board of directors has also adopted a separate “Supplemental Code ofBusiness Conduct” for our senior officers. Copies of these codes can also be found at www.weatherford.com.
Item 11. Executive Compensation
Pursuant to General Instructions G(3), information on executive compensation will be filed in an amendmentto this Annual Report on Form 10-K or incorporated by reference from our definitive proxy statement for the annualmeeting to be held on June 23, 2010.
Item 12(a). Security Ownership of Certain Beneficial Owners.
Pursuant to General Instructions G(3), information on security ownership of certain beneficial owners will befiled in an amendment to this Annual Report on Form 10-K or incorporated by reference from our definitive proxystatement for the annual meeting to be held on June 23, 2010.
AR-88
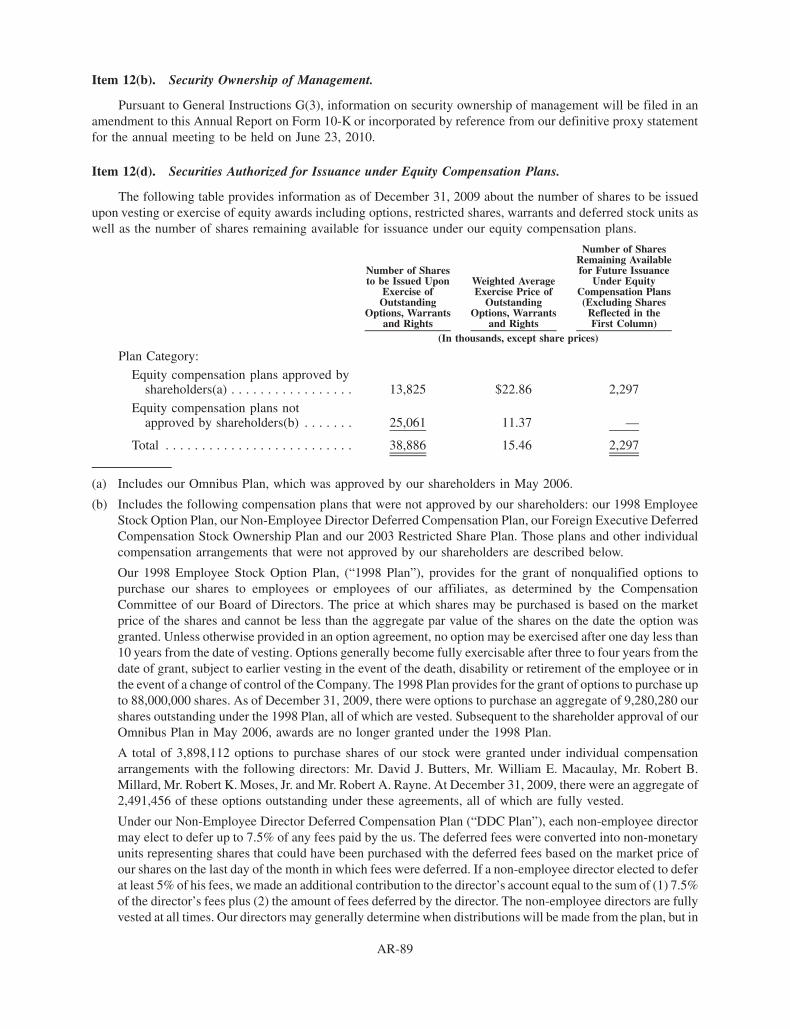
Item 12(b). Security Ownership of Management.
Pursuant to General Instructions G(3), information on security ownership of management will be filed in anamendment to this Annual Report on Form 10-K or incorporated by reference from our definitive proxy statementfor the annual meeting to be held on June 23, 2010.
Item 12(d). Securities Authorized for Issuance under Equity Compensation Plans.
The following table provides information as of December 31, 2009 about the number of shares to be issuedupon vesting or exercise of equity awards including options, restricted shares, warrants and deferred stock units aswell as the number of shares remaining available for issuance under our equity compensation plans.
Number of Sharesto be Issued Upon
Exercise ofOutstanding
Options, Warrantsand Rights
Weighted AverageExercise Price of
OutstandingOptions, Warrants
and Rights
Number of SharesRemaining Availablefor Future Issuance
Under EquityCompensation Plans(Excluding Shares
Reflected in theFirst Column)
(In thousands, except share prices)
Plan Category:
Equity compensation plans approved byshareholders(a) . . . . . . . . . . . . . . . . . 13,825 $22.86 2,297
Equity compensation plans notapproved by shareholders(b) . . . . . . . 25,061 11.37 —
Total . . . . . . . . . . . . . . . . . . . . . . . . . . 38,886 15.46 2,297
(a) Includes our Omnibus Plan, which was approved by our shareholders in May 2006.
(b) Includes the following compensation plans that were not approved by our shareholders: our 1998 EmployeeStock Option Plan, our Non-Employee Director Deferred Compensation Plan, our Foreign Executive DeferredCompensation Stock Ownership Plan and our 2003 Restricted Share Plan. Those plans and other individualcompensation arrangements that were not approved by our shareholders are described below.
Our 1998 Employee Stock Option Plan, (“1998 Plan”), provides for the grant of nonqualified options topurchase our shares to employees or employees of our affiliates, as determined by the CompensationCommittee of our Board of Directors. The price at which shares may be purchased is based on the marketprice of the shares and cannot be less than the aggregate par value of the shares on the date the option wasgranted. Unless otherwise provided in an option agreement, no option may be exercised after one day less than10 years from the date of vesting. Options generally become fully exercisable after three to four years from thedate of grant, subject to earlier vesting in the event of the death, disability or retirement of the employee or inthe event of a change of control of the Company. The 1998 Plan provides for the grant of options to purchase upto 88,000,000 shares. As of December 31, 2009, there were options to purchase an aggregate of 9,280,280 ourshares outstanding under the 1998 Plan, all of which are vested. Subsequent to the shareholder approval of ourOmnibus Plan in May 2006, awards are no longer granted under the 1998 Plan.
A total of 3,898,112 options to purchase shares of our stock were granted under individual compensationarrangements with the following directors: Mr. David J. Butters, Mr. William E. Macaulay, Mr. Robert B.Millard, Mr. Robert K. Moses, Jr. and Mr. Robert A. Rayne. At December 31, 2009, there were an aggregate of2,491,456 of these options outstanding under these agreements, all of which are fully vested.
Under our Non-Employee Director Deferred Compensation Plan (“DDC Plan”), each non-employee directormay elect to defer up to 7.5% of any fees paid by the us. The deferred fees were converted into non-monetaryunits representing shares that could have been purchased with the deferred fees based on the market price ofour shares on the last day of the month in which fees were deferred. If a non-employee director elected to deferat least 5% of his fees, we made an additional contribution to the director’s account equal to the sum of (1) 7.5%of the director’s fees plus (2) the amount of fees deferred by the director. The non-employee directors are fullyvested at all times. Our directors may generally determine when distributions will be made from the plan, but in
AR-89

any event all benefits under the DDC Plan will be distributed no later than January 1, 2017. The amount of thedistribution will be a number of our shares equal to the number of units at the time of distribution. As ofDecember 31, 2009, there were 121,226 deferred units outstanding under this plan. Effective December 31,2008, we suspended the DDC Plan. While the plan is suspended, no new participants may join the plan and nofurther deferrals of fees or matching contributions will be made under the plan unless and until our Board ofDirectors determines otherwise.
We established our Foreign Executive Deferred Compensation Stock Ownership Plan for key foreignemployees (“FEDC Plan”) and under this plan we contribute 15% of each participant’s total salary, bonusand commission compensation each year. Our contributions vest over a five-year period on the basis of 20%per year for each year of service. Under the FEDC Plan, our contributions are converted into non-monetaryunits equal to the number of our shares that could have been purchased with the amounts contributed based onthe average closing price of our shares for each day of the month in which contributions are made. Distributionsare made under the FEDC Plan after a participant retires, becomes disabled or dies or after his employment isterminated, but in any event all benefits under the FEDC Plan will be distributed no later than January 1, 2017.Distributions under the FEDC Plan are made in a number of our shares equal to the number of units allocated tothe participant’s account at the time of distribution. As of December 31, 2009, there were 153,490 deferredunits outstanding under this plan.
We issued warrants to purchase up to 12,928,856 of our shares at a price of $15.00 per share, which areexercisable until February 28, 2012. The warrant holders may exercise the warrants and settlement may occurthrough physical delivery, net share settlement, net cash settlement or a combination thereof. The net cashsettlement option upon exercise is at our sole discretion.
In 2003, our Board of Directors approved a restricted share plan that allows for the grant of up to 15,340,000 ofour shares to our key employees and directors (“2003 Restricted Share Plan”). Restricted shares are subject toforfeiture restrictions that generally lapse after a specified period from the date of grant and are subject toearlier vesting in the event of death, retirement or a change in control. As of December 31, 2009, there were12,534,835 shares granted net of forfeitures under the 2003 Restricted Share Plan and 86,000 shares areunvested. Subsequent to the shareholder approval of our Omnibus Plan in May 2006, awards are no longermade under this plan.
Item 13. Certain Relationships and Related Transactions and Director Independence
Pursuant to General Instruction G(3), information on certain relationships and related transactions and directorindependence will be filed in an amendment to this Annual Report on Form 10-K or incorporated by reference fromour definitive proxy statement for the annual meeting to be held on June 23, 2010.
Item 14. Principal Accountant Fees and Services
Pursuant to General Instruction G(3), information on principal accountant fees and services will be filed in anamendment to this Annual Report on Form 10-K or incorporated by reference from our definitive proxy statementfor the annual meeting to be held on June 23, 2010.
AR-90
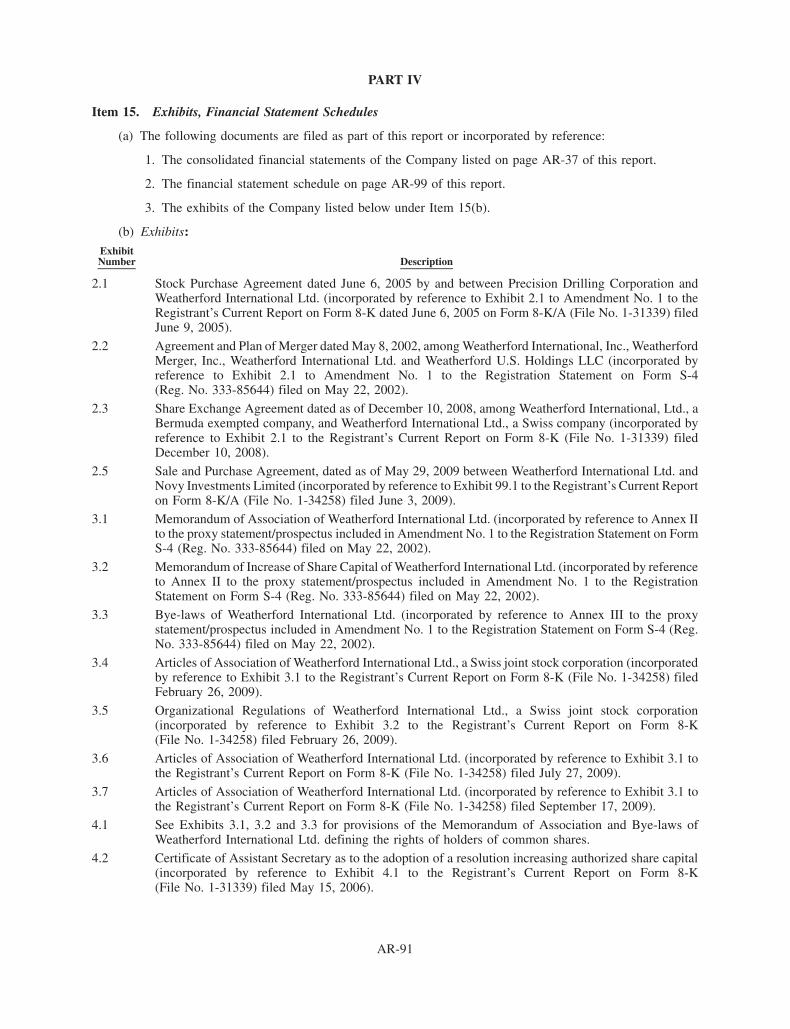
PART IV
Item 15. Exhibits, Financial Statement Schedules
(a) The following documents are filed as part of this report or incorporated by reference:
1. The consolidated financial statements of the Company listed on page AR-37 of this report.
2. The financial statement schedule on page AR-99 of this report.
3. The exhibits of the Company listed below under Item 15(b).
(b) Exhibits:ExhibitNumber Description
2.1 Stock Purchase Agreement dated June 6, 2005 by and between Precision Drilling Corporation andWeatherford International Ltd. (incorporated by reference to Exhibit 2.1 to Amendment No. 1 to theRegistrant’s Current Report on Form 8-K dated June 6, 2005 on Form 8-K/A (File No. 1-31339) filedJune 9, 2005).
2.2 Agreement and Plan of Merger dated May 8, 2002, among Weatherford International, Inc., WeatherfordMerger, Inc., Weatherford International Ltd. and Weatherford U.S. Holdings LLC (incorporated byreference to Exhibit 2.1 to Amendment No. 1 to the Registration Statement on Form S-4(Reg. No. 333-85644) filed on May 22, 2002).
2.3 Share Exchange Agreement dated as of December 10, 2008, among Weatherford International, Ltd., aBermuda exempted company, and Weatherford International Ltd., a Swiss company (incorporated byreference to Exhibit 2.1 to the Registrant’s Current Report on Form 8-K (File No. 1-31339) filedDecember 10, 2008).
2.5 Sale and Purchase Agreement, dated as of May 29, 2009 between Weatherford International Ltd. andNovy Investments Limited (incorporated by reference to Exhibit 99.1 to the Registrant’s Current Reporton Form 8-K/A (File No. 1-34258) filed June 3, 2009).
3.1 Memorandum of Association of Weatherford International Ltd. (incorporated by reference to Annex IIto the proxy statement/prospectus included in Amendment No. 1 to the Registration Statement on FormS-4 (Reg. No. 333-85644) filed on May 22, 2002).
3.2 Memorandum of Increase of Share Capital of Weatherford International Ltd. (incorporated by referenceto Annex II to the proxy statement/prospectus included in Amendment No. 1 to the RegistrationStatement on Form S-4 (Reg. No. 333-85644) filed on May 22, 2002).
3.3 Bye-laws of Weatherford International Ltd. (incorporated by reference to Annex III to the proxystatement/prospectus included in Amendment No. 1 to the Registration Statement on Form S-4 (Reg.No. 333-85644) filed on May 22, 2002).
3.4 Articles of Association of Weatherford International Ltd., a Swiss joint stock corporation (incorporatedby reference to Exhibit 3.1 to the Registrant’s Current Report on Form 8-K (File No. 1-34258) filedFebruary 26, 2009).
3.5 Organizational Regulations of Weatherford International Ltd., a Swiss joint stock corporation(incorporated by reference to Exhibit 3.2 to the Registrant’s Current Report on Form 8-K(File No. 1-34258) filed February 26, 2009).
3.6 Articles of Association of Weatherford International Ltd. (incorporated by reference to Exhibit 3.1 tothe Registrant’s Current Report on Form 8-K (File No. 1-34258) filed July 27, 2009).
3.7 Articles of Association of Weatherford International Ltd. (incorporated by reference to Exhibit 3.1 tothe Registrant’s Current Report on Form 8-K (File No. 1-34258) filed September 17, 2009).
4.1 See Exhibits 3.1, 3.2 and 3.3 for provisions of the Memorandum of Association and Bye-laws ofWeatherford International Ltd. defining the rights of holders of common shares.
4.2 Certificate of Assistant Secretary as to the adoption of a resolution increasing authorized share capital(incorporated by reference to Exhibit 4.1 to the Registrant’s Current Report on Form 8-K(File No. 1-31339) filed May 15, 2006).
AR-91
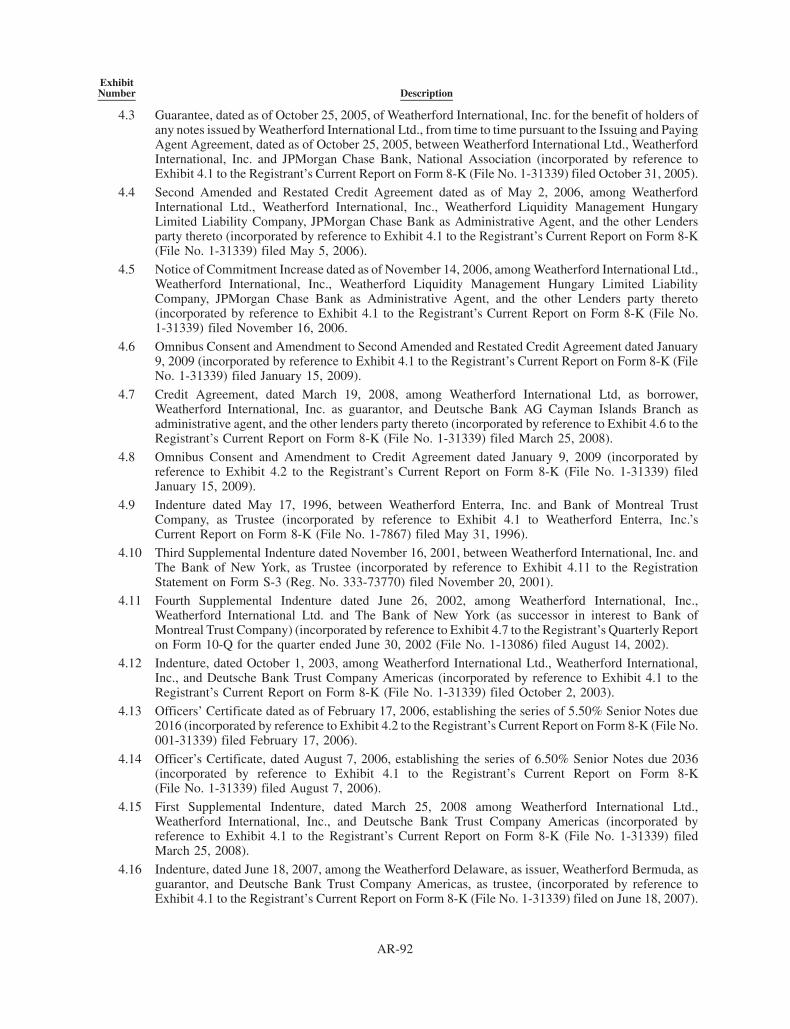
ExhibitNumber Description
4.3 Guarantee, dated as of October 25, 2005, of Weatherford International, Inc. for the benefit of holders ofany notes issued by Weatherford International Ltd., from time to time pursuant to the Issuing and PayingAgent Agreement, dated as of October 25, 2005, between Weatherford International Ltd., WeatherfordInternational, Inc. and JPMorgan Chase Bank, National Association (incorporated by reference toExhibit 4.1 to the Registrant’s Current Report on Form 8-K (File No. 1-31339) filed October 31, 2005).
4.4 Second Amended and Restated Credit Agreement dated as of May 2, 2006, among WeatherfordInternational Ltd., Weatherford International, Inc., Weatherford Liquidity Management HungaryLimited Liability Company, JPMorgan Chase Bank as Administrative Agent, and the other Lendersparty thereto (incorporated by reference to Exhibit 4.1 to the Registrant’s Current Report on Form 8-K(File No. 1-31339) filed May 5, 2006).
4.5 Notice of Commitment Increase dated as of November 14, 2006, among Weatherford International Ltd.,Weatherford International, Inc., Weatherford Liquidity Management Hungary Limited LiabilityCompany, JPMorgan Chase Bank as Administrative Agent, and the other Lenders party thereto(incorporated by reference to Exhibit 4.1 to the Registrant’s Current Report on Form 8-K (File No.1-31339) filed November 16, 2006.
4.6 Omnibus Consent and Amendment to Second Amended and Restated Credit Agreement dated January9, 2009 (incorporated by reference to Exhibit 4.1 to the Registrant’s Current Report on Form 8-K (FileNo. 1-31339) filed January 15, 2009).
4.7 Credit Agreement, dated March 19, 2008, among Weatherford International Ltd, as borrower,Weatherford International, Inc. as guarantor, and Deutsche Bank AG Cayman Islands Branch asadministrative agent, and the other lenders party thereto (incorporated by reference to Exhibit 4.6 to theRegistrant’s Current Report on Form 8-K (File No. 1-31339) filed March 25, 2008).
4.8 Omnibus Consent and Amendment to Credit Agreement dated January 9, 2009 (incorporated byreference to Exhibit 4.2 to the Registrant’s Current Report on Form 8-K (File No. 1-31339) filedJanuary 15, 2009).
4.9 Indenture dated May 17, 1996, between Weatherford Enterra, Inc. and Bank of Montreal TrustCompany, as Trustee (incorporated by reference to Exhibit 4.1 to Weatherford Enterra, Inc.’sCurrent Report on Form 8-K (File No. 1-7867) filed May 31, 1996).
4.10 Third Supplemental Indenture dated November 16, 2001, between Weatherford International, Inc. andThe Bank of New York, as Trustee (incorporated by reference to Exhibit 4.11 to the RegistrationStatement on Form S-3 (Reg. No. 333-73770) filed November 20, 2001).
4.11 Fourth Supplemental Indenture dated June 26, 2002, among Weatherford International, Inc.,Weatherford International Ltd. and The Bank of New York (as successor in interest to Bank ofMontreal Trust Company) (incorporated by reference to Exhibit 4.7 to the Registrant’s Quarterly Reporton Form 10-Q for the quarter ended June 30, 2002 (File No. 1-13086) filed August 14, 2002).
4.12 Indenture, dated October 1, 2003, among Weatherford International Ltd., Weatherford International,Inc., and Deutsche Bank Trust Company Americas (incorporated by reference to Exhibit 4.1 to theRegistrant’s Current Report on Form 8-K (File No. 1-31339) filed October 2, 2003).
4.13 Officers’ Certificate dated as of February 17, 2006, establishing the series of 5.50% Senior Notes due2016 (incorporated by reference to Exhibit 4.2 to the Registrant’s Current Report on Form 8-K (File No.001-31339) filed February 17, 2006).
4.14 Officer’s Certificate, dated August 7, 2006, establishing the series of 6.50% Senior Notes due 2036(incorporated by reference to Exhibit 4.1 to the Registrant’s Current Report on Form 8-K(File No. 1-31339) filed August 7, 2006).
4.15 First Supplemental Indenture, dated March 25, 2008 among Weatherford International Ltd.,Weatherford International, Inc., and Deutsche Bank Trust Company Americas (incorporated byreference to Exhibit 4.1 to the Registrant’s Current Report on Form 8-K (File No. 1-31339) filedMarch 25, 2008).
4.16 Indenture, dated June 18, 2007, among the Weatherford Delaware, as issuer, Weatherford Bermuda, asguarantor, and Deutsche Bank Trust Company Americas, as trustee, (incorporated by reference toExhibit 4.1 to the Registrant’s Current Report on Form 8-K (File No. 1-31339) filed on June 18, 2007).
AR-92
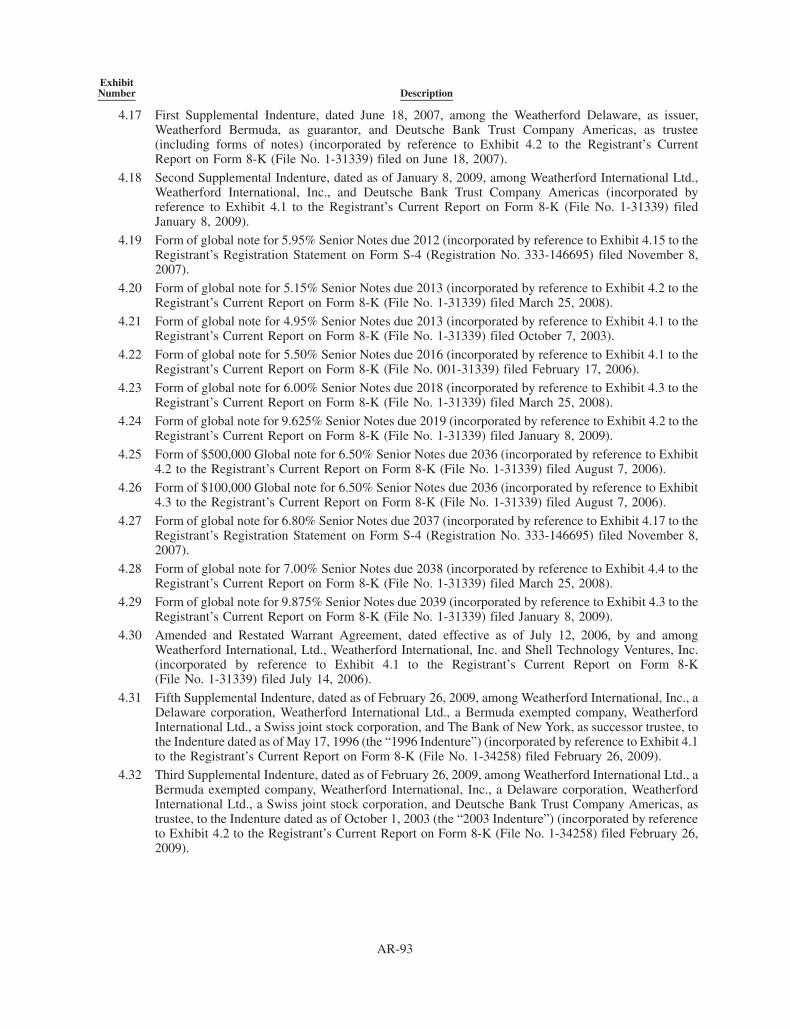
ExhibitNumber Description
4.17 First Supplemental Indenture, dated June 18, 2007, among the Weatherford Delaware, as issuer,Weatherford Bermuda, as guarantor, and Deutsche Bank Trust Company Americas, as trustee(including forms of notes) (incorporated by reference to Exhibit 4.2 to the Registrant’s CurrentReport on Form 8-K (File No. 1-31339) filed on June 18, 2007).
4.18 Second Supplemental Indenture, dated as of January 8, 2009, among Weatherford International Ltd.,Weatherford International, Inc., and Deutsche Bank Trust Company Americas (incorporated byreference to Exhibit 4.1 to the Registrant’s Current Report on Form 8-K (File No. 1-31339) filedJanuary 8, 2009).
4.19 Form of global note for 5.95% Senior Notes due 2012 (incorporated by reference to Exhibit 4.15 to theRegistrant’s Registration Statement on Form S-4 (Registration No. 333-146695) filed November 8,2007).
4.20 Form of global note for 5.15% Senior Notes due 2013 (incorporated by reference to Exhibit 4.2 to theRegistrant’s Current Report on Form 8-K (File No. 1-31339) filed March 25, 2008).
4.21 Form of global note for 4.95% Senior Notes due 2013 (incorporated by reference to Exhibit 4.1 to theRegistrant’s Current Report on Form 8-K (File No. 1-31339) filed October 7, 2003).
4.22 Form of global note for 5.50% Senior Notes due 2016 (incorporated by reference to Exhibit 4.1 to theRegistrant’s Current Report on Form 8-K (File No. 001-31339) filed February 17, 2006).
4.23 Form of global note for 6.00% Senior Notes due 2018 (incorporated by reference to Exhibit 4.3 to theRegistrant’s Current Report on Form 8-K (File No. 1-31339) filed March 25, 2008).
4.24 Form of global note for 9.625% Senior Notes due 2019 (incorporated by reference to Exhibit 4.2 to theRegistrant’s Current Report on Form 8-K (File No. 1-31339) filed January 8, 2009).
4.25 Form of $500,000 Global note for 6.50% Senior Notes due 2036 (incorporated by reference to Exhibit4.2 to the Registrant’s Current Report on Form 8-K (File No. 1-31339) filed August 7, 2006).
4.26 Form of $100,000 Global note for 6.50% Senior Notes due 2036 (incorporated by reference to Exhibit4.3 to the Registrant’s Current Report on Form 8-K (File No. 1-31339) filed August 7, 2006).
4.27 Form of global note for 6.80% Senior Notes due 2037 (incorporated by reference to Exhibit 4.17 to theRegistrant’s Registration Statement on Form S-4 (Registration No. 333-146695) filed November 8,2007).
4.28 Form of global note for 7.00% Senior Notes due 2038 (incorporated by reference to Exhibit 4.4 to theRegistrant’s Current Report on Form 8-K (File No. 1-31339) filed March 25, 2008).
4.29 Form of global note for 9.875% Senior Notes due 2039 (incorporated by reference to Exhibit 4.3 to theRegistrant’s Current Report on Form 8-K (File No. 1-31339) filed January 8, 2009).
4.30 Amended and Restated Warrant Agreement, dated effective as of July 12, 2006, by and amongWeatherford International, Ltd., Weatherford International, Inc. and Shell Technology Ventures, Inc.(incorporated by reference to Exhibit 4.1 to the Registrant’s Current Report on Form 8-K(File No. 1-31339) filed July 14, 2006).
4.31 Fifth Supplemental Indenture, dated as of February 26, 2009, among Weatherford International, Inc., aDelaware corporation, Weatherford International Ltd., a Bermuda exempted company, WeatherfordInternational Ltd., a Swiss joint stock corporation, and The Bank of New York, as successor trustee, tothe Indenture dated as of May 17, 1996 (the “1996 Indenture”) (incorporated by reference to Exhibit 4.1to the Registrant’s Current Report on Form 8-K (File No. 1-34258) filed February 26, 2009).
4.32 Third Supplemental Indenture, dated as of February 26, 2009, among Weatherford International Ltd., aBermuda exempted company, Weatherford International, Inc., a Delaware corporation, WeatherfordInternational Ltd., a Swiss joint stock corporation, and Deutsche Bank Trust Company Americas, astrustee, to the Indenture dated as of October 1, 2003 (the “2003 Indenture”) (incorporated by referenceto Exhibit 4.2 to the Registrant’s Current Report on Form 8-K (File No. 1-34258) filed February 26,2009).
AR-93

ExhibitNumber Description
4.33 Second Supplemental Indenture, dated as of February 26, 2009, among Weatherford International, Inc.,a Delaware corporation, Weatherford International Ltd., a Bermuda exempted company, WeatherfordInternational Ltd., a Swiss joint stock corporation, and Deutsche Bank Trust Company Americas, astrustee, to the Indenture dated as of June 18, 2007 (the “2007 Indenture”) (incorporated by reference toExhibit 4.3 to the Registrant’s Current Report on Form 8-K (File No. 1-34258) filed February 26, 2009).
4.34 Opinion of Baker & McKenzie Geneva relating to the guarantees of Weatherford International Ltd., aSwiss joint stock corporation, with respect to the 9.625% Senior Notes due 2019 and 9.875% SeniorNotes due 2039, issued by Weatherford International Ltd., a Bermuda exempted company, under the2003 Indenture (incorporated by reference to Exhibit 5.1 to the Registrant’s Current Report on Form 8-K (File No. 1-34258) filed February 26, 2009).
4.35 Opinion of Andrews Kurth relating to the guarantees of Weatherford International Ltd., a Swiss jointstock corporation, with respect to the 9.625% Senior Notes due 2019 and 9.875% Senior Notes due2039, issued by Weatherford International Ltd., a Bermuda exempted company, under the 2003Indenture (incorporated by reference to Exhibit 5.2 to the Registrant’s Current Report on Form 8-K(File No. 1-34258) filed February 26, 2009).
4.36 Registration Rights Agreement, dated as of July 27, 2009 between Weatherford International Ltd. andNovy Investments Limited (incorporated by reference to Exhibit 4.1 to the Registrant’s Current Reporton Form 8-K (File No. 1-34258) filed July 27, 2009).
4.37 Registration Rights Agreement, dated as of September 16, 2009 between Weatherford InternationalLtd. and Integrity Energy International, LLC. (incorporated by reference to Exhibit 4.1 to theRegistrant’s Current Report on Form 8-K (File No. 1-34258) filed September 17, 2009).
10.1 Issuing and Paying Agent Agreement, dated as of October 25, 2005, among Weatherford InternationalLtd., Weatherford International, Inc. and JPMorgan Chase Bank, National Association (incorporated byreference to Exhibit 10.1 to the Registrant’s Current Report on Form 8-K (File No. 1-31339) filedOctober 31, 2005).
10.2 Commercial Paper Dealer Agreement, dated as of October 25, 2005, among Weatherford InternationalLtd., Weatherford International, Inc. and J.P. Morgan Securities Inc. (incorporated by reference toExhibit 10.2 to the Registrant’s Current Report on Form 8-K (File No. 1-31339) filed October 31, 2005).
10.3 Commercial Paper Dealer Agreement, dated as of October 25, 2005, among Weatherford InternationalLtd., Weatherford International, Inc. and Goldman, Sachs & Co. (incorporated by reference to Exhibit10.3 to the Registrant’s Current Report on Form 8-K (File No. 1-31339) filed October 31, 2005).
10.4 Commercial Paper Dealer Agreement, dated as of October 25, 2005, among Weatherford InternationalLtd., Weatherford International, Inc. and Merrill Lynch Money Markets Inc. (for notes with maturitiesup to 270 days) and Merrill Lynch, Pierce, Fenner & Smith Incorporated, (for notes with maturities over270 days up to 397 days) (incorporated by reference to Exhibit 10.4 to the Registrant’s Current Reporton Form 8-K (File No. 1-31339) filed October 31, 2005).
*10.5 Weatherford International Ltd. Restricted Share Plan, including form of agreement for officers and non-officers (incorporated by reference to Exhibit 10.2 to Amendment No. 1 to the Registrant’s QuarterlyReport on Form 10-Q for the quarter ended March 31, 2004 on Form 10-Q/A (File No. 1-31339) filedSeptember 15, 2004).
*10.6 Trust under Weatherford International Ltd. Nonqualified Executive Retirement Plan dated March 23,2004 (incorporated by reference to Exhibit 10.1 to the Registrant’s Quarterly Report on Form 10-Q forthe quarter ended March 31, 2004 (File No. 1-31339) filed May 6, 2004).
*10.7 Amended and Restated Non-Employee Director Stock Option Plan (incorporated by reference toExhibit 10.1 to the Registrant’s Quarterly Report on Form 10-Q for the quarter ended June 30, 1995(File No. 1-13086) filed August 12, 1995).
*10.8 General Amendment of Employee Stock Option Programs of Weatherford International, Inc. datedMay 9, 2003 (incorporated by reference to Exhibit 10.1 to the Registrant’s Quarterly Report on Form10-Q for the quarter ended June 30, 2003 (File No. 1-31339) filed August 14, 2003).
*10.9 General Amendment of Director’s Stock Option Plans and Agreements dated May 9, 2003(incorporated by reference to Exhibit 10.2 to the Registrant’s Quarterly Report on Form 10-Q forthe quarter ended June 30, 2003 (File No. 1-31339) filed August 14, 2003).
AR-94

ExhibitNumber Description
*10.10 Weatherford International, Inc. 1998 Employee Stock Option Plan, as amended, including form ofagreement for officers (incorporated by reference to Exhibit 10.18 to the Registrant’s Annual Report onForm 10-K for the year ended December 31, 2003 (File No. 1-13086) filed March 24, 2004).
*10.11 Amendment to Stock Option Programs (incorporated by reference to Exhibit 4.19 to the Registrant’sRegistration Statement on Form S-8 (Reg. No. 333-36598) filed May 19, 2000).
*10.12 Indemnification Agreement, dated as of September 29, 2005, between Weatherford International Ltd.and Andrew P. Becnel (incorporated by reference to Exhibit 10.3 to the Registrant’s Current Report onForm 8-K (File No. 1-31339) filed October 5, 2005).
*10.13 Indemnification Agreements with Robert K. Moses, Jr. (incorporated by reference to Exhibit 10.10 toWeatherford Enterra, Inc.’s Annual Report on Form 10-K for the year ended December 31, 1987 (FileNo. 1-7867)); and William E. Macaulay (incorporated by reference to Exhibit 10.2 to WeatherfordEnterra, Inc.’s Quarterly Report on Form 10-Q for the quarter ended September 30, 1995(File No. 1-7867)).
*10.14 Indemnification Agreements with each of Bernard J. Duroc-Danner, Burt M. Martin, Stuart E.Ferguson, David J. Butters, Robert A. Rayne, Robert K. Moses, Jr., Robert B. Millard, and WilliamE. Macaulay (incorporated by reference to Exhibit 10.1 to the Registrant’s Quarterly Report on Form10-Q for the quarter ended September 30, 2002 (File No. 1-13086) filed November 13, 2002).
*10.15 Form of Stock Option Agreement for Non-Employee Directors dated September 8, 1998 (incorporatedby reference to Exhibit 10.23 to the Registrant’s Annual Report on Form 10-K for the year endedDecember 31, 1998 (File No. 1-13086) filed March 31, 1999).
*10.16 Form of Amendment to Stock Option Agreements dated September 8, 1998 for Non-EmployeeDirectors (incorporated by reference to Exhibit 4.17 to the Registration Statement on Form S-8(Reg. No. 333-36598) filed May 9, 2000).
*10.17 Form of Stock Option Agreement for Non-employee Directors dated July 5, 2000 (incorporated byreference to Exhibit 4.16 to the Registration Statement on Form S-8 (Reg. No. 333-48322) filed October20, 2000).
*10.18 Form of Stock Option Agreement for Non-employee Directors dated September 26, 2001 (incorporatedby reference to Exhibit 4.19 to the Registration Statement on Form S-8 (Reg. No. 333-81678) filedJanuary 30, 2002).
*10.19 Assumption and General Amendment of Directors’ Stock Option and Benefit Programs and GeneralAmendment of Employee Stock Option and Benefit Programs of Weatherford International, Inc. datedJune 26, 2002 (incorporated by reference to Exhibit 10.1 to the Registrant’s Quarterly Report on Form10-Q for the quarter ended June 30, 2002 (File No. 1-13086) filed August 14, 2002).
*10.20 Indemnification Agreement dated October 27, 2006, between Weatherford International Ltd. andJessica Abarca (incorporated by reference to Exhibit 10.3 to the Registrant’s Current Report onForm 8-K (File No. 1-31339) filed October 27, 2006).
*10.21 Form of Restricted Share Unit Award Agreement for Officers pursuant to Weatherford InternationalLtd. 2006 Omnibus Incentive Plan (incorporated by reference to Exhibit 10.45 to the Registrant’sAnnual Report on Form 10-K for the year ended December 31,2006 (File No. 1-31339) filed February23, 2007).
*10.22 Form of Stock Option Award Agreement for Officers pursuant to Weatherford International Ltd. 2006Omnibus Incentive Plan (incorporated by reference to Exhibit 10.46 to the Registrant’s Annual Reporton Form 10-K for the year ended December 31, 2006 (File No. 1-31339) filed February 23, 2007).
*10.23 Form of Restricted Share Award Agreement for Non-employee Directors pursuant to WeatherfordInternational Ltd. 2006 Omnibus Incentive Plan (incorporated by reference to Exhibit 10.47 to theRegistrant’s Annual Report on Form 10-K for the year ended December 31, 2006 (File No. 1-31339filed February 23, 2007).
*10.24 Form of Restricted Share Award Agreement for Officers pursuant to Weatherford International Ltd.2006 Omnibus Incentive Plan (incorporated by reference to Exhibit 10.48 to the Registrant’s AnnualReport on Form 10-K for the year ended December 31, 2006 (File No. 1-31339) filed February 23,2007).
AR-95

ExhibitNumber Description
*10.25 Form of Stock Option Award Agreement for Non-Employee Directors pursuant to WeatherfordInternational Ltd. 2006 Omnibus Plan (incorporated by reference to Exhibit 10.49 to theRegistrant’s Annual Report on Form 10-K for the year ended December 31, 2006(File No. 1-31339) filed February 23, 2007).
*10.26 Indemnification Agreement, dated as of June 11, 2007, between Weatherford International Ltd. andKeith R. Morley (incorporated by reference to Exhibit 10.2 to the Registrant’s Current Report onForm 8-K (File No. 1-31339) filed June 11, 2007).
*10.27 Amended and Restated Employment Agreements dated December 31, 2008, between WeatherfordInternational Ltd. and each of Jessica Abarca, Andrew P. Becnel, M. David Colley,Bernard J. Duroc-Danner, Stuart E. Ferguson, Burt M. Martin and Keith R. Morley (incorporatedby reference to Exhibit 10.1 to the Registrant’s Current Report on Form 8-K (File No. 1-31339) filedDecember 31, 2008).
*10.28 Employment Agreements effective as of January 1, 2009, between Weatherford International, Inc. andeach of Jessica Abarca, Andrew P. Becnel, M. David Colley, Bernard J. Duroc-Danner, Stuart E.Ferguson, Burt M. Martin and Keith R. Morley (incorporated by reference to Exhibit 10.2 to theRegistrant’s Current Report on Form 8-K (File No. 1-31339) filed December 31, 2008).
*10.29 Weatherford International, Inc. Executive Deferred Compensation Stock Ownership Plan, as amendedand restated as of December 31, 2008 (incorporated by reference to Exhibit 10.3 to the Registrant’sCurrent Report on Form 8-K (File No. 1-31339) filed December 31, 2008).
*10.30 Weatherford International, Inc. Foreign Executive Deferred Compensation Stock Plan, as amended andrestated as of December 31, 2008 (incorporated by reference to Exhibit 10.4 to the Registrant’s CurrentReport on Form 8-K (File No. 1-31339) filed December 31, 2008).
*10.31 Weatherford International Ltd. Non-Employee Director Deferred Compensation, as amended andrestated as of December 31, 2008 (incorporated by reference to Exhibit 10.5 to the Registrant’s CurrentReport on Form 8-K (File No. 1-31339) filed December 31, 2008).
*10.32 Weatherford International Ltd. Non-Employee Director Retirement Plan, as amended and restated as ofDecember 31, 2008 (incorporated by reference to Exhibit 10.6 to the Registrant’s Current Report onForm 8-K (File No. 1-31339) filed December 31, 2008).
*10.33 Weatherford Management Incentive Plan, including Form of Award Letter, as amended and restated asof December 31, 2008 (incorporated by reference to Exhibit 10.7 to the Registrant’s Current Report onForm 8-K (File No. 1-31339) filed December 31, 2008).
*10.34 Amended and Restated Weatherford International Ltd. Nonqualified Executive Retirement Plan(incorporated by reference to Exhibit 10.8 to the Registrant’s Current Report on Form 8-K (FileNo. 1-31339) filed December 31, 2008).
*10.35 Weatherford International, Inc. Supplemental Retirement Plan (incorporated by reference to Exhibit10.9 to the Registrant’s Current Report on Form 8-K (File No. 1-31339) filed December 31, 2008).
*10.36 Weatherford International Ltd. 2006 Omnibus Incentive Plan, as amended (incorporated by reference toExhibit 10.10 to the Registrant’s Current Report on Form 8-K (File No. 1-31339) filed December 31, 2008).
*10.37 Amendment to Weatherford International, Inc. 1998 Employee Stock Option Plan (incorporated byreference to Exhibit 10.11 to the Registrant’s Current Report on Form 8-K (File No. 1-31339) filedDecember 31, 2008).
*10.38 Amendment to Weatherford International Ltd. Non-Employee Director Stock Option Agreements(incorporated by reference to Exhibit 10.12 to the Registrant’s Current Report on Form 8-K(File No. 1-31339) filed December 31, 2008).
*10.39 Amended and Restated Employment Agreement, dated December 31, 2008, between WeatherfordInternational Ltd. and Carel W. Hoyer (incorporated by reference to Exhibit 10.39 to the Registrant’sAnnual Report on Form 10-K for the year ended December 31, 2008 (File No. 1-31339) filed February24, 2009).
*10.40 Employment Agreement, dated February 2, 2009, between Weatherford International, Inc. and CarelW. Hoyer (incorporated by reference to Exhibit 10.40 to the Registrant’s Annual Report on Form 10-Kfor the year ended December 31, 2008 (File No. 1-31339) filed February 24, 2009).
AR-96

ExhibitNumber Description
*10.41 Indemnification Agreement, dated as of February 9, 2009, between Weatherford International Ltd. andCarel W. Hoyer (incorporated by reference to Exhibit 10.41 to the Registrant’s Annual Report on Form10-K for the year ended December 31, 2008 (File No. 1-31339) filed February 24, 2009).
*10.42 Indemnification Agreement, dated as of February 9, 2009, between Weatherford International, Inc. andCarel W. Hoyer (incorporated by reference to Exhibit 10.42 to the Registrant’s Annual Report on Form10-K for the year ended December 31, 2008 (File No. 1-31339) filed February 24, 2009).
*10.43 Amended and Restated Employment Agreement, dated December 31, 2008, between WeatherfordInternational Ltd. and James M. Hudgins (incorporated by reference to Exhibit 10.43 to the Registrant’sAnnual Report on Form 10-K for the year ended December 31, 2008 (File No. 1-31339) filed February24, 2009).
*10.44 Employment Agreement, dated February 9, 2009, between Weatherford International, Inc. and JamesM. Hudgins (incorporated by reference to Exhibit 10.44 to the Registrant’s Annual Report onForm 10-K for the year ended December 31, 2008 (File No. 1-31339) filed February 24, 2009).
*10.45 Indemnification Agreement, dated as of September 4, 2002, between Weatherford International Ltd.and James M. Hudgins (incorporated by reference to Exhibit 10.45 to the Registrant’s Annual Report onForm 10-K for the year ended December 31, 2008 (File No. 1-31339) filed February 24, 2009).
*10.46 Indemnification Agreement, dated as of September 4, 2002, between Weatherford International, Inc.and James M. Hudgins (incorporated by reference to Exhibit 10.46 to the Registrant’s Annual Report onForm 10-K for the year ended December 31, 2008 (File No. 1-31339) filed February 24, 2009).
10.47 Warrant Assignment and Assumption Agreement, dated February 26, 2009, between WeatherfordInternational Ltd., a Bermuda exempted company, and Weatherford International Ltd., a Swiss jointstock corporation (incorporated by reference to Exhibit 10.1 to the Registrant’s Current Report on Form8-K (File No. 1-34258) filed February 26, 2009).
10.48 Guaranty Agreement, dated as of February 26, 2009, by Weatherford International Ltd., a Swiss jointstock corporation, in favor of the lenders and certain other parties under the Second Amended andRestated Credit Agreement dated as of May 2, 2006, among Weatherford International Ltd., a Bermudaexempted company, Weatherford International, Inc., Weatherford Liquidity Management HungaryLimited Liability Company, JPMorgan Chase Bank as Administrative Agent, and the other Lendersparty thereto (incorporated by reference to Exhibit 10.2 to the Registrant’s Current Report on Form 8-K(File No. 1-34258) filed February 26, 2009).
10.49 Guaranty Agreement, dated as of February 26, 2009, by Weatherford International Ltd., a Swiss jointstock corporation, in favor of the lenders and certain other parties under the Credit Agreement dated asof March 19, 2008, among Weatherford International Ltd., a Bermuda exempted company, WeatherfordInternational, Inc., Deutsche Bank AG Cayman Islands Branch as Administrative Agent, and the otherLenders party thereto (incorporated by reference to Exhibit 10.3 to the Registrant’s Current Report onForm 8-K (File No. 1-34258) filed February 26, 2009).
10.50 Guaranty Agreement, dated as of February 26, 2009, by Weatherford International Ltd., a Swiss jointstock corporation, in favor of the lenders and certain other parties under the Credit Agreement dated asof October 20, 2008, among Weatherford International Ltd., a Bermuda exempted company,Weatherford International, Inc., UBS AG, Stamford Branch as Administrative Agent, and the otherLenders party thereto (incorporated by reference to Exhibit 10.4 to the Registrant’s Current Report onForm 8-K (File No. 1-34258) filed February 26, 2009).
10.51 Assumption and General Amendment Agreement, dated February 25, 2009, between WeatherfordInternational Ltd., a Bermuda exempted company, and Weatherford International Ltd., a Swiss jointstock corporation (incorporated by reference to Exhibit 10.5 to the Registrant’s Current Report on Form8-K (File No. 1-34258) filed February 26, 2009).
10.52 Form of Indemnification Agreement of Weatherford International Ltd., a Swiss joint stock corporation,for use with directors and executive officers (incorporated by reference to Exhibit 10.6 to theRegistrant’s Current Report on Form 8-K (File No. 1-34258) filed February 26, 2009).
*10.53 Employment Agreement, dated as of June 8, 2009, between Weatherford International Ltd. and JosephC. Henry (incorporated by reference to Exhibit 10.1 to the Registrant’s Current Report on Form 8-K(File No. 1-34258) filed June 9, 2009).
AR-97

ExhibitNumber Description
*10.54 Employment Agreement, dated as of June 8, 2009, between Weatherford International, Inc. and JosephC. Henry (incorporated by reference to Exhibit 10.2 to the Registrant’s Current Report on Form 8-K(File No. 1-34258) filed June 9, 2009).
*10.55 Indemnification Agreement, dated as of February 26, 2009, between Weatherford International Ltd. andJoseph C. Henry (incorporated by reference to Exhibit 10.3 to the Registrant’s Current Report on Form8-K (File No. 1-34258) filed June 9, 2009).
*10.56 Employment Agreement, dated as of March 30, 2009, between Weatherford International Ltd. andWilliam B. Jacobson (incorporated by reference to Exhibit 10.4 to the Registrant’s Current Report onForm 8-K (File No. 1-34258) filed June 9, 2009).
*10.57 Employment Agreement, dated as of March 30, 2009, between Weatherford International, Inc. andWilliam B. Jacobson (incorporated by reference to Exhibit 10.5 to the Registrant’s Current Report onForm 8-K (File No. 1-34258) filed June 9, 2009).
*10.58 Indemnification Agreement, dated as of March 30, 2009 between Weatherford International Ltd. andWilliam B. Jacobson (incorporated by reference to Exhibit 10.6 to the Registrant’s Current Report onForm 8-K (File No. 1-34258) filed June 9, 2009).
*10.59 Employment Agreement, dated as of July 21, 2009, between Weatherford International Ltd. and PeterT. Fontana (incorporated by reference to Exhibit 10.1 to the Registrant’s Current Report on Form 8-K(File No. 1-34258) filed July 22, 2009).
*10.60 Employment Agreement, dated as of July 21, 2009, between Weatherford International, Inc. and PeterT. Fontana (incorporated by reference to Exhibit 10.2 to the Registrant’s Current Report on Form 8-K(File No. 1-34258) filed July 22, 2009).
*10.61 Indemnification Agreement, dated as of July 21, 2009, between Weatherford International Ltd. andPeter T. Fontana (incorporated by reference to Exhibit 10.3 to the Registrant’s Current Report on Form8-K (File No. 1-34258) filed July 22, 2009).
*10.62 Form of Employment Agreement, between Weatherford International Ltd. and each of Jessica Abarca,Andrew P. Becnel, M. David Colley, Bernard J. Duroc-Danner, Stuart E. Ferguson, William B. Jacobsonand Keith R. Morley (incorporated by reference to Exhibit 10.1 to the Registrant’s Current Report onForm 8-K (File No. 1-34258) filed December 31, 2009).
*10.63 Supplemental Executive Retirement Plan effective as of January 1, 2010, between WeatherfordInternational Ltd. and each of Jessica Abarca, Andrew P. Becnel, M. David Colley, Bernard J.Duroc-Danner, Stuart E. Ferguson and Keith R. Morley (incorporated by reference to Exhibit 10.2to the Registrant’s Current Report on Form 8-K (File No. 1-34258) filed December 31, 2009).
†21.1 Subsidiaries of Weatherford International, Ltd.†23.1 Consent of Ernst & Young LLP.
†31.1 Certification of Chief Executive Officer pursuant to Section 302 of the Sarbanes-Oxley Act of 2002.
†31.2 Certification of Chief Financial Officer pursuant to Section 302 of the Sarbanes-Oxley Act of 2002.
**†32.1 Certification of Chief Executive Officer pursuant to Section 906 of the Sarbanes-Oxley Act of 2002.
**†32.2 Certification of Chief Financial Officer pursuant to Section 906 of the Sarbanes-Oxley Act of 2002.
**101 The following materials from Weatherford International Ltd.’s Annual Report on Form 10-K for theyear ended December 31, 2009, formatted in XBRL (Extensible Business reporting Language): (i) theConsolidated Balance Sheets, (ii) the Consolidated Statements of Income, (iii) the ConsolidatedStatement of Cash Flows, (iv) the Consolidated Statement of Comprehensive Income and (v) the notesto the consolidated financial statements, tagged as blocks of text.
* Management contract or compensatory plan or arrangement.
** Furnished with this Form 10-K
† Filed herewith.
AR-98
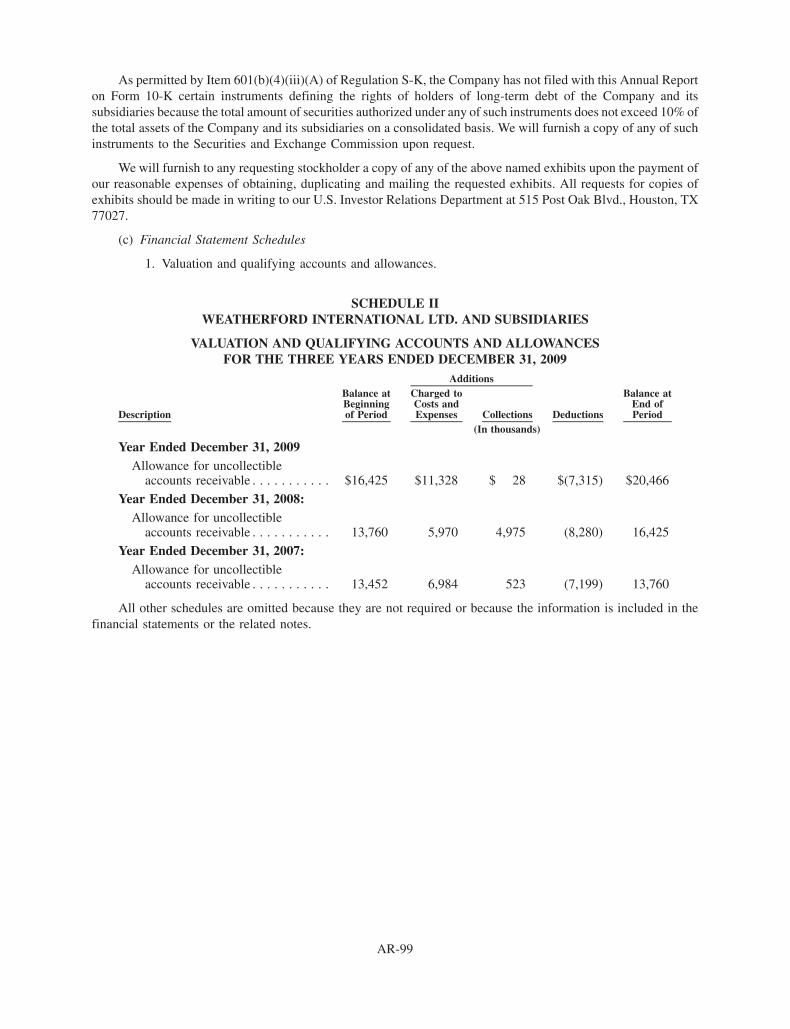
As permitted by Item 601(b)(4)(iii)(A) of Regulation S-K, the Company has not filed with this Annual Reporton Form 10-K certain instruments defining the rights of holders of long-term debt of the Company and itssubsidiaries because the total amount of securities authorized under any of such instruments does not exceed 10% ofthe total assets of the Company and its subsidiaries on a consolidated basis. We will furnish a copy of any of suchinstruments to the Securities and Exchange Commission upon request.
We will furnish to any requesting stockholder a copy of any of the above named exhibits upon the payment ofour reasonable expenses of obtaining, duplicating and mailing the requested exhibits. All requests for copies ofexhibits should be made in writing to our U.S. Investor Relations Department at 515 Post Oak Blvd., Houston, TX77027.
(c) Financial Statement Schedules
1. Valuation and qualifying accounts and allowances.
SCHEDULE IIWEATHERFORD INTERNATIONAL LTD. AND SUBSIDIARIES
VALUATION AND QUALIFYING ACCOUNTS AND ALLOWANCESFOR THE THREE YEARS ENDED DECEMBER 31, 2009
Description
Balance atBeginningof Period
Charged toCosts andExpenses Collections Deductions
Balance atEnd ofPeriod
Additions
(In thousands)
Year Ended December 31, 2009Allowance for uncollectible
accounts receivable . . . . . . . . . . . $16,425 $11,328 $ 28 $(7,315) $20,466
Year Ended December 31, 2008:Allowance for uncollectible
accounts receivable . . . . . . . . . . . 13,760 5,970 4,975 (8,280) 16,425
Year Ended December 31, 2007:Allowance for uncollectible
accounts receivable . . . . . . . . . . . 13,452 6,984 523 (7,199) 13,760
All other schedules are omitted because they are not required or because the information is included in thefinancial statements or the related notes.
AR-99

SIGNATURES
Pursuant to the requirements of Section 13 or 15(d) of the Securities Exchange Act of 1934, the Registrant hasduly caused this Report to be signed on its behalf by the undersigned, thereunto duly authorized, in the City ofHouston, State of Texas, on March 1, 2010.
WEATHERFORD INTERNATIONAL LTD.
By /s/ Bernard J. Duroc-Danner
Bernard J. Duroc-DannerPresident, Chief Executive Officer,
Chairman of the Board and Director(Principal Executive Officer)
Pursuant to the requirements of the Securities Exchange Act of 1934, this Report has been signed by thefollowing persons on behalf of the Registrant and in the capacities and on the dates indicated.
Signatures Title Date
/s/ Bernard J. Duroc-Danner
Bernard J. Duroc-Danner
President, Chief Executive Officer, Chairmanof the Board and Director
(Principal Executive Officer)
March 1, 2010
/s/ Andrew P. Becnel
Andrew P. Becnel
Senior Vice President and Chief FinancialOfficer
(Principal Financial Officer)
March 1, 2010
/s/ Jessica Abarca
Jessica Abarca
Vice President — Accounting and ChiefAccounting Officer
(Principal Accounting Officer)
March 1, 2010
/s/ Nicholas F. Brady
Nicholas F. Brady
Director March 1, 2010
/s/ David J. Butters
David J. Butters
Director March 1, 2010
/s/ William E. MacaulayWilliam E. Macaulay
Director March 1, 2010
/s/ Robert B. Millard
Robert B. Millard
Director March 1, 2010
/s/ Robert K. Moses, Jr.
Robert K. Moses, Jr.
Director March 1, 2010
/s/ Robert A. Rayne
Robert A. Rayne
Director March 1, 2010
AR-100
Statutory Financial Statements
Weatherford International, Ltd.
For the period November 26, 2008 (inception) to December 31, 2009

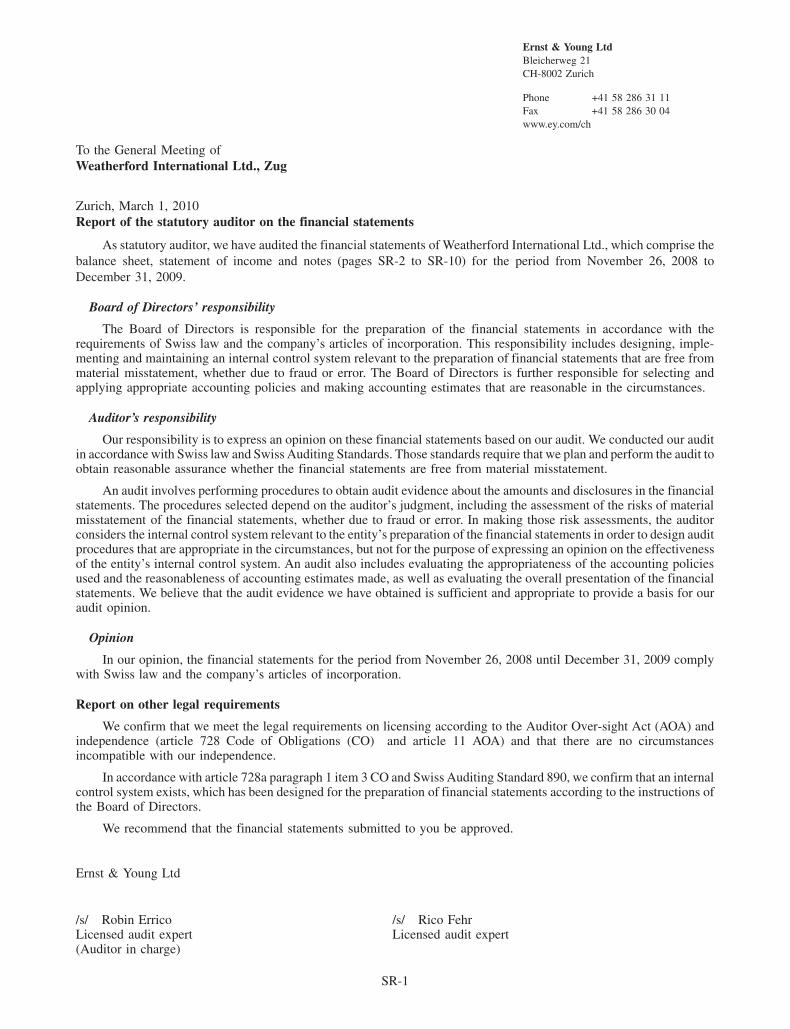
Ernst & Young LtdBleicherweg 21CH-8002 Zurich
Phone +41 58 286 31 11Fax +41 58 286 30 04www.ey.com/ch
To the General Meeting ofWeatherford International Ltd., Zug
Zurich, March 1, 2010Report of the statutory auditor on the financial statements
As statutory auditor, we have audited the financial statements of Weatherford International Ltd., which comprise thebalance sheet, statement of income and notes (pages SR-2 to SR-10) for the period from November 26, 2008 toDecember 31, 2009.
Board of Directors’ responsibility
The Board of Directors is responsible for the preparation of the financial statements in accordance with therequirements of Swiss law and the company’s articles of incorporation. This responsibility includes designing, imple-menting and maintaining an internal control system relevant to the preparation of financial statements that are free frommaterial misstatement, whether due to fraud or error. The Board of Directors is further responsible for selecting andapplying appropriate accounting policies and making accounting estimates that are reasonable in the circumstances.
Auditor’s responsibility
Our responsibility is to express an opinion on these financial statements based on our audit. We conducted our auditin accordance with Swiss law and Swiss Auditing Standards. Those standards require that we plan and perform the audit toobtain reasonable assurance whether the financial statements are free from material misstatement.
An audit involves performing procedures to obtain audit evidence about the amounts and disclosures in the financialstatements. The procedures selected depend on the auditor’s judgment, including the assessment of the risks of materialmisstatement of the financial statements, whether due to fraud or error. In making those risk assessments, the auditorconsiders the internal control system relevant to the entity’s preparation of the financial statements in order to design auditprocedures that are appropriate in the circumstances, but not for the purpose of expressing an opinion on the effectivenessof the entity’s internal control system. An audit also includes evaluating the appropriateness of the accounting policiesused and the reasonableness of accounting estimates made, as well as evaluating the overall presentation of the financialstatements. We believe that the audit evidence we have obtained is sufficient and appropriate to provide a basis for ouraudit opinion.
Opinion
In our opinion, the financial statements for the period from November 26, 2008 until December 31, 2009 complywith Swiss law and the company’s articles of incorporation.
Report on other legal requirements
We confirm that we meet the legal requirements on licensing according to the Auditor Over-sight Act (AOA) andindependence (article 728 Code of Obligations (CO) and article 11 AOA) and that there are no circumstancesincompatible with our independence.
In accordance with article 728a paragraph 1 item 3 CO and Swiss Auditing Standard 890, we confirm that an internalcontrol system exists, which has been designed for the preparation of financial statements according to the instructions ofthe Board of Directors.
We recommend that the financial statements submitted to you be approved.
Ernst & Young Ltd
/s/ Robin Errico /s/ Rico FehrLicensed audit expert Licensed audit expert(Auditor in charge)
SR-1

WEATHERFORD INTERNATIONAL LTD.
BALANCE SHEET
December 31,2009
(In CHF thousands)
Current Assets:
Cash and Cash Equivalents . . . . . . . . . . . . . . . . . . . . . . . . . . . . . . . . . . . . . . . . . . . . . . 106
Other Current Assets . . . . . . . . . . . . . . . . . . . . . . . . . . . . . . . . . . . . . . . . . . . . . . . . . . . 509
Total Current Assets . . . . . . . . . . . . . . . . . . . . . . . . . . . . . . . . . . . . . . . . . . . . . . . . . . 615
Leasehold Improvements and Other . . . . . . . . . . . . . . . . . . . . . . . . . . . . . . . . . . . . . . . . . . 1,938Intangible Assets . . . . . . . . . . . . . . . . . . . . . . . . . . . . . . . . . . . . . . . . . . . . . . . . . . . . . . . . 7,792
Investment in Affiliates . . . . . . . . . . . . . . . . . . . . . . . . . . . . . . . . . . . . . . . . . . . . . . . . . . . 8,532,414
Total Assets . . . . . . . . . . . . . . . . . . . . . . . . . . . . . . . . . . . . . . . . . . . . . . . . . . . . . . . . 8,542,759
LIABILITIES AND SHAREHOLDERS’ EQUITYCurrent Liabilities:
Accrued Expenses . . . . . . . . . . . . . . . . . . . . . . . . . . . . . . . . . . . . . . . . . . . . . . . . . . . . . 3,807
Total Current Liabilities . . . . . . . . . . . . . . . . . . . . . . . . . . . . . . . . . . . . . . . . . . . . . . . 3,807
Due to Affiliates . . . . . . . . . . . . . . . . . . . . . . . . . . . . . . . . . . . . . . . . . . . . . . . . . . . . . . . . 38,500
Other Liabilities . . . . . . . . . . . . . . . . . . . . . . . . . . . . . . . . . . . . . . . . . . . . . . . . . . . . . . . . 8,439
Total Long-Term Liabilities . . . . . . . . . . . . . . . . . . . . . . . . . . . . . . . . . . . . . . . . . . . . 46,939
Shareholders’ Equity:
Share Capital . . . . . . . . . . . . . . . . . . . . . . . . . . . . . . . . . . . . . . . . . . . . . . . . . . . . . . . . . 879,798
Legal Reserve . . . . . . . . . . . . . . . . . . . . . . . . . . . . . . . . . . . . . . . . . . . . . . . . . . . . . . . . 7,646,851
Reserve for Treasury Shares . . . . . . . . . . . . . . . . . . . . . . . . . . . . . . . . . . . . . . . . . . . . . . 100
Retained Earnings . . . . . . . . . . . . . . . . . . . . . . . . . . . . . . . . . . . . . . . . . . . . . . . . . . . . . (34,736)
Total Shareholders’ Equity . . . . . . . . . . . . . . . . . . . . . . . . . . . . . . . . . . . . . . . . . . . . . 8,492,013
Total Liabilities and Shareholders’ Equity . . . . . . . . . . . . . . . . . . . . . . . . . . . . . . . . . . 8,542,759
The accompanying notes are an integral part of these statutory financial statements.
SR-2
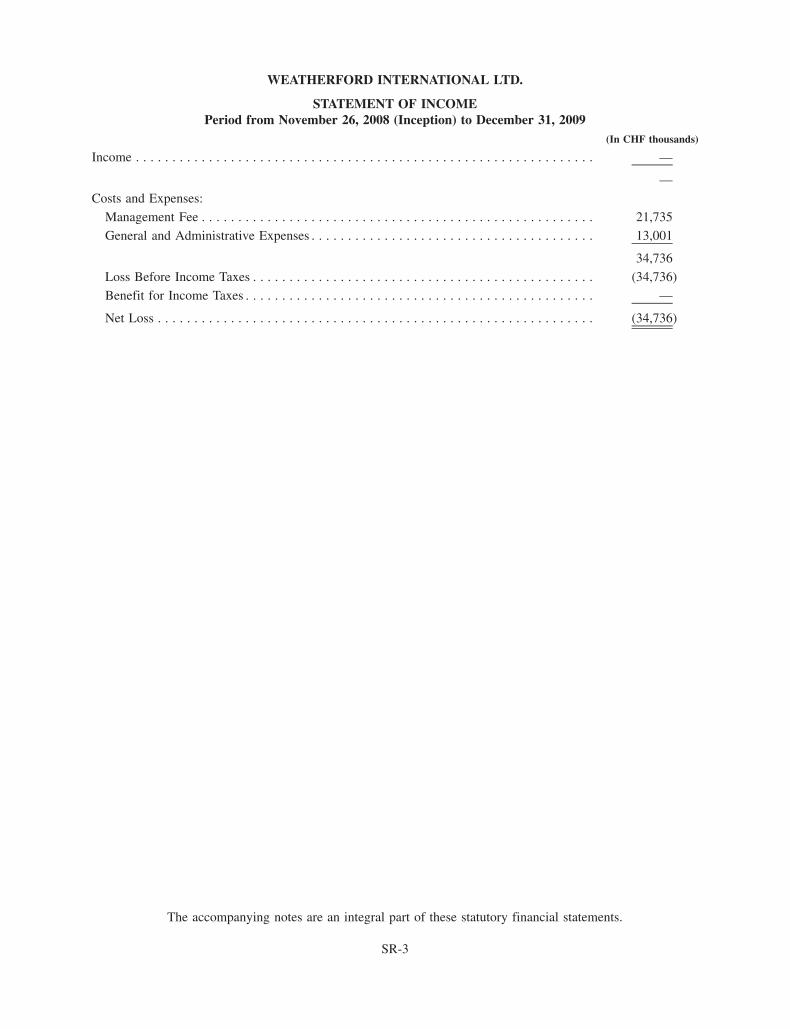
WEATHERFORD INTERNATIONAL LTD.
STATEMENT OF INCOMEPeriod from November 26, 2008 (Inception) to December 31, 2009
(In CHF thousands)
Income . . . . . . . . . . . . . . . . . . . . . . . . . . . . . . . . . . . . . . . . . . . . . . . . . . . . . . . . . . . . . . . —
—
Costs and Expenses:
Management Fee . . . . . . . . . . . . . . . . . . . . . . . . . . . . . . . . . . . . . . . . . . . . . . . . . . . . . . 21,735
General and Administrative Expenses . . . . . . . . . . . . . . . . . . . . . . . . . . . . . . . . . . . . . . . 13,001
34,736
Loss Before Income Taxes . . . . . . . . . . . . . . . . . . . . . . . . . . . . . . . . . . . . . . . . . . . . . . . (34,736)
Benefit for Income Taxes . . . . . . . . . . . . . . . . . . . . . . . . . . . . . . . . . . . . . . . . . . . . . . . . —
Net Loss . . . . . . . . . . . . . . . . . . . . . . . . . . . . . . . . . . . . . . . . . . . . . . . . . . . . . . . . . . . . (34,736)
The accompanying notes are an integral part of these statutory financial statements.
SR-3

WEATHERFORD INTERNATIONAL, LTD.
NOTES TO STATUTORY FINANCIAL STATEMENTS
1. General
On February 25, 2009, Weatherford International Ltd., a Swiss joint stock corporation (the “Company,” “our,”“we,” “Weatherford” and “Weatherford Switzerland”) and Weatherford International Ltd., a Bermuda exemptedcompany (“Weatherford Bermuda”), completed a share exchange transaction under the terms of a share exchangeagreement, dated as of December 10, 2008, effected by way of a scheme of arrangement under Bermuda law, forpurposes of changing the Company’s place of incorporation from Bermuda to Switzerland (collectively, the“Transaction”). Pursuant to the Transaction, each common share, par value U.S. $1.00 per share, of WeatherfordBermuda was exchanged for one registered share, par value 1.16 Swiss francs (“CHF”) per share, of WeatherfordSwitzerland.
Also, the Company will now be required to prepare, and have audited, Swiss statutory consolidated accounts incompliance with Swiss law for the first time in 2009.
While the standalone statutory financial statements are presented from the period of inception, the statutoryconsolidated financial statements cover the period from January 1 to December 31. This is deemed appropriatebecause it provides the best view about the development of the business in 2009 to the shareholders and it reflectsthe fact that the Company has been operating as a group long before the redomestication. From a group perspective,the Transaction only changes the legal headquarters of the Company.
2. Summary of Significant Accounting Policies
Basis of Preparation of the Financial Statements
The financial statements of the Company are prepared in accordance with the provisions of Swiss law.
Exchange Rate Differences
The Company keeps its accounting records in U.S. Dollars and translates them into Swiss Francs (CHF) forstatutory reporting purposes. Assets and liabilities denominated in foreign currencies are translated into CHF usingthe year-end rates of exchange, except investments in affiliates and the Company’s equity (other than current-yeartransactions), which are translated at historical rates. Income statement transactions are translated into CHF at theaverage rate of the year. Exchange differences arising from business transactions are recorded in the incomestatement, except for net unrealized gains, which are deferred and recorded in other current liabilities.
Financial Assets
Investments in affiliates are valued at acquisition cost less adjustments for impairment of value.
SR-4
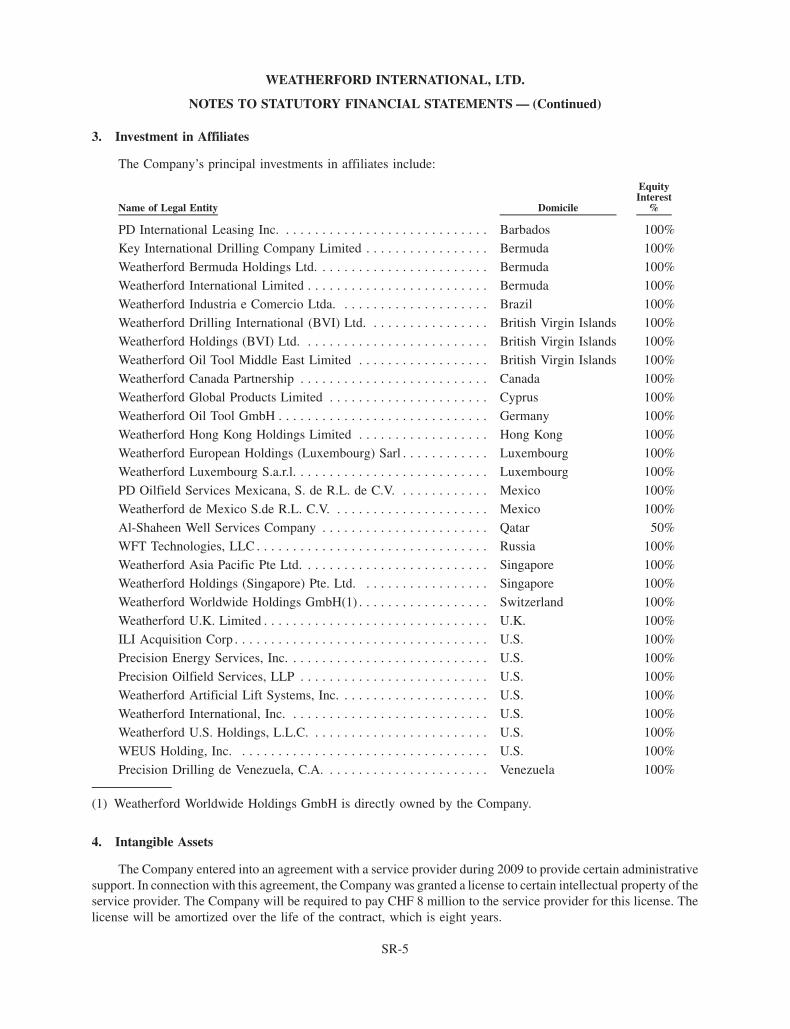
3. Investment in Affiliates
The Company’s principal investments in affiliates include:
Name of Legal Entity Domicile
EquityInterest
%
PD International Leasing Inc. . . . . . . . . . . . . . . . . . . . . . . . . . . . . Barbados 100%
Key International Drilling Company Limited . . . . . . . . . . . . . . . . . Bermuda 100%
Weatherford Bermuda Holdings Ltd. . . . . . . . . . . . . . . . . . . . . . . . Bermuda 100%
Weatherford International Limited . . . . . . . . . . . . . . . . . . . . . . . . . Bermuda 100%
Weatherford Industria e Comercio Ltda. . . . . . . . . . . . . . . . . . . . . Brazil 100%
Weatherford Drilling International (BVI) Ltd. . . . . . . . . . . . . . . . . British Virgin Islands 100%
Weatherford Holdings (BVI) Ltd. . . . . . . . . . . . . . . . . . . . . . . . . . British Virgin Islands 100%
Weatherford Oil Tool Middle East Limited . . . . . . . . . . . . . . . . . . British Virgin Islands 100%
Weatherford Canada Partnership . . . . . . . . . . . . . . . . . . . . . . . . . . Canada 100%
Weatherford Global Products Limited . . . . . . . . . . . . . . . . . . . . . . Cyprus 100%
Weatherford Oil Tool GmbH . . . . . . . . . . . . . . . . . . . . . . . . . . . . . Germany 100%
Weatherford Hong Kong Holdings Limited . . . . . . . . . . . . . . . . . . Hong Kong 100%
Weatherford European Holdings (Luxembourg) Sarl . . . . . . . . . . . . Luxembourg 100%
Weatherford Luxembourg S.a.r.l. . . . . . . . . . . . . . . . . . . . . . . . . . . Luxembourg 100%
PD Oilfield Services Mexicana, S. de R.L. de C.V. . . . . . . . . . . . . Mexico 100%
Weatherford de Mexico S.de R.L. C.V. . . . . . . . . . . . . . . . . . . . . . Mexico 100%
Al-Shaheen Well Services Company . . . . . . . . . . . . . . . . . . . . . . . Qatar 50%WFT Technologies, LLC . . . . . . . . . . . . . . . . . . . . . . . . . . . . . . . . Russia 100%
Weatherford Asia Pacific Pte Ltd. . . . . . . . . . . . . . . . . . . . . . . . . . Singapore 100%
Weatherford Holdings (Singapore) Pte. Ltd. . . . . . . . . . . . . . . . . . Singapore 100%
Weatherford Worldwide Holdings GmbH(1) . . . . . . . . . . . . . . . . . . Switzerland 100%
Weatherford U.K. Limited . . . . . . . . . . . . . . . . . . . . . . . . . . . . . . . U.K. 100%
ILI Acquisition Corp . . . . . . . . . . . . . . . . . . . . . . . . . . . . . . . . . . . U.S. 100%
Precision Energy Services, Inc. . . . . . . . . . . . . . . . . . . . . . . . . . . . U.S. 100%
Precision Oilfield Services, LLP . . . . . . . . . . . . . . . . . . . . . . . . . . U.S. 100%
Weatherford Artificial Lift Systems, Inc. . . . . . . . . . . . . . . . . . . . . U.S. 100%
Weatherford International, Inc. . . . . . . . . . . . . . . . . . . . . . . . . . . . U.S. 100%
Weatherford U.S. Holdings, L.L.C. . . . . . . . . . . . . . . . . . . . . . . . . U.S. 100%
WEUS Holding, Inc. . . . . . . . . . . . . . . . . . . . . . . . . . . . . . . . . . . U.S. 100%
Precision Drilling de Venezuela, C.A. . . . . . . . . . . . . . . . . . . . . . . Venezuela 100%
(1) Weatherford Worldwide Holdings GmbH is directly owned by the Company.
4. Intangible Assets
The Company entered into an agreement with a service provider during 2009 to provide certain administrativesupport. In connection with this agreement, the Company was granted a license to certain intellectual property of theservice provider. The Company will be required to pay CHF 8 million to the service provider for this license. Thelicense will be amortized over the life of the contract, which is eight years.
SR-5
WEATHERFORD INTERNATIONAL, LTD.
NOTES TO STATUTORY FINANCIAL STATEMENTS — (Continued)

5. Shareholders’ Equity
SharesShare
AmountLegal
Reserve
Reserve forTreasuryShares(2)
RetainedEarnings
TotalShareholder’s
Equity(In CHF thousands, except share data)
Balance at November 26, 2008(inception) . . . . . . . . . . . . . . . . . . . . . 10,000,000 100 — — — 100
Change in Par Value . . . . . . . . . . . . . . . . (9,913,794) — — — — —
Shares Issued to Weatherford InternationalLtd Bermuda shareholders inRedomestication . . . . . . . . . . . . . . . . . 697,802,003 845,388 7,070,809 100 — 7,916,297
Shares issued to Weatherford BermudaHoldings Ltd.(1) . . . . . . . . . . . . . . . . . 28,053,693 — — — — —
Shares issued to Weatherford InternationalInc.(1) . . . . . . . . . . . . . . . . . . . . . . . . 2,926,729 — — — — —
Shares Issued for businessacquisitions(3) . . . . . . . . . . . . . . . . . . 29,578,006 34,310 576,042 — — 610,352
Net Loss . . . . . . . . . . . . . . . . . . . . . . . . — — — — (34,736) (34,736)
Balance at December 31, 2009 . . . . . . . . 758,446,637 879,798 7,646,851 100 (34,736) 8,492,013
(1) Shares issued to Weatherford International Inc. (“WII”) and Weatherford Bermuda Holdings Limited(“WBHL”) to satisfy obligations of the Company to deliver shares under share-based compensation incentiveplans, warrants or other rights to acquire shares of the Company. These shares are held by WII and WBHLsolely for transfer to the Company and do not carry any value in treasury share reserve as they were issued by theCompany in the Redomestication Transaction for no value.
(2) The reserve for treasury shares represents the cost of treasury shares held by WBHL on behalf of the Companywhich were originally issued for CHF 100,000 at formation of the Company and were transferred to theCompany as part of the Redomestication Transaction.
(3) See Note 6 and Note 13 regarding shares issued for acquisitions.
The Company has 334,856,309 shares authorized and 364,434,315 conditional shares. The Company’s articlesof association provide for authorized and conditional capital that allows the Board of Directors to authorize theissuance of additional registered shares up to a maximum amount of 50% of the share capital registered in thecommercial register without obtaining additional shareholder approval.
6. Treasury Shares
For the period from November 26, 2008 (Inception Date) to December 31, 2009, the number of treasury sharesheld by our subsidiaries and their movements are as follows (in thousands):
Balance as of November 26, 2008 . . . . . . . . . . . . . . . . . . . . . . . . . . . . . . . . . . . . . . . . . . . —
Redomestication shares . . . . . . . . . . . . . . . . . . . . . . . . . . . . . . . . . . . . . . . . . . . . . . . . . . . 31,066
Shares issued in acquisition . . . . . . . . . . . . . . . . . . . . . . . . . . . . . . . . . . . . . . . . . . . . . . . . (5,398)
Equity awards granted, vested, and exercised . . . . . . . . . . . . . . . . . . . . . . . . . . . . . . . . . . . (5,134)
Balance as of December 31, 2009. . . . . . . . . . . . . . . . . . . . . . . . . . . . . . . . . . . . . . . . . . . . 20,534
The treasury shares issued for acquisitions were valued at CHF 113 million on the acquisition date. In addition,the proceeds of the treasury share transfers in connection with exercises of options amounted to CHF 6 million. Thetransfer of treasury shares under our restricted share plans was at book value.
SR-6
WEATHERFORD INTERNATIONAL, LTD.
NOTES TO STATUTORY FINANCIAL STATEMENTS — (Continued)
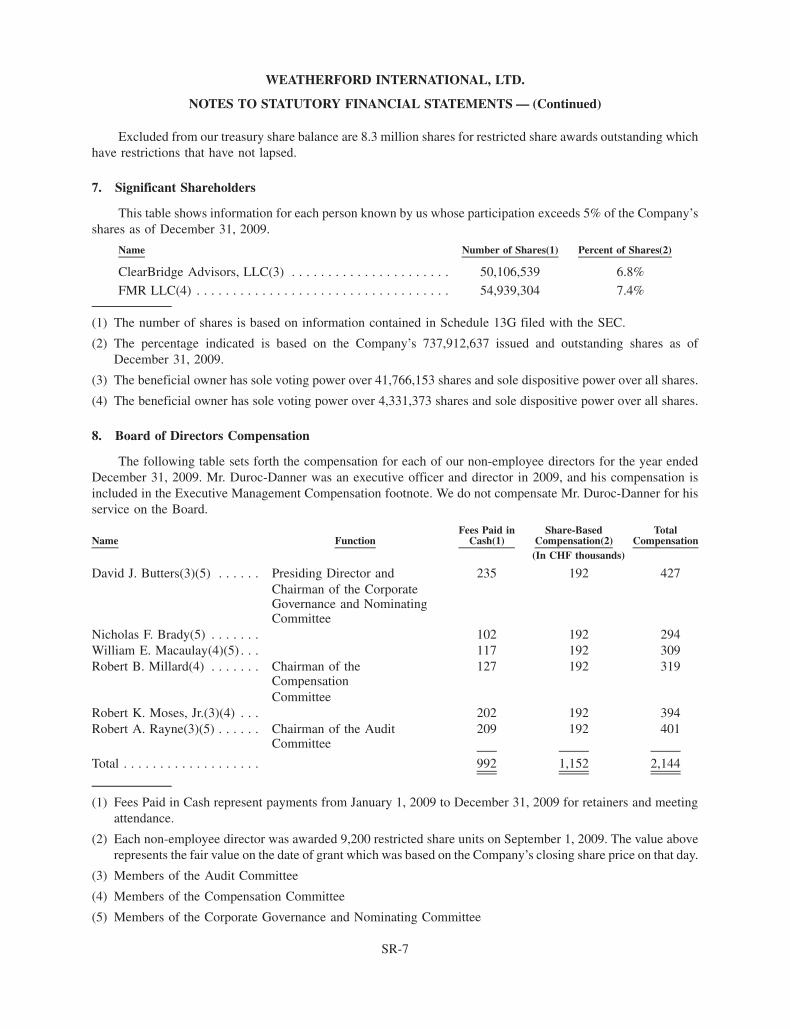
Excluded from our treasury share balance are 8.3 million shares for restricted share awards outstanding whichhave restrictions that have not lapsed.
7. Significant Shareholders
This table shows information for each person known by us whose participation exceeds 5% of the Company’sshares as of December 31, 2009.
Name Number of Shares(1) Percent of Shares(2)
ClearBridge Advisors, LLC(3) . . . . . . . . . . . . . . . . . . . . . . 50,106,539 6.8%
FMR LLC(4) . . . . . . . . . . . . . . . . . . . . . . . . . . . . . . . . . . . 54,939,304 7.4%
(1) The number of shares is based on information contained in Schedule 13G filed with the SEC.
(2) The percentage indicated is based on the Company’s 737,912,637 issued and outstanding shares as ofDecember 31, 2009.
(3) The beneficial owner has sole voting power over 41,766,153 shares and sole dispositive power over all shares.
(4) The beneficial owner has sole voting power over 4,331,373 shares and sole dispositive power over all shares.
8. Board of Directors Compensation
The following table sets forth the compensation for each of our non-employee directors for the year endedDecember 31, 2009. Mr. Duroc-Danner was an executive officer and director in 2009, and his compensation isincluded in the Executive Management Compensation footnote. We do not compensate Mr. Duroc-Danner for hisservice on the Board.
Name FunctionFees Paid in
Cash(1)Share-Based
Compensation(2)Total
Compensation(In CHF thousands)
David J. Butters(3)(5) . . . . . . Presiding Director and 235 192 427Chairman of the CorporateGovernance and NominatingCommittee
Nicholas F. Brady(5) . . . . . . . 102 192 294William E. Macaulay(4)(5) . . . 117 192 309Robert B. Millard(4) . . . . . . . Chairman of the
Compensation127 192 319
CommitteeRobert K. Moses, Jr.(3)(4) . . . 202 192 394Robert A. Rayne(3)(5) . . . . . . Chairman of the Audit
Committee209 192 401
Total . . . . . . . . . . . . . . . . . . . 992 1,152 2,144
(1) Fees Paid in Cash represent payments from January 1, 2009 to December 31, 2009 for retainers and meetingattendance.
(2) Each non-employee director was awarded 9,200 restricted share units on September 1, 2009. The value aboverepresents the fair value on the date of grant which was based on the Company’s closing share price on that day.
(3) Members of the Audit Committee
(4) Members of the Compensation Committee
(5) Members of the Corporate Governance and Nominating Committee
SR-7
WEATHERFORD INTERNATIONAL, LTD.
NOTES TO STATUTORY FINANCIAL STATEMENTS — (Continued)
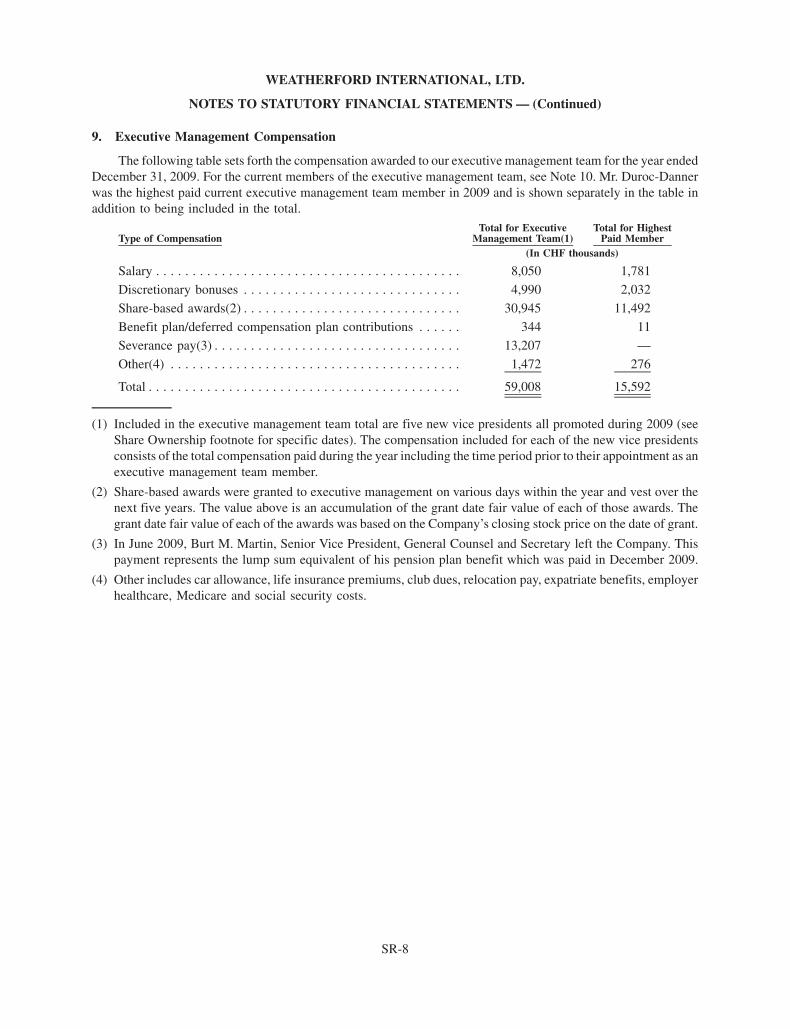
9. Executive Management Compensation
The following table sets forth the compensation awarded to our executive management team for the year endedDecember 31, 2009. For the current members of the executive management team, see Note 10. Mr. Duroc-Dannerwas the highest paid current executive management team member in 2009 and is shown separately in the table inaddition to being included in the total.
Type of CompensationTotal for Executive
Management Team(1)Total for Highest
Paid Member(In CHF thousands)
Salary . . . . . . . . . . . . . . . . . . . . . . . . . . . . . . . . . . . . . . . . . . 8,050 1,781
Discretionary bonuses . . . . . . . . . . . . . . . . . . . . . . . . . . . . . . 4,990 2,032
Share-based awards(2) . . . . . . . . . . . . . . . . . . . . . . . . . . . . . . 30,945 11,492
Benefit plan/deferred compensation plan contributions . . . . . . 344 11
Severance pay(3) . . . . . . . . . . . . . . . . . . . . . . . . . . . . . . . . . . 13,207 —
Other(4) . . . . . . . . . . . . . . . . . . . . . . . . . . . . . . . . . . . . . . . . 1,472 276
Total . . . . . . . . . . . . . . . . . . . . . . . . . . . . . . . . . . . . . . . . . . . 59,008 15,592
(1) Included in the executive management team total are five new vice presidents all promoted during 2009 (seeShare Ownership footnote for specific dates). The compensation included for each of the new vice presidentsconsists of the total compensation paid during the year including the time period prior to their appointment as anexecutive management team member.
(2) Share-based awards were granted to executive management on various days within the year and vest over thenext five years. The value above is an accumulation of the grant date fair value of each of those awards. Thegrant date fair value of each of the awards was based on the Company’s closing stock price on the date of grant.
(3) In June 2009, Burt M. Martin, Senior Vice President, General Counsel and Secretary left the Company. Thispayment represents the lump sum equivalent of his pension plan benefit which was paid in December 2009.
(4) Other includes car allowance, life insurance premiums, club dues, relocation pay, expatriate benefits, employerhealthcare, Medicare and social security costs.
SR-8
WEATHERFORD INTERNATIONAL, LTD.
NOTES TO STATUTORY FINANCIAL STATEMENTS — (Continued)
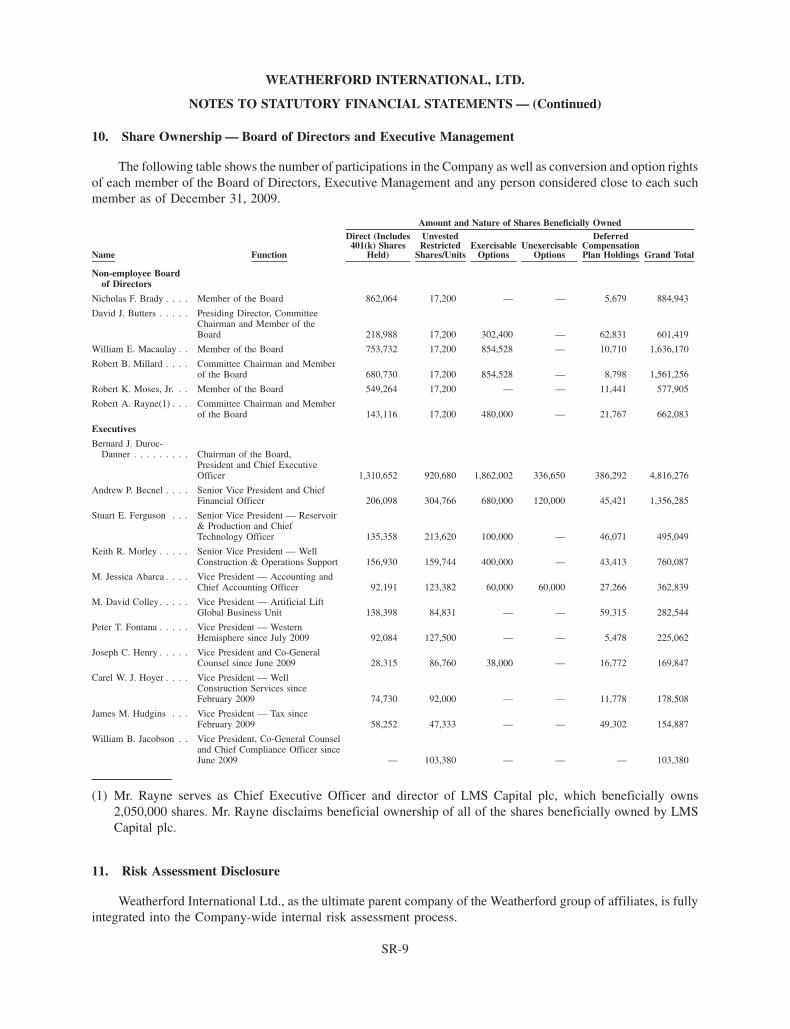
10. Share Ownership — Board of Directors and Executive Management
The following table shows the number of participations in the Company as well as conversion and option rightsof each member of the Board of Directors, Executive Management and any person considered close to each suchmember as of December 31, 2009.
Name Function
Direct (Includes401(k) Shares
Held)
UnvestedRestricted
Shares/UnitsExercisable
OptionsUnexercisable
Options
DeferredCompensationPlan Holdings Grand Total
Amount and Nature of Shares Beneficially Owned
Non-employee Boardof Directors
Nicholas F. Brady . . . . Member of the Board 862,064 17,200 — — 5,679 884,943
David J. Butters . . . . . Presiding Director, CommitteeChairman and Member of theBoard 218,988 17,200 302,400 — 62,831 601,419
William E. Macaulay . . Member of the Board 753,732 17,200 854,528 — 10,710 1,636,170
Robert B. Millard . . . . Committee Chairman and Memberof the Board 680,730 17,200 854,528 — 8,798 1,561,256
Robert K. Moses, Jr. . . Member of the Board 549,264 17,200 — — 11,441 577,905
Robert A. Rayne(1) . . . Committee Chairman and Memberof the Board 143,116 17,200 480,000 — 21,767 662,083
Executives
Bernard J. Duroc-Danner . . . . . . . . . Chairman of the Board,
President and Chief ExecutiveOfficer 1,310,652 920,680 1,862,002 336,650 386,292 4,816,276
Andrew P. Becnel . . . . Senior Vice President and ChiefFinancial Officer 206,098 304,766 680,000 120,000 45,421 1,356,285
Stuart E. Ferguson . . . Senior Vice President — Reservoir& Production and ChiefTechnology Officer 135,358 213,620 100,000 — 46,071 495,049
Keith R. Morley . . . . . Senior Vice President — WellConstruction & Operations Support 156,930 159,744 400,000 — 43,413 760,087
M. Jessica Abarca . . . . Vice President — Accounting andChief Accounting Officer 92,191 123,382 60,000 60,000 27,266 362,839
M. David Colley. . . . . Vice President — Artificial LiftGlobal Business Unit 138,398 84,831 — — 59,315 282,544
Peter T. Fontana . . . . . Vice President — WesternHemisphere since July 2009 92,084 127,500 — — 5,478 225,062
Joseph C. Henry . . . . . Vice President and Co-GeneralCounsel since June 2009 28,315 86,760 38,000 — 16,772 169,847
Carel W. J. Hoyer . . . . Vice President — WellConstruction Services sinceFebruary 2009 74,730 92,000 — — 11,778 178,508
James M. Hudgins . . . Vice President — Tax sinceFebruary 2009 58,252 47,333 — — 49,302 154,887
William B. Jacobson . . Vice President, Co-General Counseland Chief Compliance Officer sinceJune 2009 — 103,380 — — — 103,380
(1) Mr. Rayne serves as Chief Executive Officer and director of LMS Capital plc, which beneficially owns2,050,000 shares. Mr. Rayne disclaims beneficial ownership of all of the shares beneficially owned by LMSCapital plc.
11. Risk Assessment Disclosure
Weatherford International Ltd., as the ultimate parent company of the Weatherford group of affiliates, is fullyintegrated into the Company-wide internal risk assessment process.
SR-9
WEATHERFORD INTERNATIONAL, LTD.
NOTES TO STATUTORY FINANCIAL STATEMENTS — (Continued)

The Company-wide internal risk assessment process consists of regular reporting to the Board of Directors onidentified risks and management’s reaction to them. The procedures and actions to identify the risks, and whereappropriate remediate, are performed by specific corporate functions (e.g. Treasury, Legal, Internal Audit,Engineering and Operations) as well as by the business units of the Company.
These functions and business units have the responsibility to support and monitor the Company-wideprocedures and processes to ensure their effective operation.
12. Guarantees and Commitments
Weatherford International Ltd., as the ultimate parent company of the Weatherford group, guarantees theobligations of Weatherford Bermuda and Weatherford International, Inc. The guaranteed debt includes certainshort-term commercial paper, notes, revolving credit facilities, and debentures totaling approximately CHF6.9 billion at December 31, 2009. Footnotes 9 and 10 in the Company’s consolidated financial statements containmore detailed information on the underlying debt guaranteed by the Company.
13. Acquisitions
In July 2009, the Company completed its acquisition of the Oilfield Services Division (“OFS”) of TNK-BP. Inthis transaction, the Company acquired ten oilfield services companies providing drilling, well workover andcementing services operating in West Siberia, East Siberia and the Volga-Urals region. The Company issued24.3 million shares valued at CHF 490 million in connection with this acquisition. In addition, if TNK-BP sells itsshares in the Company for a price less than $18.50 per share prior to June 29, 2010, the Company is obligated to payTNK-BP additional consideration in an amount equal to the difference between the price at which the shares weresold and $18.50. The Company will pay any additional consideration in cash or, at the Company’s option in certaininstances, in additional shares following such date.
During 2009, the Company issued 30 million common shares valued at CHF 610 million as consideration forbusiness acquisitions, which includes the TNK-OFS acquisition. In addition, a subsidiary of the Company issuedfive million shares out of treasury valued at CHF 113 million in consideration for business acquisitions.
14. Related Party Transactions
A subsidiary of the Company, Weatherford U.S., L.P. (“WUSLP”), performs general and administrativefunctions and provides oversight management services to most Weatherford entities. WUSLP personnel dutiesinclude, but are not limited to, marketing, tax, treasury, risk management, real estate, human resources, informationtechnology, and legal services.
The Company was charged a management fee by WUSLP in consideration for these duties during 2009. Thesecharges included costs incurred on the Company’s behalf for executive salaries, board of director fees, financialstatement audit fees, internal audit costs and investor relations costs. In addition, the Company was allocated apercentage of various other functional expenses including legal, financial reporting, tax and treasury activities.
15. Insurance
The Company maintains insurance policies covering the property, equipment and leasehold improvements ofthe Weatherford group of affiliates. The value of the coverage is at replacement cost, which is in excess of the bookvalue of Weatherford’s consolidated property, plant and equipment balance at December 31, 2009.
16. Personnel Expenses
Consolidated personnel expenses for the Weatherford group of affiliates for the year ended December 31, 2009was approximately CHF 2,736 million.
SR-10
WEATHERFORD INTERNATIONAL, LTD.
NOTES TO STATUTORY FINANCIAL STATEMENTS — (Continued)


Financial Highlights 2
Letter to Shareholders 3
Productivity Profiles 11
Product and Service Portfolio 19
Leadership 22
Financial Report 23
Corporate Information Inside back cover
Corporate Information
Independent Registered Accounting Firm
Ernst & Young LLP5 Houston Center1401 McKinney, Suite 1200Houston, TX 77010
Swiss Auditor
Ernst & Young Ltd.Bleicherweg 21CH-8002 Zurich, Switzerland
Legal Counsel
Andrews & Kurth LLP600 Travis, Suite 4200Houston, TX 77002
Stock Data
New York Stock ExchangeSymbol: WFTNYSE Euronext ParisSymbol: WFT
Financial Information
Financial analysts and shareholders seeking information about Weatherford International Ltd. should contact our U.S. Investor Relations department at 515 Post Oak Boulevard, Houston, TX77027. Our telephone number at that location is 713-693-4000. We will provide to any shareholder a copy of ourannual report, without charge, upon writtenrequest. Financial information may also be obtained by visiting our website athttp://www.weatherford.com.
Corporate Headquarters
Weatherford International Ltd.4-6 Rue Jean-François Bartholoni1204 GenevaSwitzerland+41 22 816 1500
Regional Offices
Asia Pacific14th Floor, West WingRohas PerkasaNo. 8, Jalan PerakKuala Lumpur 50450Malaysia+60 3 2168 6000
Canada333 5th Avenue S.W., Suite 1100Calgary, AlbertaT2P 3B6Canada+1 403 693 7500
Middle East /North Africa4th Interchange, Al BarshaSheikh Zayed RoadAl-Khaimah Building IIDubai UAE+9 71 4 312 5000
United States515 Post Oak BoulevardHouston, TX 77027USA+1 713 693 4000
Latin AmericaBlvd. Manuel Avila Camancho 4023rd FloorCol. Lomas de ChapultepecMexico D.F., CP11100+52 55 91384800
Russia, Europe & Sub-Sahara AfricaCarlton House33 Robert Adam StreetLondon W1U 3HRUK+44 2075631500
SGS-COC-003505
Pushing ProductivityWeatherford International 2009 Annual ReportWeatherford International Ltd.4-6 Rue Jean-François Bartholoni1204 GenevaSwitzerland+41 22 816 1500
weatherford.com
Weatherford International Ltd.
20
09
An
nu
al Rep
ort


