9.1 Introduction The primary objective of public debt management is to ensure that the government's financing needs and its payment obligations are met at the lowest possible cost over the medium to long term, consistent with a prudent degree of risk. Pakistan’s strategy to reduce its debt burden to a sustainable level includes commitment to run primary surpluses, maintain low and stable inflation, promote measures that support higher long-term economic growth and follow an exchange rate regime based on economic fundamentals. Public debt witnessed various developments during the ongoing fiscal year, some of them are highlighted as follows: Most of the net domestic debt raised during first nine months of current fiscal year was through medium-to-long-term government securities (Pakistan Investment Bonds) and National Saving Schemes (NSS); The cost of borrowing through long term government bonds declined. Importantly, the government was able to borrow via long-terms bonds at rates well below the policy rate of State Bank of Pakistan (SBP). The market’s willingness to lend to the government for long tenors at rates below the policy rate reflects the general confidence in macroeconomic policies of the government; In-line with the government’s commitment, no new borrowing was made from SBP during ongoing fiscal year. In fact, there was a net retirement of Rs 286 billion in the outstanding debt obtained from SBP in previous years; Government has started re-issuance of 15-years fixed rate Pakistan Investment Bonds (PIBs) with the view of lengthening the maturity profile of domestic debt and provide an additional tenor/option to the investors; In order to diversify investor base in government securities and capitalize liquidity available with Islamic Financial Institutions, the government has started issuance of 5- Year Floating Rate Sukuk; All of the net external debt raised during first nine months of current fiscal year was from multilateral and bilateral sources on concessional terms. These above-mentioned trends are expected to continue and the domestic debt profile is projected to improve considerably by the end of the current financial year compared with last year. The proportion of debt held by SBP will decline while the proportion of debt raised through long-term instruments is expected to improve further. Interest expense is PUBLIC DEBT Chapter 9
Transcript
9.1 Introduction
The primary objective of public debt management is to ensure that the government's financing needs and its payment obligations are met at the lowest possible cost over the medium to long term, consistent with a prudent degree of risk. Pakistan’s strategy to reduce its debt burden to a sustainable level includes commitment to run primary surpluses, maintain low and stable inflation, promote measures that support higher long-term economic growth and follow an exchange rate regime based on economic fundamentals.
Public debt witnessed various developments during the ongoing fiscal year, some of them are highlighted as follows:
� Most of the net domestic debt raised during first nine months of current fiscal year was through medium-to-long-term government securities (Pakistan Investment Bonds) and National Saving Schemes (NSS);
� The cost of borrowing through long term government bonds declined. Importantly, the government was able to borrow via long-terms bonds at rates well below the policy rate of State Bank of Pakistan (SBP). The market’s willingness to lend to the government for long tenors at rates below the policy rate reflects the general confidence in macroeconomic policies of the government;
� In-line with the government’s commitment, no new borrowing was made from SBP during ongoing fiscal year. In fact, there was a net retirement of Rs 286 billion in the outstanding debt obtained from SBP in previous years;
� Government has started re-issuance of 15-years fixed rate Pakistan Investment Bonds (PIBs) with the view of lengthening the maturity profile of domestic debt and provide an additional tenor/option to the investors;
� In order to diversify investor base in government securities and capitalize liquidity available with Islamic Financial Institutions, the government has started issuance of 5-Year Floating Rate Sukuk;
� All of the net external debt raised during first nine months of current fiscal year was from multilateral and bilateral sources on concessional terms.
These above-mentioned trends are expected to continue and the domestic debt profile is projected to improve considerably by the end of the current financial year compared with last year. The proportion of debt held by SBP will decline while the proportion of debt raised through long-term instruments is expected to improve further. Interest expense is
PUBLIC DEBT
Chapter 9
Pakistan Economic Survey 2019-20
170
expected to remain significantly less than the budgeted amount in 2019-20 owing to re-profiling of short-term debt into long-term debt and sharp decline in cost of borrowing in longer tenors.
Over the medium term, government objective is to reduce its “Gross Financing Needs (GFN)” through various measures mainly including (i) better cash flow management through a treasury single account; (ii) lengthening of maturities in the domestic market keeping in view cost and risks trade-off; (iii) developing regular Islamic based lending program and (iv) avail maximum available concessional external financing from bilateral and multilateral development partners to benefit from concessional terms and conditions.
Government also aims to bring and maintain its Debt-to-GDP and Debt Service-to-Revenue ratios to sustainable levels through a combination of greater revenue mobilization, rationalization of current expenditure and efficient/productive utilization of debt.
9.2 Public Debt Fiscal Responsibility and Debt Limitation Act 2005 defines “Total Public Debt” as debt owed by government (including Federal Government and Provincial Governments) serviced out of consolidated fund and debts owed to the International Monetary Fund. Whereas, “Total Debt and Liabilities” of the country include “Total Public Debt” (Government Debt) as well as debt of other sectors as presented in the table below:
Table-9.1: Pakistan’s Debt and Liabilities (Rs in billion) 2015 2016 2017 2018 2019 Mar-20
I. Government Domestic Debt 12,192.5 13,625.9 14,849.2 16,416.3 20,731.8 22,477.7
II. Government External Debt 4,770.0 5,417.6 5,918.7 7,795.8 11,055.1 11,658.1
III. Debt from IMF 417.6 633.1 640.8 740.8 921.0 1,071.3
IV. External Liabilities1 377.6 377.1 373.8 622.3 1,710.1 1,642.5
VI. PSEs External Debt 252.7 294.0 285.2 324.6 630.6 582.0
VII. PSEs Domestic Debt 458.7 568.1 822.8 1,068.2 1,394.2 1,397.7
VIII. Commodity Operations2 564.5 636.6 686.5 819.7 756.4 649.3
IX. Intercompany External Debt from Direct Investor abroad 276.6 315.6 353.9 437.2 542.7 707.5
A. Total Debt and Liabilities (sum I to IX) 19,849.4 22,577.1 25,114.2 29,879.4 40,223.1 42,820.3
C. Total Public Debt (sum I to III) 17,380.2 19,676.6 21,408.7 24,952.9 32,707.9 35,207.0
D. Total Debt of the Government3 15,986.0 17,823.2 19,635.4 23,024.0 29,520.7 31,452.4
Memorandum Items
GDP (current market price) 27,443.0 29,075.6 31,922.3 34,616.3 37,972.3 41,726.7
Government Deposits with the banking system4 1,394.1 1,853.5 1,773.3 1,928.9 3,187.2 3,754.6
US Dollar, last day average exchange rates 101.8 104.8 104.9 121.5 163.1 166.4
1 External Liabilities include Central bank deposits, SWAPS, Allocation of Special Drawing Rights (SDR) and non-resident LCY deposits with central bank. 2 Includes borrowings from banks by provincial governments and PSEs for commodity operations. 3 As per Fiscal Responsibility and Debt Limitation Act, 2005 amended in June 2017, "Total Debt of the Government" means the debt of the government (including the Federal Government and the Provincial Governments) serviced out of the consolidated fund and debts owed to the International Monetary Fund (IMF) less accumulated deposits of the Federal and Provincial Governments with the banking system. 4 Accumulated deposits of the Federal and Provincial Governments with the banking system.
Source: State Bank of Pakistan and Debt Policy Coordination Office, Ministry of Finance
Total public debt was recorded at Rs 35,207 billion at end March 2020 compared with Rs 32,708 billion at end June 2019, registering an increase of Rs 2,499 billion during first nine
Public Debt
171
month of current fiscal year while Federal Government borrowing for financing of its deficit was Rs 2,080 billion during the said period. This differential is mainly attributable to depreciation of Pak Rupee against US Dollar, increase in cash balances of the Federal Government and difference between face value (which is used for recording of debt) and the realized value (which is recorded as budgetary receipt) of PIBs issued during the said period. The trend in total public debt since 1971 is depicted in Box-I.
Box-I: Trend in Total Public Debt Table-9.2: Year Wise Total Public Debt Position
Contrary to last year, most of the net domestic debt raised during first nine months of current fiscal year was through medium-to-long-term government securities (PIBs) and NSS. Even within short-term floating debt, the government borrowed mostly via 12-Months Treasury Bills (T-bills). Resultantly, the share of 3-months T-bills in total T-bills portfolio reduced to around 28 percent at end March 2020 compared with around 100 percent at end June 2019.
0
2,000
4,000
6,000
8,000
10,000
12,000
14,000
16,000
18,000
20,000
22,000
24,000
1971
1972
1973
1974
1975
1976
1977
1978
1979
1980
1981
1982
1983
1984
1985
1986
1987
1988
1989
1990
1991
1992
1993
1994
1995
1996
1997
1998
1999
2000
2001
2002
2003
2004
2005
2006
2007
2008
2009
2010
2011
2012
2013
2014
2015
2016
2017
2018
2019
Mar
-20
Fig-9.1: Trend in Domestic and External Debt(Rs in billion)
Domestic Debt External Debt
Pakistan Economic Survey 2019-20
172
On the external front, all of the net external debt raised during first nine months of current fiscal year was from multilateral and bilateral sources. Accordingly, the share of multilateral and bilateral inched up in external public debt portfolio1 while share of debt obtained from commercial sources (loans from foreign commercial banks and Eurobonds) relatively declined during first nine months of current fiscal year as compared with last fiscal year.
Government is creating an enabling environment for the overseas Pakistanis to invest in government securities. In this connection, the government is in the process of introducing “Overseas Pakistanis Savings Bills” in both conventional and shariah compliant mode. The key highlights of the Bill are presented in Box-II2:
Box-II: Overseas Pakistanis Savings Bills
Eligible Investors
Non-resident individual Pakistani (NRIP) having National Identity Card for Overseas Pakistanis, foreigners having Pakistan Origin Card, members of Overseas Pakistanis Foundation or an employee or official of the Federal Government or a Provincial Government posted abroad that are eligible to open Foreign Currency Account (FCA) and Non-Resident Rupee Account Repatriable (NRAR) as per existing regulations may either individually or jointly purchase the Bill.
Form of Bill The Bill shall be issued in scrip-less form.
Types of Bill
The Bill shall be issued both in conventional and Shariah compliant mode.
Tenor The Bill shall be issued for 3-Month, 6-Month and 12-Months tenors.
Currency of the Bill The Bill shall be issued in both Pakistan Rupee (PKR) and United States Dollar (USD).
Bill issuance
The Bill shall be issued through selected commercial banks.
Online application Form For purchasing a Bill, the purchaser shall fill an online application form to be available on the web-page of the selected commercial banks.
Premature encashment Premature encashment shall be allowed, provided that rate of return of the broken period shall be calculated as per rate of return of the nearest shorter tenor Bill. No profit shall be paid in case of encashment before completion of three months.
Rate of Return
Tenor Rate of Return on USD Denominated Bill (%)
Rate of Return on PKR Denominated Bill (%)
3-Month 5.5 9.5
6-month 6.0 10.0
12-Month 6.5 10.5
1 Excluding non-resident investment in government domestic securities 2For details, National Savings Schemes (Overseas Pakistani Savings Bills) Rules, 2020 is available at the following web-link: http://finance.gov.pk/budget/CDNS_OPS_Bills_2020.pdf
Public Debt
173
Minimum Investment and Maximum Limit Limits USD Denominated Bill PKR Denominated Bill Minimum Investment USD 5000 and integral multiples of
USD 500 PKR 100,000 and integral multiples
of PKR 10,000 Maximum Limit No Limit No Limit
In order to reduce financial risks and diversify investors base, development of debt capital market remains vital. It essentially provides the government with a non-inflationary source of finance, creates a well-balanced financial environment and promotes economic growth. Government is taking various steps to provide an efficient and liquid secondary debt markets to the investors (Box-III).
Box-III: Steps Taken for The Development of Debt Capital Markets To promote listing of debt securities and bringing efficiency in IPO process for issuance of debt securities, following major amendments in this context have been made in Public Offering Regulatory Framework:
(i) Eligibility criteria for listing of debt securities is revised to enable issuers having operational track record of less than three years and profitable track record of less than two years to raise debt;
(ii) Listing Committee responsible for approval of listing application has been abolished;
(iii) Requirement of audited accounts has been reduced from 5 years to 2 years;
(iv) For listing of privately placed debt securities backed by debt servicing guarantee from Government of Pakistan, the requirement of information memorandum, credit rating, debt securities trustee and market maker is abolished;
(v) For listing of privately placed debt securities by entities having instrument rating of A and above, requirements of information memorandum, debt securities trustee and market maker have been abolished;
(vi) Requirement of credit rating for listing of publicly placed debt securities backed by debt servicing guarantee from the Government of Pakistan has been abolished;
(vii) Allowed audited accounts not older than eight months to be incorporated in the Prospectus.
Future Initiatives with regard to Development of Debt Market
(i) Review of Public Offering Regulations, 2017 with the objective to promote ease of doing business, decrease cost of doing business, enhance liquidity, facilitate State Owned Enterprises (SOEs) to tap capital market for fund raising and introducing regulatory amendments conducive for issuance of local currency bonds in Pakistan by multilateral agencies/supranational;
(ii) Review of Market Making framework with the objective to create liquidity in secondary debt market;
(iii) Introduction of spread discovery mechanism for public offering of debt securities enabling the issuer to discover the spread through competitive process;
(iv) Review of Securities Act, 2015 to make IPO process for issuance of debt securities more efficient and shift towards disclosure-based regime instead of approvals.
Source: Securities and Exchange Commission of Pakistan
9.2.1 Progress on Medium Term Debt Management Strategy (2015/16 - 2018/19)
In accordance with the MTDS (2015/16-2018/19), the government was required to lengthen the maturity profile of its domestic debt portfolio while certain indicative ranges were defined to monitor the risks of total public debt portfolio and ensure its sustainability.
Pakistan Economic Survey 2019
174
Table-9.3: Public Debt Cost and Risk Indicators*
Risk Indicators
Refinancing Risk
Average Time to Maturity (ATM) - Years Debt Maturing in 1 Year (% of total)
Interest Rate Risk
Average Time to Re-Fixing (ATR) - Years Debt Re-Fixing in 1 year (% of total) Fixed Rate Debt (% of total)
Foreign Currency Risk (FX)
Foreign Currency Debt (% of total debt) Short Term FX Debt (% of reserves)
* As per modalities of MTDS (2015/16 -Source: Debt Policy Coordination Office,
As evident from the table above, the government was not in breach of any risk indicator thresholds at end June 2019. One perspective in 2018-19 was the rethe existing stock of SBP borrowing from short term (6 months) to medium to long term (1 to 10 years). The re-profiling took into effect in the month of June 2019 and helped the government in reducing the rollover/refinancing risk of its domestic debt portfolio.
Refinancing Risk
The re-profiling of SBP borrowing helped the government in reducing the refinancing risk of its domestic debt portfolio at end June 2019 as domestic debt maturing in one year reduced to 37 percent compared with 66 percent at end of last fiscal year. Accordingly, average time to maturity of domestic debt portfolio significantly increased to 4.2 end June 2019 compared with 1.6 years at end June 2018, which is very close to longtarget set by the government for its domestic debt portfolio. External debt’s average time to maturity is already 7 years and government intends to maintain omedium to long term. The redemption profile of domestic and external debt at end June 2019 is shown in the graph below:
0
2,000,000
4,000,000
6,000,000
8,000,000
10,000,000
20
20
20
21
20
22
20
23
20
24
Fig-9.2: Redemption Profile of Total Public Debt
Pakistan Economic Survey 2019-20
9.3: Public Debt Cost and Risk Indicators* Indicative Ranges
(MTDS 2015/16 - 2018/19) Domestic
Debt External
Debt 2018 2019 2018 20
Time to Maturity 1.5 (minimum) and 2.5 - DD 3.0 (minimum) and 4.5 – PD
1.6 4.2 7.6
Debt Maturing in 1 Year 50% and 65% (maximum) - DD 35% and 50% (maximum) – PD
66.3 36.8 12.4 17.2
Fixing 1.5 (minimum) and 2.5 - DD 3.0 (minimum) and 4.5 – PD
1.6 1.7 6.6
Fixing in 1 year 50% and 65% (maximum) – DD 40% and 55% (maximum) – PD
66.6 64.9 32.2 36.1
**
44.3 71.9 72.5 68.3
Foreign Currency Debt (% 20% (minimum) and 35%
Short Term FX Debt (% of **
- 2018/19), **Not Applicable, PD: Public Debt, DD: Domestic DebtSource: Debt Policy Coordination Office, Ministry of Finance
As evident from the table above, the government was not in breach of any risk indicator thresholds at end June 2019. One of the notable developments from debt management
19 was the re-profiling of domestic debt, where government rethe existing stock of SBP borrowing from short term (6 months) to medium to long term
ling took into effect in the month of June 2019 and helped the government in reducing the rollover/refinancing risk of its domestic debt portfolio.
profiling of SBP borrowing helped the government in reducing the refinancing risk f its domestic debt portfolio at end June 2019 as domestic debt maturing in one year
percent compared with 66 percent at end of last fiscal year. Accordingly, average time to maturity of domestic debt portfolio significantly increased to 4.2 end June 2019 compared with 1.6 years at end June 2018, which is very close to longtarget set by the government for its domestic debt portfolio. External debt’s average time to maturity is already 7 years and government intends to maintain or slightly improve it over medium to long term. The redemption profile of domestic and external debt at end June 2019 is shown in the graph below:
20
25
20
26
20
27
20
28
20
29
20
30
20
31
20
32
20
33
20
34
20
35
20
36
9.2: Redemption Profile of Total Public Debt (Rs in million) - As at end June 2019
External Domestic
External
Public Debt
2019 2018 2019 7.0 3.6 5.2
17.2 48.9 29.9
6.1 3.2 3.2
36.1 55.5 54.9
68.3 53.4 70.6
32.2 34.8
80.6 158.7
**Not Applicable, PD: Public Debt, DD: Domestic Debt
As evident from the table above, the government was not in breach of any risk indicator of the notable developments from debt management
profiling of domestic debt, where government re-profiled the existing stock of SBP borrowing from short term (6 months) to medium to long term
ling took into effect in the month of June 2019 and helped the government in reducing the rollover/refinancing risk of its domestic debt portfolio.
profiling of SBP borrowing helped the government in reducing the refinancing risk f its domestic debt portfolio at end June 2019 as domestic debt maturing in one year
percent compared with 66 percent at end of last fiscal year. Accordingly, average time to maturity of domestic debt portfolio significantly increased to 4.2 years at end June 2019 compared with 1.6 years at end June 2018, which is very close to long-term target set by the government for its domestic debt portfolio. External debt’s average time to
r slightly improve it over medium to long term. The redemption profile of domestic and external debt at end June
20
36
20
37
20
38
20
39
Public Debt
175
Interest Rate Risk
It is important to note that 70 percent of the re-profiling of SBP borrowing was carried out through floating-rate PIBs. Therefore, the government remained very close to maximum limit set for debt re-fixing/interest rate. Exposure to interest rate risk slightly reduced as percentage of debt re-fixing in one year decreased to around 55 percent at end June 2019 compared with 56 percent at end June 2018. Going forward, government preference is to borrow more through fixed rate instruments to reduce interest rate risk of its public debt portfolio.
Foreign Currency Risk
Short-term external public debt maturities as percentage of official liquid reserves stood at 159 percent at end June 2019 compared with 81 percent at end June 2018. The higher proportion of external public maturities falling within a year compared with the level of official liquid reserves resulted in an increase in this ratio.
Around 35 percent of total public debt stock was denominated in foreign currencies at end June 2019, exposing public debt portfolio to exchange rate risk. Within external debt and adjusted for Special Drawing Rights (SDR)3, around 98 percent of total external public debt was contracted in 4 major currencies i.e. main exposure of exchange rate risk comes from USD denominated loans (54 percent of external public debt), followed by Japanese Yen (28 percent), Chinese Yuan (8 percent) and Euro (7 percent). Currency wise composition of public debt portfolio at end June 2019 is depicted through the table 9.4.
9.2.2 Dynamics of Public Debt Burden
The analysis of various solvency and liquidity indicators provides clear insight into debt sustainability of the country. The debt burden can be expressed in terms of stock ratio (Debt-to-GDP) or flow ratios (Debt-to-revenue). Although Debt-to-GDP Ratio is the globally recognized primary measure of debt sustainability, debt burden in terms of flow ratios reflects more accurately on repayment capacity of the country.
Table-9.5: Selected Public Debt Indicators (in percentage) 2015 2016 2017 2018 2019
Revenue Balance / GDP (1.7) (0.8) (0.7) (1.7) (5.7)
Primary Balance / GDP (0.5) (0.2) (1.5) (2.1) (3.5)
Fiscal Balance / GDP (5.3) (4.6) (5.8) (6.5) (9.1)
Gross Public Debt / GDP 63.3 67.7 67.1 72.1 86.1
Total Government Debt / GDP 58.3 61.3 61.5 66.5 77.7
Gross Public Debt / Revenue 442.1 442.5 433.7 477.3 667.4
3 Loans in SDR are decomposed in relevant currencies available in basket according to their assigned weights.
Table-9.4: Currency Wise Total Public Debt
Currencies Percentage Pak Rupee 65.2
US Dollar 20.0
Special Drawing Right 8.9
Japanese Yen 3.9
Euro 1.9
Total 100.0
Source: Debt Policy Coordination Office, Ministry of Finance
Pakistan Economic Survey 2019-20
176
Table-9.5: Selected Public Debt Indicators (in percentage) 2015 2016 2017 2018 2019
Total Government Debt / Revenue 406.7 400.8 397.7 440.4 602.3
Debt Service / Revenue 40.4 35.9 38.3 37.3 62.5
Interest Service / Revenue 33.2 28.4 27.3 28.7 42.7
Debt Service / GDP 5.8 5.5 5.9 5.6 8.1
Source: Debt Policy Coordination Office Staff Calculations, Ministry of Finance
Lower revenue collection and rise in current expenditures led to higher fiscal deficit of 9.1 percent of GDP during 2018-19. Similarly, primary deficit4 and revenue deficit5 were recorded at 3.5 percent and 5.7 percent of GDP, respectively. The analysis of developments in revenue and current expenditures during 2018-19 reveals following important information:
� Revenue collection at the Federal level remained lower than 2 percent of GDP compared with the projections for 2018-19, out of which around 3⁄4 of the revenue shortfall was due to one-off factors:
−−−− Delay in renewing telecom licenses; delay in sale of envisaged state assets and weaker than anticipated tax amnesty proceeds contributed around 1 percent of GDP;
−−−− Shortfall in the transfer of SBP profits contributed an additional 0.5 percent of GDP owing to heavy exchange rate losses incurred by SBP on its external liabilities.
� The current expenditure grew by around 21 percent during 2018-19 mainly due to higher interest payments (up by 39 percent). Apart from rise in domestic interest rates, one-off transaction amounting to Rs 296 billion on account of interest payment against re-profiling of SBP borrowing contributed towards increase in interest payments i.e. re-profiling of SBP borrowing from short-term to medium-to-long term on June 30, 2019 required the government to pay accrued interest amounting to Rs 296 billion to SBP. Since re-profiling of SBP borrowing involved creation of new instruments, accrued interest was required to be paid on existing debt instruments till June 30, 2019 as per accounting policies followed by SBP.
The fiscal position significantly improved during first nine months of current fiscal year. Fiscal deficit was recorded at 4.0 percent of GDP, against 5.1 percent during the same period last year. In particular, the primary surplus of 0.5 percent of GDP was recorded compared with the primary deficit of 1.2 percent of GDP recorded during the same period last year. This improvement is primarily attributable to significant increase in revenue collection that outpaced the expenditure growth. While the increase in revenues emanated from both tax and non-tax segments, the overall expenditures rose mainly on the back of higher interest payments and development expenditures.
Total Public Debt to GDP ratio reached 72.1 percent while total debt of the government to 4Primary balance is the total revenues minus non-interest expenditure or fiscal deficit before interest payments. Primary balance is an
indicator of current fiscal efforts since interest payments are predetermined by the size of previous deficits. 5Revenue balance is the total revenue minus current expenditure. The persistence of revenue deficit indicates that the government is not
only borrowing to finance its development expenditure, but also partially financing its current expenditure.
GDP was 66.5 percent at end of 2017as percentage of GDP stood at 86.1 percent and 77.7 percent respectively at end June 2thus, increasing further during 2018loss on account of currency depreciation and buildsignificantly towards the increase
Debt-to-GDP ratio was expected to decline at the end of 2019consolidation efforts of the government. However, the result in higher than anticipated Debtgrowth and the increase in the budget deficit. Nonetheless, given the temporary nature of the ongoing shock, Debt-to-GDP ratio is projected to remain on a clear downward path over the medium term primarily assisted by ongoing
Steep rise in domestic interest rate and depreciation of Pak Rupee along with already constrained revenue growth increased the debtinterest payments consumed almost 43 percent of total government revenue. nine months of current fiscal year, interest expenditures consumed revenues.
9.2.3 Servicing of Public Debt
Interest servicing was recorded at Rs year against the annual budgewere recorded at Rs 1,646 servicing during first nine months of current fiscaldomestic debt in total public debt portfolio.
-
5,000
10,000
15,000
20,000
25,000
30,000
35,000
2012-13 2013-14
(LHS: Rs in Billion, RHS: Percent of GDP)
Domestic Debt
External Debt
Total Public Debt to GDP
Total Debt of the Government to GDP
GDP was 66.5 percent at end of 2017-18. Total public debt and total debt of the government as percentage of GDP stood at 86.1 percent and 77.7 percent respectively at end June 2thus, increasing further during 2018-19. Apart from fiscal deficit, unprecedented revaluation loss on account of currency depreciation and build-up of liquidity buffer contributed
the increase in Debt-to-GDP ratio during 2018-19.
GDP ratio was expected to decline at the end of 2019-20 on the back of fiscal consolidation efforts of the government. However, the COVID-19 shock is expected to result in higher than anticipated Debt-to-GDP ratio mainly due to the sharp decline growth and the increase in the budget deficit. Nonetheless, given the temporary nature of the
GDP ratio is projected to remain on a clear downward path over the medium term primarily assisted by ongoing fiscal consolidation.
ep rise in domestic interest rate and depreciation of Pak Rupee along with already constrained revenue growth increased the debt-servicing requirements during 201interest payments consumed almost 43 percent of total government revenue. nine months of current fiscal year, interest expenditures consumed 40 percent
9.2.3 Servicing of Public Debt
servicing was recorded at Rs 1,880 billion during first nine months of current fiscal year against the annual budgeted estimate of Rs 2,891 billion. Domestic interest payments
Rs 1,646 billion and constituted around 88 percent of total ring first nine months of current fiscal which is attributable to higher volume of
in total public debt portfolio.
2014-15 2015-16 2016-17 2017-18 2018
Fig-9.3: Profile of Public Debt (LHS: Rs in Billion, RHS: Percent of GDP)
Total Public Debt to GDP
Total Debt of the Government to GDP
Public Debt
177
18. Total public debt and total debt of the government as percentage of GDP stood at 86.1 percent and 77.7 percent respectively at end June 2019,
19. Apart from fiscal deficit, unprecedented revaluation up of liquidity buffer contributed
20 on the back of fiscal 19 shock is expected to
GDP ratio mainly due to the sharp decline in growth and the increase in the budget deficit. Nonetheless, given the temporary nature of the
GDP ratio is projected to remain on a clear downward path over the
ep rise in domestic interest rate and depreciation of Pak Rupee along with already servicing requirements during 2018-19 i.e.
interest payments consumed almost 43 percent of total government revenue. During first percent of total
billion during first nine months of current fiscal Domestic interest payments
of total interest higher volume of
50%
55%
60%
65%
70%
75%
80%
85%
90%
95%
100%
2018-19
Pakistan Economic Survey 2019-20
178
Table-9.6: Public Debt Servicing (Rs in billion) 2019-20*
Budgeted (2019-20)
Actual Percent of Revenue
Percent of Current
Expenditure Total External Principal Repayment (A) 1,203.6 818.4 17.5 14.6 Servicing of External Debt 359.8 234.1 5.0 4.2 Servicing of Domestic Debt 2,531.7 1,645.6 35.1 29.3 Total Interest Servicing (B) 2,891.4 1,879.7 40.1 33.5 Total Servicing of Public Debt (A+B) 4,095.0 2,698.1 57.5 48.1 *: July-March Source: Budget Wing and Debt Policy Coordination Office Staff Calculations, Ministry of Finance
Interest expense is expected to remain significantly less than the budgeted amount in 2019-20 owing to re-profiling of short-term debt into long-term debt and sharp decline in cost of borrowing in longer tenor.
9.3 Domestic Debt
Domestic debt is primarily obtained to finance fiscal deficit while also lending support to Public Sector Development Programme (PSDP). Domestic debt comprises permanent debt (medium and long-term), floating debt (short-term) and unfunded debt (primarily made up of various instruments available under National Savings Schemes).
Government currently issues three broad types of marketable government securities in order to raise domestic debt i.e. T-bills, PIBs and Government Ijara Sukuk (GIS).
� T-bills are considered short-term securities and have maturities of 12 months or less at the time of issuance.
� PIBs are considered longer-term securities and have maturities of more than 12 months at the time of issuance. Government currently issues fixed-rate PIBs with 3-year, 5-year, 10-year, 15-year and 20-year maturities and floating-rate PIBs with 10-year maturity. All of these PIBs pay profit on semi-annual basis.
� Shariah compliant securities program has also been in place since 2008-09, however, it constitutes a small proportion of government domestic securities portfolio.
The instrument-wise composition of domestic debt during last few years is depicted through following graph:
-
5,000
10,000
15,000
20,000
25,000
2014-15 2015-16 2016-17 2017-18 2018-19 Mar-20
Fig-9.4: Evolution of Domestic Debt (Rs in billion)
PIBs T-Bills MRTBs
Sukuk NSS Others
Public Debt
179
9.3.1 Domestic Borrowing Operations
Domestic debt reached Rs 22,478 billion at end March 2020. Domestic borrowing operations remained quite successful during ongoing fiscal year despite a challenging macroeconomic situation as highlighted below:
� As part of the government’s efforts to adopt fiscal discipline, government is not borrowing from SBP since July 2019. In fact, the government retired a portion of its debt owed to SBP amounting to Rs 286 billion;
� Most of the net domestic debt was raised through medium-to-long-term government securities and NSS;
� The cost of borrowing through long-term government bonds significantly declined. In fact, the government was able to borrow in long tenors at rates well below the policy rate of SBP;
� Government has started re-issuing 15-year fixed rate PIBs to provide additional tenor/option to the investors while also lending support to maturity profile of domestic debt portfolio;
� Government has started issuance of 5-Year Floating Rate Sukuk. Potential benefits of Sukuk include:
−−−− Taking affirmative action towards the Constitution’s goal to eradicate Riba and to the Senate’s Resolution No. 393, which inter alia calls on the Government to take steps to abolish Riba;
−−−− Lowering the cost of financing to the government;
−−−− Supporting development of Islamic financial industry, including banks, mutual funds and Takaful industry by providing a level playing field to the industry;
−−−− Providing Shariah compliant investment avenues for individuals and business that make faith-based investments;
−−−− Lesser speculation as the transactions are backed by tangible asset.
� In case of floating rate PIBs, the government introduced re-opening6 of existing issue in September 2019 with the objective to increase size, potential liquidity and reduce fragmentation.
9.3.2 Domestic borrowing pattern
Market appetite for government securities remained strong throughout first nine months of current fiscal year. In case of fixed rate PIBs, banks’ offers widely surpassed the targets set by the government i.e. healthy participation amounting to Rs 4,328 billion was observed against the target of Rs 925 billion and maturity of Rs 920 billion. Out of this, the government strategically accepted Rs 1,671 billion keeping in view cost risks trade-off. Apart from expectations that interest rates had peaked up at the start of the year, overall improvement in fiscal position and estimates of higher external financing availability fuelled the demand for medium to long tenor government bonds. Due to such a high demand, the government leveraged its position by slashing the cut-off rates by 266 bps, 256 bps and 203 bps for 3 years, 5 years and 10 years PIBs, respectively, during first nine months of 2019-20. Following graphs depict the auction profile of fixed rate PIBs: 6 SBP DMMD Circular No 22 of 2019 (http://www.sbp.org.pk/dmmd/2019/C22.htm)
Pakistan Economic Survey 2019-20
180
In case of floating rate PIBs, government introduced re-opening of existing issue in September 2019. Total participation of Rs 1,225 billion was witnessed in the auction of floating rate PIBs against the target of Rs 600 billion while government accepted Rs 577 billion during first nine months of 2019-20. In addition to existing 10 years’ tenor, government is targeting to introduce tenors of 3 years with quarterly coupon and 5 years with semi-annual coupon payment frequency to attract more diversified investor base. Following graphs depict the auction profile of floating rate PIBs:
Until the first auction of August 2019, market bid mostly for the 3 months T-bills. However, this behaviour changed in all the subsequent auctions, and they started bidding heavily in the 12 months T-bills. Resultantly, share of 3-months T-bills in total T-bills portfolio reduced to around 28 percent at end March 2020 compared with around 100 percent at end June 2019 as depicted in the graph below:
In the wake of recent economic development (post COVID-19), SBP cut the policy rate commutatively by 525 bps to stand at 8 percent in May 2020. The yields on government securities also reduced significantly which will also facilitate in reducing the borrowing cost in the coming years.
9.3.4 Component Wise Analysis of Domestic Debt
This section highlights the developments in various components of domestic debt during first nine months of current fiscal year:
I. Permanent Debt
Permanent debt mainly comprises medium to long-term instruments PIBs, GIS, Prize Bond etc. PIBs have fixed and semi-annual coupon payment with tenors of 3, 5, 10, 15 and 20 years. Whereas, GIS are medium term Shariah compliant bonds currently issued in 5 years’ tenor. Government of Pakistan has also introduced a conventional long-term (10-year maturity) floating-rate PIBs. It has been a very good addition to domestic securities portfolio enabling the government to borrow for a longer period without locking itself into high fixed borrowing cost. This instrument is also useful for investors, who prefer to avoid fluctuations in the market value of their investments.
Permanent debt constituted 59 percent of domestic debt portfolio and recorded at Rs 13,251 billion at end March 2020, representing an increase of Rs 1,164 billion during first nine months of ongoing fiscal year. The bifurcation of this increase reveals that government net mobilization through issuance of PIBs was Rs 1,321 billion7 while a net retirement amounting to Rs 157 billion was witnessed in Prize Bonds.
II. Floating Debt
Floating debt consists of short-term domestic borrowing instruments i.e. Treasury Bills. Treasury Bills are discounted or zero-coupon instruments issued in 3-months, 6-months and 12-months. In order to meet the short-term financing needs, the government borrows via auction of Treasury Bills, arranged by SBP twice a month.
Floating debt was recorded at Rs 5,771 billion or around 26 percent of total domestic debt portfolio at end March 2020. During first nine months of this fiscal year, the government net mobilization through issuance of T-bills was Rs 556 billion8while government retired Rs 286 billion against SBP debt.
III. Unfunded Debt
The stock of unfunded debt stood at Rs 3,455 billion at end March 2020, constituted around 15 percent of total domestic debt portfolio. Unfunded debt recorded net mobilization of Rs 311 billion during first nine months of current fiscal year compared with Rs 228 billion mobilized during the same period last year. Most of the incremental mobilization came from Defence Saving Certificates (Rs 93 billion), Bahbood Savings Certificates (Rs 78 billion) and Regular Income Certificates (Rs 72 billion).
7 Excluding PIBs held by non-residents amounting to Rs 7 billion which is recorded as external public debt as per the definition/criteria followed by SBP. 8Excluding T-bills held by non-residents amounting to Rs 236 billion which is recorded as external public debt as per the definition/criteria
followed by SBP.
Pakistan Economic Survey 2019-20
184
Over period of time, the government has taken various measures to transform CDNS from merely a retail debt-raising arm of the government to an effective vehicle for financial inclusion and provider of social safety net to the vulnerable sections of the society. In addition, various initiatives are in process which are expected to bring further improvement in CDNS (Box-IV).
Box-IV: Initiative for the Improvement of Central D irectorate of National Savings (CDNS)
IT Transformation: Starting from 2002-03, CDNS has gone a long way towards computerization and automation of its processes. Out of its 375 branches, 222 have been computerized. In the last one year, some more milestones have been achieved for transformation of the organization into an Information Technology enabled entity.
Sharia Product of National Savings: CDNS has developed its first Sharia Compliant product called Sarwa Islamic Savings Account (“SISA”). The Draft rules for it have been printed in the Gazette of Pakistan and after approval of the Cabinet Committee for Disposal of Legislative Cases (CCLC) and the Federal Cabinet, the proposed SISA Scheme will be introduced across the country.
Overseas Pakistanis Savings Bills: As discussed in Box-II, CDNS is in the process of launching the “Overseas Pakistanis Savings Bills” which will be issued in both conventional and shariah compliant mode.
Launch of Rs 100,000 Premium Prize Bond (Registered): After successful launch of Rs 40,000/- Premium Prize Bond (Registered), CDNS is in the process of launching another registered prize bond for Rs 100,000/-.
Scripless issuance and introduction of registered Prize Bonds: In collaboration with SBP, CDNS is in the process of introducing registered scripless prize bonds amongst all denominations. The registered prize bonds will be a step towards documentation of the economy while providing facility to the general public.
Debit Card Launch & Membership of 1-Link System: In the near future, National Savings is expected to launch ATM Debit Cards with the support of the Karandaaz Pakistan.
Table-9.7: Outstanding Domestic Debt (Rs in billion) 2015 2016 2017 2018 2019 Mar-20 Premium Saving Certificates 0.0 0.0 0.0 0.0 0.0 0.0 Bahbood Savings Certificates 628.3 692.1 749.5 794.9 914.5 992.0 Short Term Savings Certificates 1.7 1.9 3.7 4.3 5.1 10.9 Khass Deposit Accounts 0.3 0.3 0.3 0.3 0.3 0.3 Savings Accounts 26.4 30.2 34.9 38.3 38.2 39.5 Special Savings Accounts 392.9 423.8 489.0 549.0 416.6 453.1 Mahana Amdani Accounts 1.8 1.8 1.7 1.7 1.6 1.5 Pensioners' Benefit Account 214.1 234.7 253.4 274.9 318.3 349.5 Shuhadas Family Welfare Account - - - - 0.0 0.1 National Savings Bonds 0.1 0.1 0.1 0.1 0.1 - Postal Life Insurance Schemes 67.1 67.1 45.8 46.7 47.9 47.4 GP Fund 85.8 90.0 88.8 91.7 104.3 97.6 Total Domestic Debt 12,192.5 13,625.9 14,849.2 16,416.3 20,731.8 22,477.7 P: Provisional *Special Government Bond for SLIC have been added into Government Bonds. **Includes Premium Prize Bonds (Registered). ***Government Securities held by non-residents are deducted from PIB's and T-bills. Source: State Bank of Pakistan
9.3.5 Secondary Market Activities in the Marketable Government Securities:
During first nine months of 2019-20, the secondary market trading volumes witnessed robust increase supported by higher primary market issuances, peaking of interest rate cycle and declining long-term interest rates. Outright trading volume in the government securities during first nine months of 2019-20 amounted to Rs 28 trillion, against Rs 21 trillion recorded during same period of previous year. Similarly, average daily trading volume showed an uptick to Rs 156 billion per day during first nine months of 2019-20 compared with Rs 113 billion per day during the same period last year.
Table 9.8: Secondary Market Trading Volumes Rs in billion Government Security 2017-18 2018-19 2018-19
(Jul-Mar) 2019-20
(Jul-Mar) Treasury Bill - 3 Months 20,118 23,330 17,093 12,452 Treasury Bill - 6 Months 3,147 41 34 2,314 Treasury Bill - 12 Months 258 33 33 4,741 Sub Total 23,523 23,404 17,160 19,507 Pakistan Investment Bonds - 3 Years 1,062 1,596 1,105 2,713 Pakistan Investment Bonds - 5 Years 1,031 889 626 973 Pakistan Investment Bonds - 10 Years 928 1,017 763 1,266 Pakistan Investment Bonds - 15 Years 10 0.6 1 0.1 Pakistan Investment Bonds - 20 Years 11 0.9 1 9 Sub Total 3,042 3,503 2,495 4,961 Government Ijara Sukuk 992 2,202 1,690 3,635 Grand Total 27,557 29,109 21,345 28,103 Daily Average volume 111.6 117.8 112.9 156.1 Source: State Bank of Pakistan
The increase in secondary market trading volumes is mainly attributed to recovery in trading volumes of longer tenor T-bills (6-Months and 12-months) and 3-Year and 10-Year PIBs. As interest-rate cycle peaked and long-term rates started declining, market participants
Pakistan Economic Survey 2019
186
preferred buying and trading these volume moved from 3-Month into 6primary market T-bills issuances. A securityT-bills trading constitute around 7trading.
Supported by successful PIBs auctions since December 2018registered strong growth. The of 2019-20 as compared to Rs strong recovery and nearly doubling compared to preceding year volumesthat the banks were net sellers of PIBs to the non
Regular issuances of floatingsecondary market. During first nine months of 2019floating-rate PIBs were traded. In the first half of the year, Banks preferred to hold the instruments. However, in the third quarter, perhaps as the expectations of fall in interest rates got strengthen, a spike in the secondary market trading volumes was witnessed. Nonbanks purchases around Rs 270 billion worth of floating rate PIBs from the secondarymarket. Trading volumes in GIS more than doubled during the fiscal year. Despite limited outstanding stock of Rs 268 billion at the year start and Rsmaturing during the 9 months, GIS trading volumes increased due to Baitransactions. During the first nine months of 2019increased to Rs 3,635 billion from Rs 1,690 billion recorded previously.
Repo Market
The repo transaction volumes remained elevated during Jul9-Months volume of Rs 27 trillion. Banks rely on repo market to meet their dayliquidity needs. Data indicate that 75The high volumes and increased liquidity in the repo market mean that fican efficiently meet their temporary liquidity needs through repo deals. Market share of repo
0
5
10
15
20
25
30
35
2017-18
Rs
in tr
illio
n
Fig-9.12: Share of Government Securities in Overall Trade Volume
Pakistan Economic Survey 2019-20
preferred buying and trading these longer-tenor securities. As a result, a significant trading Month into 6-Month and 12-Month T-bills supported by robust
bills issuances. A security-wise break up of trading volumes indicates that ute around 70 percent (Rs 20 trillion) of the overall secondary market
PIBs auctions since December 2018, PIBs trading volumes PIBs trading increased to Rs 4,961 billion in first nine months
compared to Rs 2,495 billion in same period of preceding year, registering a strong recovery and nearly doubling compared to preceding year volumes. Data indicatethat the banks were net sellers of PIBs to the non-banks.
floating-rate PIBs in the primary market also led to trading in the secondary market. During first nine months of 2019-20, Rs 906 billion worth of 10
rate PIBs were traded. In the first half of the year, Banks preferred to hold the ts. However, in the third quarter, perhaps as the expectations of fall in interest
rates got strengthen, a spike in the secondary market trading volumes was witnessed. Nonbanks purchases around Rs 270 billion worth of floating rate PIBs from the secondary
Trading volumes in GIS more than doubled during the fiscal year. Despite limited outstanding stock of Rs 268 billion at the year start and Rs 197 billion worth of issues maturing during the 9 months, GIS trading volumes increased due to Baitransactions. During the first nine months of 2019-20, GIS outright trading volumes increased to Rs 3,635 billion from Rs 1,690 billion recorded previously.
The repo transaction volumes remained elevated during July-March, 2019-2027 trillion. Banks rely on repo market to meet their day
liquidity needs. Data indicate that 75 percent of the market volumes are in overnight tenor. The high volumes and increased liquidity in the repo market mean that financial institutions can efficiently meet their temporary liquidity needs through repo deals. Market share of repo
2018-19 2019-20 (Jul
9.12: Share of Government Securities in Overall Trade Volume
T-bills PIBs Sukuk
tenor securities. As a result, a significant trading bills supported by robust
wise break up of trading volumes indicates that ) of the overall secondary market
trading volumes first nine months
billion in same period of preceding year, registering a . Data indicates
rate PIBs in the primary market also led to trading in the 20, Rs 906 billion worth of 10-Year
rate PIBs were traded. In the first half of the year, Banks preferred to hold the ts. However, in the third quarter, perhaps as the expectations of fall in interest
rates got strengthen, a spike in the secondary market trading volumes was witnessed. Non-banks purchases around Rs 270 billion worth of floating rate PIBs from the secondary
Trading volumes in GIS more than doubled during the fiscal year. Despite limited 197 billion worth of issues
maturing during the 9 months, GIS trading volumes increased due to Bai-Muajjal 20, GIS outright trading volumes
20, registering a 27 trillion. Banks rely on repo market to meet their day-to-day
of the market volumes are in overnight tenor. nancial institutions
can efficiently meet their temporary liquidity needs through repo deals. Market share of repo
20 (Jul-Mar)
Public Debt
187
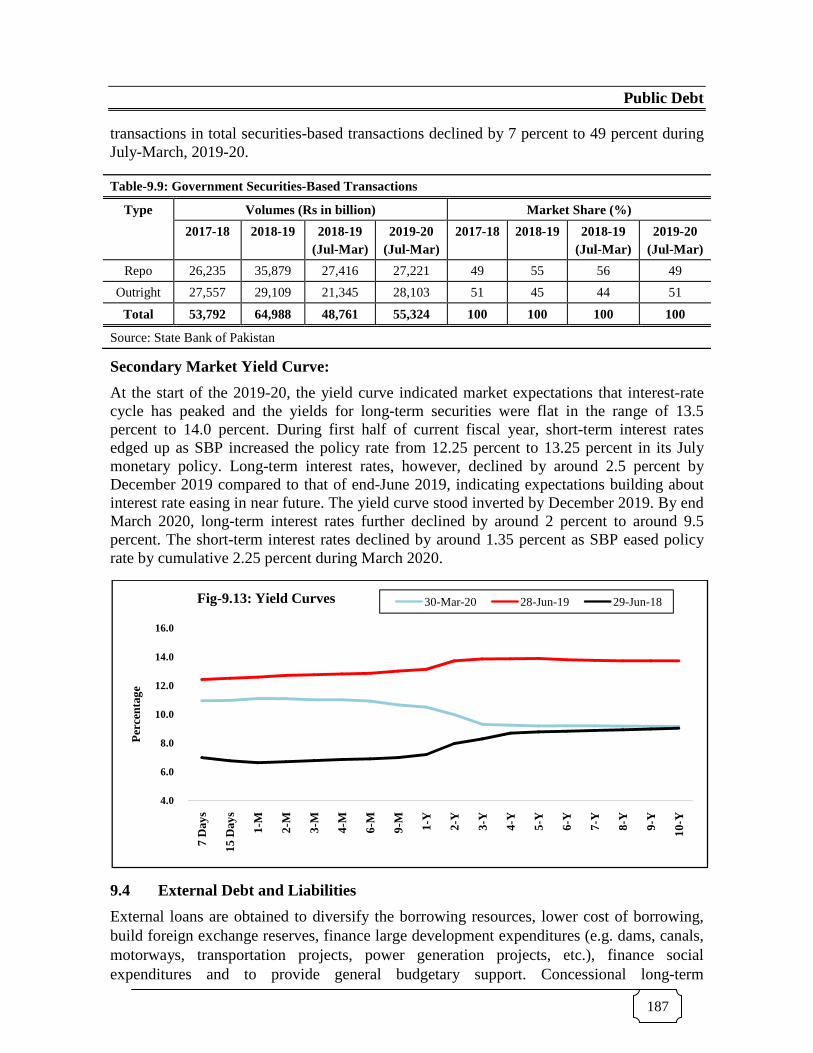
transactions in total securities-based transactions declined by 7 percent to 49 percent during July-March, 2019-20.
Table-9.9: Government Securities-Based Transactions
Type Volumes (Rs in billion) Market Share (%)
2017-18 2018-19 2018-19 (Jul-Mar)
2019-20 (Jul-Mar)
2017-18 2018-19 2018-19 (Jul-Mar)
2019-20 (Jul-Mar)
Repo 26,235 35,879 27,416 27,221 49 55 56 49
Outright 27,557 29,109 21,345 28,103 51 45 44 51
Total 53,792 64,988 48,761 55,324 100 100 100 100
Source: State Bank of Pakistan
Secondary Market Yield Curve:
At the start of the 2019-20, the yield curve indicated market expectations that interest-rate cycle has peaked and the yields for long-term securities were flat in the range of 13.5 percent to 14.0 percent. During first half of current fiscal year, short-term interest rates edged up as SBP increased the policy rate from 12.25 percent to 13.25 percent in its July monetary policy. Long-term interest rates, however, declined by around 2.5 percent by December 2019 compared to that of end-June 2019, indicating expectations building about interest rate easing in near future. The yield curve stood inverted by December 2019. By end March 2020, long-term interest rates further declined by around 2 percent to around 9.5 percent. The short-term interest rates declined by around 1.35 percent as SBP eased policy rate by cumulative 2.25 percent during March 2020.
9.4 External Debt and Liabilities
External loans are obtained to diversify the borrowing resources, lower cost of borrowing, build foreign exchange reserves, finance large development expenditures (e.g. dams, canals, motorways, transportation projects, power generation projects, etc.), finance social expenditures and to provide general budgetary support. Concessional long-term
development loans from bilateral sources and multilateral institutions are particularly attractive because of long repayment periods which are in-line with the long-term economic benefits reaped from the underlying development projects. International borrowing through Eurobond & Commercial banks is also important to establish the credit worthiness of the country in the international markets and to reduce excessive reliance on a few bilateral and multilateral lenders. External borrowing also reduces Government’s reliance on domestic market and prevent crowding-out of the private sector in domestic market.
Pakistan’s External Debt and Liabilities (EDL) represent debt and liabilities of public as well as the private sector. The part of EDL which falls under government domain is debt which is serviced out of consolidated fund and owed to the International Monetary Fund. While the remaining includes liabilities of central bank, debt of public sector entities, private sector and banks.
EDL reached US$ 110 billion by end March 2020, registering an increase of US$ 3.6 billion during first nine months of 2019-20. The main components of this increase were:
� External public debt stock increased by US$ 3.0 billion. This increase reveals the following:
−−−− Debt from multilateral and bilateral sources increased by US$ 2.3 billion. These multilateral and bilateral loans are mostly contracted on concessional terms (low cost and longer tenor);
−−−− The stock of commercial loans/Eurobonds registered a decrease of US$ 0.7 billion;
−−−− Non-resident investment in government securities was recorded at US$ 1.4 billion. It is important to highlight that Government of Pakistan does not have any currency exposure on these securities as these are denominated in Pak Rupee.
� SBP foreign exchange liabilities decreased by US$ 0.6 billion mainly due to repayment of Qatar deposit;
� PSEs debt decreased by US$ 0.5 billion; and
� External borrowing by the private sector is a healthy sign indicating the private sector’s capacity to borrow for local investments. Private sector debt and liabilities increased by US$ 1.7 billion.
Pakistan’s external debt is derived from four key sources, with around 48 percent coming from multilateral loans, 32 percent from bilateral loans, 7 percent from Eurobonds/Sukuk and 14 percent from commercial loans9. Although borrowing from commercial sources has relatively increased during the last few years, multilateral and bilateral sources still cumulatively constitute 79 percent of external public debt portfolio as of end March 2020. These multilateral and bilateral loans are contracted at concessional terms (low cost and longer tenor) and are primarily utilized to address structural issues and promote reforms in the areas of energy, taxation, business, trade, education and others. The following graph summarizes the component wise break-up of external public debt stock:
9 Including Non-Resident investments in domestic government securities
Public Debt
189
Table-9.10: Pakistan’s External Debt and Liabilities (US$ in million) 2015 2016 2017 2018 2019 Mar-20 A. Public External Debt (1+2) 50,964 57,757 62,539 70,237 73,449 76,498 1. Government External Debt 46,861 51,714 56,430 64,142 67,800 70,060 i) Long term (>1 year) 45,849 50,026 55,547 62,525 66,536 67,371 Paris Club 11,664 12,678 11,973 11,643 11,235 10,786 Multilateral 24,262 26,376 27,605 28,102 27,788 28,860 Other Bilateral 4,941 5,445 6,323 8,674 12,717 13,363 Euro/Sukuk Global Bonds 4,550 4,550 4,800 7,300 6,300 5,300 Military Debt 0 0 0 0 0 0 Commercial Loans/Credits 300 882 4,826 6,806 8,470 8,969 Local Currency Securities (PIBs) 32 35 0 0 0 41 Saudi Fund for Development (SFD) 100 60 20 0 0 0 NBP/BOC deposits/PBC* 0 0 0 0 26 52 ii) Short term (<1 year) 1,012 1,688 882 1,617 1,264 2,689 Multilateral 983 1,112 832 961 778 1,058 Local Currency Securities (T-bills) 29 1 51 0 0 1,346 Commercial Loans/Credits 0 575 0 655 486 286 2. From IMF 4,103 6,043 6,109 6,095 5,648 6,438 i) Federal Government 52 0 0 0 0 1,425 ii) Central Bank 4,051 6,043 6,109 6,095 5,648 5,013 B. Foreign Exchange Liabilities 3,709 3,600 3,564 5,121 10,488 9,871 i) Central Bank Deposits 700 700 700 700 6,200 5,700 ii) Foreign Currency Bonds (NHA / NC) 0 0 0 0 0 0 iii) Other Liabilities (SWAP) 1,612 1,507 1,482 3,022 2,912 2,819 iv) Allocation of SDR 1,390 1,383 1,375 1,390 1,374 1,349 v) Non-resident LCY Deposits with Central Bank 7 10 8 9 1 3 C. Public Sector Enterprises (PSEs) 2,482 2,807 2,719 2,671 4,013 3,497 a. Guaranteed Debt 970 1,265 1,214 1,384 2,800 2,639 Paris Club 0 0 0 0 0 0 Multilateral 19 11 6 5 0 0 Other Bilateral 951 1,254 1,208 1,179 2,600 2,499 Commercial Loans 0 0 0 200 200 140
Fig-9.14: Source Wise Profile of External Public Debt
Paris Club Multilateral Other Bilateral Eurobonds/Sukuk/Global Bonds Commercial Loans Non-Resident Investment in Domestic Securities Others
Pakistan Economic Survey 2019-20
190
Table-9.10: Pakistan’s External Debt and Liabilities (US$ in million) 2015 2016 2017 2018 2019 Mar-20 b. Non-Guaranteed debt 1,512 1,541 1,505 1,287 1,213 858 i) Long Term(>1 year) 534 466 403 334 410 519 ii) Short Term (<1 year) 978 1,075 1,102 953 803 340 D. Banks 2,286 2,695 4,522 4,417 4,706 4,668 a. Borrowing 1,334 1,618 3,303 2,967 3,157 2,874 b. Non-resident Deposits (LCY & FCY) 952 1,078 1,220 1,450 1,550 1,794 E. Private Sector 3,011 4,073 6,759 9,195 10,414 11,163 F. Debt Liabilities to Direct Investors - Intercompany Debt
2,717 3,013 3,375 3,597 3,278 4,252
Total External Debt and Liabilities (A+B+C+D+E+F)
65,170 73,945 83,477 95,237 106,349 109,949
P: Provisional *: Pakistan Banao Certificates (PBC) issued by Government of Pakistan for overseas Pakistanis, effective from 4 February 2019. Source: State Bank of Pakistan and Debt Policy Coordination Office, Ministry of Finance
9.4.1 Analysis of External Public Debt Inflows and Outflows
Gross external loan disbursements recorded at US$ 8,017 million during first nine months of 2019-20, the details of which are as follows:
� Disbursements from multilateral sources (including IMF) amounted US$ 4,839 million and accounted for 60 percent of the total disbursements, out of which ADB and IMF were the main contributors. The disbursements from IMF were part of ongoing EFF program while inflows from ADB and other International Financial Institutions (IFIs) were largely targeted towards energy, finance and infrastructure development;
� Disbursements from bilateral sources stood at US$ 1,305 million. Out of this total, disbursements from Saudi Arabia and China were US$ 720 million and US$ 460 million, respectively;
� Commercial loans contributed US$ 1,873 million in external public debt disbursements. These commercial loans were primarily obtained for balance of payments support.
In wake of the outbreak of pandemic COVID-19, Pakistan has secured US$ 1,386 million under IMF’s Rapid Financing Instrument (RFI) facility in order to counter the negative impacts of the outbreak on the economy by increasing social sector spending. The amount was disbursed in April-2020 and further COVID based external inflows are expected from World Bank and ADB during fourth quarter of current fiscal year.
External public debt repayments were recorded at US$ 5,537 million during first nine months of current fiscal year compared with US$ 4,138 million during the same period last year. Repayment of Eurobonds amounting to US$ 1,000 million and higher repayments to the IMF mainly contributed towards this increase in repayments during the period. Interest payments stood at US$ 1,579 million during first nine months of current fiscal year. The source wise details of external public debt inflows and outflows over last few years are depicted in the table below:
Table-9.11: Source Wise External Public Debt Inflows and Outflows (US$ in million)
Multilateral Bilateral Bonds Commercial IMF Total Inflows (A)
Multilateral Bilateral Bonds Commercial IMF Short Term Debt Others Total Repayments (B) Net Inflows (A-B)
Multilateral Bilateral Bonds Commercial IMF Short Term Government Debt Others Total Interest Payments (C) Total Debt Servicing (B+C) Note: Above data excludes disbursements from Pakistangovernment domestic securities Source: Economic Affairs Division and State Bank of Pakistan
The projected external public debt repaymentpresented in the graph below:
-
2,000
4,000
6,000
8,000
Apr-Jun 2020 2020-
Fig 9.15: External Public Debt Repayment Projections (US$ in million)
9.11: Source Wise External Public Debt Inflows and Outflows 2015 2016 2017 2018 2019
Note: Above data excludes disbursements from Pakistan Banao Certificates and non-resident investment in
Source: Economic Affairs Division and State Bank of Pakistan
The projected external public debt repayments based on outstanding at end March 2020
-21 2021-22 2022-23 2023-24
Fig 9.15: External Public Debt Repayment Projections (US$ in million)
Public Debt
191
2020 (Jul - Mar)
2,021 3,396 4,377 1,305
- - 98 1,873
- 1,443 10,496 8,017
1,375 1,149 970 758 ,000 1,000
2,097 1,395 375 538
1,537 697 - -
7,355 5,537 3,140 2,480
440 345 541 465 503 248 412 358 144 122 63 41 0 -
2,103 1,579 9,458 7,116
resident investment in
March 2020 are
2024-25
Fig 9.15: External Public Debt Repayment Projections (US$ in million)
Pakistan Economic Survey 2019-20
192
9.4.2 Impact of Exchange Rate Fluctuations
External loans are contracted in various currencies, however, disbursements are effectively converted into Pak Rupee. Since Pak Rupee is not an internationally traded currency, other international currencies are bought and sold via selling and buying of US Dollar. Hence, the currency exposure of foreign debt originates from two sources: US Dollar/other foreign currencies and Pak Rupee/US Dollar. Thus, any movement in international currencies (in which debt is contracted) and PKR vis-à-vis US Dollar can change the dollar and Pak Rupee value of external debt respectively. While it must be taken into account that domestic debt does not carry currency risk since it is denominated in Pak Rupee.
In addition to net external inflows, following factors influenced the movement in external public debt stock during first nine months of current fiscal year:
� In US Dollar terms, revaluation gain owing to appreciation of US Dollar against other international currencies reduced the external public debt by around US$ 0.8 billion;
� It is important to note that external public debt recorded an increase of 4 percent in US Dollar terms. However, Pak Rupee depreciated by 2 percent against US Dollar during first nine months of current fiscal year, which led to 6 percent increase in external public debt when reported in Pak Rupee terms.
9.4.3 External Debt Sustainability
A country can achieve debt sustainability if it can meet its current and future debt service obligations in a timely manner and has the capacity to withstand macroeconomic shocks. There are two principal indicators or ratios which assess the external debt sustainability: (i) solvency indicators and (ii) liquidity indicators. Solvency indicator such as external debt-to-GDP ratio shows debt-bearing capacity while liquidity indicators such as external debt servicing to foreign exchange earnings ratio shows debt servicing capacity of the country.
Table-9.12: External Public Debt Sustainability Indicators
(In percent) 2014 2015 2016 2017 2018 2019
ED/FEE (times) 1.0 1.0 1.1 1.2 1.3 1.3
ED/FER (times) 3.6 2.7 2.5 2.9 4.3 5.1
ED/GDP (Percentage) 21.1 18.8 20.7 20.5 22.3 26.3
ED Servicing/FEE (Percentage) 11.7 8.5 8.5 12.4 10.8 17.2
FEE: Foreign Exchange Earnings; ED: External Public Debt; FER: Foreign Exchange Reserves Note: The above ratios are calculated based on US Dollar amounts.
Source: Debt Policy Coordination Office, Ministry of Finance
External public debt to GDP ratio increased to 26.3 percent at end June 2019 compared with 22.3 percent at end June 2018, depicting increased external debt burden. Apart from increase in external public debt stock, reduction in GDP size in US Dollar terms contributed towards increase in this ratio. At end March 2019, this ratio increased and recorded at 29 percent primarily due to moderate growth in external public debt and further reduction in GDP size in US Dollar terms.
Public Debt
193
External public debt to foreign exchange reserves ratio increased and recorded at 5.1 times during 2018-19 compared with 4.3 times during 2017-18. Moderate growth in external public debt and depletion of foreign exchange reserves owing to challenging balance of payment situation led to increase in this ratio during 2018-19. This ratio was recorded at 4.5 times at end March 2020 compared with 4.3 times at end March 2019.
Growth in external public debt servicing mainly driven by repayments of Eurobonds and commercial loans outpaced the growth in FEE and accordingly external public debt servicing to foreign exchange earnings ratio increased to 17.2 percent in 2018-19 compared with 10.8 percent in 2017-18. This ratio was recorded at 17 percent during July - March 2020 compared with 14 percent during the same period last year.
Pakistan’s External Debt remains on sustainable path, which has also been endorsed by the IMF. The requirement for external borrowing arises mainly due to the need to maintain adequate foreign exchange reserves in the face of a large current account deficit. During the last two financial years, helped by major exchange rate adjustment and adoption of a market-based exchange rate regime, current account deficit has been substantially reduced, thus lowering the need for external borrowing in future.
9.4.4 Development in International Capital Markets
In the second half of 2019 (July - December 2019), Emerging Market (“EM”) assets experienced a record surge in new issuances and a significant compression in spreads. From September to October 2019, overall EM Sovereign BB/B credits compressed 78 bps on a yield basis, and this trend continued until the end of December 2019, where the yield represented 141 bps compression versus beginning of July levels. These spread levels, paired with historically-low rates that were pushed down by two additional rate cuts by the Federal Reserve in its September and October 2019 meetings, resulted in record-low all-in funding costs for issuers, triggering a boost in primary issuance volumes. September alone saw US$ 89 billion equivalent in EM bond issuances, contributing to a total US$ 314 billion equivalent in EM supply for the period of July to December 2019.
Continued fund flows into the EM asset class during this time supported record new issuance volumes, as investors “hunted for yield” in the low rate environment. As a result, total fund flows for 2019 stood strongly positive at US$ 33 billion net inflow, compared to a net outflow of US$ 8 billion for 2018.
While Pakistan’s outstanding bonds experienced some volatility at the beginning of the July to December 2019 period, they followed the tightening trend of the market, seeing 50 bps tightening from July to December 2019. This tightening was largely supported by Moody’s upgrade of outlook from Negative to Stable on 2nd December 2019. From 1st December till the end of the year alone, Pakistan’s curve compressed by 41 bps.
The first two months of 2020 continued the key trends of 2019, being characterized by low rates, compressed spreads and robust EM primary activity. Even with US-Iran tensions and initial news of the spread of COVID-19 weighing on equity markets, credit market activity remained robust, with January 2020 the most active month on record for Emerging Markets in terms of primary issuance activity (US$ 114 billion equivalent issued, 1.9 times January 2019). Pakistan’s outstanding bonds outperformed the wider EM Sovereign BB/B space,
Pakistan Economic Survey 2019-20
194
with 73 bps tightening on a yield basis and 44 bps tightening on a spread basis across its curve. It was at the beginning of March that credit markets began to feel the first bouts of COVID-19 induced volatility, as the spread of the virus escalated into a global pandemic affecting production and economic activity.
On the back of this exponential rise, multiple economies geographically far from China (such as Italy) began to introduce lockdowns. Concerned about the impact of these developments on global economic growth, investors began a flight to quality: 10-year US Treasury yields dropped below 1 percent for the first time ever, tightening 53 bps over a week to an all-time historic low of 0.6226 percent on March 9th 2020, primarily on the back of the Fed’s surprise emergency rate cut of 50 bps on March 3rd, 2020. With another emergency rate cut (this time of 100 bps) from the Fed on March 16th 2020, the key policy rate was brought to near 0 percent and 10-year US Treasury yields remained compressed until the end of March, ending the month at 0.716 percent.
Credit spreads experienced record widening especially in Emerging Markets: the EMBI+ Index widened 84 bps in the first week of March and reached its highest level since 2009 at 641 bps by 23rd March 2020. EM B/BB Sovereigns saw 4 percent widening on a yield basis through the month of March. Pakistan’s own bonds saw 520 bps widening on a spread basis through the month of March, however, only around 4.75 percent widening on a yield basis, given the underlying rates rally.
Oil prices saw an unprecedented fall, as markets became increasingly concerned about how global energy demand would be affected by the shutdown of the world’s largest oil importer (China), the subsequent lockdown of other major economies across the world and an increasing level of global travel restrictions. At the same time, OPEC+ countries appeared to be struggling to come to an agreement on production cuts, putting further downward pressure on oil prices: Brent Crude oil prices dropped US$ 29/bbl (-56 percent) in March to US$ 23/bbl, the lowest level since the end of 2001.
As a result of these unfavourable movements across indicators, investors took a risk-off stance leading to substantial outflows from EM funds: the first 3 weeks of March saw US$ 30 billion outflows from EM funds, erasing and surpassing inflows seen earlier this year.
Given the overall risk-off mood and negative fund flows, and despite all-in yields remaining relatively less affected due to the underlying rate rally, EM primary markets were shut for the better part of March: between 5th and 12th March, no transaction was carried out and thereafter only IG-rated EM sovereigns accessed the markets with new issue concessions as high as 75 bps. Total EM issuances (excluding China) for March 2020 came to US$ 12.5 billion, 78 percent down versus March 2019. However, due to the record issuance levels in January and February, YTD volumes of US$ 131 billion for EM (excluding China) were still 9 percent ahead of 2019 YTD.
As investors and issuers began to take confidence in the containment measures implemented by global economies and the fiscal as well as monetary policy measures announced by central banks such as the Fed, market conditions began to improve gradually towards the end of March. Taking advantage of this window of relatively constructive markets, US IG issuers issued US$ 112 billion in the week ending 27th March, making it the largest week on
Public Debt
195
record at the time, and March and Q1 2020 the largest month and quarter on record respectively.
Emerging Market (“EM”) Credit
While EM primary markets are still only seeing high-rated sovereigns access the market, new issue concessions are becoming increasingly compressed (44 bps for April’s deals) and order books are multiple times oversubscribed (Saudi Arabia’s recent US$ 7 billion 3-tranche offering amassed 7.7 times oversubscribed order book).
As market conditions continue to improve and May lockdown removal in key economies likely being a source of further optimism, an increasing variety of issuers may be expected to access primary markets, potentially going down the rating grid and moving towards Corporate and Financial Institutions.
Table-9.13: Pakistan Sovereign Bonds - Secondary Trading Levels Bond Ratings Maturity Size Coupon
Government is committed to gradually bring the fiscal deficit down to lower levels once exogenous shock created by COVID-19 crisis is contained. Government will continue to implement growth-friendly inclusive policies and structural reforms to boost potential growth while strengthening social safety nets. Furthermore, envisaged medium-term fiscal consolidation will place public debt on firm downward trajectory, while government’s efforts to improve maturity structure will enhance public debt sustainability.
Going forward, following are the main priorities with respect to public debt management over the medium term:
� Lengthening of maturity profile of domestic debt by mobilizing financing from medium and longer tenor instruments will remain priority to reduce the re-financing and interest rate risks of domestic debt portfolio;
� Government aims to have a smooth redemption profile of its debt portfolio whereby constant proportion of the debt shall be redeemed each year to reduce the risk of refinancing the debt at a time when market conditions are unfavourable;
� Transparency in domestic securities issuance process will be enhanced by providing clear information on borrowing program to investors and having continuous investor interaction and appropriate consultation;
Pakistan Economic Survey 2019-20
196
� Government priority is to borrow through multiple instruments in order to lower its borrowing costs and manage the fiscal risks arising out of the borrowing operations. Lenders/investors, on the other hand, will have more options to choose investments which are closer to their investment horizons, income preferences and risk appetite. It will also help in expanding and diversifying the investor base of government securities, deepening of capital markets and promotion of a saving culture in the country;
� In order to support the budgetary position and promote Islamic banking industry in the country, government intends to issue Sukuks in the domestic capital market on regular basis over the medium-term. Sukuks are expected to be issued at competitive price due to its asset backed structure while attracting diversified investor base, in particular financiers preferring Shariah-compliant investments;
� Government will continue to avail maximum available concessional external financing from bilateral and multilateral development partners to benefit from favorable terms and conditions;
� Government will also diversify its sources of external borrowing, by accessing international capital markets by way of issuing Eurobonds, Pakistan International Sukuk, Panda Bonds etc.