An evaluation, investigation and recording of the design and implementation of the Cost-based and Tariff Design training programme to align Eskom Distribution for EDI restructuring By Lerato Legoete Bachelor of Science Honours (TJCT) This Dissertation is submitted to the University of Kwazulu Natal in partial fulfillment of the requirements for the Degree in Masters of Commerce Degree For the University of Kwazulu Natal Faculty of Commerce at the Leadership Centre Produced for The Electricity Pricing Department, Distribution Group, Eskom December 2005 096499
Transcript
An evaluation, investigation and recording of the design and
implementation of the Cost-based and Tariff Design training
programme to align Eskom Distribution for EDI restructuring
By
Lerato Legoete
Bachelor of Science Honours (TJCT)
This Dissertation is submitted to the University of Kwazulu Natal in partial
fulfillment of the requirements for the Degree in
Masters of Commerce Degree
For the
University of Kwazulu Natal
Faculty of Commerce at the Leadership Centre
Produced for
The Electricity Pricing Department, Distribution Group, Eskom
December 2005
096499
ABSTRACT
The South African Electricity Supply Industry (ESI) has been, over much of the last
century, dominated by Eskom, a large and powerful state-owned, vertically-integrated
monopoly. It produces 97 % of the electricity generated in the country and that
represents almost 60% of the electricity generated on the entire continent of Africa.
However, recent studies of the company's performance have lead to a decision to
reorganize the industry due to the realization of poor investment decisions made in the
past, which resulted in massive costs to the company.
The distribution business in the industry has been hugely affected by these past
inconsistencies, thus in line with global trends and escalating problems, the South
African Cabinet approved the restructuring of the Electricity Distribution Industry
(EDI) in nineteen ninety eight, ahead of restructuring of the entire Electricity Supply
Industry (ESI). There is currently a large number of municipalities plus Eskom in
South Africa supplying electricity to consumers - leading to disparities in tariffs and
prices. To resolve these issues, has accepted a proposal that Eskom and municipalities
amalgamate to form six independent, financially viable Regional Electricity
Distributors (REDs).
It is no secret that electricity in South Africa has consistently been amongst the
cheapest in the world. This is credited to two principles; an abundant reserve of cheap
coal resulting in economical production of electricity; and, the fact that there is still a
number of citizens with no access to electricity. This is a concern for the Electricity
Pricing sector now faced with the task to rationalise the price inequalities in the
distribution business to be fair and equitable to all customers. The Eskom Distribution
Electricity Pricing team is currently undertaking the Cost-based Tariff Design project
to address tariff objectives such as; cost reflectivity and transparency. The
Competency Building phase within this project affords potential future RED staff
members opportunities to learn a broad overview about designing tariffs. This
dissertation will report on, dissect, analyze and discuss results, and recommend the
probable future of the project in light of the dynamic nature of the developments in
the EDI restructuring process.
ii
ACKNOWLEDGEMENTS
I would like to acknowledge the work done by the Eskom Distribution Electricity Pricing
project team, which came up with the entire Tariff Design and Cost-based Design project.
The team provided intellectual property, while they were busy with Tariff Design
workshop-training courses countrywide. The project team members were as follows;
Deon Conradie, Adriaan de Kok, Robert Smith and Philip Marais. A special mention to
Adriaan De Kok for his supervisory efforts in terms of editing of my documents,
information sharing and supplying me with constructive feedback. A big thank you to
Thembi Makhubu for all her organizational skills and support.
1 would also like to thank Shirley Salvoldi for her mentoring, information sharing,
patience, encouragement and understanding during this time period.
I would also like to acknowledge Ken Hall for his support, supervision, encouragement
and his guidance and mentorship throughout my "life in Eskom".
I would like to thank my family and for their support and consistent show of love and
understanding.
Thanks to my unborn child and my inspiration, Gomolemo for enduring the long hours of
1.3.1 Specific problem manifestation 15 1.3.2 The Tariff Design Project 20
1.4 Comprehensive problem statement 25 2. CHAPTER 2: LITERATURE REVIEW 27
2.1. Introduction 27 2.2. A look at the electricity supply industry (world wide) 29 2.3. Regulation of Electricity 30 2.4. The History of Electricity Regulation 32 2.5. Electricity Markets in Developing Countries and the need for Restructuring 33 2.6. A Natural Monopoly 36 2.7. The Introduction of Competition in the Production of Electricity 37 2.8. An Overview of Reform Proposals 40
2.8.1. Experiments in Deregulated Wholesaling 40 2.8.2. Reform by Restructuring 41 2.8.3. Total Deregulation 41
2.9. The UK Electricity Industry 42 2.9.1. Structure of the UK industry: 44 2.9.2. Impact of competition on UK customers 45
2.10. Restructuring New Hampshire's Electric Utility Industry 48 2.11. Restructuring In Developing Countries 49
2.11.1. "Restructuring eventually leads to Privatization" 50 2.12. The history of the reformation of the South African Electricity Supply Industry and Electricity Distribution Industry 51 2.13. The History of Electricity Tariffs in the South African context: 55
2.13.1. Review of Electricity Tariffs 56 2.13.2. Objectives of Tariffs 57 2.13.3. Policy making approach 58
2.14. Conclusion/ Way Forward 59 3. CHAPTER 3: RESEARCH METHODOLOGY 62
3.1. Title 62 3.2. Background 62 3.3. Scope of this research project 63 3.4. Out of Scope 63 3.5. Introduction 63 3.6. The South African Electricity Sector 68 3.7. The EDI-past, present and the future 69 3.8. "The EDI Challenges - the drive for the South African restructuring" 70 3.9. Electricity Distribution industry and its relation to Electricity Pricing 72 3.10. Tariff Alignment and Cost-based Design (pilot) Project - Pricing perspective 74
3.10.1. Project Background and introduction: 74 3.10.2. Rationale for information sharing 76 3.10.3. Summary of all Tariff Alignment Project Phases (pilot) 76 3.10.4. The Scope of the Project implementation: 81
iv
3.10.5. The training team: 81 3.10.6. Assumptions by the Project team (core pricing team): 82 3.10.7. The target audience: 82 3.10.8. Regional Responsibilities with regard to project: 82
3.11. Future Tariff Structures 83 3.12. COMPETENCY BUILDING PHASE (phase 1) 85 3.13. The Tariff Alignment and Cost Based Design Course 85
3.13.1. Background on the course 85 3.13.2. Hypothesis of the Tariff Design Course 87 3.13.3. The simulation programme 88 3.13.4. Student motivation 90 3.13.5. The testing of the intervention and implementation 91 3.13.6. Progress to date and outcomes 91
3.14. Evaluation of the research methodology 91 3.14.1. Data collection approach 91 3.14.2. Evaluation Strategies and reason for the use of a particular methodology 93 3.14.3. Sample size 95
4. CHAPTER 4: ANALYSIS OF RESULTS AND DISCUSSION 97 4.1. The results 97
4.1.1. Attendance of the sample/targeted audience 97 4.1.2. Feedback from delegates: 97 4.1.3. Delegates pledges to improve in their workplace 100 4.1.4. Future possibilities to address concerns 101 4.1.5. The learning outcomes that evolved as the workshops progressed 102
4.2. Discussion Overview 102 4.3. Discussion on Workshop Feedback 103 4.4. A look at the "training team" and reasons for their success 104 4.5. Response to the Negative Feedback Queries 105 4.6. The overall learning experience as an Organisational Development exercise 107 4.7. Discussion on the success of the workshops 109 4.8. Discussion on the workshops, the project and the EDI intent 114 4.9. Financial impact and justification on the REDs: 125
5. CHAPTER 5: CONCLUSION AND RECOMMENDATION 131 5.1. The future tariff design candidate 131 5.2. What Is The Future For The Tariff Alignment Course? 134
5.2.1. What will happen specifically with the training sessions? 134 6. REFERENCES 138 7. ANNEXURE 144
Annexure A: A comparison of electricity price levels worldwide 145 Annexure B: Tariff Alignment and Cost-based Design Project plan 146 Annexure C: Process Guide for the product process within pricing objectives 148 Annexure D: SIMULATION OVERVIEW: A LOOK AT THE APPEARANCE OF THE COMPUTER BASED COURSE 151 Annexure E: TARIFF DESIGN SIMULATION MODEL 154 Annexure F: Feedback Evaluation forms 157
v
List of figures illustrated
Figure 1: High-level processes of the People stream of Programme 726 8 Figure 2: The Competency Building sub-stream high-level plan with regard to the current project
phase (source: CB sub-stream presentations, 2004) 11 Figure 3: Depicts the overview of the current structure of Eskom's supply chain 17 Figure 4: Depicts the Supply Chain in Eskom (source: Salvoldi, 2001) 18 Figure 5: Current Tariff Structures in the Industry (source: Conradie, March 2005) 19 Figure 6: Depicts the proper way in which costs should be allocated according to the NRS058
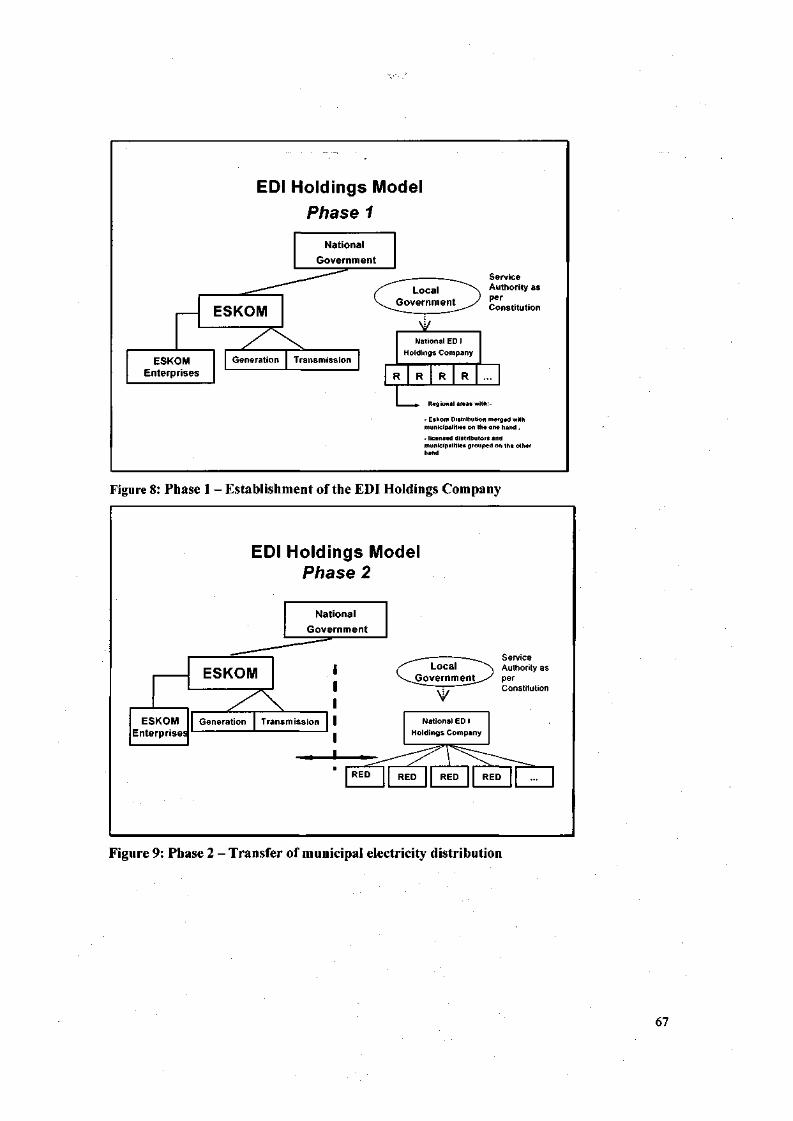
document 23 Figure 7: Tariff Alignment and Cost-based Design Project phases 24 Figure 8: Phase 1 -Establishment of the EDI Holdings Company 67 Figure 9: Phase 2 -Transfer of municipal electricity distribution 67 Figure 10: Phase 3 - Depicts the possibility of the disbandment of the EDI Holdings Company in
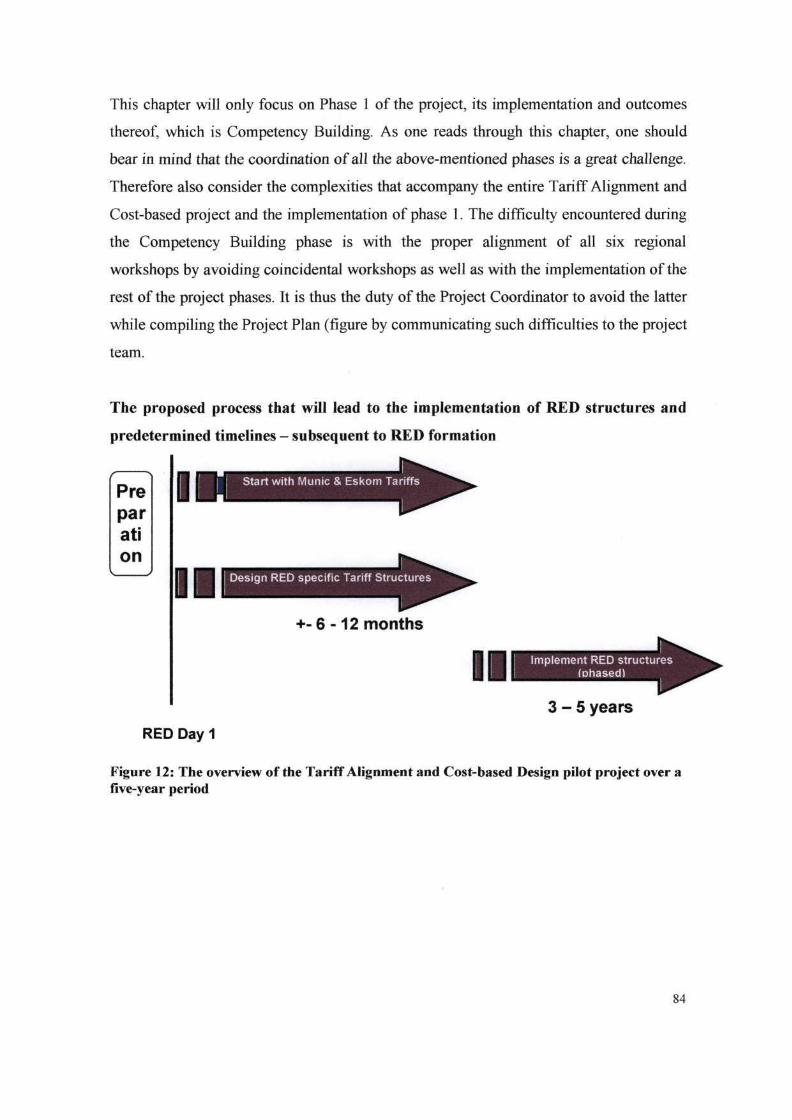
the future followed by the formation of REDs 68 Figure 11: Tariff Alignment and Cost-based Design pilot project overview 78 Figure 12: The overview of the Tariff Alignment and Cost-based Design pilot project over a five-
year period 84 Figure 13: High level Tariff Design Programme - utilized in the Cost-based tariff design Courses
via simulation 89 Figure 15: Depicts the comparison of electricity prices around the world. Taken from Espinheira's
article for ESI Africa Magazine in 2003 127 Figure 16: Depicts the comparison of the actual average cost to Eskom in supplying its customer
(source: Student Manual) 151 Figure 20: Depicts the three most important data needed to put together the pieces for tariff
design (source: Student Manual) 152 Figure 21: Depicts the overview of all phases involved in tariff design ultimately ending with
the final product - the tariff (source: Student Manual) 153 Figure 22: An example of an Income Statement necessary at the beginning of any tariff design
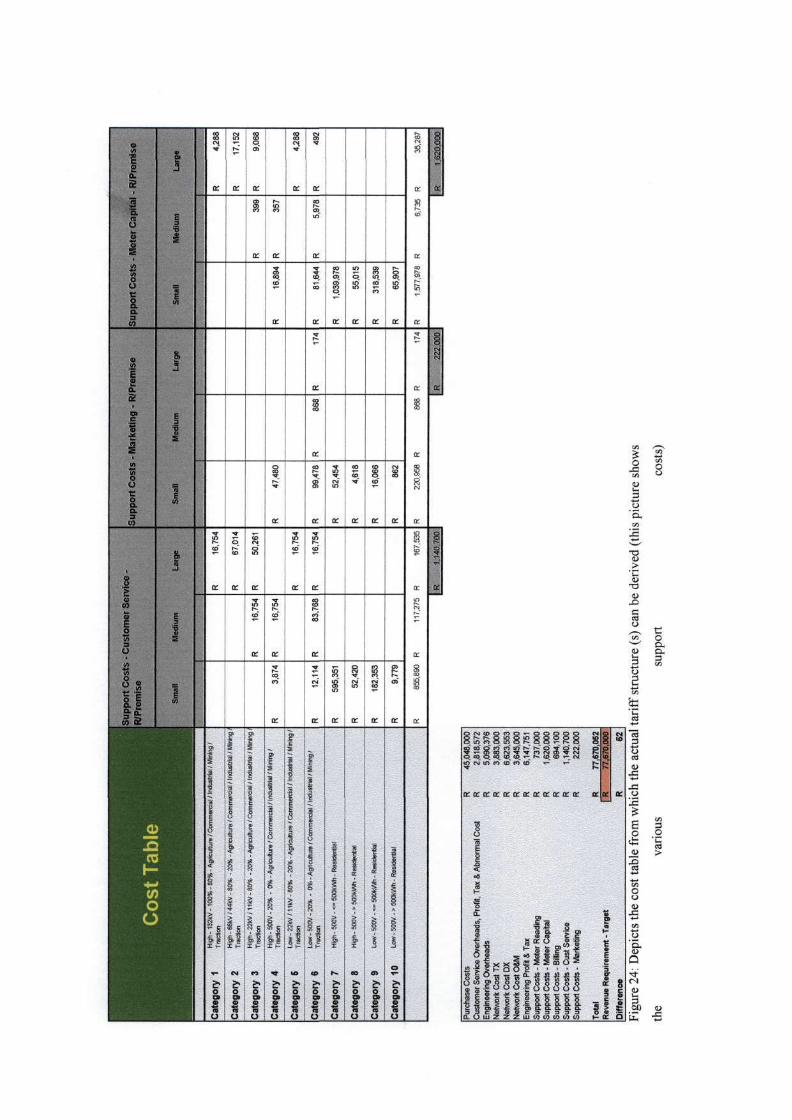
shows the purchase & network costs against different customer categories/ voltage levels) 155 Figure 24: Depicts the cost table from which the actual tariff structure (s) can be derived (this picture shows
Forecasting (FC), Electricity Special Pricing (ESP) and Electricity Trading (ET). At this
point she then joined Programme 726 Competency Building team at the Eskom College
in Midrand (see Project Environment Background). In this project her role included
designing, sourcing and implementing competencies (workshops, courses, training) and
also liaison with all stakeholders (target audience(s) and facilitators/trainers) - see the
above Figure 2. During this year she also enrolled for the MComm, Masters in Strategic
Leadership and Project Management, which has brought about this research topic.
Currently, she now forms part of the Head Office Electricity Pricing department assisting
with certain outputs such as implementing and managing pricing projects and developing
and maintaining training material. Her major role in this department is to project manage
the implementation of the "Cost Based Tariff Design" project. This project is in place to
create awareness in REDs, on Pricing and Tariffs while building capacity through
knowledge transfer in regions by designing their own tariffs.
12
1.3 General problem context
Currently Eskom Distribution is preparing itself to merge with Municipalities and Metros
to form Regional Electricity Distributors (REDs) that will be pooled entities providing
energy services to customers. There are a lot of complexities in this system, because the
government (Department of Minerals and Energy) has constituted that these entities form
by end of 2007 and they would later operate in a competitive market where customers
will be able to choose where to buy their energy/ electricity, i.e. as privatized entities.
Recently, the Eskom Distribution Electricity Pricing department approached the
Competency Building team for extensive assistance with the "Cost-based Tariff Design"
project that is run by their department. The problem identified by this department is
regarding the tariff structures that will be adopted in the future REDs. This is seen as an
issue as each region (once a RED has formed) needs to submit a tariff plan to the
regulator. This was previously done at Head Office for the whole of Eskom Distribution
business. In the pricing context, privatization means liberalization, that is, to unbundle the
current electricity costs and sales via the number of sellers to distributors and end users at
market based costs with innovative pricing options (Salvodi, 2005). Thus price and
competition are vital in establishing an effective (future) market (Salvodi, 2005).
In search for global alignment, Eskom Distribution has proposed competition amongst
the future REDs. Therefore an analysis of the rationale of this restructuring process (from
a pricing perspective) should enlighten the concerns of the different stakeholders. This
will require concentration on the project feasibility particularly in Pricing and how
entities with such different policies and procedures would survive the merger as well as
how this would affect the employees at the bottom of the "food chain"?
The stakeholders include the Government (Department of Minerals and Energy), EDI
Holdings, The National Electricity Regulator, labour representatives from Eskom
(Distribution, Transmission, Generation) and Municipalities. One foresees the following
concerns raised by some of the stakeholders:
13
• What about those with no tertiary qualifications?
• How will staff and skills be transferred to the REDs?
• Will there be a duplication of jobs and competencies in the new REDs?
• What will eventually happen to Distribution, will it be completely separated from
Eskom?
• Will the REDs be governed under the Municipal or Public Act?
This research will not attempt to answer all the above questions but to focus on building
capacity in terms of tariff design. This should probably enlighten the reader and build
confidence on the efforts in place to ensure proper establishment of future RED tariff
structures.
The complexity of the overall Programme 726 project deepens on a daily basis with
constant scope changes, for instance the current stance (although not official) is that
Eskom Distribution will initially have an operating agreement relationship with the RED.
This means that less than ten percent of Distribution staff will be seconded to the REDs.
Thus the project team faces scope changes of the expected outputs, as this is a very
political project with constant changes from the Government. At this rate one might be
under the impression that the Government is thus delaying RED formation considering
the pressing timelines.
The latter example is just one of the hiccups delaying the process which will ultimately
take place, even in a decade. According to De Kok (2003) from the Distribution
Electricity Pricing department, "if Distribution moves out of Eskom into REDs, it will act
as an agent for Eskom regional tariffs". Alternatively, if not, Due diligence exercise will
be necessary to ensure proper transfer of assets and people although it will take another
18 months to transfer all Distribution staff members. "However, tariff structures will have
the same principles no matter what direction the future REDs will ultimately take" (De
Kok, 2003).
14
1.3.1 Specific problem manifestation
To expand on the problem raised above, at this point there are multitudes of tariffs for
Eskom and local authority distributors' customers and this has to be rationalised,
anticipating the competitive market that the REDS are moving towards. The issue here is
how to move everyone to the ultimate tariffs? The following key issues regarding tariff
rationalization will unfold and be discussed; cost reflectivity, data (customer, network,
financial), legislation, customer needs and social obligations of Eskom Distribution, the
billing system and a brief look at the future tariff structures as discussed by my
colleagues in the pricing department.
The EDI restructuring model aims to eventually move Eskom from a monopoly to full
wholesale and retail competition (Salvodi, 2001; Mountain, 1994). This restructuring
model is applicable to the whole ESI and EDI but affects Eskom largely because it is the
biggest energy producing entity in Africa. The current stance in Eskom is a vertically
integrated utility where electricity is transferred (using transfer pricing mechanism) from
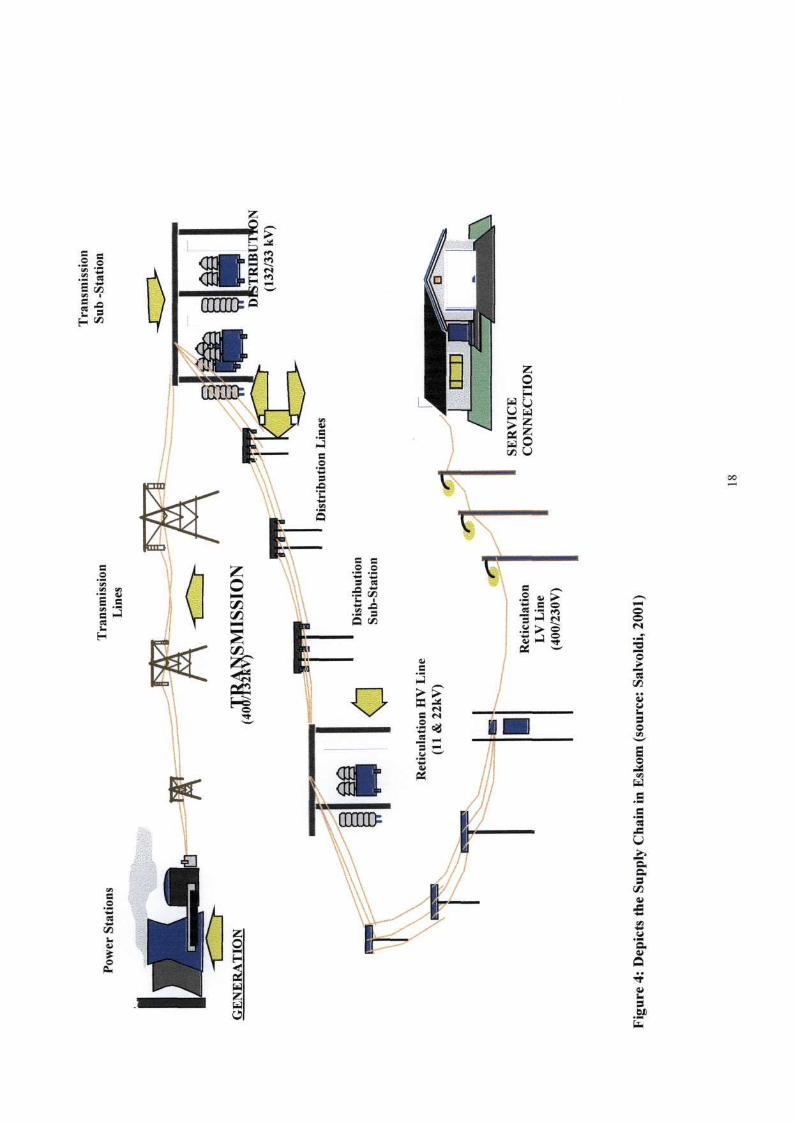
Generators - to - Transmitters - to - Distributors. The latter thus summarizes the supply
chain in Eskom and the three most valuable groups that are interdependent on each other
(see figures 3 & 4). Distribution is the largest group in Eskom (constituting the bulk of
Eskom employees) and privileged to liaison directly with the electricity end users (3.5
million customers) by providing services such as meter reading and billing. Distribution
has contracts with Transmission and Generations and thus sells its energy to the local
authorities who in turn sell to their customers (see figures 3, 4 & 5). For this reason,
although only Distribution is being restructured, it is clear that this restructuring process
will affect the other two groups as well. However, this research will only concentrate on
the implications of the restructuring process on Distribution.
Following the above arguments, costs are passed down the supply chain (as depicted in
the figures). According to Salvodi (2001), in order for Eskom to enter into the future
REDs, the way in which electricity is priced in Eskom has to change. The current tariff
structure (Figure 5) need to be modified to suit future tariff applications. Figure 5 shows
15
that Eskom currently has national tariffs with all prices to customers for a specific tariff
the same across the country where, Municipalities have their own tariff structures that are
not aligned to Eskom's tariffs in terms of levels and structures (Conradie, 2005). This
way of bundling tariffs together (without specification) should no longer be acceptable as
the future tariffs need to be cost reflective (Salvodi, 2005; DME, 1998). The Tariff
Alignment and Cost-based Design project is thus aimed to produce a framework of what
tariffs should look like in future, with the guidance of the NER framework. Thus
rationalization and convergence of tariffs means moving towards the same: tariff
categories/classes/segments, tariff structures, chargeable tariff components, and pricing
levels (Conradie, 2005). This research will thus pave the way to the realization of the
ultimate tariffs that will be approved and easily regulated by the regulator.
16
GE
NE
RA
TIO
N—
Geo
eral
oj
Gen
erat
or
Ger
a G
ener
1 fe^
fe
^ C
ontra
ct fo
r E
nerg
y
7igur
e 3:
Dep
icts
the
ove
rvie
w o
f th
e cu
rren
t str
uctu
re o
f1 Esk
om's
supp
ly c
hain
17
Pow
er S
tati
ons
Tra
nsm
issi
on
Lin
es
GE
NE
RA
TIO
N
(40i
J M^
SMIS
SIO
N
0 D
istr
ibut
ion
Sub
-Sta
tion
Ret
icul
atio
n H
V L
ine
(11
& 2
2kV
)
'
Ret
icul
atio
n L
V L
ine
(400
/230
V)
Fig
ure
4:
Dep
icts
th
e S
up
ply
Ch
ain
in E
sko
m (
sou
rce:
Sal
vold
i, 2
001)
Tra
nsm
issi
on
Sub
-S
tati
on
DIS
TR
IBU
TIO
N
(132
/33
kV)
Dis
trib
utio
n L
ines
/""
SE
RV
ICE
C
ON
NE
CT
ION
18
Esk
om D
x
Esk
om C
usto
mer
Cat
egor
ies
Cus
tom
er C
ateg
orie
s M
unic
ipal
Tar
iff S
truc
ture
s x
n
Fig
ure
5: C
urr
ent
Tar
iff
Str
uctu
res
in t
he I
ndus
try
(sou
rce:
Con
radi
e, M
arch
200
5)
19
1.3.2 The Tariff Alignment and Cost-based Design Project
The above discussion explains clearly the problems facing the pricing department due to
the restructuring process. Currently Eskom's tariffs are set according to; whether the
supply is classified as urban, rural or residential, what the supply will be used for or size
of the supply.
Discussions on the approach that tariffs will take in RED day one was around the
following issues, whether to;
• adopt a set of new retail tariffs, or
• continue with existing tariffs and transform over time or utilise a combination of
above.
Following this, the official stance from the NER is that the approach should be to start
with the existing tariff arrangements on RED day one. This decision was taken due to the
following; uncertainties & inaccuracies in RED info (e.g. costs/customer data) create
very high financial risks, time to perform cost of supply studies, develop tariff models,
approval & implementation (metering & billing systems) and the fact that Municipalities
are unfamiliar with Rate of Return regulation. These issues will thus form the bulk of the
discussions in this research. Developing new tariffs require detail and accurate data sets
about customers, assets, costs and models. In other words new tariffs must be based on a
comprehensive Cost of Supply study and analysis which will lead to cost reflective
tariffs.
From the above discussion, the pricing sector maintains that the rationalization and
liberalization of tariffs need to be in place in order for future REDs to be sustainable in
the industry. This became the key issue following a study of the retail environment, hence
the need to focus on empowering regions with the ability to design tariffs prior to RED
formation. This project is currently of high priority for the Distribution Electricity Pricing
department as each region will have to produce a tariff plan as soon as it becomes a RED
(within six months), only then can tariff implementation occur. With that, the
20
accountability that regions will have will be expanded to their tariff structures,
purchasing contracts and sales/load/price forecasting. The focus of this project is to
ultimately equip that each region develop a RED tariff restructuring plan that will consist
of: Cost of supply studies per RED, RED tariffs design, and implementation of tariffs
according to the RED Tariff Restructuring Plan as approved by the NER. This is thus a
benchmark project that will benefit of the entire EDI and is driven by EDI Holdings and
supported by the NER.
The project has five phases with two components; the "Competency Building"
component (phase 1) - empowering pricing staff to have Cost of Supply and Tariff
Design competencies necessary for future REDs and the second component "RED Tariff
Design and Implementation" (phase 2 - 5) - concentrating on tariff design within the
REDs as well as implementation. Refer to figure 7.
This research will only concentrate on the first component - Competency Building. This
component has five steps, which have to be delivered before RED formation. Currently
the project has only progressed to step two for most regions and Municipalities. The five
steps of the process include;
1. Understanding the EDI (Eskom & Municipalities)
2. Introducing tariff simulation and Workshop interventions
3. Data collection and purification
4. Cost of Supply Study
5. Tariff Design
According to Conradie's presentation (2005), the following high-level outputs are
expected in the regions after the capacity building project (see figures 7);
• The understanding of regional and metro (RED) revenue requirements - including
current cross - subsidization
• The agreement on a tariff structural framework should be reached between EDI
Holdings/NER
o Define appropriate tariff classes and the chargeable components
21
o To agree tariff setting principles
• Obtain a decision re Residential tariffs and determine the implications
• Decide how Distribution-use-of-systems will be charged for in the REDs - EDI
Holdings/NER
• To provide a requirement specification of what is needed in terms of data
sourcing
• Design and test tariffs during the first year to 18 months
• Develop a strategic pricing direction for each RED
o Develop Tariff Restructuring & Implementation Plan
o Develop phasing plans for introducing tariff changes
The Competency Building component will thus equip all potential RED pricing staff
(Eskom, Municipalities, Metros) to have detailed understanding and confidence in
designing their own (entity) tariffs. Having acquired such skills, one is ready to move on
to the second project component which will entail the following steps;
• Data gathering and Amalgamation of REDS,
• Customer Classification for REDS,
• Cost of Supply Study for RED, Tariff Design and
• Rationalization of Tariffs for RED Tariffs
At the end of this component each RED should have a tariff plan and design in place
(ultimate tariff structure) for submission at the regulator. It is hoped that cost allocation
will thus be done according to figure 6 below...
22
The cost allocation done
Electricity supply costs unbundled to reflect energy, transmission and
distribution businesses.
Costs segmented into categories
Assign charges based on the unbundled costs and the nature of these costs
drivers(R/kVA, c/kWh and R/customer
Figure 6: Depicts the proper way in which costs should be allocated according to the NRS058 document
23
• P
roje
ct L
aunc
h
Fig
ure
7: T
arif
f A
lign
men
t an
d C
ost-
base
d D
esig
n P
roje
ct p
hase
s
Dat
a G
athe
ring
and
Cos
ting
Rat
e D
esig
n
1.4 Comprehensive problem statement
The purpose of this study is to describe the Competency Building component of the
Tariff Alignment and Cost-based Design project aimed at transferring Cost of
Supply and Tariff Design skills to future RED staff while exploring the rationale of
the Electricity Distribution Industry Restructuring model currently being used in
Eskom Distribution and its appropriateness from the perspectives of the different
stakeholders.
The discussion so far clearly reveals that this research will be Action Research, that is,
conversation with the author. As the author is involved in the project itself, one would
most likely occasionally discuss the project from a biased point of view as she relates
to the target audience (McNiff, 2000). The nature of knowledge immediately follows
on from action research. The type of knowledge that is expected to be gained here is
Procedural or Know-how knowledge. They underpin training and development in
which know-how is transmitted as skills for jobs; and they reinforce transactional
forms of communication which codify knowledge as systems to be learnt within a
company ethic of master craftsman and apprentice (McNiff, 2000).
The latter statement captured by McNiff (2000) summarises the essence of this project
and its proposed achievements and outputs. That is, to expose all pricing employees
or potential future RED employees with the high-level principles of tariff design. This
will in turn equip individuals with information and to experience the Tariff design
simulation model to be able to design their own tariffs in future REDS. To sum up
this point on McNiff s (2000) account about skills transfer that, "knowing how to
access and use information and how to use electronic systems" will be an indication
that skills have been transferred to the next person. Howver, in this instance, the
project team is hoping for future REDs to delivery their own tariff structures in the
next five years, this will prove the success of the Cost-based and Tariff Design
project.
Although the research will be action-orientated, it will also be qualitative, "the
methodology of an emerging design based on experiences of individuals in a natural
25
setting" (Creswell, 1994; Creswell, 2003; Merriam, 1988). That is, this research will
be based on emerging aspects and development of the above-mentioned project in the
Eskom Distribution Electricity pricing department. The research will not be a mixed
method approach as one will not dwell too much on the actual cost of supply studies
which entails utilizing statistical analysis on the excel system. However, both
approaches will give one a holistic view of the "rationalization" of tariff structures in
future REDs. To be more specific surveys and interviews will be conducted with the
relevant audience that stem from the various stakeholder groups affected by the
project.
Looking at the problem context and the grouping of Systems Methodologies, it is
plain that this is research will take a soft systems approach because of all the
uncertainties with the current transformation process - these dynamics already
discussed. The analysis of the system holistically with its tribulations has revealed
much complexity seeing there are a lot of stakeholders affected by the bigger project
(EDI restructuring) and the future success depends on the relationship between the
different stakeholders (who have to get buy-in). It is thus appropriate to consider that
the Systems methodology in this research is Complex-Pluralist.
This approach will assist the writer to identify and understand the system that is of
focus, in the context of this environment. This is to further understand the nature and
problem of the system in hope to resolve the problem or at least get to the gist of the
problem to be able to recommend. From the latter discussions, one picks up that the
planning process of the project will be an interactive one and it is visibly a soft
systems approach (Flood & Jackson, 1991; Gill & Johnson, 2002). The aim here is to
start with a problem situation that is unstructured (Flood & Jackson, 1991; Gill &
Johnson, 2002), that is, the lack of tariff design knowledge in the regional pricing
department. This problem needs to be addressed and curbed within a certain time
period (before RED amalgamation) with the hope that support will be consistent from
other departments (CB stream of 726) and other stakeholders that this project is
dependent on the success of this project ultimately affecting the success of the future
REDS and their ability to handle their tariff structures, purchasing of their own
contracts and forecasting of the sales and prices.
26
2. CHAPTER 2: LITERATURE REVIEW
2.1. Introduction
The electricity sector is one of the most complex and important sectors in any country
- particularly in developing countries like South Africa (Cicchetti, 1995). Electricity
has broad economic, social and political implications as it affects and is necessary in
the following settings; agriculture, human health, education, transportation, and
industry.
Throughout the world, the electricity sectors of both developed and developing
countries share at least three common characteristics. They are vertically integrated;
the availability of electricity and production thereof affects economic growth and
lastly, these electricity sectors have become a focal point of economic concern and
political debates (Cicchetti, 1995).
Governments have regarded electricity as a public necessity for which they have had
the prime responsibility to ensure national control over this sector (Cordukes, 1990).
As a result, the organization of electricity supply utilities in developing countries has
generally become centralized under state ownership (Cicchetti, 1995; Cordukes,
1990).
During the 1990s, a phenomenal transition has rapidly grown worldwide regarding
these electricity sectors. The vertically integrated, monopoly franchises are reforming
and restructuring to introduce increased service efficiency of public utilities as well as
increased competition in the electricity sectors (Cicchetti, 1995; Cordukes, 1990).
Cohen (2000) wrote her thoughts in her paper when it was announced that North
America would pursue an Energy Framework. The interesting point that came out was
that "the Canadian government justified deregulation ideology by claiming that
private producers operating through the market were inherently superior to
government-provided services, and thus the introduction of competition in electricity
markets would reduce prices".
27
Vertical integration has been associated typically with franchise monopoly status
where government regulated electricity supply to control prices, profits, and
performance. However, the difficulty that many governments are experiencing is
obtaining adequate funds for financing expansion programs (Cordukes, 1990, Cohen,
2002).
Vertically integrated means that a single entity controls the three distinct phases of
electricity supply: generation at the power source (generating energy); transmission
to the area where it will be used (substation); and, distribution directly to end-users or
customers. That is, a single utility is in control of both the engineering (or Wires) and
customer service businesses. (Cicchetti, 1995; Moorhouse & Demsetz, 1986).
Electricity supply utilities in many countries are being scrutinized and criticized by
many of their stakeholders including; government, business decision makers,
regulators and the end customers. According to Ciccheti (1995), "Many question the
vertical structure of the industry, wondering whether competition can replace or
augment monopoly status and regulation. Although, there is political concerns
associated with rising prices and costly new capital investments. However, many
countries have determined that restructuring their electricity sectors is a particular
effective way of increasing efficiency and improving electricity provision."
(Cicchetti, 1995; Cordukes, 1990).
This chapter will focus mainly on the restructuring of developing countries also
drawing on experiences from developed countries, concentrating on the Distribution
part of the business. This review is thus to enhance the knowledge base on past
restructuring experiences and to go back and see if the South African Electricity
Supply Industry reform is on track. The focal group for the rest of this research will
be on the Distribution Pricing Department currently in the process of producing a set
of rational tariff structures for the whole of the South African industry.
28
2.2. A look at the electricity supply industry (world wide)
The electricity supply industry may be considered in terms of its three functions:
generation, transmission and distribution (Cicchetti, 1995). In this chapter, the
overview of issues pertaining to restructuring of electricity sectors will be discussed -
exploring past and present restructuring experiences around the world, concentrating
on developing countries.
However, this discussion will focus on the restructuring of the distribution group and
how this impacts on customer service. As distribution entails activities such as load
dispatching, customer installations, equipment maintenance, meter reading, billing,
demonstrating (customer education), and advertising (Moorhouse & Demsetz, 1986).
Distribution is the delivery of low-voltage electric power from load centre
(transmission) to residential, commercial, and industrial consumers. In short, it is the
selling of electric power to electricity end users (Moorhouse & Demsetz, 1986).
From the economists' point of view, Cohen (2002) asserted that, "Given the natural
monopoly character of local distribution, most states impose territorial restrictions
that prevent direct competition between two or more retailers in the same community
(Moorhouse & Demsetz, 1986; Cordukes, 1990).
"The conflicts between state and federal regulation, among classes of electricity users,
between electricity users and the owners and employees who produce it, and among
government agencies with specialized interests of their own - tax revenues, safety,
abundant energy supplies, and environmental quality - all interact to create a
confusing and unpredictable regulatory system.1"
Some utilities are under the impression that conceivably - perhaps even plausibly -
unregulated markets work better than regulated markets even when scale economies
are important (Moorhouse & Demsetz, 1986).
29
However, the view that the electricity sector is essentially a natural monopoly is being
challenged both in developed and developing countries (Cordukes, 1990). One
perspective (way to look at it) is that government-owned and regulated utilities are not
efficient and give unsatisfactory performance. Conversely, to encourage competition
there needs to be a change in the regulatory framework, and deregulation to reduce
government involvement in daily operations and provide sufficient autonomy to
utilities allowing them to operate on a fair basis with other suppliers (Cordukes,
1990).
2.3. Regulation of Electricity
"Regulation is a response to market failure!"2 Governments have sought to control the
policies and operations of electric utilities through regulation. Regulation is thus the
enforcement and monitoring of a set of operational rules to meet defined objectives by
an appointed autonomous entity accountable to government (Cordukes, 1990;
Cicchetti, 1994). "Regulation is potentially warranted when unregulated market
outcomes are inefficient, since regulatory intervention in theory could be beneficial".
(Church, and Ware; 2000).
Regulation has taken many forms but to extend Church & Ware's (2000) thoughts,
Cordukes (1990), Moorhouse (1986) and Hammond (1995) have affirmed that in
addition to controlling prices and restructuring access to other market suppliers,
governments have regulated utilities by controlling borrowing and investment
programs and typically restricting the power and autonomy of board of directors and
managers of power utilities. In spite of the aforementioned, regulation has been aimed
at ensuring the efficiency of the industry, the safety of supply, minimizing
environmental impact, and constraining the power of utilities to operate other than
service regulations.
As a model and to clarify the role of regulation in this paper, Ciccheti (1995)
considered the regulation of electricity in the United States (US). Regulation in the
1 Moorhouse, J. C. The Uncertain Future of the Electricity Power Industry, in Electric Power, in Moorhouse & Demsetz, ed., Electric Power: Deregulation and Public Interest. 1986. pp 1-20.
30
US is the joint responsibility of the fifty state regulatory agencies and the Federal
Energy Regulatory Commission (FERC). Often, these bodies adopt varying
approaches to such problems as how to determine allowed rates of return; how to set
rates for different classes of customers (residential, commercial, and industrial); who
(customers or investors) should bear the cost of excess capacity; and how much
competition should be mixed into a system which until very recently characterized
primarily by monopoly suppliers. (Cicchetti, 1995).
The traditional tools for utility regulation center on determining the three R's: rate
base, rate of return, and rate (price) structure. Nonetheless, Ciccheti (1995) derived
that there are four components of this regulation that in combination distinguish the
public utility from other sectors of the economy: control of entry, price fixing,
prescription of quality and conditions of service, and the imposition of an obligation
to serve all applicants under reasonable conditions.
Cordukes (1990) also came up with a notion is that these fundamental components of
regulation were developed in response to two basic considerations. The first is that
electricity, unlike most other goods and services, is essential to consumers' well
being. The other basic consideration is that a public utility is a "natural monopoly".
Evidently, the central mission of utility regulation has always been to protect the
consumer from the high prices and reduced outputs that accompany monopoly power
(Moroeng, 2005). The conventional argument to support the introduction of regulation
is that electricity utilities are "natural monopolies" because they enjoy economies of
scale, that is, unit costs that decline throughout a relevant production range as output
increases. That is, scale economies in producing, transmitting, and distributing
electricity thus prohibit competition because a single utility can supply the entire
market demand at lower costs than could two or more utilities supplying the market3
(Moorhouse & Demsetz, 1986). To move forward in this search, one should get an
understanding of the history of regulation...
2 Church & Ware. Industrial Organization: A Strategic Approach. McGraw-Hill, Boston, pp 749. 3 Moorhouse, J. C. Part I: Elcrtic Utility Regulation, in Moorhouse & Demsetz ed., Electric Power: Deregulation and Public Interest. 1986. pp27
31
2.4. The History of Electricity Regulation
The electricity industry has been regulated since the 19l century. Initially, local
government exercised control over small, local-service electric utilities by granting
operating licenses and permission (Moorhouse & Demsetz, 1986). Subsequently in
the 20th century, electricity utilities developed into national/intercity systems, and
states began to establish public utility commissions to regulate electric companies.
The evolution of regulatory arrangements in developing countries has been greatly
influenced by those in developed countries (Cordukes, 1990) - for the simple reason
that developing countries always aspire to become more like developed countries in
all aspects. Typically political and administrative authorities have intervened to
control electric utilities through a wide range of laws, regulations, decrees and
decisions issued by the legislature, the head of state, ministers and regulatory bodies
(Cordukes, 1990).
Incentives to improve electricity sector efficiency and attract private sector
involvement include; Organizational change, Legislation - the relationship between
the government and the industry needs to be clarified and Regulations - over prices,
borrowings, budgets and investment (Cordukes, 1990).
Restructuring, privatization, and Independent power producers (IPPs) represent
several responses to increasing the efficiency of electricity sectors throughout the
world. Cicchetti (1995) raised the idea that energy efficiency investments can help
countries to ease impacts of energy price increases and minimize environmental
pollution; thereby stimulating economic competitiveness. Moorhouse and Demsetz
(1986) further motivate the latter by stating that "a regulated industry will be more
efficient than the unregulated industry because of the evidence on the poor
performance of the regulated industries in general".
With all this evidence, one has to keep in mind that no two countries are alike when it
comes to electricity sector reformation. Motivations may differ - these will unfold as
the chapter progresses and when looking at experiences that flowed from restructuring
32
in countries that have embarked on the challenge see and how it has progressed so
far...
This chapter outlays and unpacks components of electricity markets around the world.
Examining and evaluating the restructuring proposals in these electricity supply
industries, probing and questioning the experiences (whether successful or failed) -
especially for developing countries, and particularly introducing the history of the
restructuring process in South Africa to lay the ground work for the rest of the
dissertation to give direction on the process that the South African Electricity Supply
Industry as a whole will eventually embark on...
2.5. Electricity Markets in Developing Countries and the need for Restructuring
Recently, electricity sectors have either come under direct political fire or become the
focal point of economic distress. In both developed and developing countries, an
industry once dominated by engineers who produced declining real prices and
improved supply, has come under much closer political scrutiny. This phenomenon
has reached worldwide status where countries around the world have realized that
electricity costs are probably higher than necessary, and thus the electricity sector
does not need to be vertically integrated.
Numerous problems plague the electric power industry. Gordon (1989) examined that
with careful consideration it is evident that the basic problem worldwide is the failure
of traditional public utility regulation to respond to the radically changed state of the
electricity industry. Unregulated utilities tend to face problems of expensive energy,
the resulting reduction of demand growth, and more stringent environmental
regulations, particularly those affecting nuclear power.
From that viewpoint, Gordon (1986) concluded that reform is clearly needed in
electricity utilities. This would eliminate industry problems arising from combined
effects of different governmental actions causing the industry to be fragmented.
Therefore the minimum acceptable reform would be deregulation of electricity
33
generation, and total deregulation of electric utilities might be preferable. Moreover,
restructuring might not produce the improvements that are anticipated.
Alternatively, for a developing country, the electricity sector can be of critical
importance. South Africa is an example where Eskom has social and political
obligations to ensure that most of the citizens are supplied (including rural areas) with
electricity despite that they cannot afford this basic need due to high unemployment.
There is the "catch" situation in developing countries, where industrial developments
rely on efficient infrastructure and a key component of any efficient infrastructure is
an adequate and reliable supply of electricity. Thus, sufficient electricity supply is
critical to sustainable economic and industrial development, as well as for improving
the standard of living (James, 1996). As is the case in South Africa, supplying the
whole country with electricity is a government objective; distributors are faced with
high demand growth rates leading to significant power shortages (Cicchetti, 1995).
To further elaborate, the issue of meeting the electricity supply and demand objectives
in sub-Saharan Africa has been identified as a adverse one. These utilities (vertically
integrated) are generally not well developed in terms of size, accessibility for majority
of the population, provision of high quality service, and national and international
connections. More specifically, this refers to the poor integration of the national
networks have stifled electricity trading potentials in the region (Turkson).
The electricity sector is typically the dominant percentage of a developing nation's
investments and is generally financed with foreign debt. The increasing burden of
foreign debt can result in a variety of macroeconomic financial restrictions. A vicious
cycle begins when a nation's foreign debt cannot be paid, and the nation must accept
stringent macroeconomic controls (fiscal, monetary, and foreign exchange, for
example) to refinance existing dept and any increment advanced by lenders (Cicchetti,
1995).
As acknowledged above, electricity sectors in such countries are used to address
social equity issues such as; ensuring that all classes of individuals receive adequate
4 Gordon, R. L. "Perspectives on Reforming Electric Utility Regulation" in Moorhouse & Demsetz,
34
energy services to support basic human needs such as health and education;
governments may subsidize electricity sector operating costs (Moorhouse & Demsetz,
1986).
Contrary to that, Cicchetti (1995) and Moorhouse & Demsetz (1986) have indicated
that some policies may lead to an uneconomic pricing structure and absorption of
significant amounts of government capital, monies that could be used to address
directly social concerns such as health, education, and national security. Cicchetti
(1995) believes that though subsidized power relives budget constraints on power
utilities, the solution to the resulting shortfalls becomes a burden of general taxes. In
addition, power shortages that inevitably result from the inability to finance system
expansion to meet increased demand often require some form of rationing. (Cicchetti,
1995; Cordukes, 1990). Thus electricity utilities have not been operating efficiently
because of the absence of competitive forces and an adequate level of accountability
between the utilities...
Another expected setback, according to Cicchetti (1995), is that developing countries
have responded traditionally to their energy needs by expanding the energy supply
base with little concern for the efficiency with which energy is supplied or consumed.
Obviously, this can lead to significant financial and environmental problems.
To break the vicious cycle, developing countries are initiating programs in which new
generation can be acquired without increasing foreign debt. The idea behind this was
under the following thoughts; that, if electricity suppliers do not need to be vertically
integrated for engineering reasons, why cant developing countries purchase electrical
energy as it flows from a power station vault owned and operated by a private
company? Developing countries can avoid increased debt, pay for the kilowatt hours
(kWhs - the smallest unit of electrical energy flow) of electrical energy as they use
them, and achieve the increased GNP associated with greater electricity consumption
(Cicchetti, 1995).
ed., Electric Power: Deregulation and Public Interest. 1986. pp 447-476.
35
2.6. A Natural Monopoly
Moorhouse and Demsetz (1990) had the following criteria to define what a natural
monopoly is; the existence of economies of scale and that a monopoly is based on the
fact that electricity is a (social) necessity - it was believed that any competition would
cause social disruptions. Lastly, that electricity is a highly capital-intensive industry
i.e. requires a stable revenue base to support the necessary large investments in plant
and equipment .
The latter summarizes the typical operations previously accepted in South Africa.
Hammond (1995) further evaluated that this entails allowing one utility to monopolize
the industry in the interest of saving on per-unit costs, while at the same time,
regulating that utility's behaviour to avoid any abuse of its monopoly power.
However, Moorhouse & Demsetz, 1986 commented that given that public utilities are
regulated monopolies, more or less isolated from direct competition, the incidence
and economic effects of utility taxes have not received serious attention until recently.
They represent vast revenues and tangible wealth. Taxes at low rates can yield large
stable flows of revenue at almost no administrative and enforcement costs. In short,
economists view utility taxation as a special problem in the state and local finance.
The major concern regarding the impact taxation has on efficient resource use has
been the misrepresentation created by the favoured tax status of publicly owned
utilities as a part of the larger private-public power controversy .
In contrast, Kafoglis, 1986 stated that, public utilities do make substantial tax
payments to all levels of government. They pay special taxes because they are unique
enterprises, and these are collection agents for a variety of customer exercise taxes
levied once more by all levels of government. Utility taxation is also an instrument for
implementing local industrial development policies. Pickering's (1994) view point
5 Hammond, C. H. "An Overview of Electric Utility Regulation" in Moorhouse & Demsetz, ed., Electric Power: Deregulation and Public Interest. 1986. pp. 32-43.
6 Kafoglis, M. Z. "Tax Policy & Public Utility Regulation" in Moorhouse & Demsetz ed., Electric Power: Deregulation and Public Interest. 1986. pp 97 - 132.
36
supported the above testimonial by adding that taxation should be regulated,
transparent and subject to national norms.
Taxation of utilities came about due to the failure of municipal regulation and the
discontent during the latter part of the nineteenth century as a policy of neutrality in
taxation gradually evolved. Thus neutral tax gave way to special tax. Economic
theorists have considered the possibility of substituting taxation for regulation. This
required a lump-sum taxation of utility profits coupled with a per-unit output subsidy
equal to the difference between average and marginal cost at the competitive output to
Since utilities have monopoly power that may be ineffectively controlled, special-
purpose utility taxation can be justified in the interim, as a recapture of monopoly
profits. In this day and age, taxation in the public utility sector has become much
more complex. However, economists use two special-purpose models - the Averch-
Johnson (A-J) model of the profit-maximizing regulated utility and the more practical
revenue-requirements model - to predict outcomes under utility taxation (Lee, 1988).
2.7. The Introduction of Competition in the Production of Electricity
Until recent developments in the US and UK have led to increased private sector
participation or the potential thereof, competition has been limited worldwide in the
electricity sector (Cordukes, 1990). Previously, governments had the outlook where
they electricity supply was considered a public concern and tariffs as being tools for
meeting their social obligations. Thus price increases have been highly sensitive
politically because Governments perceived that they contribute to inflation and impact
adversely on their electoral status (Cordukes, 1990).
In the past, competition was not favoured; however, consolidation and price fixing
followed franchise proliferation. In the early 1900s, reliance on market competition
was abandoned in favour for regulated monopolies. The outlook was "Public utilities
are best conducted under a system of legalized and regulated monopoly". States had
37
such opinions and thus regulation received more support than public ownership and
thus policies against market competition were established7.
Zardkoohi (1995) raised a major policy concern in terms of whether restructuring of
the electricity industry could enhance competition and consequently improve
economic efficiency. He also mentioned that pooling can be the response to the above
concern. Pooling is generally defined as the common facility planning, construction
and use by several independent companies. Two major benefits are: pools
substantially improve reliability at considerably reduced costs; and pooling can result
in substantial cost savings in power generating and transmitting . However, pooling
arrangements yield many benefits. It can facilitate investment coordination and
construction of large generating units and transmission lines, leading to economies of
scale in the latter groups.
The industry paper consolidated by Cordukes (1990) appeared to be confident that the
latter perspectives (on competition) will cease to exist in the near future...
To elaborate on that point, Cordukes (1990) has evidence of developing countries that
have already embarked on introducing competition; a brief look at these examples
might lead one to a more positive outlook on the subject;
In Chile, realistic pricing policies have been adopted where the government regulates
prices for distribution companies, through this, a climate for promotion of
cogeneration and private sector development has been established. Similarly in
Pakistan, the regulatory environment was transformed through the Bank's assistance
to encourage competition and provide sector financing for generation projects.
From a study of complete restructuring by Berlin et al, the following were founded;
"it is particularly important that inter-utility competition for customer loads be
promoted. The desire to achieve efficient allocation of resources and to stimulate
7 Primeaux, W. J. Jr "Competition between Electric Utilities" in Moorhouse & Demsetz, ed., Electric Power: Deregulation and Public Interest. 1995. pp 395-400. 8 Zardkoohi, A. "Competition in the Production of Electricity" in Moorhouse & Demsetz, ed., Electric Power: Deregulation and Public Interest. 1995. pp 63-68.
38
technological innovation demands no less." Berlin et al thus proposed ending vertical
integration by separating generation and transmission from distribution.
Weiss (1995), Cohen (2002) also embarked on similar studies and projected the
following conclusions; vertical integration and combination utilities are two major
barriers to competition in the electricity industry. He suggested two alternative classes
of modifications. The first one being to induce "maximum competition," this
alternative would require a complete restructuring of the industry as follows:
• The separation of generation-transmission companies from distribution
• The disbanding of combination utilities
• The elimination of public and private territorial restrictions on sales to
distributors or large industrial customers
• A general requirement of interconnection and wheeling at reasonable charges
• The elimination of preferential access to federal power and preferential tax
and capital-coat treatment for municipals and cooperatives
• The elimination of legal restrictions on entry into bulk power; and
• The limitation of horizontal mergers among generation-transmission
companies to cases where the partners are too small to negotiate effectively
with other bulk-power products of a region.
However, Weiss (1975) contradicted himself by stating that such a thorough
restructuring process is probably neither practical nor politically feasible in the
foreseeable future. He thus offers a more reserved set of modifications, which may be
easier to attain to induce modified competition.
• The elimination of private and public territorial restrictions on sales for resale
and possibly private restrictions on sales to large industrial customers
• A general requirement of interconnection and wheeling;
• Control of horizontal and vertical mergers;
According to Moorhouse & Demsetz (1986), a derivative of such great efforts would
be "a further reduction in vertical integration because of the increased access of
municipals and cooperatives to power at competitive prices and the increased
39
competitive pressure on small utilities that are presently integrated." This view point
was recently supported by Cohen (2002).
Other specialists, Joskow and Schmalensee (1983) evaluated the cost effectiveness of
several scenarios in a vertically integrated utility. One scenario however stood out
where one has the South African electricity market in mind. This scenario calls for
complete vertical non-integration of the utilities and proposes deregulation of
wholesale power transactions. Each sector would be owned and operated by different
entities. The ownership and operation of all transmission capacity would be
transferred to "a regional power pooling and transmission corporation". Transactions
between independent distribution companies and independent generating entities
would be free of regulation. Transactions between distribution companies and
transmission-pooling entities, however, would be governed by regulation. Gordon
(1986) reiterates that retail services would be provided by franchised monopolies, and
the retail rates would be subject to state regulation. Coupled to that, a market structure
is also being suggested where over time; a multi-market model electricity market
framework will ensure that transactions between electricity generators, traders and
power purchasers may take place on a variety of platforms, including bilateral deals,
power exchange and a balancing market. This is what the South African market will
be striving for in the near future...
2.8. An Overview of Reform Proposals
Ongoing concern over electric utility regulation has sparked numerous reform
proposals. In his chapter, "Perspectives on reforming electric utility regulation",
Gordon proposed a few reform suggestions following his study of the US electricity
reform. The basic ideas range from simply deregulating wholesale transactions to total
deregulation all of which have potential, these are as follows:
2.8.1. Experiments in Deregulated Wholesaling
By 1995, experimentation on wholesale pricing was allowed to take place in some
parts of the United States as well as New Mexico as permitted by the FERC. A lesson
40
learnt from these experiments was rather unfortunate as it became evident that
deregulating wholesale operations will be as hard to implement as any other reform.
2.8.2. Reform by Restructuring
This reform entails the separation of generation from transmission and distribution
(and several other reforms, such as eliminating territorial restrictions and sales,
removing barriers to entry, and severing gas utilities from electricity companies)
(Weiss, 1975). Following the separation of the three phases of electricity operation,
the next level involves creating truly independent, preferably numerous electricity
producing and supply entities (Weiss, 1975). However, as early as the beginning of
the 1980s, concerns were raised over whether restructuring would really lead to
deregulation. All reorganization proposals implicitly or explicitly link any changes to
relying on the FERC to exercise strong leadership. This proposal demands careful and
precise layout of how the separate generating companies would deal with distribution
and transmission entities under deregulation.
2.8.3. Total Deregulation
Gordon (1986) and Walter are campaigning for this type of reformation due to the
following expected benefits; That total deregulation might avoid all reorganization
costs, inevitably some costs might arise. A partial reorganization process would
involve significant outlays to transform existing companies into some new form.
Competitive pressures on distribution companies could be so much stronger than
conventionally recognized and regulation9. For instance, retail rates might be designed
much more efficiently. Deregulation could increase access to other companies -
unleashing prevailing competitive forces will produce a more efficient electric power
industry than regulation as currently practiced.
The latter part of the literature gave a broad overview and background of electricity
sectors, their current status and reasons for this change. However, the following
9 Walter J. Primeaux, Jr., "A Reexamination of the Monopoly Market Structure for Electric Utilities" in A. Pjillips, ed., Promoting Competition in Regulated Markets, (Washington: Brookings Institution, 1975), pp. 175-200.
41
paragraphs will look specifically and more comprehensive at experiences through
electricity reformation of both developed and developing countries. This still links
back to our original intent of setting the scene for the South African market...
2.9. The UK Electricity Industry
The following UK experience accounts were extrapolated mainly from a paper that
was managed by Falato & Mcintosh from Andersen Consulting (1995) who studied
the UK electricity industry six years after its reformation and liberalization. The paper
presents the successes of that industry as well as addresses some misconceptions,
explaining some of the key issues which have risen during the restructuring process
and speculates on the changes and challenges still facing the UK electricity sector six
years after reforming.
As sited in many other sources, the 1989 privatization of the UK electricity sector has
been one of the most closely observed experiments in the electricity supply industry
of the last fifty years. The resulting industry structure and market dynamics has been
studied by both governments and electricity utilities around the world. The UK model
has been considered for adoption by many countries: in developed countries it has
been seen as a possible path towards growth and prosperity in an industry which faces
increasingly stagnant home markets; in developing countries it has been seen as the
means of attracting much needed foreign capital investment. In all countries the UK
model offers hope for better service, lower prices and high supply security (quality of
supply).
When the UK government decided to liberalize the electricity sector, their intent was
to encourage greater efficiency and increase competition. Central to this goal was the
unbundling and privatization of the Central Electricity Generating Board (CEGB),
which was at the time the UK's state-owned, monopoly producer and supplier.
Furthermore, the aim was to provide customers with greater choice of suppliers, better
services and lower prices.
42
At the time of privatization, skepticism was rife from critics worldwide and the
following concerns were raised; would reliability be maintained? Could prices really
fall as a result of competitive forces? What would happen to security of supply?
Indeed from the UK point of view, the move to restructure the industry was a bold
one, ambitious as well as visionary. They were the pioneers of restructuring in the
electricity sector during Margaret Thatcher's government. Through this pilot process,
Falato & Mclntoch (1995) observed that there was a paradigm shift through the
country were utility companies have undergone fundamental change in perspective
from that of engineering (wires business) focused to the retail business (customer
service) focused ones. According to Cavanagh and Sonstelie (1998), there has been no
clear definition of "wires business" as some activities (subject to deregulation) have
been lumped together in the past and thus electricity industry restructuring should not
only focus on its competitive (retail) business lines but also clarifying the Wires
business.
UK electricity utilities are currently operating within a new business mandate: many
inefficiencies have been driven out of the system, diversification and cross-order
investments have increased and change programmes have nothing short of
revolutionized employee attitudes and working practices.
Critics with a close look at this system have realized that the new industry structure
has effectively led to a duopoly in generation, since the two main producers,
PowerGen and National Power seem to be able to control the marginal price of
electricity. From the evidence of the system's efficiency, the skepticism has changed
to interest: people curious to find out what actually happened to have this success,
how they can learn from this system. Furthermore, many will point out that prices had
not fallen (during the first six years following reform), especially for domestic
customers. Customers have seen their prices come down and services improve. This is
clear in the customer discussion impact.
Although much still remains to be done before the dynamics of the UK electricity
market reach a point of stability, at the time of this research, some positive findings
43
came out; An extremely dynamic environment in which the electricity commodity is
traded competitively through both the Pool and an active second-tier market.
2.9.1. Structure of the UK industry:
The resulting industry structure that emerged consisted of twelve Regional Electricity
Companies, three generating companies and one grid operator. The Regional
Electricity Companies are responsible for carrying out regional distribution and
supply activities. In the generation sector, National Power and PowerGen are the two
main fuel producers, while nuclear Electric has taken over the country's nuclear
assets. The last piece of the puzzle being filled by the National Grid Company (NGC)
is responsible for transmission services.
Regulation in the UK electricity market was embodied in the Director General of
Electricity Supply (DGES) - the regulator. The regulator's task is essentially to
protect the customers and to promote competition in electricity generation and supply.
The regulator also sets the price formulae for transmission and distribution grids, the
natural monopoly elements of the market. These formulae are incentive-based and
ensure that network service providers obtain a fair return on their assets whilst at the
same time striving to achieve adequate levels of efficiency and customer service.
The UK chose the "big bang" implementation approach as a reform package. This
included; industry unbundling, privatization and introducing competition into the
industry, all at once. Perhaps it was possible to take this approach in a developed
country such as this one. Certain conditions such as adequate institutional and human
capacity existed to ensure that the country adopted to this "big bang" approach to
ensure that there was no implementation failure (Turkson). This approach is not
advisable for developing countries such as South Africa and they should rather take
the gradualist approach of reforming their electricity utility industries. This approach
affords the industry to steadily reform with the introduction of unbundling or
rationalization, privatization and competition step-by-step in a phased approach to
make sure the industry evolves with this process and that the country is able to
manage all the changes consecutively.
44
2.9.2. Impact of competition on UK customers
2.9.2.1. Competition in the supply industry
The introduction of secondary/more suppliers has been highly successful. Typical
commercial and small industrial customers have seen a decrease in price since the
reform - having the choice to choose suppliers. However, very large customers have
seen their price increase by a small percentage due to losses of subsidies which was a
privilege days before privatization took place.
However, domestic customers have seen an increase in prices due to the fact that
utility limits have fallen, however this was an expected turn of events. In addition,
unbundling has resulted in a greater price transparency of the true value of services
(sic: cost-reflective) provided by the constituent parts of the industry. In addition, by
charging customers different prices at different times of the day (time-of-use), usage
patterns may be altered in favour of the cheaper time periods thus giving incentives
for demand-side management and efficient use of electricity. The UK utilities have so
far shown themselves to be reasonably flexible in tailoring individual contracts to
specific load management requirements especially to the very large customers.
2.9.2.2. Service levels
Service levels have improved as the regulator reported, "high level of performance
was common to all Regional Electricity Companies". The mandate to Regional
Electricity Companies was to offer their customers Guaranteed Standards based on
the industry's Standards of Performance in areas such as the timing of connection,
visits, meter reading, billing and so on. Stringent rules have been put in place for the
Regional Electricity Companies (distributors) to pay a penalty to customers should
any of the standard not be met.
In light of the above-mentioned service provided, in 1994 customers saw:
• A 14% drop in the total number of complaints to the regulator on electricity
supply
45
• A 67% fall in disconnections as Regional Electricity Companies encourage
new payment methods such as budget and pre-payment schemes, direct debits
and standing orders.
• A tightening of Standards of Performance, which guarantee customers a
minimum level of service, and the introduction of new standards to encourage
energy efficiency.
2.9.2.3. Energy efficiency and the environment
Most generating companies began complying with government emission targets
where they are developing environmentally friendly generation.
2.9.2.4. Suppliers and the regulator
Regional Electricity Companies liaison with the Commission regulator to form good
working relationships and to adopt a non-confrontational stance with the government.
Each Regional Electricity Company has a supply and a distribution arm. Distribution
accounts for 80% of the profits. The regulator thus ensured that distribution prices
where tightened and under control as soon as privatization was a reality to protect the
customer's interest by preventing utilities from making wind-fall profits.
2.9.2.5. Customer's perspective and impact
Cecil Parkinson, Secretary of State for Energy made the following comment in
February 1988 regarding the UK restructuring and customer wellbeing; "Decisions
about the supply of electricity should be driven by the needs of the customer and
competition is the best guarantee of customers' interest"
Electricity customers have seen a steady improvement in benefits since restructuring
as discussed, through there are conflicting comments, many do not perceive or realize
this.
46
The regulator stated that: "Customers want high standards of service from electricity
companies as well as lower prices...New initiatives to enhance customer service and
promote energy efficiency were put in place...there was a substantial progress in the
development of competition in supply and generation" Professor Staphen Littlechild,
Director General of Electricity Supply.
From the Andersen study, Falato and Mcintosh have come up with a comprehensive
approach forward for the UK market. That "it will be well into the next decade before
the UK electricity industry becomes a truly competitive marketplace; it may take that
long for greater competition to develop in generation and for the full impact of retail
wheeling to take hold. In the meantime, UK players will have to continually revise
their strategies and change their organizations along more customer focused lines
whilst ensuring that increasing value is added to both the businesses' consumers and
shareholders".
In conclusion, the UK electricity market has come a long way since 1989, but as the
regulator has commented in his 1995 annual report "...there is much that still needs to
be done, particularly in further revising distribution and transmission price controls,
in establishing more effective competition in generation, and in developing
arrangements for the competitive supply market".
Indeed, this is a good restructuring model for the South African electricity distribution
industry to draw from bearing in mind the economic sector and types of customers
amongst other aspects. The lights have stayed on in the UK sector at the same time;
the country has managed to retain a good reserve margin, which currently stands at
20%. This is a very good system that electricity sectors around the world can learn
from and try to imitate. Although for a developing country such as South Africa, these
findings seem too good to be true and it would probably take a developing country
many more decades to come to get close to a stable, efficient market.
This model is an example of how competition can exist in the electricity industry
whilst maintaining security of supply. Even six years after privatization the lights
stayed on. Moreover, the industry has also developed long-term security insured
through new build by both incumbent producers and new Independent Power
47
Producers (IPPs). Many countries around the world such as Poland and the US are
looking to the UK model as a basis for developing their own competitive market for
electricity. The UK system is very complex, so not surprisingly it's got its flaws. Most
commodity markets evolve over time.
2.10. Restructuring New Hampshire's Electric Utility Industry
Following the UK restructuring, the Public Utilities Commission produced a paper
stipulating the final plan of Hampshire's restructuring initiative. In May 1996, the
New Hampshire Legislature directed the Public Utilities Commission to develop a
countrywide electric utility restructuring plan that would implement retail choice for
all customers by January 1, 1998 (DR 96-150, 1997). The aim was to move towards
providing retail customers with the opportunity to purchase electricity from
competitive non-utility power suppliers.
This paper stated that the two aspects that must occur in order for retail customers to
benefit from the anticipated competition. First, retail electricity service must be
unbundled into generation and transmission and distribution. Secondly, the existing
market structure must be restructured in a way that provides retail customers with the
opportunity to choose their power suppliers.
The paper also considered the responsibilities of the different operational groups in
the electricity utility. For the sake of this discussion, the bulk of the discussion will be
on the Distribution business...
In a restructured industry, distribution utilities will be responsible for providing non
discriminatory unbundled distribution service to all customers in their designated
boundaries. The rates of this service shall continue to be set by the regulator/
Commission. To ensure that the distribution company does not abuse its position by
exercising market power, the distribution company may not be an affiliate of any
company, which sells a competitive service in its service boundaries.
48
2.11. Restructuring In Developing Countries
Many developing countries, especially in Africa began restructuring their electricity
sectors in the 1980s. Drawing from Cordukes' report (1990), countries such as Ivory
Coast, Kenya, Senegal and Zimbabwe embarked on this restructuring initiative long
before South Africa had the opportunity and resources to do so.
The common thread in all these countries' electricity sectors was the need to move from
wholly owned state corporations (public utilities) to attracting foreign investment in order
to breed a more efficient electricity supply industry. The latter is feasible owing to the
assistance and guidance from government and electricity authority/regulator; this includes
the ministerial approval required for its borrowing, annual budget and tariff changes
(Cordukes, 1990). However, no real incentive has been provided by Government to seek
private involvement in the sector. This leads to inefficiency in the electricity supply
market as seen worldwide. This inevitably involves the unbundling of the three
operational functions of electricity utilities, that is, generation, transmission and
distribution (Cordukes, 1990).
Another common difficulty is the lack of qualified and experienced personnel to assist in
advising and the undertaking of the restructuring process (Cordukes, 1990). Long-term
objectives of each country are to eventually have the unbundled operational functions
operating autonomously. Increasing their customer base by providing and supplying those
potential customers with the basic electricity - fulfilling their social responsibilities.
However some countries' power sectors (such as Sudan) have virtually no legal and
regulatory frameworks as not even a tenth of the country had been supplied with
electricity. Seems there have been many changes in these electricity sectors, for instance,
moving from two companies into one public sector or monopoly as well as the separation
of the water and electricity corporations.
49
At the end, the countries have managed to become more autonomous (not completely) in
terms of decision making particularly on financial matters from government control,
however as expected in other areas, autonomy is constrained (Cordukes, 1990).
2.11.1."Restructuring eventually leads to Privatization"
In my dissertation proposal, I identified restructuring as a precursor of Privatization.
Privatization has rapidly become the dominant political issue (worldwide) in the past few
decades (sic: this is not a direct translation). It has taken many forms and guises, all of
which reflect a political commitment to 'roll back the public sector' and to 'free market
forces'.
According to Heald 1983 and 1984, Privatization has four components and they are as
follows: Charging - involves the (partial) substitution of user charges for tax finance;
Contracting-out represents the substitution of private contractors for in-house
production; Denationalization and load-shedding refer to reductions in the scope of
public sector activity, taking forms, respectively, of the sale of public enterprises and the
(partial) abandonment of public non-market functions.
Alternatively, liberalization means the removal of statutory prohibitions on the private
sector competing against the public sector. According to Heald and Steel (1982),
privatization of public sectors is said to contribute towards the following four objectives;
it will enhance freedom by extending the sphere of the market and contracting that of the
state; it will improve efficiency because private sector organizations are inherently more
efficient than public ones; it will reduce the PSBR; and it will re-introduce market
disciplines missing in the determination of public sector pay.
The principal objectives of privatization appear to be the promotion of a more efficient
allocation of resources by encouraging competition and reducing costs, and making the
industries more responsive to consumers' needs. 'Public enterprises perform relatively
poorly in terms of their competitive position, use labour and capital inefficiently, and are
less profitable' (Moore, 1983).
50
Heald and Steel (1984) briefly studied a review of an experience in the US that arrived at
a suggestion that regulation is likely to lead to welfare losses arising from inefficiency in
the allocation of resources, to increased bureaucracy and delays in taking decisions, and
possibly to relatively high compliance costs.
2.12. The history of the reformation of the South African Electricity Supply Industry and Electricity Distribution Industry
The South African Electricity Supply Industry has been, over much of the last century,
dominated by the growth and consolidation of a large and powerful state-owned,
vertically integrated monopoly, Eskom (Eberhard, 2003). Eberhard (2003) continues to
state that, by the 1980s, poor economic and political pressures on the state-owned
enterprises (SOEs), combined with broader economic and political pressures on the
apartheid regime, and caused government to look at reforming these institutions. The
most prominent reasons were due to poor investment decisions made, from Eskom's side
resulting in massive costs to the company and, initially, to the consumer. The principle of
operating at "neither a profit nor a loss" was replaced by the need to "provide the system
by which the electricity needs of the consumer may be satisfied in the most cost-effective
manner, subject to resource constraints and the national interest"10.
Electricity in South Africa has consistently been amongst the cheapest in the world (see
figure 15). This was due to the following two principles; first, South Africa had an
abundant reserve of cheap coal - lead to the development of large coal-fired stations
producing electricity economically; secondly, as a result of policies of previous political
dispensation, the industry has largely ignore the electrification of millions potential
(disadvantages) customers who will from now place a financial burden on the electricity
industry (James, 1996).
Although the restructuring of the South African electricity (EDI) and the electricity
supply (ESI) industries officially began as the nineties approached a close (post 1994
51
elections), the idea of rationalizing the industry was already rife in the industry before
this time and some literature has been have written on this matter. Whilst the generation
and transmission components of the industry are relatively consolidated, under one giant
corporation Eskom, the distribution level of the industry is highly fragmented (Pickering,
1994, Turkson).
It was thus decided that rationalisation of the EDI prior to the ESI was imperative due to
the following inefficiencies; too many small, non-viable, poorly-run municipal
distributors - many problems stemmed from the creation of separate black-local
authorities during the past regime. Most of these utilities were not financially viable, and
their electricity departments struggled with the lack of capacity, few income-generating
industrial customers, and a huge backlog in new connections for low-income consumers.
Many still face severe debt problem, including non-payment from customers. Some have
had problems paying Eskom (Turkson). To continue further, investing in and planning for
networks is inadequate and the security and reliability of supply is being compromised.
These individual distributors are unable to meet the financial demands of the
electrification programme. Tariffs, for the same customer categories, vary widely
between distributors. With so many inefficiencies troubling the EDI, it is thus no surprise
that it is difficult for these utilities to attract skilled, motivated and adequately paid
employees in the industry.
Today, the industry is still addressing these issues broad on by the past regimes, thus the
need for reformation. To support the latter point which emerged many years ago,
Moroeng (2005) reiterated by stating that, there is currently a large number of
municipalities plus Eskom in South Africa supplying electricity to consumers - leading to
more than 1000 tariffs offered to customers. This leads to the restructuring of the
Distribution industry by the National Electricity Regulator whereby Eskom and
municipalities will amalgamate to form six independent, financially viable Regional
Electricity Distributed (REDs).
10 Eskom Act, 1987. Government Printer. Pretoria
52
With inefficiencies came inequalities in the provision of electricity. Little data existed
documenting demand from un-connected households (Eberhard, 2003). The inequality
issue was noticed when many white South Africans, including farms, had electricity
connections while few black households had access, the majority of citizens. This is how
the idea of electrification emerged. Dingley (1990) began to map out the possible
characteristics of a national electrification programme and argued it would be important
to restructure the inefficient distribution industry. Thus, Eskom announced, in 1991, the
target of electrifying 700, 000 new households by 1997, because it had excess electricity
generating capacity at that time11.
At the break of democracy Eskom's social responsibility grew significantly. It produced
97 % of the electricity generated in the country and that represented almost 60% of the
electricity generated on the entire continent of Africa. However, at that time, about 70%
of the South African citizens did not have access to electricity. That meant 23 million
people living without the basic need of access to electricity (Pickering, 1994). Thus
emphasis was given to electrification, improvements in the distribution industry, and the
creation of an independent regulator and the corporatisation of Eskom (in parallel with
reforms in other SOEs) (Turkson).
Eskom is the one utility that operates as a monopoly, that is, a government-owned,
vertically integrated electricity utility, but like many utilities around the world, is
currently undergoing the process of major changes McGregor, 1987; Pickering, 1994;
Cordukes, 1990). This is brought about by an imminent government-driven restructuring
and rationalization (in a democratic country) of the fragmented and inefficient electricity
supply industry (ESI) and future forces such as corporatisation, deregulation,
globalization, denationalization and competition in the industry as well as efficient
customer service, will all influence the direction taken (Salvoldi, 2001; Pickering, 1994).
Regulation in South Africa is determined by the Electricity Act of 1994, which defines
the structures, functions and responsibilities of the Electricity Control Board and thus
11 Eskom (2001). Annual Report. Johannesburg
53
assigns the sole right of electricity supply within certain regional and municipal
boundaries (Pickering, 1994). Despite the governance efforts in place, there is no clear
regulatory regime in South Africa. This leads one to the above-mentioned issue of a
fragmented industry - that electricity pricing is the country is uncoordinated and largely a
product of the South African past government regime/system.
South Africa, along with many other developing countries, now faced renewed calls for
capacity investment. Electricity customers have become used to cheap power from the
last generation of plant expansion whose underlying capital is largely depreciated. New
capacity will inevitably require higher prices and possibly more stringent standards
(Turkson).
The need to attract foreign direct investment and to counter economic sanctions and
pressures that South Africa encounters were identified. To address the above issues,
Eskom has recently embarked on a large scale restructuring exercise concentrating only
on the Distribution business. From the above statement, it is clear that electricity utilities
around the world are not only reforming the distribution sector but also transmission and
generation groups. Currently in Eskom, the objective is to first separate the distribution
business (customer services) from the rest of Eskom (Wires business). Following the
success of the Distribution business, the rest will then follow but it highly unlikely that
the transmission business will in future be reformed. Bearing in mind that this
restructuring (in the Eskom/South African context) is a precursor to Privatization (the
introduction of competition and customer choice of supplier) expected to materialize in
more than a decade to come (Cicchetti, 1995; Cohen, 2002; Salvoldi, 2001).
Eskom could produce electricity at such low costs due to the fact that it is a monopoly
and unfortunately in monopolies, there is little incentive for development of economically
efficient tariffs (i.e. Innovation and service efficiency).
At first glance, the South African Electricity Industry (ESI) has performed well. Eskom
supplies electricity at amongst the lowest prices in the world (see figure 15). There may
54
be specific factors that account for low Eskom prices compared to other international
utilities and there may b little hard evidence of superior efficiency (Steyn, 2001).
From the Electricity Pricing perspectives, the role that is expected from the department is
to ensure that cost reflective tariffs are in place nationwide. This can be done through
rationalizing the current tariff structures as well as to impart this knowledge to relevant
stakeholders. The bulk of this dissertation will focus on the Tariff Design Project
currently in place in Eskom. The following paragraphs will give an overview on tariffs...
2.13. The History of Electricity Tariffs in the South African context:
One expert on this subject, Shirley Salvoldi (2001) stems from the Distribution Electricity
Pricing department in Eskom. Her interests lie in the rationalization of tariff structures
and electricity pricing thereof. According to Pickering (1994) and Mountain (1994)
politically elected local authorities (such as Eskom), or national authority, independently
determine electricity tariff structures and levels. A direct consequence of the latter system
of price regulation is the abundance of tariffs and tariff policies in the country, often
resulting in obvious contradictions in electricity prices between customers in the same
category. Salvoldi (2001) agrees with Pickering (1994) and Mountain (1994) that this
lead to the fragmented and un-coordinated electricity industry that we see today.
Evidently there is a need for rational policies in the future on electricity pricing, however,
it is imperative that such policies are not only rational but implementable as well - having
the end user in mind (Salvoldi, 2001). For this reason, Pickering (1994) has come up with
a list of key area that must be addressed by rationalization, they are; (1) the need for
electrification; (2) the need for tariff rationalization; (3) demands for affordable tariffs;
and (4) the reliance of municipalities (and regional distributors) to provide excess
electricity supply.
55
Following that, Pickering proposed the following electricity supply and pricing policies
in South Africa (1994):
Just as a teaser, the EPRET project team has proposed a democratic process of creating
earmarked for electrification projects on making decisions.
2.13.1.Review of Electricity Tariffs
A very interesting topic formulation has surfaced in a regulated monopoly such as South
Africa, that is, discussion around tariffs and prices in a restructured industry (Moroeng,
2005). According to Moroeng (2005), Distribution Pricing Advisor, properly structured
tariffs and prices are critical to ensure a competitive market survives but at the same time,
having to cater for the poor (in terms of subsidies and electrification).
According to the World Bank policy - as stated in OMS 2.25 of March 1977 - the
determination of electricity tariffs should be based on two major principles. The first is
that tariffs should reflect economic efficiency prices, in terms of the structure and levels
of costs for supplying electric power (Salvoldi, 2001; Moereng, 2005). The second
principle is that tariffs should be set so as to make power utilities financially viable with
an acceptable financial rate of return12.
A survey done by the US Industry and Energy Department (IEN) on tariffs in developing
countries in the 1980s, was conducted in terms of the following criteria; (a) whether
12 A Review of World Bank Lending for Electric Power. Industry and Energy Department, Energy Series Paper No. 2. March 1988.
56
tariffs have been based on long run marginal costs and, if not, what the prospects are for
these countries adopting economic pricing; (b) how tariff levels in developing countries
have changed in constant price terms during the 1980s13; and (c) how these tariff levels
compare to levels in other countries and the average incremental economic cost of power
system expansion during the 1990s in developing countries.
2.13.2.0bjectives of Tariffs
The most significant objective of is that in the short term they recover the allowed costs
to supply customers in the financial cycle. Though, in the longer term, tariffs should
ensure that the recovery of costs from customers is done in the most efficient manner to
ensure a sustainable business promoting stable and predictable prices wherever possible.
This is probably the most significant challenge for electricity rate design and requires an
effective long-term strategy. This strategy should be developed by taking into account
the overall business strategy and should ensure that customer needs and requirements are
always considered.
From Distribution Pricing point of view, tariff rates and prices thereof should meet
customer needs while supporting overall economic efficiency (Moroeng, 2005). On that
note, Salvoldi (2001) and Moroeng (2005) hold the same viewpoint that, the ideal
electricity tariffs rate components should reflect the cost components of the distributor
perfectly in both level and structure. That is, tariffs should cover all costs to supply
customers while ensuring that the recovery of costs amongst customers is done in the
most efficient manner to create stable and efficient prices. For example, where a cost is
time-dependent and variable, the charge should be a time-differentiated variable charge.
However, the process of setting tariff structures, and ultimately tariff levels, is more
complicated than simply following the cost drivers. How customers are charged for the
13 Trends in tariff levels are analyzed in terms of an index in local price terms adjusted by GDP deflators, and an index in US dollar terms adjusted by the UN-MUV index.
57
different cost components depends on practicalities such as costs to meter complicated
rate components and metering and billing system capabilities. Risk, customer needs and
long-term strategies for future sustainability also have to be taken into consideration
when implementing new tariff structures.
2.13.3.Policy making approach
In the absence of clear and agreed upon national economic and developmental policy
goals for South Africa, several project groups have come up with common and accepted
electricity pricing principles:
• Tariffs should provide the means to recover adequate revenue so that the business
remains profitable and customers can receive an acceptable level of service.
• Tariffs should promote overall economic efficiency - electricity should be priced in
such a way that it encourages sustainable, efficient and effective usage of electricity.
• Tariffs should be fair, equitable and transparent - where cross-subsidies exist between
customers they should be justifiable and explicit (as well as access to energy services
and the fulfillment of basic needs).
• Tariff rates should accurately reflect the cost to supply different customer categories
and, where prudent, tariff structures should reflect the nature of costs.
• There should be stability in tariffs in order to facilitate customer choices.
• Tariffs should be sustainable both environmentally and financially.
• There should be a suite of tariffs, which give customers a choice of the most
affordable tariff based on usage patterns.
The above, however, may be in conflict, e.g. tariffs cannot be cost-reflective and at the
same time have subsidies for affordability purposes. All the above principles must be
balanced against the needs of all the stakeholders to develop the most acceptable
compromise. In the South African context, the most important goal from the above listed
58
is "achieving a more equitable position" but the key policy for electricity pricing is to
maximise access to the service (Pickering, 1994).
Pickering (1994) attempted to list the policy criteria for evaluating household electricity
tariffs, they are; Efficiency in location; Equity; Simplicity, Meeting revenue requirements
- crucial for long-term viability of the industry, and other social, political and economic
objectives - the redistribution of wealth and the reduction of political conflict around
electricity. The designing and selection of tariffs will not be discussed at this point in
more detail but in the next chapter of this dissertation.
2.14. Conclusion/ Way Forward
Electricity supply industries worldwide have undergone various reforms, some more
successful than others. The choice of the restructuring model primarily depends on the
specific characteristics of the country. Past experiences show that competition, both at the
generation and retail sectors, are favoured, especially with the view of enhancing
consumer welfare. However, what is important is in each market is getting the structure
of the markets right before introducing competition. Thus, the South African government
should look at realities of the industry and employ a cautious approach by developing
policies that are clear and that send correct signals to investors.
Not only is the current restructuring initiative in this young democratic country a direct
consequence of globalization but a necessary process that must take place to ensure that
electricity supply sector is efficient in the future, that is "always having the customer in
mind". Reforms are needed in all the major regulations affecting electric utilities. The
above discuss has taken one on a journey of discovering exactly what restructuring of
electricity entities entails.
Past experiences, especially from the UK and US reform experiences have been
examined and thus the pros and cons of their experiences were "put under a microscope".
59
The discussion clearly showed that there is no straight or perfect form of restructuring the
electricity industry. It seems each country or electricity body/ regulator has their own way
of going about restructuring their industries according to their needs, types of customers,
way of life and economic status (this includes amount of investment coming into the
country).
Again, there is no perfect reformation as seen in this discussion that reformation of an
industry can fail or succeed according to the role players and the buy-in they receive from
the government and customers. Where a government or a public electricity utility is
pushing for restructuring of the utility without the involvement of the customers and
giving them a platform to voice out their concerns, the initiative would fail dismally. This
is because such an initiative has high economic and social impact on the entire country
where the reformation is taking place. The public utilities going into restructuring should
properly research their market, especially their types of customers and see how they can
accommodate them and have them in mind (as end users) during the process.
Ideas and perspectives of different authors, observers and researchers have been shared
and thus it is up to Eskom to choose the most appropriate route for them. It seems the
most relevant choices are total deregulation or separating generation from transmission
and distribution and deregulating generation.
In the South African context there is a lot of cross-subsidization that is expected from the
public utility, Eskom. This restructuring is expected to take another decade - allowing
time for flaws during this period. As the South African Electricity Distribution Industry
embarks on this major restructuring (separating distribution from transmission and
generation groups) - ahead of the Electricity Supply Industry, it is hoped that from the
above-mentioned experiences, they will come up with a process that is truly South
African and suits the county's context. The EDI can learn a lot from past reform
experiences around the world, especially UK model.
60
In summary, in the South African Electricity Supply Industry, Government wishes to
(DME, 2000):
• Keep future electricity prices as low as possible - but economically sustainable. The
success of the latter depends on allocative (correct allocation of capital in terms of
investment) and productive efficiencies (competition in generation results in
improved productivity).
• Unlock economic value - government wishes to increase financial and economic
returns from its state-owned enterprises. Government can restructure the ESI in order
to optimize the value of the industry financial returns it will receive.
• Broaden economic ownership - South Africa needs to widen the participation of the
majority of its people in the economy - promotion of black-owned IPPs.
• Increased foreign direct investment - South Africa has inadequate domestic savings
and needs to attract international capital into fixed domestic investment to support the
economy.
This dissertation will thus concentrate on the South African Electricity Supply Industry's
restructuring process that began in 1997 and mostly concentrating on the future tariff
structures that will come up following this process. The dissertation will not attempt to
prescribe how Eskom should be regulated or who should regulate it but to keep track of
the current restructuring process, its viability, impact on stakeholders and how long it
might take to reach stability in terms of tariff structures....
61
3. CHAPTER 3: RESEARCH METHODOLOGY
3.1. Title
The title of this research was changed. The modified and preferred title is now: An
evaluation, investigation and recording of the design and implementation of the Cost-
based and Tariff Design training programme to align Eskom Distribution for EDI
restructuring
3.2. Background
As the title states; this research is an evaluation of the Electricity Distribution Industry
(EDI) restructuring model. As this research progressed, the scope has been narrowed
drastically. Instead of concentrating on the EDI restructuring model holistically (with the
aid of the EDI Blueprint), the focus in this chapter will be on the implementation of the
Cost-based Tariff Design Course, which is being implemented, nationwide throughout
the industry. This course forms part of a Tariff Alignment and Cost Based Studies Project
that officially launched at the beginning of 2005. The Eskom Distribution Electricity
Pricing Department is the custodian for this project - responsible for the planning,
sourcing and implementation of the project. Thus, this group welcomed the challenge of
transferring their knowledge on Cost-based Tariff design, which they are very familiar
and comfortable with. Basically, tariff design and cost of supply studies are integral parts
of their everyday work. This team sparked the recognition of this competency at the NER
and EDI levels and suggested that knowledge transfer in this domain is critical for the
survival of the future REDs. The teams' willingness to make time available over and
above their normal work load, building this capacity throughout the country shows their
dedication to their work and to Eskom; mostly it shows enthusiasm and pride in their
collective job outputs. As this chapter unfolds, it will be clear that this research is based
on a natural setting, thus it falls under the observation data source.
62
3.3. Scope of this research project
To evaluate and analyze the progress of the Tariff Alignment and Cost Based Design
Project as a response from the Eskom Distribution Electricity Pricing Department to
document these operations in aim of addressing the EDI objectives in providing cost-
reflective pricing with transparent subsidies. This research will only focus on phase 1 of
the project, the Competency Building phase, which is also, the most important as it lays
the foundation for the project holistically.
3.4. Out of Scope
This research will not look at either the impact or influence that the Transmission or
Generation groups of Eskom or of the Electricity Supply Industry (ESI) have on the
current Electricity Distribution Industry (EDI) restructuring as this is out of scope for the
project. The research will not focus on all phases of the Tariff Alignment and Cost-based
Design project outside of the workshop environment. It will thus not focus deep into the
actual calculations done in the process as well as the data gathering processes that occur
during the phases leading to the desired tariff products.
3.5. Introduction
This research would not make any sense if one did not consult with the various EDI
restructuring bills and proposals available in the industry. It is interesting to note that the
restructuring process has been looming for almost a decade now as is mentioned in earlier
documents on the electricity industry. The most prominent of these being the Energy
White Paper compiled in 1998 by the DME for industry use and understanding. This
document stipulates the important processes and challenges currently facing the industry
as well as the vision (way forward) for the years to come. The document suggests a "turn
around" strategy for the industry, moving away from the Apartheid era and mending any
discrepancies that the current industry has to manage without putting any blame, the aim
is for a better future for the electricity industry as a whole, which should contribute to the
wellbeing of the country's economy.
63
"Energy is the life-blood of development" and "South Africa is a country endowed with
abundant energy resources"14 these were the words proudly expressed by the former
Deputy Minister of Minerals and Energy (Mr S Shabangu) and the Minister of Minerals
and Energy (Dr P M Maduna) respectively. Indeed this is a land rich in natural resources
that should be utilized sensibly to preserve our environment. These energy sources
include; fossil fuels such as coal, uranium, liquid fuels and gas. Proper utilization of these
sources can help uplift the socio-economic development of the country as well as
providing the necessary infrastructural economic base for the country to become an
attractive host for foreign investments in the energy sector. In terms of improvement,
energy can help to address the poverty facing the previously disadvantaged in this
country (especially those living in the rural areas) and increasing access to basic needs so
as to allow people the freedom of self-development. This leads to the issue of sustainable
development and how each citizen of this country should be equipped to sustain their
family efficiently through better energy use in the future.
To reinforce the latter, the former minister also declared, in the Energy White Paper
(1998) that "Government is committed to the promotion of access to affordable and
sustainable energy services for small businesses, disadvantages households, small farms,
schools, clinics, rural areas and wide range of other community establishments".
Following such a pledge, Eskom had to ensure that its future policies and procedures are
in line with government's obligations. However, the above-mentioned commitments by
government cannot be done until the EDI is reformed. Therefore, Eskom Distribution
realized the importance of meeting the customer needs, ensuring that they are catered for
by availing electricity to all citizens at affordable prices and at the same time increasing
the standard of living for all citizens. The latter was a highly socialist viewpoint and it
would be interesting to see how feasible this is in light of the new restructuring bill -
demanding cost-reflective tariffs.
14 Department of Minerals and Energy. White Paper on the Energy Policy of the Republic of South Africa. 1998.
64
The following is a detailed account of some of the challenges facing the distribution
pricing business area that need to be addressed with the restructuring of the EDI. Before
making the final proposals to address the problem, Cabinet consulted with some
stakeholders and finally adopted the Electricity Restructuring Interdepartmental
Committee's (ERIC's) recommendations in spring of 1997 and incorporated them into
the June 1998 "Draft Energy White Paper". The following concerns were raised:
• Approximately 40% of all homes in South Africa, and the majority of schools and
clinics do not have access to electricity.
• The many distributors (Eskom plus Municipalities) are causing an imbalance in
the EDI system mainly due to the fact that many Municipalities are not financially
viable, resulting in low efficiencies, high costs and wide disparities in tariffs (that
is thousands of tariffs nationwide). The aim of rationalization is thus to drastically
reduce the number of distributors.
• The EDI continues to experience high levels of non-payment (via domestic
customers) coupled with electricity theft, resulting in increased arrears and
payment defaults.
• Electricity is used inefficiently and ignorantly, thus customers are wasting these
scarce energy and capital resources.
• Despite all the above-mentioned challenges, South Africa has to maintain the
competitive advantage of low, stable and cost-reflective electricity prices as well
as achieve environmental sustainability. This because of the government's goals
to maximize the potential for adequate, reliable, and low cost electricity to serve
the people and industries in the country. Thus, the objective is to improve social
equity by specifically addressing the energy requirements of the poor.
Following the proposal made by the cabinet (ERIC report, 1996), the South African
government approved the restructuring of the EDI through the EDI Holdings Company in
the interim before financially viable, independent regional electricity distributors (REDs)
are in place. The ERIC report (1998) also proposed that these REDs be subsidiaries of the
EDI Holdings Company until they are independent. However, this transition is not
without complexity as it requires that the Eskom Distribution division be separated
65
completely from Eskom Holdings and be merged, with municipalities to form the six
independent REDs.
The above proposal lead to the splitting of the transition process into phases15. Phase 1:
Establishing the EDI Holdings Company and the subsequent appointment of the Board
and key officials (see Figure 8) - as discussed, EDI Holdings Company will oversee the
separation of the Distribution group from Eskom, parallel to the alignment of its
operations (as well as Local Authorities') to align with the predetermined REDs. Phase 2
Ring fencing of the Distribution business. This includes the transfer of municipal
electricity distribution - this is where Eskom's Distribution operations, assets and
activities, as well as those of Local Authority in the REDs will merge and became
subsidiaries of the Holdings Company (see Figure 9). At the end of this stage, the staffing
of the RED management board should have begun as well as the finalization of the initial
regulatory environment for the REDs. Phase 3: RED establishment: The disbandment of
the EDI Holdings Company and the formation of independent REDs - once the
amalgamation of local authorities and Eskom Distribution have proceeded and the REDs
are healthy and viable, the Holdings Company will be disbanded and each RED allowed
to mature independently (Figure 10). This is coupled with the phased transfer of
businesses to the REDs. Following their establishment, the REDs would remain under the
control of the Holdings Company for a further 3 or more years, and weaker REDs will
receive transitional financial support. All six REDs are meant to achieve financial
dependence well within 5 years after their establishment.
15 Electricity Restructuring Inter-Departmental Committee (ERIC), October 1996, Meeting South Africa's Electricity Distribution Challenges, Preliminary Report on the Restructuring and Financing of South Africa's Distribution Industry.
66
EDI Holdings Model
Phase 1
National
Government
ESKOM
Local Government
Service Authority as per Constitution
ESKOM Enterprises
Generation Transmission
V National ED I
Holdings Company
R R R R n Regional areas with:-
- Eskom Distribution merged with municipalities on the one hand ,
- licensed distributors and municipalities grouped on the other hand
Figure 8: Phase 1 - Establishment of the EDI Holdings Company
EDI Holdings Model Phase 2
National
Government
ESKOM Service Authority as Local
Government^ - ' per Constitution
V
ESKOM Enterprises
Generation Transmission National ED I Holdings Company
R E D RED RED RED
Figure 9: Phase 2 - Transfer of municipal electricity distribution
After examining the many reports, documents, proposals and blueprints (mentioned
earlier) on the EDI restructuring, the Eskom Distribution Electricity Pricing department
team, with the support of the EDI Holdings Company, analyzed their position in the
business to come to the realization of a need for a Tariff Alignment and Cost-based
project.
To further motivate their cause, they identified some key issues which they considered
required immediate attention and thus should be addressed in anticipation for the
implementation of future REDs:16:
• Eskom and local authorities (per RED boundary) to begin discussions on the move
towards a common tariff framework as required by NERSA.
• Once a common ground is reached, it is imperative that a generic tariff design
methodology exists throughout the country
• There must be alignment/understanding of this generic methodology - that calls for
combined training sessions with all RED stakeholders.
'6 Tariff Alignment and Cost based Design Project Overview presentation, June 2005. Half-day introduction Module: Understanding the EDI environment and Simulation introduction.
74
• Competency Building and Skills Transfer must take place during this process.
• With all the above attended to, it is important for the business leaders to ensure that
there is retention of the core critical skills (whether trained at the workshops or
acquired from experience) as there is already a void for such skills in the entire
industry.
During the "buy-in" or the marketing phase of the project, the latter were presented to all
stakeholders during introductory sessions. During these presentations, the Eskom
Distribution Electricity Pricing project team pledged to find solutions to address the
above-mentioned key issues. Following from the above-mentioned key issues to be
addressed by the proposed pilot project, the Eskom Distribution Electricity Pricing
project team offered the following stance to the industry to address these issues:
The Eskom Distribution Electricity Pricing team will assume a stance where they assist
regions in the development of a RED tariff restructuring plan (Tariff Alignment
presentation, 2005):
• that will consist of:
• Cost of Supply (COS) studies per RED, in accordance with the procedure set
out in NRS05817 standard
• RED tariff structures - appropriately designed and based on cost of supply
• A RED Tariff Implementation Plan taking cognisance of the impact of the
new tariffs on customers.
• that will lead to:
• Competency building and knowledge transfer to the RED employees
• Better understanding of the fundamentals of tariffs
• A better understanding of data necessary to design tariffs per RED
• The latter should thus lead to better customer service delivery in the long run
17 NRS058 standard is a document that sets out the cost of supply methodology for application in the ESI.
75
3.10.2.Rationale for information sharing
The Eskom Distribution Electricity Pricing team has to date been working independently
on ensuring tariff structures are in place annually. This entails; reviewing of tariffs, cost
of supply studies, collection of data from all regions, and lastly, presenting their
proposals (on changes, modifications or price structural changes) to the National Energy
Regulator of South Africa (NERSA). This, as one can imagine, is a daunting task for a
small group of intellects to undertake, thus the team has been under a lot of strain due to
the lack of knowledge in the business, that is, the lack of resources who know the
fundamentals of this process. The latter scenario has been in place for too long, hence the
decision to re-distribute this scarce knowledge as wide as possible in the distribution
industry. According to Compass (an Organisational Development (OD) specialist), OD is
concerned with trying to build capacity within a certain group of people to raise their
morale and the feeling of recognition in an organisational setup. This reiterates the
objective of retention of employees through this training intervention. From the latter
discussion, it is clear that this intervention has a much broader future vision that will
indefinitely benefit the entire country financially and will align with global approaches.
3.10.3.Summary of all Tariff Alignment Project Phases (pilot)
Before one continues to elaborate on the focus of this paper, the Cost-based tariff design
course, it is necessary that one also reflects on the entire project to see holistically how all
the systems relate and interact with each other (as well as focus on the sample
population).
There are several steps to be followed in this project (inclusive of the simulations course)
for one to arrive at the "end-state". As we embark on this journey into the Tariff
Alignment and Cost-based Design project, one should bear in mind that the project is
operating under the notion that the EDI restructuring "end-state" is a fully rationalised
distribution business in South Africa. The latter scenario requires the delivery of tariff
design knowledge and training thereof throughout the country to ensure that these skills
76
are available per RED and can be utilised where necessary. This will allow for efficient
governance of future distributors, and one should realise that the implications of such an
intervention could in turn, contribute to improving our economy. A bold statement to
make, though it is based on the concept that the distributors will be financially viable in
the (near) future, without financial assistance from government. This implies that the only
revenue income distributors will receive would be through customer payments, which
would be managed independently (and efficiently), ensuring that customers are constantly
satisfied with services received.
Below is an overview of the Tariff Alignment and Cost-Based Design pilot project over a
five-year period (not absolute but subject to change) - see Figure 11. Following that is a
summary of each phase together with its expected outcomes. As the process progresses or
evolves, one will notice that the complexities of the project also increase. As the project
evolves, the following become apparent; the expected impact in future tariff planning and
not forgetting the impact of the ultimate RED structures on this project (success and
completion). This can only be determined as soon as a final decision (expected March,
2005) is in place on RED boundaries and confirmed through the legislative framework
for RED formation18.
City Power - Johannesburg, 2005.
77
Phase ^ project Launch & Tariff Simulation
Phase 2 Data Gathering and formatting
Costing
Rate Design Phase 4
Tariff Restructuring Plans Phase 5
Figure 11: Tariff Alignment and Cost-based Design pilot project overview
As stipulated in the above-figure, the Tariff Alignment and Cost-based (pilot) project is
separated into five phases as stipulated in the above Figure 11. There are essentially, two
elements; Competency Building and RED Tariff Design and Implementation. Below is a
brief description of each element with its different phases. This will clearly highlight
what each phase entails. For the holistic view of the project and its elements, refer to the
attached (Annexure B & C). The following information was collated from various
stakeholder management workshops held by the Eskom Distribution Pricing Department
team to introduce the concept and get stakeholder buy-in and support.
• Those that are not directly involved in tariff design, pledged to be more appreciative
of the pricing department, data gathering, cost of supply studies, and so on.
4.1.4. Future possibilities to address concerns
The following are the aspects are out of scope for this pilot project, thus could not be
addressed (at this point) but will be taken into consideration in future:
• This is a highly advanced course, thus there are certain pre-requisites that each
delegate should go through before attending these workshops. Firstly, the targeted
audience should be at a certain educational or practical level. Obvious knowledge
required includes; the use of a calculator (number converting etc), advanced or
intermediate excel knowledge, knowledge of statistics (using excel), detail
orientation, analysis techniques.
• The distribution of the software package to each individual to be used to apply tariff
design principles learnt upon return to their workstations. (This cannot be done
currently because this model is still under construction and is not yet perfected -
reviewed after every course (as discussed) and all copyrights and intellectual property
of this product belongs with Distribution Pricing until direction is given through EDI
Holdings Company).
• The attendance of the workshops by all members involved in the cost of supply study
per region or entity.
• Group dynamics - the training team has no power to control the delegates' behaviour
towards employees from other organisations or their willingness to work in a group or
their level of comfortability to work with people from different organisations.
096499 101
4.1.5. The learning outcomes that evolved as the workshops progressed
There is a belief that an intervention of such magnitude cannot just go by within an
organization or a certain industry without having some sort of impact on its subjects: that
is a paradigm shift (mindset) amongst the participants (as well as the training team itself).
Below are some points that should be highlighted in the business following this
intervention:
• Fellow delegates will learn to work independent of head office assistance to design
their own tariff structures in the future.
• Participants experienced a culture shock having to work with employees from other
competing entities. However, most of them quickly adjusted (had a shift in mindsets)
and managed to cooperate with each other during these Tariff Design workshops.
• The Pricing experts or SMEs have learnt throughout this whole project (from
conception phase up to now) to share their knowledge generously with others
(without hesitation) in turn empowering the participants.
4.2. Discussion Overview
The last chapter focuses on the Competency Building phase, which is the foundation for
the entire Tariff Alignment and Cost-based Tariff Design (five-year) project. The project
consists of other phases that have to be completed. Following the feedback received from
participants from all regional workshop interventions, it is thus appropriate to analyse
these results in order to establish the validity and success of the competency building
implemented. From these results, recommendations should naturally follow. When
exploring the comments, one has to bear in mind that this feedback is not only one-sided,
from an Eskom perspective, but from all over the industry, which includes;
Municipalities as well as the employees from the regulator who attended the workshops.
102
From the feedback, it is clear that all regions that have undergone these workshops have
been impressed by the workshops. Some good comments were received. Both the Eskom
Distribution Pricing team and consultants have put in a lot of effort to arrive at the final
product presented to the participants. This seems to be well accepted by the audience.
The analysis of these comments when executed by the project team raises their morale
because they realise the good that their project is imparting throughout the industry and
the amount of knowledge transfer that actually take place with their interaction with
participants per region. All this realisation become reflection exercises that lead to
continuous learning not only for the participants who are there to become knowledgeable
in the tariff design subject but also the "training team" when updating and continuously
revamping the simulation programme taking each feedback comment into consideration.
4.3. Discussion on Workshop Feedback
The overall feedback received was positive and one gets the impression that delegates
eventually reached the level of excitement of the team, as they were aware of the benefits
of these workshops beforehand. Initially, on arrival to the training courses, the
observation is the non-motivation of the target audience because they somewhat felt
forced by their management to attends these workshops. However, as the days
progressed, most participants began to realise the relevance of this course as they viewed
themselves in the value chain - the input and impact they can have into such a length
process. Participants were thus surprised of how much learning they were experiencing -
because the initial attitude was that "one has been in Eskom/ municipality for a long time
and there is nothing one does not know about the distribution industry". As expected, not
all feedback can be positive, thus there were some negatives that balanced out the
positive - see "response to feedback queries" below and the data collection chapter.
From the commentary and feedback, it is evident that delegates found the course
somewhat complex and challenging even for those employees who have previously been
exposed to tariff design and came with a "know all" attitude! This highlights that some
103
learning took place during the workshops that proves that knowledge was transferred as
expected and thus the workshops were successful for all involved.
According to the introductory presentation, the following are the skills required for one to
survive these intense workshops and beyond (i.e., at their workplace):
• To run the model,
o a fair knowledge of Microsoft Access & Excel
• To draw out data for various analyses or make modifications to the Model
o a very good knowledge of Microsoft Access & Excel
o a very good knowledge of Data Structures, Databases and Data Queries
• Participants should have good analytical ability
The logical conclusion here is that, individuals who will in future be involved in tariff
design and cost of supply studies ought to be the very best (in the business) with the
highest experience and acknowledgements, understanding and utter most respect of the
Distributions business.
4.4. A look at the "training team" and reasons for their success
The set of "training groups", that is, the core pricing team plus the consultancy team,
manage to work together in synergy to generate such a well presented simulation
programme. The writer, after experiencing the training workshops first hand would like
to add that she was impressed by the overall course outlook both from the simulation and
facilitation sides. The success of these workshops is not only accredited to the fact they
work well together. In order to maintain the momentum and success of the workshops,
the training team carefully analyse and dissect the feedback received from fellow
participants after each 5-day training session. The simulation programme and overall
workshops are thus improved making sure to take the issues raised by participants into
consideration for the next training session. From this feedback, the team assesses where
to improve the course so as to meet the "customer" requirements as well as to close any
gaps observed during the workshops, particularly software inconveniences.
104
This is necessary to ensure that the programme is constantly improved and enhanced for
the next intervention. This is a continuous process that will take place until the team is
satisfied with their product and believe that it is professional and presentable. This is
most likely to happen after the pilot phase (envisaged to be end of 2005) so that it can be
distributed in the industry for utilisation. These updating exercises have thus become
learning points for the team, especially the Pricing team, in terms of enhancing their
facilitation skills and being open-minded by accepting and taking into consideration
participants' critics and comments (seeing that they are colleagues under normal
circumstances). This project stems from the Retail (training) project that set out to
empower regional staff and to ensure that the target audience receives training modules
that have relevance to the business, the efficiency of training and that ultimately value is
added to the overall business. Thus the Tariff Design training addresses these objectives
and is in line with the overall intent.
Below is some discussion and analysis on the feedback "Evaluation forms" and
recommendations to the team. To look closely at the requests, suggestions and general
comments that came through following the attendance of each course per region.
However, one is of the opinion that some of these requests seem unreasonable given the
amount of effort that goes into preparing just one five-day workshop session and thus
would like to discuss and explain the implications of implementing some of these
"customer" requests from the project team's perspective:
4.5. Response to the Negative Feedback Queries
Having smaller working groups during the workshops - this would mean allocating (in
general) smaller numbers of participants attending workshops per session. Currently, the
stance from the EDI Holdings Company was to involve as many people as possible with a
role to play in the tariff design process per region, with the hope of building a widespread
understanding of this aspect of the business. Thus the request can only be done in the
future when the future of this programme has been determined by the EDI Holdings or
future RED Chief Executive Officers (CEOs).
105
The allocation of computers to every single delegate attending these workshops: In
order to execute this request, the budget would have to be discussed at length with the
sponsor or this would be unreasonable and difficult to put into practice! However, this is
a good idea, which might well be feasible. This request requires the training team invest
on about ten laptops. If the proposed laptops are duly in place for utilization during these
workshops, or entire project, they should be updated constantly with the latest simulation
model, the correct software package that should be compatible with the simulation model.
Implementing this idea might cause the training team to work more professionally and
efficiently with minimum technical hiccups during the workshops. These computers can
thus be loaded with the simulation model beforehand instead of wasting time at the
beginning of the course loading the participants' computers.
An alternative and more drastic option to increasing the project budget to cater for the
buying of laptops would be, for the business to make it a ruling that all persons involved
in Cost of Supply studies are presented with a laptop. If this becomes the standard in the
industry, then it would make it easier for the training team and for efficiency of the
workshops, as each participant would bring their laptops along which can then be used
during the workshops. This essentially shifts the budget elsewhere in the business and
does not put too much strain on the training (and Tariff Alignment and Cost-based
Design project) budget. This certainly has long-term consequences and rewards to the
fellow cost of supply personnel who will utilise these "tools" in their workplace daily.
The length of the workshops: it is not a good idea for the training team to allow
participants to influence them on shortening or lengthening the allocated workshop time
span. The allocated time is sufficient because it was trialled and tested before the
beginning of pilot project to ensure that the participants get all the required information
during these workshops and return to their workstations with a sense of achievement
(with grasping of concepts) and some satisfaction - that these workshops are worthwhile.
Thus, no more or no less time should be allocated, if delegates feel that it is not enough,
they should consider that the follow up (coaching) sessions would reinforce the
knowledge. It has been acknowledged that all delegates will undoubtedly need on-job
106
coaching/ training for a certain time period (completing of phase 1 to phase 5) before they
can become tariff design and cost of supply experts, this has been built into the plan
subsequent to the Competency Building Phase (see Project Plan Figure 17).
4.6. The overall learning experience as an Organisational Development exercise
The overall learning outcome was in observing the evident paradigm shift that occurred
amongst the participants as they realised their fortunes of being identified and nominated
to be part of this pilot group to receive first hand and professional training. Employees
who were invited to these interventions were not all directly involved in tariff design in
their regions but came from both the Retail and Wires businesses of the Electricity sector.
The goal of the Competency Building phase of the project was to prepare and present
Tariff Alignment and Cost-based Design Workshops to all Engineering (Wires) and
Customer services (Retail) employees as permitted and recommended by EDI Holdings
Company. At this point (pilot phase) the audience comprised a wide range of role players
in the tariff design process (as mentioned previously) not just those who will eventually
(physically) partake in the development of regional/ entity/ RED tariff structures.
Due to the anticipated merger of Eskom Distribution regions with municipalities in the
future REDs, there was a willingness to tolerate other organisational cultures which made
it easier for participants to work together during these workshops. EDI Holdings, as the
project sponsor had proposed that these interventions encompass all the role players or
stakeholders of the future REDs as they are responsible for managing all aspects of the
EDI restructuring process. As previously discussed, most of the information used to
design the training programme was extracted from the Eskom Distribution Electricity
Pricing Department to produce a reasonable, logical and practical programme that can be
utilised for capacity building in the distribution industry. This is a new challenge for all
RED role players (Eskom and municipal employees) because there has previously been
very little interaction regarding tariff design between the different distributors in the
country. This is one of the paradigm changes that the participants have to undergo.
107
According to the Action Research Model , the core processes in this intervention
included; political and technical systems while the core competencies involved were;
team work (consultants and pricing team), attitudes/ paradigm change, problem solving,
skills transfer, innovation and technologies. Political, economic and cultural forces also
impact on the interventions.
In essence, this project is a type of Organizational Development (OD) or change
management initiative as it is in place to change Distribution employees' perspectives
about designing tariffs. It also aims to equip the person who should be accountable for
this process in future REDs. The learning outcomes from the training team itself were
significant. The realization that the common Retail or Customer Service employee (who
constantly liaises with the customer directly or indirectly on the bill and tariffs charged),
is unaware of the complexities of the tariff design process. One is however, in two minds
about this issue. On the one hand it may be that the employees have been ignorant in their
comfort zones" (going about their own business) or on the other hand, some blame should
be directed to the Business Structure (vertical integration) which has not given enough
exposure to these employees. To address the above issue, leadership should step in there
ensuring that they flatten their management styles to create more friendly and democratic
working environments.
In one article written by the University Associates23, it was stated that Organisational
Development companies or departments are usually called into an organisation to come
up with a change intervention. The first step is to assess an organisation's needs by
researching the issues surrounding them and then guiding the organisation to the
appropriate technique that will result in a positive change. However, in this particular
project, the project team had already done all the above work beforehand as they took
accountability for the smooth operations of these workshops. This motivated the team to
come up with the tariff design computer simulation that is in place today. The exercise of
putting the programme on "paper" so to say was a case of extracting the minds of the
22 Notes on Search Conferences - OD reader, Leadership Centre. University of Kwazulu Natal. 23 University Associates article. Retrieved 1 August, 2005, 2005,
108
Eskom Distribution Electricity Pricing team and thus the intellectual property
accumulated through this project belongs to Eskom. {For the latter reason, note that
information being disseminated in this research is confidential due to the sensitivity of
procedures stipulated and copyrights issues.)
This leads one to the concerns raised by Organisational Development connoisseurs ; that
OD is only as effective as the skilled professionals undertaking the training. However, as
discussed, the Eskom Distribution Electricity Pricing team are available at all times
during the workshops so as to avoid the failure of these interventions by handing over the
programme to external consultants and not following through with the implementation.
Fortunately, it was acknowledged earlier, that such negligence in respect of one's
intellectual property could cause major hiccups in the success of the product. One is thus
in favour of the dynamics of this project team and how each role player executes their
role in the project efficiently, eventually interacting efficiently with each other to create a
winning recipe. In support of the latter, it would be interesting to look at Dr Trudy
Sopp's commentary that "The skill of the professional can leave an organisation in
better condition or unfortunately, in a less desirable state than before the intervention
was implemented.'''' Thus with the level of skill and professionalism exercised during this
project, there is security around the endless use of the very best skilled experts in the
business (until they decide otherwise).
4.7. Discussion on the success of the workshops
As discussed in my assumptions in the last chapter, workshops are more effective as the
mode of knowledge transfer because they are more interactive. The feedback received
from the participants clearly indicates the learning that participants experienced through
these innovative as well as interactive five-day sessions. A collaborative teaching
approach was taken during these workshops using both active and passive approaches.
That is, lecturing, presenting and learner engagement - constructed through participants'
dialogue and interactions. According to the intellectuals on workshop design, it appears
24 OD Debate: reflecting on organisations and development. Vol 7. 3 June 2000 25 Sopp, T. Interview on Organisation Development. 2004.
109
that, workshops that have a balance between passive and active learning tends to appeal
to a wide range of participants because the different forms of learning changes the pace of
the workshops, thus maintaining interest, and accommodates a wide range of different
learning styles. In a rich learning environment, facilitators recognize the central role of
creativity and engage students in exploring ideas and issues, challenging traditional
assumptions, solving problems, and constructing knowledge rather than just memorizing
it26. The latter just about summarises the aim and expected outcomes from the Tariff
Design workshops. It seems that, because participants were given a chance to freely
express their abilities to produce the most sensible tariffs taking their group member's
opinions and experiences into cognisance.
The workshop facilitators, the Business Today team, plan, organise, co-ordinate,
facilitate, control and structure the workshops. In other words, they are responsible for
the whole workshop process, at the same time, involving the Distribution Electricity
Pricing project team. The latter thus contribute all techniques (technical) needed to
support the process. The facilitators must thus be natural motivators to encourage and
influence the participant group to work towards a common goal.
A crucial factor that contributed to the success of these workshops was the personality
and style of the facilitators. An effective facilitator seeks to understand participants'
backgrounds and point of view, and has the expertise to balance responding to
participants' needs and moving a workshop forward. Above all, an effective facilitator
conveys genuine enthusiasm21. The Distribution Electricity Pricing project team were
fortunate enough to collaborate with such professional, humble and approachable couple
of witty facilitators who were warm towards the students. According to the workshop
planner guide, the relationships developed between the facilitator and the participants and
between the participants themselves are very important. These relationships structure the
26 Taken from a website for "The Art of Teaching the Arts" - Workshop 5 Creating Rich Learning Environments. 27 Workshop Planner. Activity 1: The role of the Facilitator. www.unesco.org/education/DTT/dtt/plan 01 lbod.
On the issue of the proposed multi market model (MMM), I would like to argue from a
socialist's point of view; one can thus not ignore the president's speech on the two
economies in South Africa. The South African society is characterized by socio-economic
dualism: a dominant First Economy that is at the cutting edge, globally integrated and
with capacity to export manufactured goods, services and primary commodities.
Alongside this economy is another that is marginalized, exists at the edges, consists of
large numbers of unemployed and the "unemployable", and does not benefit from
progress in the First Economy. (Sic: this essentially describes the most common types of
citizens in this country; that is, higher class with economic power and the poverty
stricken lower class). The Second Economy denotes the condition of the modern,
industrial economy. These are people without steady income based on their own
economic activity. They are households or individuals with no steady employment and
without an income-generating asset of their own that can practically be "realized" as
capital or collateral3.
ANC National General Council, Discussion Document, 29 June - 3 July 2005. City Power - Johannesburg. The Second Decade of Local Democracy: Towards Accelerated Service
Delivery.
120
The proposal thus far only recommends wholesale competition where multiple generators
compete to sell electricity to the large customers (utilizing greater than 100 GWh). This
proposal also recommends that prices be set by the market (at the generation level);
however, tariffs should be regulated for the Distribution business on a cost-of-service
basis (Galen, 1998; Cavanagh & Sonstelie, 1998). This means taking service directly
from Eskom and bypassing municipal authorities or REDs. Galen (1998) in his analysis
of the South African Electricity Supply Industry also states that, the latter proposal
acknowledges that large customers should not have to pay the above-cost tariffs presently
charged by municipalities, and they should have access to adequate and reliable supply.
The high costs offered to large customers are to some extent, caused by cross subsidizing
other essential services. This is a large factor in terms of municipal operations and is
suggested that this requires significant financial restructuring and ring fencing, prior to
amalgamation and RED formation. Eskom Distribution Electricity Pricing Department
has already begun giving large customers the flexibility to choose their suppliers by
introducing a cost-based, unbundled and transparent tariff called the Wholesale
Electricity Pricing System (WEPS) where a customer has a choice of receiving a
breakdown of the tariff components they are charged for in their bill stipulating all
charges as well as subsidies they contributed to. This specialized service is to ensure that
the tariff reflects the underlying cost of service and that it is sufficiently unbundled so
that customers do not pay for facilities, which are not part of their service package. Most
importantly, it is to ensure that distribution customers have the best quality service to
minimize complaints about Eskom's efficiency.
Retail competition is not being considered now, but if one examines the distribution
industry closely, it will be evident that this disorder in tariff disparities and especially
municipalities not being able to pay Eskom for services, is not only caused by
mismanagement by the previous regime but also caused by the non-payment of
residential customers. These customer categories make up a very small percentage of
Eskom's total revenue but are the bulk of customers that are under the jurisdiction of
municipalities. This is the root cause of the number of ailing local authorities that the
121
industry is facing, leading to the statement that in the words of the Minister of Minerals
and Energy, the South African EDI is in "financial crisis".
The underlying message here was that "the EDI as a whole is fragmented and should be
restructured as it is not good for the rest of the ESI". Many of the municipalities are loss-
making entities as a result of inefficiencies, lack of capacity, theft, and a history of non
payment. It is thus not surprising that the root cause is at the "grass-roots", the customers
serviced by municipalities. Most of the Eskom sales do not come from these customers
but municipalities are legally bound to service them, something they solely cannot
accomplish because of revenue tribulations. These customers are constantly boycotting
the local authorities without really understanding the real problem because of ignorance
and miseducation. These are the motives for Eskom's interest in the social upliftment of
citizens, such issues can be addressed. Thus the role of regulation in this model would be
on establishing market structures and market institutions which can assure the greatest
level of competition and the greatest choice for customers, including pricing, service
quality, and consumer protection (MI1U, 2003).
This socio-economic dualism affects the country in more ways than one can imagine,
thus it certainly has an impact on the proposed restructuring of the electricity distribution
industry, in this context, tariff restructuring. That is, full rationalization of tariffs that calls
for cost-reflective and the reduction (even elimination) of subsidies. In essence (as
discussed), this means that only large or contestable customers (First Economy - will
remain Eskom customers) will be have the luxury of choosing preferred supplier. The
feeling is that if privatization is introduced following restructuring process, this cannot
satisfy the energy demands in rural areas. However, enough time is needed in each case
to learn and build capacity (human and institutional) to operate the proposed models. The
question now stands that in light of the predicament our country is in, what is the
feasibility and future of this model? Will tariffs ever be fully rationalized seeing that most
customers who cannot afford basic electricity are in rural areas?
122
One must always bear in mind the requests made by institutions such as SALGA and the
Independent Municipal and Allied Trade Union (IMATU)? The concerns raised include
the fact that, no matter which direction the EDI restructuring takes, it should not affect
customers' costs or access to energy services. That is, they will not accept increased
prices for service delivery nor will they accept less than perfect treatment of all
customers. They propose that the government continues to supply customers without any
revenue increase or cutting of electricity lines due to nonpayment. This poses a problem
for the future REDs to be able to operate as companies as they will be running at a loss if
they succumb to public cries! Are the REDs wrong in denying the (greater) customers of
these rights? Who will take over the social responsibility (and development) of providing
free basic electricity and electrification? I suppose the "National RED" which will be the
most financially stable and comprising mostly of Eskom.
The Congress of South African Trade Unions (Cosatu) presented their opposing views on
the Electricity Supply Industry (ESI) restructuring proposals as stipulated in the White
Paper (1998). In essence, they opposed privatization and argued that Eskom should
remain a vertically-integrated, publicly-owned utility and should be used as an agent of
government to provide low-cost electricity services to all, especially the poor. They
supported rationalization of the distribution industry, but into a single national
distributor34. It is good at this point to note that the euphoria around falling prices in
competitive markets is misunderstood; low price and high security of supply are
conflicting objectives. However, the Cosatu institute fails to realize the possible benefits
of introducing markets into the industry, these include; encouraging the right type of and
level of capital investment; more efficient and productive use of assets; more efficient
allocation of resources; technical and operational innovation; improved customer service
and more demand side management in the market (Kee, 2003).
Such statements emphasize the need for proper stakeholder involvement in all "project"
phases as government and any reports written on restructuring have made a pledge to
Tinto, E. Restructuring South Africa's Electricity Supply Industry. 2002. MPhil. University of Cape town.
123
service and supply electricity to the poor, regardless of the restructuring initiative. The
electrification programme demonstrates that the meeting of social goals and public
benefits is independent of industry structure. It was driven by the advent of democracy
and political commitment to provide and will continue despite the pending unbundling of
the electricity market in South Africa and possible privatization. Explicit policy and
regulatory instruments have been put in place to ensure the continued commitment to
universal access to electricity in South Africa (Eberhard, 2003; James, 1996). This would
certainly make tariff calculations much easier and less complicated because it would
involve minimal subsidation (as rural customers receive the most subsidies, with higher
losses and it costs more for Eskom to supply these customer categories).
To view the tariff differentials that exist currently for Eskom customers, see Figure 16: in
the Annexure that depicts all existing tariffs available for Eskom Distribution customers.
While studying this figure, please note the following; rural tariffs are; Landrate, Ruraflex
and Nightsave Rural. Note the bar charts and see the great difference between the costs of
service and the actual price that these rural customers are charged. Thus future tariff
designers, given the above-mentioned possibility in the REDs, will see a decrease in the
number of tariff structures which they have to design and one's opinion is that applying
rural tariff structures is usually a difficult task and once eliminated from the overall
outputs, would be less challenging.
The way forward is thus to promote rural electrification as it has the tendency of
enhancing economic development and reducing rural migration towards the urban areas
(Jaff, 2003). This clearly shows that the economic benefits for rural areas are tremendous
because they will not only decrease the influx of rural people into cities in search of
"milk and honey", but it also allow access to information and communication (through
media), education, better health services and improved security for the rural citizens.
Eskom considers electrification to be an effective instrument in redressing poverty,
inequality and unemployment through economic growth. According to James (1996),
Eskom has taken a stance to encourage and facilitate the rural people in participatory
electrification programmes in their communities.
124
4.9. Financial impact and justification on the REDs:
To conclude this chapter, it would be wise to look at the areas of concern raised by the
PriceWaterhouse Coopers (PWC) 1998 report about the financial aspects (interesting to
the Eskom Distribution Electricity Pricing department) of the restructuring. Before going
further into the discussion, it would be wise to look at pricing objectives - apart from
tariffs. Pricing refers to the process of determining a figure at which products or services
will be exchanged in the market place . The PWC report states that there will need to be
a sizeable price increase (in South Africa) to the average level of some tariffs particularly
to domestic and agricultural customers, to bring them up to the initial estimates of
sustainable Long Run Average Incremental costs (LRAIC) levels. The LRAIC measure is
probably the used because it can provide a close approximation to marginal cost.
"Our initial analysis indicates that a broadly viable distribution industry as a whole can
be achieved, but that this depends crucially on...key assumptions:
domestic customers, in most REDs. Such tariffs would be in line with our initial
estimates of the "correct" LRAIC prices for such customers.
• Generally prices to commercial, agricultural and industrial customers should
remain broadly at current levels (in real terms), in some cases, should initially
decrease front the average tariffs currently charged by some municipal
distributors. However, for most REDs over the period from 2001 to 2010, prices
are expected to increase in real terms though only to a relatively minor extent.
This is explained by the fact that for most REDs the average cost of distribution
is increasing in real terms as more low consumption "electrification" customers
are added.
• Adjustments in tariff levels of this sort will need to be introduced gradually,
over a number of years. This is both to smooth the financial impact on the
Service Costing and pricing, by Muisha Fred, NUR 36 PriceWaterhouse Coopers, Electricity Distribution Industry Restructuring Project, Department of Minerals and Energy Affairs, available at www.dme.gov.za
relevant customers, and to prevent tariff "shocks" becoming a significant
obstacle to the whole of the EDI reform process.
• The detrimental impact on RED finances will, to some extent, be lessened by
also phasing-in any reductions in prices to some commercial and industrial
customers.
• The net effect will, however, be to weaken the financial position of the REDs
from that the reported above, over the phase-in period (likely to be 5 years).
• The impact of this is most likely to be felt by government in its role of equity
holder.
• As price adjustments are phased-in over time, so will be the return on equity
towards its target rate.
Electricity prices, and especially changes to prices, have always been much debated in
South Africa, to the extent that the debate becomes highly emotive. However, the South
African electricity supply industry is facing possible capacity shortage, forecasted to
reach its peak by 2007 after a prolonged period of surplus capacity. In his article in the
ESI Africa Magazine (2003), Tino Espinherira states that the electricity prices (which are
currently low - see figure 15 below), are one of the primary contributors to the
conditions necessary to earn an acceptable rate of return on investment for prospective
independent power producers (IPPs). It appears that, these IPPs are the answers to the
creation of more power stations, thus providing Eskom with energy. Thus the primary
policy challenge is to design an industry structure that provides the incentives to optimise
investment efficiencies in the future37.
37 National Energy Regulator. National Integrated Resource Plan. 2002. Pretoria
126
Figure 15: Depicts the comparison of electricity prices around the world. Taken from Espinheira's article for ESI Africa Magazine in 2003
Prices are an important means to achieve policy objectives. Cost-reflectivity, flexibility of
prices and competitive pressures are also factors to be considered. Thus price floors and
ceiling, together with unbundling of the various services, have been considered for
addressing the issue of unfair competition if it comes up in the future38.
According to Espinheira (2003), the current debates around electricity tariffs are not only
of interest to South Africa, but we should not forget the neighbouring countries, many of
whom are linked to South Africa through a regional transmission network. The African
continent as a whole is faced with the problem of sustainable energy development.
Botwsana, Namibia, Zimbabwe, Lesotho and Swaziland are importers of South African
electricity. As an important input to their economies, they are keenly watching the South
African price of electricity, which is of great importance, as it is the need for a timely
decision on building new generation capacity (Espinheira, 2003). The latter might seem
irrelevant for the main topic being discussed in this dissertation, but it is important to
38 Service Costing and pricing, by Muisha Fred, NTJR
127
point out such drawbacks in other Eskom divisions (which are part of the ESI
restructuring) that greatly affect electricity tariffs and the direction that the Eskom
Distribution Electricity Department is moving towards regarding tariffs in the future.
Moreover, developments in electricity prices are not only of interest to electricity utilities
but one has to mention that electricity is already subject to fierce competition from other
forms of energy such as coal, diesel and fuel oil (as insinuated in the Energy White Paper
(1998)), with the possibility of natural gas emerging onto this scene. Suppliers of these
alternative energy sources are also closely monitoring any advance in the electricity
industry with keen interest. To them, if it emerges that building capacity in the generation
sector of the electricity industry brings about a higher price of electricity, this would
represent the opportunity to convert (loyal) electricity consumers to their products,
thereby growing their share in the energy pie (Espinheira, 2003). The probability for the
occurrence of the latter situation is great unless Eskom ensures that there is a balance
between energy supply and demand in the country and entire industry.
This emphasises the need to design cost reflective tariffs taking into consideration the
difference in load factors, as to ensure that there is no wastage of energy. It is thus good
to notice that domestic customers are generally more expensive to supply than
commercial or industrial customers. This was extrapolated from an exhaustive
comparison study of electricity tariffs by SAD-ELEC, a regional energy consultancy, in
their 2003 annual report, "Electricity Prices in Southern and East Africa". A note of
caution that needs to be made here is that, domestic customers are thus still being
subsidised by other customer classes and it is amazing how Eskom Distribution still
manages to operate on a true commercial footing. This is more reason to rationalise the
tariff structures to reflect the true cost of providing the service and transparency of
subsidies that each customer contributes to. Eskom has recently unbundled these
subsidies and published them transparently to their large customers on their monthly bills.
However, Eskom is now keen to see prices rise to levels that can support the new
investment that is necessary. Analysts have begun to understand that current prices are
128
economically unsustainable (Econ, 2002). It is no surprise that prices in this country are
set to increase because Eskom supplies electricity at amongst the lowest prices in the
world (see figure 15) because it has consistently made a positive return on assets
(Eberhard, 2003). But the burning question is whether this is sustainable into the future.
Certainly, Eskom raises finances through commercial debt, mostly through issuing bonds
that are well supported by local and international capital markets39. However, the current
low electricity prices exist primarily as a result of investment contradiction after a
previous period of wasteful over-investment.
The latter explains why many stakeholders have up to now believed that Eskom operates
efficiently - because current low prices create a false complacency. Is Eskom supplying
such cheap prices at the cost of reliable and quality of supply? Eberhard (2003) discusses
that the primary reason for the reformation of the entire Electricity Supply Industry (ESI)
in this country is the desire to improve investment and operational efficiencies that blight
the performance of monopoly utilities. This is coupled with the rationale that the major
drivers for power sector reforms are inefficiencies in the sector and lack of capital to
expand and rehabilitate existing systems (Turkson). Thus in light of the above reasoning
and the findings from Price Waterhouse Coopers (PWC) report, Eskom is now keen to
see prices rise to levels that can support the new investment that is now necessary.
Analysts have begun to understand that current prices are economically unsustainable40.
However, the primary policy challenge is to design an industry structure that provides the
incentives to optimise investment efficiencies in the future41.
In light of the above-discussion, REDs will not only have to deal with incompetence in
the tariff design sector but one can also envisage a few more challenges for the future
tariff designers. They are as follows42:
• Data capacity - that is the reliability and quality of data acquired per entity as well as
the level of detail of the data to be modelled. The information technology department
39 Eskom Annual Reports Econ. Electricity Price Scenarios for South Africa. A report to the Department of Minerals and Energy,
South Africa. 2002. Oslo 41 National Energy Regulator. 2002. National Integrated Resource Plan. Pretoria
129
of Eskom should commit themselves to audit and manage tariffs, especially in terms
of verifying changes to customer information and the download process .
• Design and implementation of low-cost and effective tariffs that induce the
regulated entity to achieve the social objectives. This is unavoidable as the cheap
electricity currently supplied in the industry is still unaffordable to most South
Africans.
• The dynamic nature of electricity entities - their pricing decisions, as with their
investment decisions are not only set at a single point in time but over a period of
time, and
• The prospect of earning profits in the future (autonomous structures) - necessary for
the entity to invest and avoid making a loss.
The next chapter will also look at the future of the Cost-based and Tariff Design
workshops following the pilot phase - to be completed in November 2005. Questions to
ask include; who will carry out the legacy of training into the second year, let alone the
future? Will the training team remain intact as is? How will the industry ensure that the
training team from Eskom Distribution Electricity Pricing remain committed to the
course and mitigate for retention strategies, as this is one group of indispensable people?
Will the consultant facilitators ever be able to present these workshops independent of the
Eskom Distribution Electricity Pricing team?
42 Service Costing and pricing, by Muisha Fred, NUR 43 Electricity Sales System, 10 October 2005
130
5. CHAPTER 5: CONCLUSION AND RECOMMENDATION
5.1. The future tariff design candidate
Paragraph 4.3 in the previous chapter discussed the ideal Cost-based and Tariff Design
workshop candidates and future tariff designer. However, with the complexity of this
specialised skill, it is obvious that it is not only those "model" characteristics that will
sustain one in the tariff design sector but one should also be willing to take on the
everyday challenges that go with the task as well as the required dedication. Thus,
attitude is key for these individuals. This criterion is not only based on academic
qualifications but also on the potential of the key persons earmarked for these posts, as
well as the ability to work hard. In the next chapter, recommendations will be discussed.
The question should be asked; what the industry can do to better accommodate these
participants. This would certainly be appropriate for the success of the future training
workshops that will benefit those employees who did not have the opportunity to attend
the pilot phase.
On the matter of the course feedback or evaluation forms, one should remember that the
feedback on the Cost-based and Tariff Design workshops was from a well-rounded
audience/ source/ population group as it encompasses representatives from around the
industry. Thus, one should get an overall idea of the opinions around in the industry
based on these delegates' experiences, in turn; they are expressing their views on the
holistic EDI restructuring initiative without even detecting it. So, one is happy with the
overall feedback received and believes that if taken into consideration, they can make a
difference in satisfying the target audience as well as the course trainers themselves. The
point made here is that it is important that trainers understand their audience in order to
have a better learning and conducive environment.
131
The major lessons learnt from these interventions was that a Cost based and Tariff Design
specialist needs to be a well rounded person with an in-depth knowledge of tariffs, tariff
structures and most importantly, the Distribution business as a whole.
It is important to remember that any restructuring brings about change, which in turn
causes uncertainties in employees who will ultimately be affected by the process.
Because the human resources aspects are critical for success in any restructuring, it needs
to be addressed effectively and professionally so as not to disrupt or hinder the process of
change. The latter was the logic of the Competency Building project that emerged in the
Eskom Distribution Electricity Pricing group. The project would to build capacity in the
Tariff Design sector thus gaining the confidence of employees in the Customer Service
(and Engineering) sector, especially those ear-marked for involvement in tariff design in
the future. This aimed to address and remove the inconsistencies in skills level that exist
within the Eskom Distribution group.
As previously mentioned, there are many issues currently facing the EDI as identified in
the DME Energy White Paper (1998) and the DME Calls for Proposal EDI restructuring
project (1999). However, issues pertaining to pricing were identified as follows;
• to ensure agreed-to electrification targets are met,
• to provide low-cost electricity,
• to facilitate better price equality (cost-reflectivity) and
• to improve the financial health of the industry.
The tariff design workshops exist to attract and attain competent employees. Tariff design
is the foundation that will underpin the drive for the above-listed Pricing objectives,
which in turn will translate into restructured tariffs in the industry.
As already indicated, the electricity industry worldwide has been moving away from
vertically integrated, stable, monopoly structures to horizontally organized, more volatile
and competitive structures (Galen, November 1998). The proposed future competitive
market mentioned earlier is only anticipated once the REDs are stable, healthy and
132
financially viable; this will be coupled with the disintegration of the EDI Holdings
Company. The driving forces behind competition have been the following;
• the desires to reduce costs,
• reduce prices to end-users,
• improve service quality,
• and/ or enhance availability of supply, thereby benefiting the entire economy.
The author is of the view; it would be a great injustice for the industry to rush this process
as it would leave the industry in its current fragmented state. It is proposed that a proper
restructured industry will materialize in about a decade from now. This proposal is in line
with global trends of the vision that electric utilities will be operating more and more in a
competitive environment in the future 4. One foresees that the competition will not only
be amongst the predetermined REDs but naturally from alternative sources, as stipulated
in the DME Energy White Paper (1998), such as; self generation, cogeneration, retail
wheeling, or switching to alternative fuel products such as gas, hydro power etc. As a
response to this, Guernsey (1994) proposed that, utilities may respond to these changes
by adjusting their products and service mix as well as providing more flexibility to their
customers.
Before moving forward, let us revisit the main reasons which were the driving forces for
the global restructuring revolution. Galen (1998) shares the following thoughts: First,
where the cost of new electricity generation is often significantly below the average
embedded cost of existing utility-owned generation new suppliers seek to enter electricity
markets to compete with incumbent utilities. Second, as the need for new capital
investment arises, governments are less willing than before to bear all the investment risk
of acquiring new resources and private investors do not wish to lend to entities with
limited and/or uncertain cash flow. Thus through privatization, investment risk can be
shifted to the private sector along with the rewards possible for taking the risk (Galen,
1998). Currently, operating and investment decisions are driven by price signals because
Guernsey and Company, Chapter 18 - Tariff Structure and Ratemaking: What the future may hold in, Tariff Structure and Analysis Course Manual. 1994. Vol 1. pg 18.6.
133
of the ominous possibility of financial failure. According to Guernsey's (1994) view of
what the future holds globally for tariff structures and ratemaking; the development of
flexible pricing will require an understanding of the customer's value (to the utility) in
terms of service level received from the utility. To seal this point, Guernsey (1994) made
the following comments; "A utility responsive to market conditions (and changes) and
offers rate options and flexible market-orientated services can maintain customer
satisfaction and profitability without shifting substantial costs to customers".
5.2. What Is The Future For The Tariff Alignment Course?
Let us now review the "project beginnings" and thus we can move on to evaluating and
recommending what the future holds for this project. Initially, the project model was
based on the EDI Blueprint stance of 2005. The proposal stated that once restructuring
was completed, the end state would be six regulated regional distributors (REDs) formed
within eighteen months of the year in question. These REDs were envisaged to become
financially viable and will service customers within their respective boundaries, making
their own decisions and operating as autonomous tax paying companies. All this was
covered in the introductory chapter as well as some in the review chapter.
5.2.1. What will happen specifically with the training sessions?
The simulation workshops will thus become part of national training initiative,
specifically in Eskom where there is a huge "market" demand for it. The training
interventions will be documented, captured and reported as part of the overall
Distribution businesses' training and will be scheduled in the same way as other training
interventions available on the intranet "Zenzele" for Eskom employees to book
themselves accordingly. However, because the current project is a pilot and sponsored by
the EDI Holdings Company, it is an interim arrangement where participants need not
budget and pay for these interventions. The latter will thus be required once the pilot
phase is complete.
134
In light of the completion of the Competency Building phase, the remaining project
phases have to continue whether REDs are formed as planned or not. This is in terms of
the regional visits that begin at Phase 3: Costing (as explained earlier), to ensure that each
"pilot" region or entity eventually reach the final project phase or tariff design goal where
they would have a tariff plan in place for submission and presentation to the regulator.
There is thus a possibility that this project (however much organized it is), may not
achieve all its objectives, especially in terms of full rationalization of tariffs. This has
already been accepted by the Eskom Distribution Electricity Pricing project team, which
will explore mitigation strategies in the coming year, based on these emerging issues.
To conclude on the issue of challenges facing the tariff design sector of the future REDs,
one recommends that the available data be shared within the business and regulator audits
be done internally per entity by relevant departments, including the finance department
before presentation to the regulator. This can promote and improve regulation, as the
regulator has no idea of the validity of the data submitted to them; they can only identify
discrepancies where they pick up any abnormalities.
As discussed in earlier chapters, the EDI reform should be done in no less than a decade.
The gradualism approach rather than the big-bang approach is advisable to implement the
reform "package". It would not be wise to introduce, unbundling, privatization and
competitions into the industry all at the same time, especially in South Africa. According
to Turkson, this approach has worked previously in countries such as the UK, Chile and
Argentina because certain conditions such as adequate institutional and human capacity
existed to adopt the "big-bang" approach to implement their reform. In this respect, a
gradualist approach to reforming the electricity industry in South Africa is more
appropriate. This involves phasing in of the implementation plans in a way that it is
safeguarding to the institutions. To further emphasise the need for the gradualist
approach, Turkson points out the following; the dearth of relevant institutions and human
capacity and inadequate experience to deal with the complexities of a competitive power
sector.
135
To wind up this discussion, one should consider the following; the EDI restructuring
process has been slow and frustrated by the complex web of political interests at local
government level, serious resistance from organized labour and the fear of loss of the
control of an important infrastructure service. These socio-economic and political
pressures have thus contributed to the slow pace that the distribution industry has taken
and should also be credited to the reform process being complex and exasperating. This is
so because Eskom is still seen as an important instrument of governmental policy, a well-
performing infrastructural industry that supports government's economic and social
programmes. "The energy sector initiative seeks to promote the consumption of
electricity by many citizens around the country who have previously been deprived of
this basic service. Thus government still experiences ambivalence and doubts around
embarking on a path of full unbundling, competition and privatization" (Eberhard, 2000).
Despite the above principles, "the process of reform in this sector continues and
government's intent is to create a more efficient industry in the form of new,
commercially-run, public corporations. Any further delay in this overhaul process may
mean extensive new government investment to address reliability concerns".
Decentralized supply seems to be the way out! Contrary to that, as discussed earlier, as
long as electricity is a key factor in socio-economic development, it is necessary for
government to continue to intervene in ensuring that electricity reaches the majority of
people as to fulfill its social objective (Jaff, 2003). This is a huge concern for the Eskom
Distribution Electricity Pricing group. Clearly, the REDs model adopted by government
would not represent a barrier to permitting future competition in wholesale supply. Nor
would it necessarily be a barrier to some level of retail competition. As stated,
electrification programmes are independent of the electricity entities structure and will
thus continue regardless of the direction followed by the EDI. But the burning issue now
is how government will ensure this? How will they get the commitment of these
Distributors (who will be struggling with building empires on solid financial grounds) to
commit time and resources to social upliftment?
136
The decentralized route that our electricity industry is moving towards is not widely
appreciated locally. This research has lead one to conclude that there is a fear in the
industry that tariffs that might emerge from these "private" distributors might not be
subject to social considerations (as seen in international trends) and hence not compatible
to the level of income in the South African population. To attempt to answer the question
posed at the proposal phase of this research; it seems likely that, in the South African
context where poverty is an endemic, many people, especially in rural areas, cannot have
access to electricity when it is delivered on commercial basis. This would be a
misfortune, as it would not address Eskom and NEPAD's vision; "Electricity for air and
perhaps that aspect should be separated from the industry restructuring to ensure that it
takes place. The latter statement was made on the grounds that, this vision will remain an
illusion in our country if profitability remains the guiding rule for supplying electricity
and new avenues for decentralized energy production are promoted.
However, one proposes that as South Africans we have to put our trust in the government
to make correct decisions for the country not only to correct the mistakes of the past but
to ensure that a legacy is left for the future; that is, long term sustainability and economic
growth especially in terms of using the correct and generic tariff design methodologies as
well as taking all considerations discussed here into account.
137
6. REFERENCES
1. African National Congress National General Council. Discussion Document:
Development and underdevelopment learning from experience to overcome the
two-economy divide. 29 June - 3 July 2005. Socpol circular no. 48A/05
2. Cavanagh, R. and Sonstelie, R. Chairman of Puget Sound Energy, NRDC's.
Energy Distribution Monopolies: A Vision for the Next Century. The Electricity
What will you do differently in your job as a result of your experience on this course?
Would you change anything in the course to benefit future delegates?
COURSE EVALUATION 27 June - 01 July 2005
What parts of this programme did you find useful? Organisation and management of learning environment industry simulation and the approval process by the regulator. Shift focus to correct cost allocation. Network allocation. Classification of customer has an impact on your revenue. Tariff design is complex and one must combine economic realities. Cost allocation. Weighing of components. Grouping of customers. Allocating costs related to energy provision, grouping consumer to categories. Selection of relevant Tariffs. I am fairly new in Tariff design but the whole course was designed in such a way that every step was useful. Great way of learning because it does not highlight just one specific part. Applying the costs onto similar group of customers concept and how the learned of running of entire model was very practical. The unpacking of the income statement into cost of supply statement. The program as a whole was very useful in fact I will forward you a request (as discussed) to have additional people. Cost allocation - manage costs so that they can be reinforced. Almost everything it elaborates on cost reflective Tariff designed and areas a big room for learning. The last reflective part of designing Tariffs. The totals packaging appreciate the hand copies of the presentations and the defined step by step approach to keep you on track all the time. Basically everything especially the importance of the "technical" stuff and the integration between that and finance. Income statement cost mapping and cost allocation.
What parts did you not find useful? All parts are relevant and need to include other industry role players like NER and DME. Removing the formula bins which make our tasks a little longer than it could have been. Every part was useful. More. But sometimes if felt that there is information missing. The fact that we could not go back and change certain grouping to see the impact on the customers. The cost mapping approach on network cost and grouping and Tariffs election. I would say not useful but very difficult in categorising of customers into buckets. I think the course or parts as stated above is very useful and interred and there is no part that can be identified as not useful.
• Copying and pasting on excel laborious is time consuming even though it teaches us a bit more about excel but does not add value to the course.
What will you do differently in your job as a result of your experience on this course? • Apply all the applications of costing and involve different departments encourage
customer services to have people who will supply quality data to the designers as we find with network planning and finance.
159
COURSE EVALUATION 11-15 July 2005
1. What parts of this programme did you find useful? • The whole course the links between different stakeholders (departments). The
effects the decision on cost of supply has on the customer. • Break-up of cost. Recovery of costs and outcome of decisions. • Putting the costs together from different Tariffs. Dividing costs to the relevant
customers. • Cost separation. Classification of customer. Determining your network. Reduced
diagram ( I now have a better understanding of the NRS) designing Tariffs and analysing the impact on customers ( I now have a better understanding of Tariffs I enjoyed the course very much it was very practical).
• Better idea of how Tariffs are designed. • All parts - congratulations to the training team excellently done. • Everything was useful and interesting. • Hands on learning process. • Mapping cost. Tariff selection and usage. Forecast versus actual. • The whole of this programme was useful time constringe cause that the program
run over short period, would like to see more of the detail work behind it. • The total programme. • The whole setup was useful as previously the Tariff structures were not done
anyway near this. • The total programme. • The whole programme was useful because of its applicability to the current project
I am involved in. • Structure and approach well built the model is well built and very illustrative of
Tariff building process.
2. What parts did you not find useful? • Would made like to see what would happen if certain changes on the initial
choices (groupings /categories) were made with a second run. • Pool of network initially because I reasoned more technically than financially.
3. What will you do differently in your job as a result of your experience on this course?
• When preparing the cost mapping statement, assess the reasonability of assumptions I will make in allocation should overheads costs.
• Pool customers. Calculate recovery costs and subsidies. Look at load factors and load profile for our T.O.U customers.
• Make sure that all the costs are identified and apportioned correctly to the different customers.
• Previously used consultant for Tariff design in future will be able to do it ourselves and saving council money. Will in conjunction with treasure gather all necessary in format for Tariff design.
• Yes definitely I have gained a lot of knowledge that I am going to implement. I have a better understanding of Tariffs.
• Gather and sort the data better and store it in a better way so that it will be easy to get information.
• Try and convince our treasurer and IT departments that we cannot work separately.
160
COURSE EVALUATION 22 - 26 August 2005
1. What parts of this programme did you find useful? • The network mapping and voltage level and density breakdown, support cost
mapping and breakdown. Great group and team dynamics. • The whole course was very interesting explanation of a few technical issues. • Everything. • Categories of customers. Importance of subsidies. Method used to allocate cost. • Costing is important in this process. • The re-enforcing of the learning process. • Costing and Tariff impact. • Emphasis on costs. • Process on line (the way in which Tariff design needs to be approached to
achieve cost reflective Tariffs), actual Tariff design in the simulation method. • Well structured step by step process. • All of it was interesting and useful. • The practical part of the course finding out what happens through the whole
process. • Income statement. Classification of costs. Subsidies and Tariff categories. • Cost mapping, customer categorization and clarification of Tariff selection,
network diagrams and pooling subsidization. • The whole impacting of the design process. • Everything coming from a financial environment, I have gained better
understanding.
2. What parts did you not find useful? • The number converting. • All parts were important and useful. • Understanding the technical ride of electricity more and understanding of how the
Tariffs were calculated.
3. What will you do differently in your job as a result of your experience on this course?
• Better understanding of decision making. • Gather assets register is more cost reflective. • Work hard in ensuring that the data is reliable. • Insist on availed data (reliable). • The importance of data collection. • Aware of detailed cost breakdown and its impacts. • Improved understanding of process and practical issues - more able to regulate
effectively both Eskom and local authorities. Guide local authorities / red Tariff setting.
• At least now I know what happens to the cost of supply study once we completed it in the region I now realise the impact of our costing decisions and assumptions.
• Analysis of cost. • The amount of data to be included, customer categorization, Tariff selection and
subsidizing. • Create a passion for Tariff design and better rates to our customers. • From a financial point of view must ensure that the assets of a company must be
in place in order to start calculating the Tariff structure.
161
COURSE EVALUATION 05 - 08 September 2005
1. What parts of this programme did you find useful? • Preparation of the presentation this forced us to review the whole process. • This course brought understanding in Tariff design and what desires the ultimate
approval of Tariff by the NER therefore all parts of the programmes provided useful learning for me.
• The complete process of arriving at cost reflective Tariffs and the "complexity" therefore the "merging" of thinking process amongst team members.
• How to begin Tariff. To cost allocate from. Cost mapping. Cost table and network data.
• Finding out that there is a structured way to design Tariffs. Working through the process of just lectures. Having to prepare a presentation.
• Process of identifying cost in detail for Tariff design and implementation and discussion around options available (learnt some computer and excel capabilities) interaction with delegates was pleasant.
• Designing Tariff structures. • Everything was useful. • The entire course was very useful, now under the basis of Tariff design. • All had fun together with learning. • This programme was a real eye opener. There are Tariffs in peace and an annual
inflation included is applied every year with no reflection. • Every part is done with flow. • Using a comprehensive model (very detailed). Sharing ideas with other entities. • All aspects presented. • The interaction between members from different atelier.
2. What parts did you not find useful? • How the networks or customers of Tariffs are categories and the impact it has on
the different customers. • Lunch.
3. What will you do differently in your job as a result of your experience on this course?
• Various aspects of our network and asset costs need to be looked at. • We are currently reviewing our Tariff this has provided vital information and
learning that will assist in finalising the Tariffs. • Map costs as per the guidelines used in the course. • Look differently at the year and financial statements and linked these to your
knowledge gained here in order to see the "real term" effect of applying knowledge into practice.
• To collect all customer data summary, network data. Try and calculate Tariff using same method. Categories customers. Choose which Tariff they can call to.
• Nothing as it is no longer my job to actually do these things. I will however be encouraging other smaller municipalities to become aware of the process and to take part in future courses.
• My job does not involve Tariff design but I may need to represent treasury in future deliberations.
• Obtain all the relevant information on our customers and apply or compare our Tariff structure.