44
1 2002 Final Results Presentation www.irishlifepermanent.ie 5 March 2003
| Date post: | 25-Dec-2015 |
| Category: |
Documents |
| Upload: | laurel-green |
| View: | 220 times |
| Download: | 0 times |

1
2002 Final Results Presentation
www.irishlifepermanent.ie
5 March 2003

2
A number of statements we will be making in our presentation and in the accompanying slides will not be based on historical fact, but will be “forward-looking” statements within the meaning of the Private Securities Litigation Reform Act of 1995. Actual results may differ materially from those projected in the forward looking statements. Factors that could cause actual results to differ materially from those in the forward looking statements include, but are not limited to, global, national and regional economic conditions, levels of market interest rates, credit or other risks of lending and investment activities, competitive and regulatory factors and technology change.
Forward looking statement
2

3
2002 Highlights
Sales
• Ireland Life sales up 25%
• Bancassurance sales up 50%
• New Mortgage Lending up 28%
• Loan Book growth up 13%
3

4
2002 Highlights
Financials
• Ireland/UK contribution up 14%
• Total after tax profit €290m
• Dividend up 10%
• Share buy-back €150m completed
• Continued Capital strength
4

5
Financial Review
6
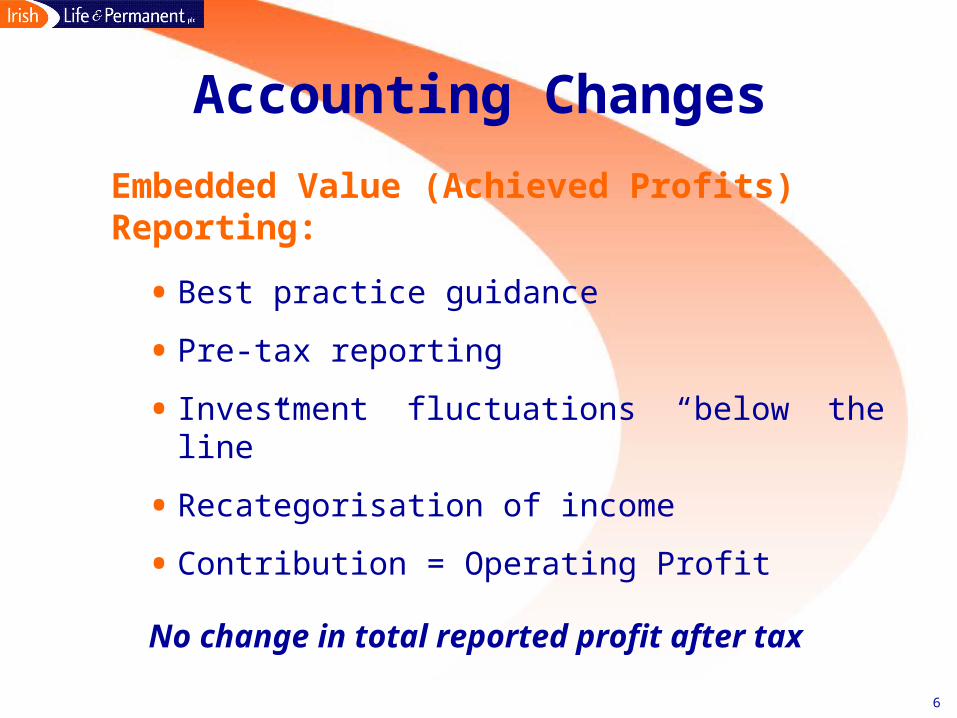
• Best practice guidance
• Pre-tax reporting
• Investment fluctuations “below the line”
• Recategorisation of income
• Contribution = Operating Profit
Accounting Changes
Embedded Value (Achieved Profits) Reporting:
No change in total reported profit after tax
6

7
Total Earnings
Total Contribution
Short Term Investment fluctuations• Life• Associate
GoodwillExceptional itemsEconomic Variance
Total Profit before tax Taxation & Minority Interest
Total Profit after tax
31 Dec 31 Dec 2002 2001 Change €m €m %
355.3
(96.7)(33.0)(11.7)123.5
20.8
358.2(68.2)
290.0
270.4
(43.3)(14.0)(14.8)
(113.0)(6.2)
79.1(30.5)
48.6
31
7

8
Total Contribution - Group & Associate
Ireland & UK• Life Assurance • Banking & Other
• Share of Associate • Other Investment Earnings
US
Total Contribution
31 Dec 31 Dec 2002 2001 Change €m €m %
220.097.4
317.4
29.03.8
350.2
5.1
355.3
195.291.1
286.3
6.815.2
308.3
(37.9)
270.4
137
11
14
31
8

9
Life Assurance - Contribution
IrelandNew Business
Existing Business • Unwind of Discount Rate• Experience Variances• Assumption Changes
Expected Investment returns
Other Income
UK
31 Dec 31 Dec 2002 2001 Change €m €m %
58.2
83.426.524.5
4.1
8.2204.9
15.1220.0
57.9
74.6 17.4 14.1
0.4
10.0174.4
20.8195.2
-
17
13
9

10
Life Assurance - Ireland
VNBLife 50.8 53.7ILIM 7.4 4.2
58.2 57.9SalesLife 326.4 288.8ILIM 87.7 42.4
414.1 331.2 25
Margins % %Life 15.6 18.6ILIM 8.4 9.9Total Margin 14.1 17.5
Value of New Business/Margins31 Dec 31 Dec 2002 2001 Change €m €m %
10

11
Persistency 14.5 17.6 - 9.3
Risk 11.1 12.6 14.3 (6.5)
Other 0.9 (12.8) 10.2 11.3
26.5 17.4 24.5 14.1
Life Assurance -Ireland
2002 2001 2002 2001 €m €m €m €m
Experience Variances
Assumption Changes
11
12
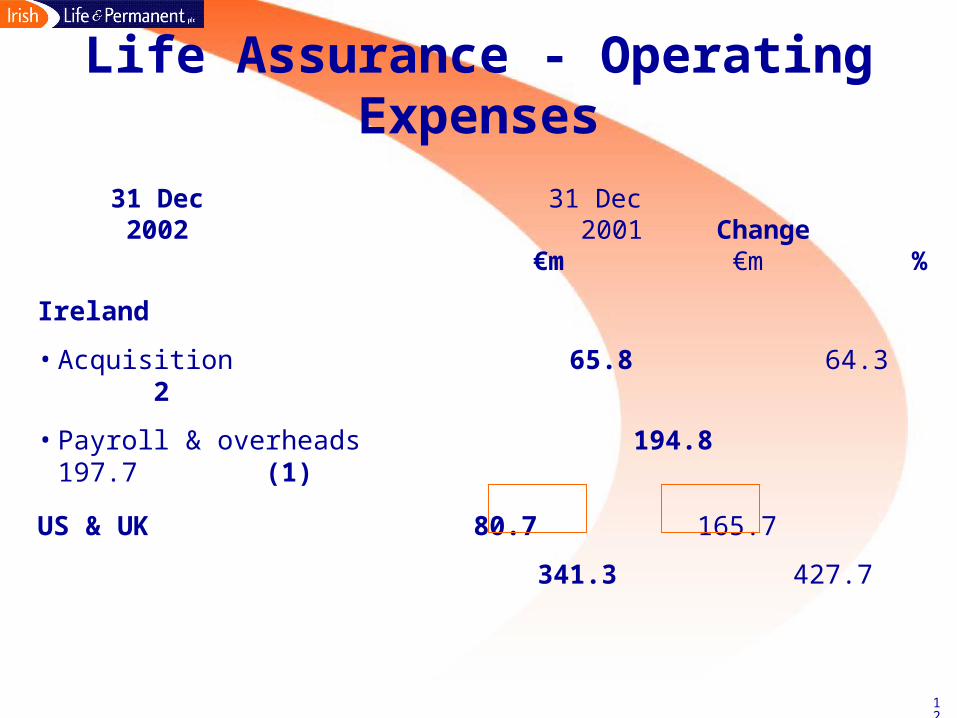
Ireland
• Acquisition 65.8 64.3 2
• Payroll & overheads 194.8 197.7 (1)
US & UK 80.7 165.7
341.3 427.7
Life Assurance - Operating Expenses
31 Dec 31 Dec 2002 2001 Change €m €m %
12

13
Net Interest Income 325.2 280.4
Other Income (net) 29.9 27.7
355.1 308.1 15
Expenses (244.4) (205.3)
Bad & Doubtful Debts (13.3) (11.7)
Contribution 97.4 91.1 7
Banking & Other - Contribution
31 Dec 31 Dec 2002 2001 Change
€m €m %
13

14
Retail 89.9 78.9 14
Treasury 13.2 17.2
Other (5.7) (5.0)
97.4 91.1 7
31 Dec 31 Dec 2002 2001 Change €m €m %
Banking & Other - Contribution
14

15
Banking - Margins
2.151.98
1.90 1.78
1.58
325
280
183183
153
100
150
200
250
300
350
1998 1999 2000 2001 2002
1
2
3€m
Net Interest Income Net Interest Margin
%
15

16
%
2001 1.90
Retail (0.02)
Treasury (0.04)
Funding (0.06)
2002 1.78
Banking - Margins2002 Movement
16
17
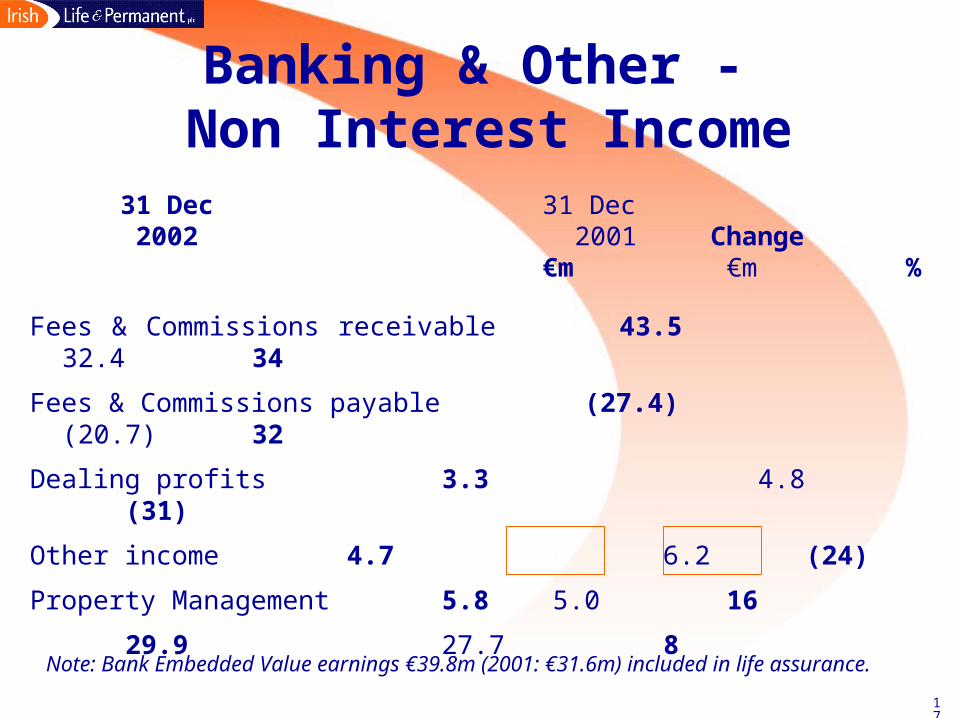
Fees & Commissions receivable 43.5 32.4 34
Fees & Commissions payable (27.4) (20.7) 32
Dealing profits 3.3 4.8 (31)
Other income 4.7 6.2 (24)
Property Management 5.8 5.0 16
29.9 27.7 8
31 Dec 31 Dec 2002 2001 Change €m €m %
Banking & Other - Non Interest Income
Note: Bank Embedded Value earnings €39.8m (2001: €31.6m) included in life assurance.
17

18
Banking & Other - Expenses
Banking 232.8 195.3*
Corporate & Other 11.6 10.0
244.4 205.3
*includes TSB acquisition from 20/4/01
Cost/Income Ratio % %Reported 67 64Incl. Commission 65 63Incl. Bank EV Earnings 60 58
31 Dec 31 Dec 2002 2001 €m €m
Underlying increase of 3%
18
19
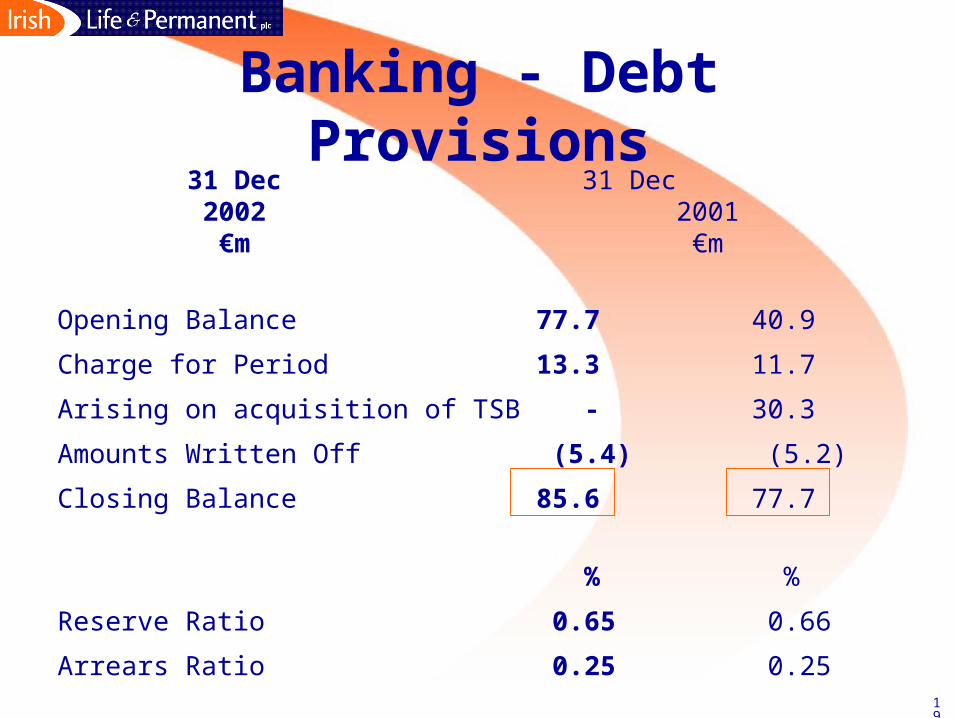
Opening Balance 77.7 40.9
Charge for Period 13.3 11.7
Arising on acquisition of TSB - 30.3
Amounts Written Off (5.4) (5.2)
Closing Balance 85.6 77.7
% %
Reserve Ratio 0.65 0.66
Arrears Ratio 0.25 0.25
Banking - Debt Provisions
31 Dec 31 Dec 2002 2001 €m €m
19

20
Contribution 29.0 6.8
Short term investment fluctuations (33.0) (14.0)
(4.0) (7.2)
Note: Contribution includes expected/normalised investment returns
31 Dec 31 Dec 2002 2001
€m €m
Associate - Allianz-Irish Life
20

21
Exceptional Items31 Dec 31 Dec 2002 2001 €m €m
Profit on disposal of Industrial Branch business
Profit on disposal of branch properties
Banking restructuring costs
Loss on disposal of US businesses
103.2
30.3
(10.0)
-
123.5
-
-
(63.0)
(50.0)
(113.0)
21

22
Dividend
35.1
39.0
43.0
47.5
20
25
30
35
40
45
50
1999 2000 2001 2002
cent
10% increase for 2002
Compound growth 11% p.a.
Dividend yield 5%
22

23
Capital Adequacy - Banking
Tier 1 Capital/Risk Weighted Assets: 10%
Share buy-back of €150m completed in 2002
Tier 2 capacity to fund balance sheet growth
0
500
1,000
1,500
2,000
2,500
Tier 1€1,695m
Tier 2€674m
Life Co Embedded
Value deduction €1,435m
Bank available capital Tier 1 €934m
€m
Total Bank Capital Life Component
23
24
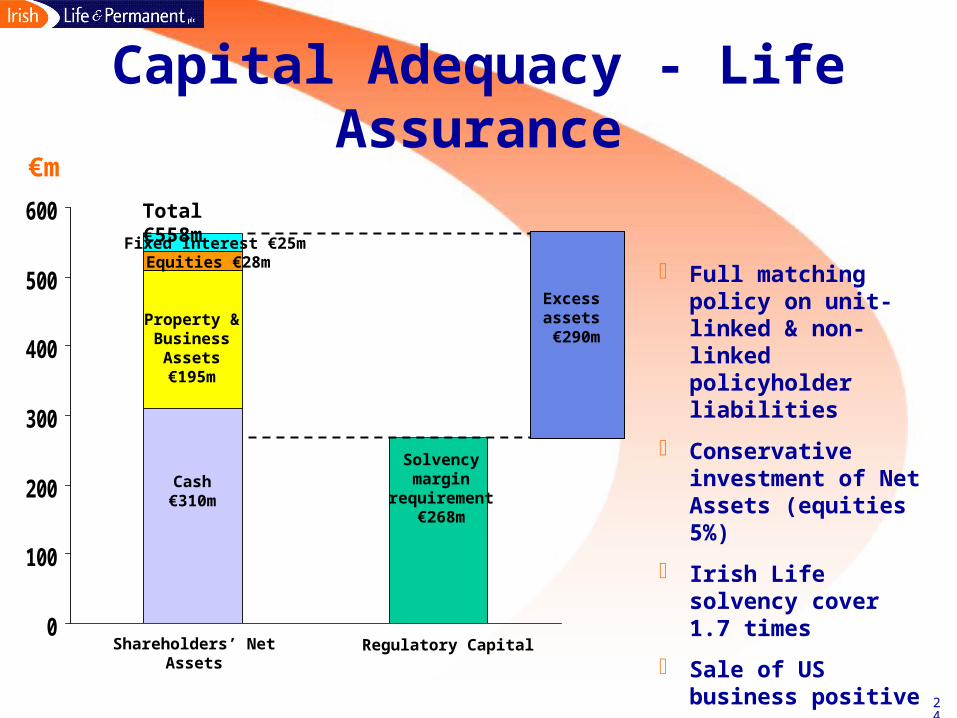
Capital Adequacy - Life Assurance
0
100
200
300
400
500
600
Full matching policy on unit-linked & non-linked policyholder liabilities
Conservative investment of Net Assets (equities 5%)
Irish Life solvency cover 1.7 times
Sale of US business positive
Cash€310m
Property & Business
Assets€195m
Solvency margin
requirement €268m
Excess assets €290m
€m
Fixed Interest €25m
Shareholders’ Net Assets Regulatory Capital
Total €558m
Equities €28m
24

25
Business Review
26
0
50
100
150
200
250
ILIM Corporate Retail
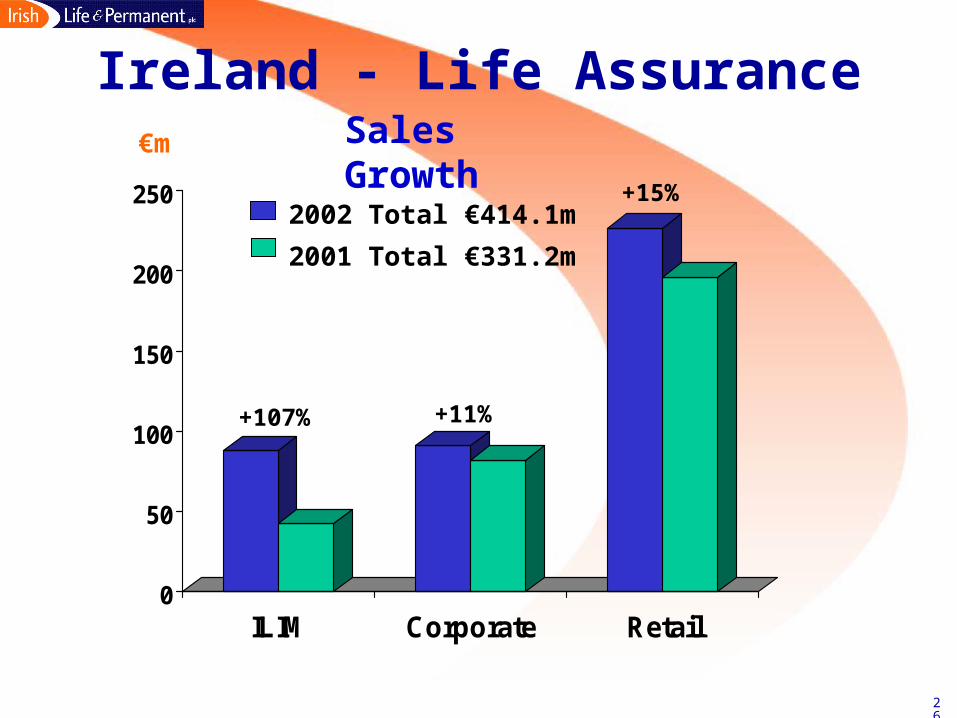
Ireland - Life Assurance
2002 Total €414.1m
2001 Total €331.2m
€m Sales Growth
+107% +11%
+15%
26

27
0
20
40
60
80
100
120
Protection/Risk Pensions Investments Savings
Retail Life - Products
2002 Total €226.6m
2001 Total €196.5m
€m
+11%
+4% -10%
+44%
27
28
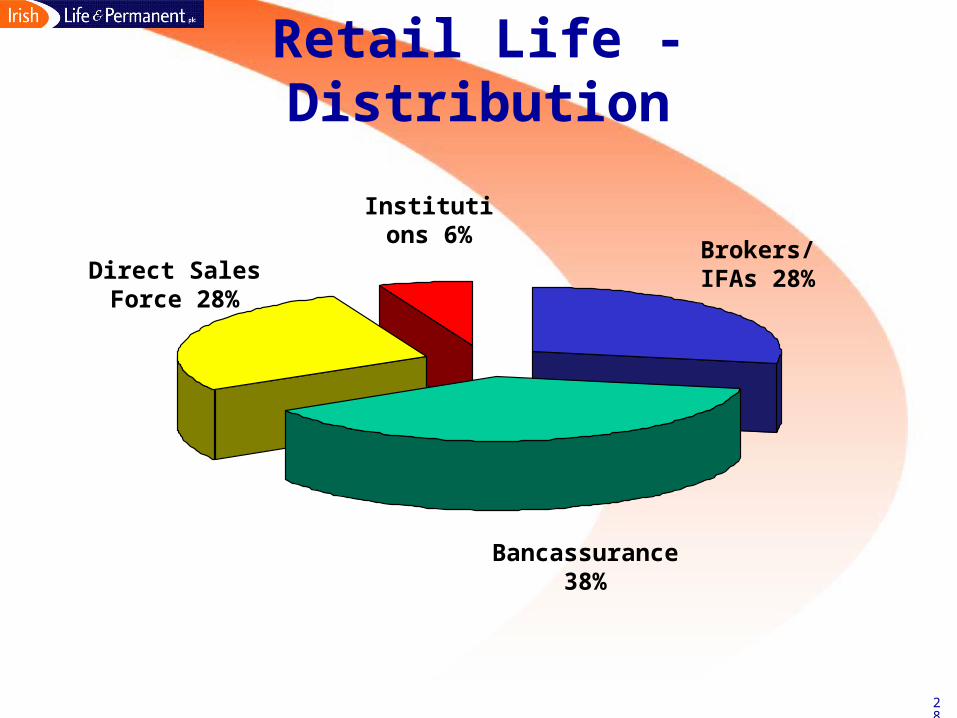
Retail Life - Distribution
Institutions 6%
Brokers/IFAs 28%
Bancassurance 38%
Direct Sales Force 28%
28

29
0
10
20
30
40
50
60
Other Risk DC
Corporate Life - Products
2002 Total €90.8m
2001 Total €81.8m
€m
+10%
+18%
+8%
29

30
Life Assurance - Change Programme
• Radical change agenda
• New processes & supporting technology
• New POS and on-line fulfilment technology in operation
• New back-office systems operational for new business from Q2 2003
• To complete end 2004
30

31
Banking - New Lending
0
500
1,000
1,500
2,000
2,500
3,000
ROIMortgages
ConsumerFinance
Commercial UKMortgages
+28%
+17%
+15%
+25%
2002 Total €4,494m
2001 Total €3,594m
€m
31

32
ROI - Mortgages 10,087 8,692 16Consumer Finance 1,312 1,289 2Commercial 1,255 1,169 7
12,654 11,150 13
Stg£m Stg£mUK - Mortgages 1,286 1,094 18
Total Lending 14,631 12,939 13
Banking - Loan Book31 Dec 31 Dec 2002 2001 Change €m €m %
32

33
Retail deposits
• Current accounts 1,354 1,130 20
• Other 4,402 4,410
Corporate deposits 4,448 3,931
10,204 9,471 8
Banking - Resources
31 Dec 31 Dec 2002 2001 Change €m €m %
33
34
• Integration and launch completed
• Bancassurance success
• Target cost synergies increased to €29m
• €9m savings in 2002
• €20m annualised savings end 2002
• On track to deliver by end 2003
Ireland - BankingIntegration of permanent tsb
34

35
• US - Guarantee Reserve
• Industrial Branch disposal
• Share Buy-back completed
• Allianz - Irish Life
Corporate Developments
35

36
• Economy
• Markets and interest rates
• Bank lending
• Life sales
Outlook
36

37
• Embedded value movement 2002
• Total contribution after tax 2002
• Total profit after tax 2002
• Total contribution after tax 2001
• Total profit after tax 2001
• Life Assurance Sales 1998 - 2002
• Bank Lending Growth 1998 - 2002
Additional Information
37

38
Embedded value 31 Dec 2001*• Net assets 99.7• Value of in-force business 1,280.3
1,380.0Contribution 225.1Investment fluctuations (96.7)Economic variance 20.8Profit on sale of Industrial Branch business 103.2Taxation (48.9)Currency & other items (3.9)Dividend (50.6)Embedded value 31 Dec 2002• Net assets 290.0• value of in-force business 1,239.0
1,529.0
Embedded Value Movement 2002
€m
* Restated for FRS 19 “Deferred Taxation” 38
39
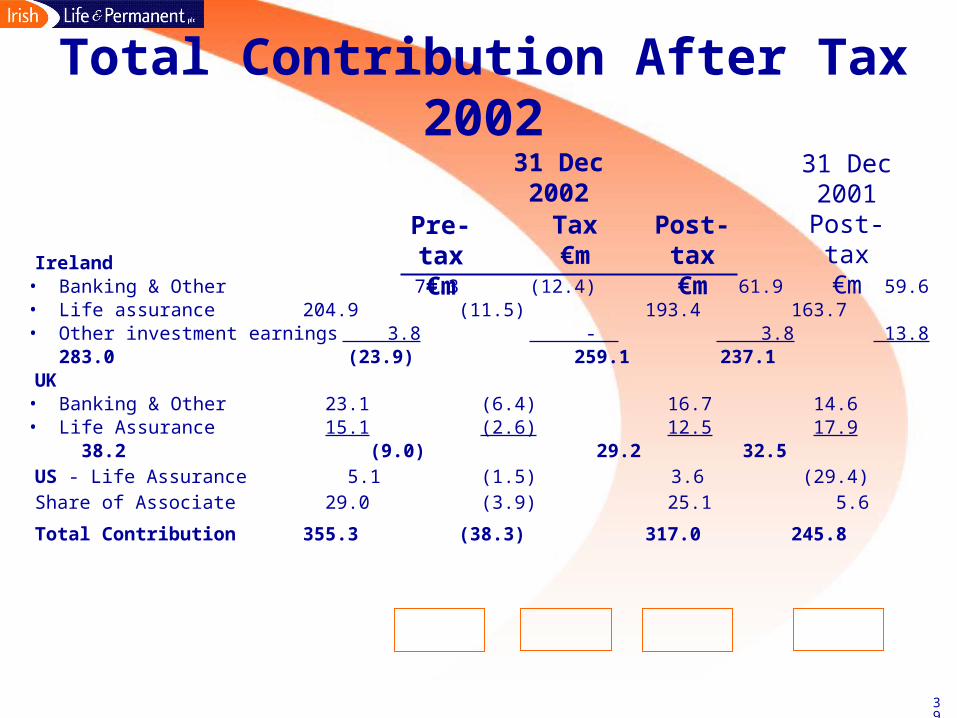
Ireland• Banking & Other 74.3 (12.4) 61.9 59.6• Life assurance 204.9 (11.5) 193.4 163.7• Other investment earnings 3.8 - 3.8 13.8
283.0 (23.9) 259.1 237.1UK• Banking & Other 23.1 (6.4) 16.7 14.6• Life Assurance 15.1 (2.6) 12.5 17.9
38.2 (9.0) 29.2 32.5US - Life Assurance 5.1 (1.5) 3.6 (29.4) Share of Associate 29.0 (3.9) 25.1 5.6
Total Contribution 355.3 (38.3) 317.0 245.8
Total Contribution After Tax 2002
31 Dec2001
Post-tax€m
31 Dec2002
Pre-tax€m
Tax€m
Post-tax€m
39

40
Total Contribution 355.3 (38.3) 317.0 245.8Investment fluctuations• Life (96.7) (16.4)* (113.1) (41.9)• Associate (33.0) 3.9 (29.1) (13.7)
Goodwill (11.7) - (11.7) (14.8)Economic variance 20.8 (12.2)* 8.6 (5.2)Exceptional items 123.5 (5.5) 118.0 (120.8)
Total Profit 358.2 (68.5) 289.7 49.4
Total Profit After Tax 200231 Dec2001
Post-tax€m
31 Dec2002
Pre-tax€m
Tax€m
Post-tax€m
* Includes €30.3m relating to the write down of unrealised tax losses 40

41
Ireland• Banking & Other 70.5 (10.9) 59.6 • Life assurance 174.4 (10.7) 163.7 • Other investment earnings 15.2 (1.4) 13.8
260.1 (23.0) 237.1 UK• Banking & Other 20.6 (6.0) 14.6 • Life Assurance 20.8 (2.9) 17.9
41.4 (8.9) 32.5 US - Life Assurance (37.9) 8.5 (29.4) Share of Associate 6.8 (1.2) 5.6
Total Contribution 270.4 (24.6) 245.8
Total Contribution After Tax 2001
31 Dec2001
Pre-tax€m
Tax€m
Post-tax€m
41

42
Total Contribution 270.4 (24.6) 245.8 Investment fluctuations• Life (43.3) 1.4 (41.9) • Associate (14.0) 0.3 (13.7)
Goodwill (14.8) - (14.8)Economic variance (6.2) 1.0 (5.2) Exceptional items (113.0) (7.8) (120.8)
Total Profit 79.1 (29.7) 49.4
Total Profit After Tax 200131 Dec2001
Pre-tax€m
Tax€m
Post-tax€m
42
43
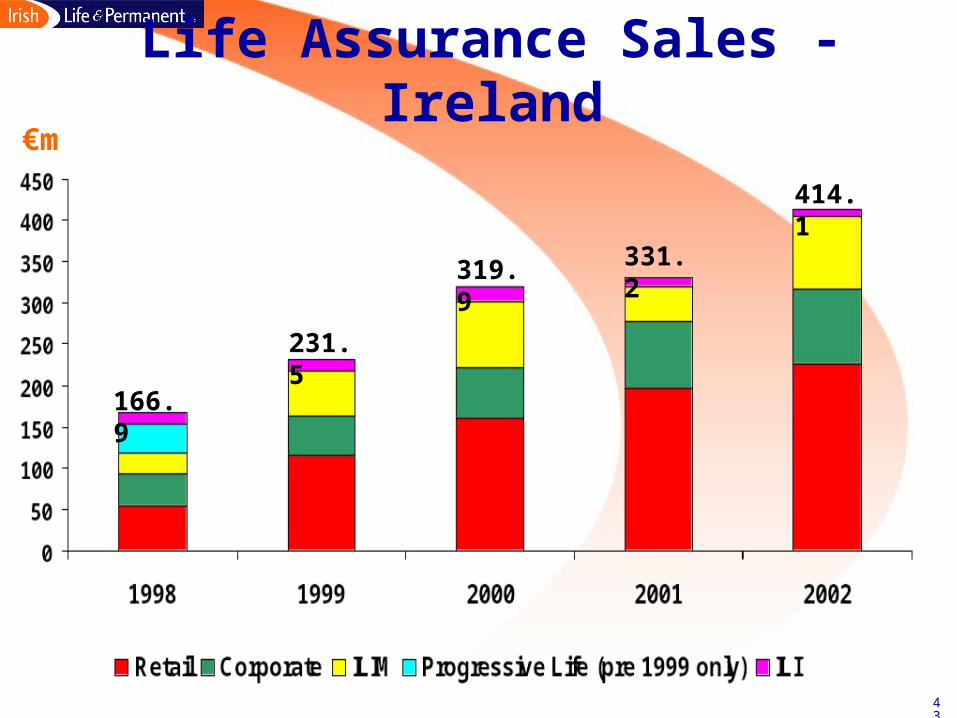
€m
* annual premium equivalent
166.9
231.5
319.9 331.2
414.1
Life Assurance Sales - Ireland
43

44
0
2
4
6
8
10
12
14
1998* 1999* 2000* 2001* 2002*
Total Residential
€bn
* includes securitised assets
Loans & Advances
Bank Lending Growth
5.9
7.6
9.2
12.914.6
44


![[XLS] · Web view7788 149 2003 5675 150 2003 2210 151 2003 14342 152 2003 5 153 2003 29 154 2002 155 2002 156 2002 157 2002 158 2002 468 159 2002 2304 160 2002 569 161 2002 96 162](https://static.documents.pub/doc/80x56/5ad48db07f8b9a1a028c0511/xls-view7788-149-2003-5675-150-2003-2210-151-2003-14342-152-2003-5-153-2003-29.jpg)


