32
1 2006/07 Interim numbers & Outlook SFAF Meeting - 15 November 2006 - Bernard HUVÉ CEO
| Date post: | 14-Dec-2015 |
| Category: |
Documents |
| Upload: | haden-westmoreland |
| View: | 213 times |
| Download: | 0 times |
1
2006/07 Interim numbers
& Outlook
SFAF Meeting
- 15 November 2006 -
Bernard HUVÉ CEO

2
SII at a glance
SII is present on the market of technology consulting- Outsourced R&D, engineering and systems integration & telecoms- Presence in France + subsidiary in Poland
A long-lasting company: 27 years of profitable growth (founded on 1 April 1979) 2005/06 sales: €105.7m (+21.6% of organic growth) 2005/06 operating margin: 10.1% Financially sound (IFRS) 31/03/06: Net cash €14.4m; Shareholders’ capital €34.2m
1 800 employees at 31 October 2006 (+23%)- Of which 80% engineers BAC + 5- A strong technical culture and client service
Value creation: 2005 ROCE (after tax) = 35.6%- A flexible organisation, decentralised, reactive- Stringent management on a day-to-day basis
ID card

3
SII’s services
Outsourced R&DR&D Consulting
Studies and implementationProcessing, industrialisation
66%
Systems Integration, Networks & Telecoms
Third partymaintenance
33%
Development consulting
87%
Project management assistance
5%
Other and non IT
8%
SII at a glance

4
Strasbourg
Sophia
Vélizy
Sannois
Lille
9 agences10 offices
Toulouse
Bordeaux
Nantes Tours
Le MansBrest Rennes
Caen
Lyon
MontpellierLa Ciotat
Aix0-100 Lille, Strasbourg, Warsaw
> 100 Aix, Rennes, Nantes Sannois, Sophia, Toulouse, Vélizy
Export 1%
Province63%
Ile de France
36%
Geographical breakdown of sales
Lannion
Niort
National geographical footprint – subsidiary in Poland
SII at a glance
1 subsidiary

5
A loyal clientele with major accounts
Major accounts 95%, SME 2%, Other 3%
20 top clients = 67% of sales- SII’s strategy: quality of service
- SII’s positioning: mixed teams – long and recurrent projects dual expertise: IT and functioning
- Client strategy: listings and discounts on sales, pricing pressure, requests for projects with
earnings commitment
SII at a glance
Amadeus EADS Gemalto Sagem Thales
DCN France Telecom IBM Siemens Thomson
TOP 10 CLIENTS
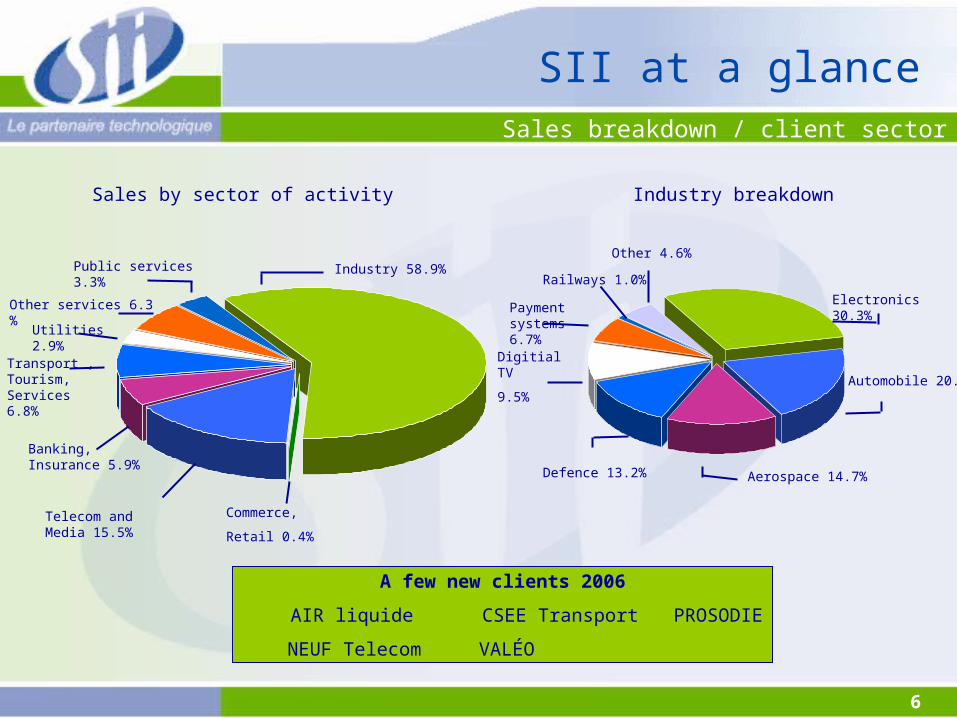
6
Banking, Insurance 5.9%
Sales breakdown / client sector
Industry 58.9%
Telecom and Media 15.5%
Transport , Tourism, Services 6.8%
A few new clients 2006
AIR liquide CSEE Transport PROSODIE
NEUF Telecom VALÉO
SII at a glance
Utilities 2.9%
Other services 6.3 %
Public services 3.3%
Sales by sector of activity Industry breakdown
Electronics 30.3%
Automobile 20.0%
Aerospace 14.7%Defence 13.2%
Digitial TV
9.5%
Payment systems 6.7%
Other 4.6%
Commerce,
Retail 0.4%
Railways 1.0%

7
Gaining strength of fixed-rate services Commitment to achieving earnings rather than supplying means Outsourcing Global contracts vs specific skills
Sales by contract
Changes in contracts
SII at a glance
Technicalassistance
73.3%
Other 7.9%
Fixed rate 18.8%
8
Summary
H1-2006/07
Sustained profitable growth – SII on the stock market
2006/07 Outlook and targets

9
Durable growth drivers- Product innovation, a factor of company competitiveness- Sustained growth in outsourcing (Flexibility / Technological complimentarity)- The taking off of built-in IT
Technology consulting, a buoyant market
Technology consulting€5bn
Outsourced IT R&D, software & ITand technical services
H1-2006/07
Source : Syntec Informatique 17 octobre 2006
Technology consulting outperforms the L&S sector
H1-2006 growth: 8% vs 6.5%
L&S sector(Syntec Informatique structure)
€21bn

10* Source : Syntec Informatique 17 octobre 2006
Return to buoyancy
-5
0
5
10
15
20
88 89 90 91 92 93 94 95 96 97 98 99 00 01 02 03 04 05 06
GDP L&S Investment
Growth founded on a recovery in IT investment- Projects reappear- Growth mainly driven by volumes and rarely by prices- Durable growth triggers (globalisation, competition, retirement boom)
But a tightening labour market- 65% of companies say they have difficulties in recruiting*- A greater turnover in the IT sector- Salary pressure
H1-2006/07
Growth in %

11
1 company, 9 profit centres - Low indirect rates (10.1%), despite decentralisation- Entrepreneur managers- Reporting in (virtually) real time
A quality approach at the heart of the strategy- One of the first IT services companies to obtain the ISO9001 certificate in 1992- One of very few IT services companies to be certified for 100% of its activity- A very advanced CMMi approach
Attributes of an average-sized player- Decentralisation / Responsibility- Commercial buoyancy- Local services with clients- Huge reactivity
SII outperforms technology consulting
SII +21% in H1-2006/07 vs Technology consulting +8%*
* Source : Syntec Informatique 17 octobre 2006
H1-2006/07

12
41.2
48.4
58.7
H1 2004 H1 2005 H1 2006
SII: Sustained growth
A buoyant first halfQ1 sales €29.61m, +21.3 %Q2 sales €29.13m, +21.3 %
+17.6%
Sales in €m+21.3%
H1-2006/07

13
102 107 108 118 140 173
942 9981059
12101297
1531
0
200
400
600
800
1000
1200
1400
1600
1800
2001 2002 2003 2004 2005 S1 2006
Productive headcount
Indirect
Average headcount
Recruitment trends
HR efforts in line with the strategy- Recent recruitments: 347 engineers (target: +700 engineers in 2006/07)- Huge capacity to recruit: school presence, dedicated in-house teams, enterprise culture,
cooptation- Turnover: 23% - Salary pressure
H1-2006/07
14
0
1
2
3
4
5
6
avr-0
4
juin-
04
août
-04
oct-0
4
déc-
04
févr
-05
avr-0
5
juin-
05
août
-05
oct-0
5
déc-
05
févr
-06
avr-0
6
juin-
06
août
-06
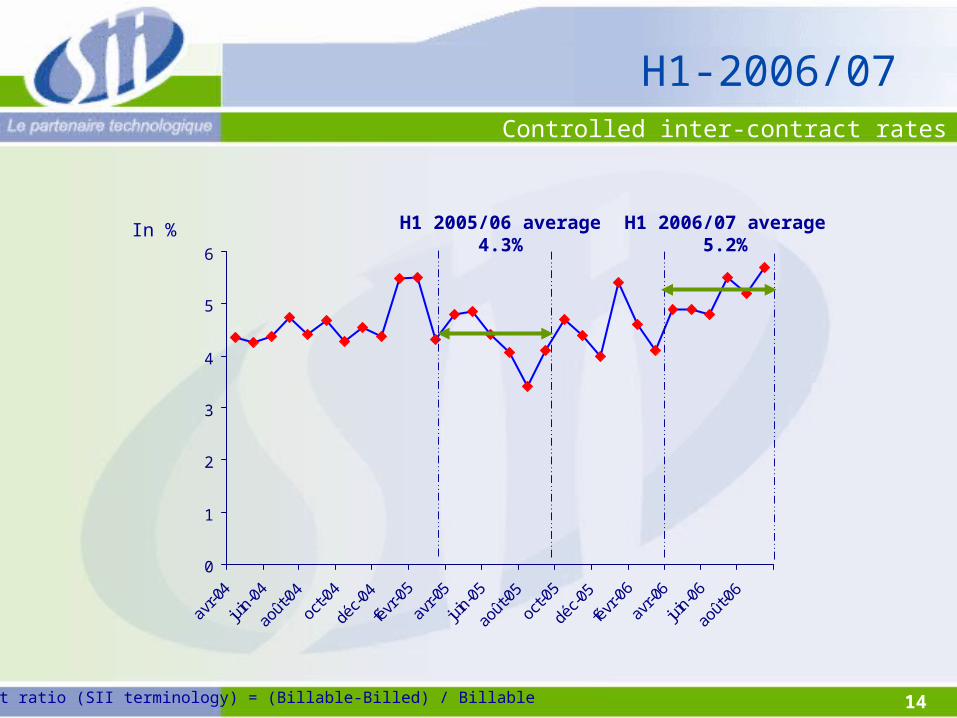
Inter-contract ratio (SII terminology) = (Billable-Billed) / Billable
Controlled inter-contract rates
In %
H1-2006/07
H1 2005/06 average4.3%
H1 2006/07 average5.2%

15
Billable days Q2 Q3 Q4 Q1 Total
2004/05 62 65 64 63 254
2005/06 63 64 63 65 255
2006/07 60 63 63 64 250
An unfavourable first half
A penalising 2006/07 timetable regarding sales- Fewer billable days (250!)- A first half (civil year Q2) with only 60 billable days- A base of comparison focused on SII’s first half
A huge temporary impact on profitability- Employees with 35 days of fixed holiday per year (25+10 fixed flexi days)- A direct impact on profitability (3 / 63 = 4.8% on Q2)- An impact spread over 2006/07 (5 / 255 = 2.2% over the year)
H1-2006/07

16
+ Commercial buoyancy (organic growth = +21%) – Slight increase in the inter-contract rate – Higher average salary > Increase in selling prices– Impact from n° of trading days on sales and above all on profitability
2006/07 Q2 Q3
Sales (€m) 29.61 29.13
2005/06 (in %) +21.3 +21.3
Op. margin (in % of sales) 6.2% 10.2%
Att. net profit (in % of sales) 4.3% 6.6%
Average headcount in quarter 1678 1733
In summary
H1-2006/07

17
Sustained profitable growth
H1-2006/07 numbers
Financial structure
SII shares

18
0.68
47.2
Sales€58.74m +21.3%
In €m
Consumed purchases
PayrollTaxes
4.9
1.7
Provisions
Sustained profitable growth
Other income and expenses
0.61
€4.83m -10.7%
Op. profit
Huge payroll = 80.4% of sales (vs 76.6%)- 4-day delay in billing- Average salary +2.5%

19
C L Ô T U R E A U 31 M A R S
Profit and loss account
Sustained profitable growth
In €m
H1-06/07
IFRS
H1-05/06
IFRS
Sales 58.74 48.43 +21.3
Operating profit 4.83 5.41 -10.7
in % of sales 8.2 11. 2
Financial products 0.11 0.21 -
Tax 1.73 1.94 -
Att. net profit 3.21 3.68 -12.8
in % of sales 5.5 7.7
Average headcount 1704 1346 +26.6
Headcount at end of period 1755 1422 -

20
Cash flow capacity
Change in WCR
Investment
Financing (incl. dividends)
Cash flow
Available cash
H1-2005/06
Cash flow table
Share transfers
In €m
Net cash
3.50
-0.60
-0.30
-1.50
-2.40
-4.10
-1.80
-4.20
H1-2006/07
Sustained profitable growth
4.20
2.00
-0.90
-0.80
0.30
-2.20
-1.00
-0.70

21
Financial structure
In €m
Sustained profitable growth
IFRS30/09/2005
Fixed assets3.4
WCR12.0
Cash16.3
Shareholders’capital
31.1
Fixed assets 0.6
IFRS30/09/2006
Fixed assets5.9
WCR18.9
Cash10.2
Shareholders’ capital
34.5
Fixed assets0.5

22
Shareholders’ structure
Personnel and fund 4.54%
Free float 30.61%
Management 56.42%
Treasury shares 8.43%
3 000 000 shares
SII shares
Source : SII

23
Technology consulting (Akka, Assystem, Alten, Altran, Ausy)
Eurolist (C)Code ISIN : FR0000074122
EuroNext segment NextEconomy / SBF 250 – Small 90
Stock-market performance
SII shares
Source JCF Quant
SII
20
25
30
35
40
45
50
55
T42003
T12004
T22004
T32004
T42004
T12005
T22005
T32005
T42005
T12006
T22006
T32006
T42006

24
2006/07 Outlook
SII strengths
2006/07 targets
SII outlook
Sector outlook

25
Sustained demand
Continued investment in companies- Catching up with underinvestment in the past
- Technological innovation, distribution of in-built electronics
- Renewal of IT systems
- Multiplication of projects (smaller but more frequent)
Growing outsourcing- Retirement boom
- Refocusing on the core business
- Increasingly complex projects
2006/07 Outlook
Today’s challenge: recruitment - Conserve criteria of quality and profitability
- SII: 700 engineers forecast in 2006/07 (half for turnover, half for growth)

26
Margins under pressure
Virtually stable reference prices- Pricing power on the demand side
- Overcapacity of the offering, dumping of small players
- Clients looking for savings
- Indirect pressure from offshoring
Selling price – cost price scissor effect- Pressure on salaries
- Shortfall of certain profiles
Problem of billable days- H2-2006/07 virtually stable in relation to 2005/06 (-1 day)
- 252 days in 2007/08
2006/07 Outlook
Billable days Q2 Q3 Q4 Q1 Total
2005/06 63 64 63 65 255
2006/07 60 63 63 64 250
2007/08 61 64 64 63 252

27
Constantly looking for improvement
SII proactive regarding profitability
Continued rigourous management- Reduced functioning costs- Indirect rates under pressure
Nearshore intervention capacity (Poland)
Growth / profitability arbitrage- Intention to not enter into a deflationary trend…- … which could lead to a refusal of missions
The real challenge: improvement of production processes- The possibility of work packages- The CMMi
2006/07 Outlook

28
The advantages of the CMMi model
Necessity to improve the management of complex projects- Clients require an increasing number of services to commit to earnings
- Additional risks… (exceeding budgets, changes) - …but opportunities to gain margins in certain conditions- Necessary discipline to control projects and optimise teams and expertise
Against this backdrop, quality insurance and CMMi valued processes are solutions adapted to the integration of IT systems.
2006/07 Outlook
Advantages for SII- Traceability, capitalisation and
reproductibility- Better management of employed
resources- Proposals for hybrid contracts- Reduction and control of unknown
Advantages for clients
- Better defined interfaces (quality) - Repeated follow up and deliveries- Platform development (outsourced services for the
supplier)
29
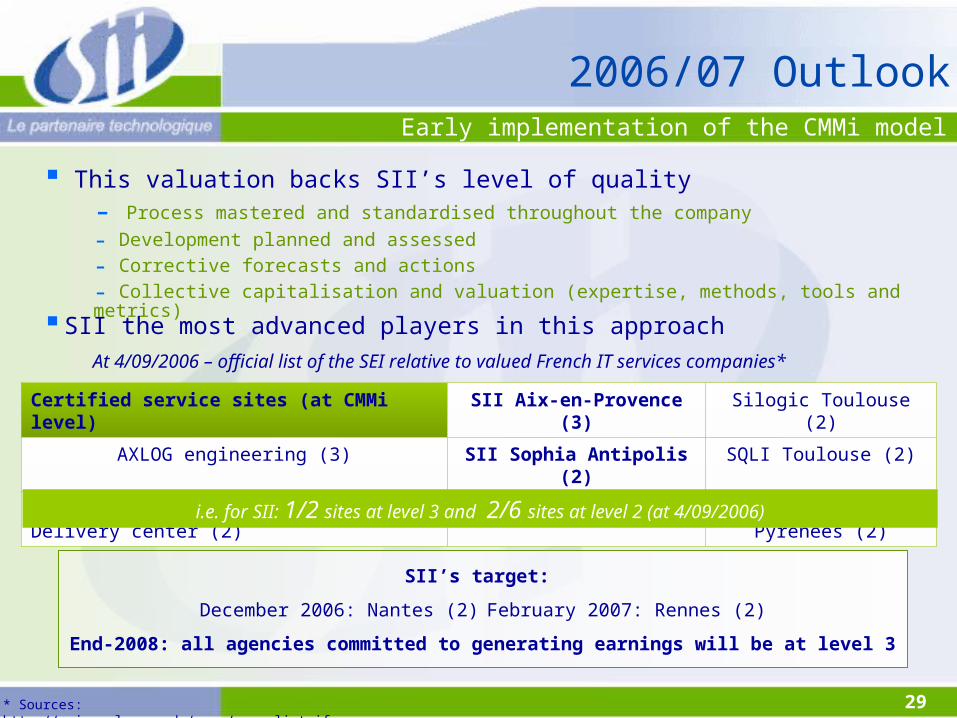
Early implementation of the CMMi model
This valuation backs SII’s level of quality- Process mastered and standardised throughout the company
- Development planned and assessed- Corrective forecasts and actions- Collective capitalisation and valuation (expertise, methods, tools and metrics)
2006/07 Outlook
Certified service sites (at CMMi level) SII Aix-en-Provence (3) Silogic Toulouse (2)
AXLOG engineering (3) SII Sophia Antipolis (2) SQLI Toulouse (2)
Cap Gemini-Paris Accelerated Delivery center (2)
SII Toulouse (2) Steria Midi Pyrénées (2)
SII the most advanced players in this approachAt 4/09/2006 – official list of the SEI relative to valued French IT services companies*
i.e. for SII: 1/2 sites at level 3 and 2/6 sites at level 2 (at 4/09/2006)
SII’s target:
December 2006: Nantes (2) February 2007: Rennes (2)
End-2008: all agencies committed to generating earnings will be at level 3
* Sources: http://seir.sel.cmu.edu/pars/pars_list_iframe.asp

30
2006/07 Outlook
1. Limited risksClients: large accounts, loyalHistorical and technoligical background Persisting quality insurance
2. Basic functional model One company, multiple profit centresDecentralised structure and localised servicesEnterprise culture: Technical and Services
SII’s strengths – Still the same!
3. Sound balance sheetSteady cash generationSatisfactory cash balanceNo financial debt

31
2006/07 Targets
Assumptions regarding the business climate Sustained demand
6-8% of growth according to IT Syntec3 times growth forecast for GDP
Margins under pressure2006 prices = 2005 prices + ε +0% (a little better in 2007?)
SII’s targets* Sales growth of around 20% (€125m-130m) Operating margin down (9-10%) 2,000 salaries at 31 March 2007 (net creation of 350/400 jobs)
Confirmation of targets from May 2006 *
* Réunion SFAF du 17 mai 2006

32
Upcoming meetings
Q3 earnings: 14 February 2007
Full-year earnings and SFAF meeting: 16 May 2007
2006/07 AGM: 20 September 2007


