22
1 About Xcelsius Prasad BKR
| Date post: | 22-Dec-2015 |
| Category: |
Documents |
| Upload: | felix-shelton |
| View: | 215 times |
| Download: | 0 times |
1
About Xcelsius
Prasad BKR
2
Agenda
11
12
13
14
15
About Xcelsius and Editions
Features and Components
Comparison: MS Excel vs SAP Xcelsius
Xcelsius Dashboard Screenshot
Xcelsius Sample Reports
3
About Xcelsius and Editions
4
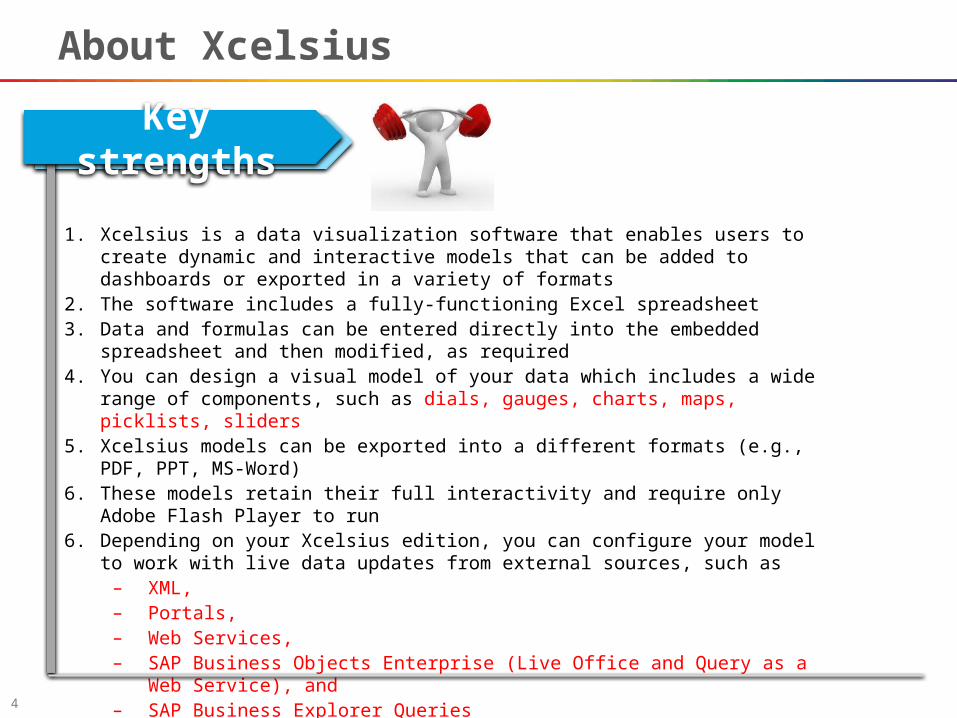
About Xcelsius
Key strengths
1. Xcelsius is a data visualization software that enables users to create dynamic and interactive models that can be added to dashboards or exported in a variety of formats
2. The software includes a fully-functioning Excel spreadsheet3. Data and formulas can be entered directly into the embedded spreadsheet and then
modified, as required4. You can design a visual model of your data which includes a wide range of components,
such as dials, gauges, charts, maps, picklists, sliders5. Xcelsius models can be exported into a different formats (e.g., PDF, PPT, MS-Word)6. These models retain their full interactivity and require only Adobe Flash Player to run6. Depending on your Xcelsius edition, you can configure your model to work with live data
updates from external sources, such as– XML,– Portals,– Web Services,– SAP Business Objects Enterprise (Live Office and Query as a Web Service), and– SAP Business Explorer Queries
5
Xcelsius Editions
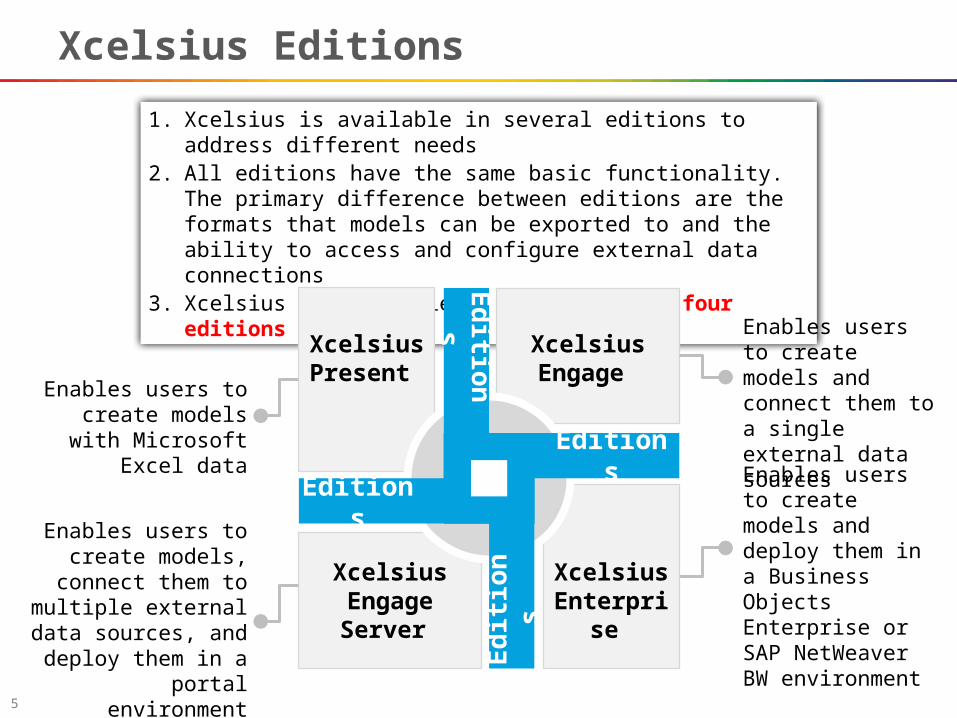
1. Xcelsius is available in several editions to address different needs2. All editions have the same basic functionality. The primary
difference between editions are the formats that models can be exported to and the ability to access and configure external data connections
3. Xcelsius is available in the following four editions
Enables users to create models and connect them to a single external data sources
Enables users to create models, connect them
to multiple external data sources, and deploy
them in a portal environment
Xcelsius Engage Server
Xcelsius Enterprise
Xcelsius Engage
Xcelsius Present
Editions
EditionsE
ditio
ns
E
dit
ion
s
Enables users to create models with
Microsoft Excel data
Enables users to create models and deploy them in a Business Objects Enterprise or SAP NetWeaver BW environment
6
Features and Components
7
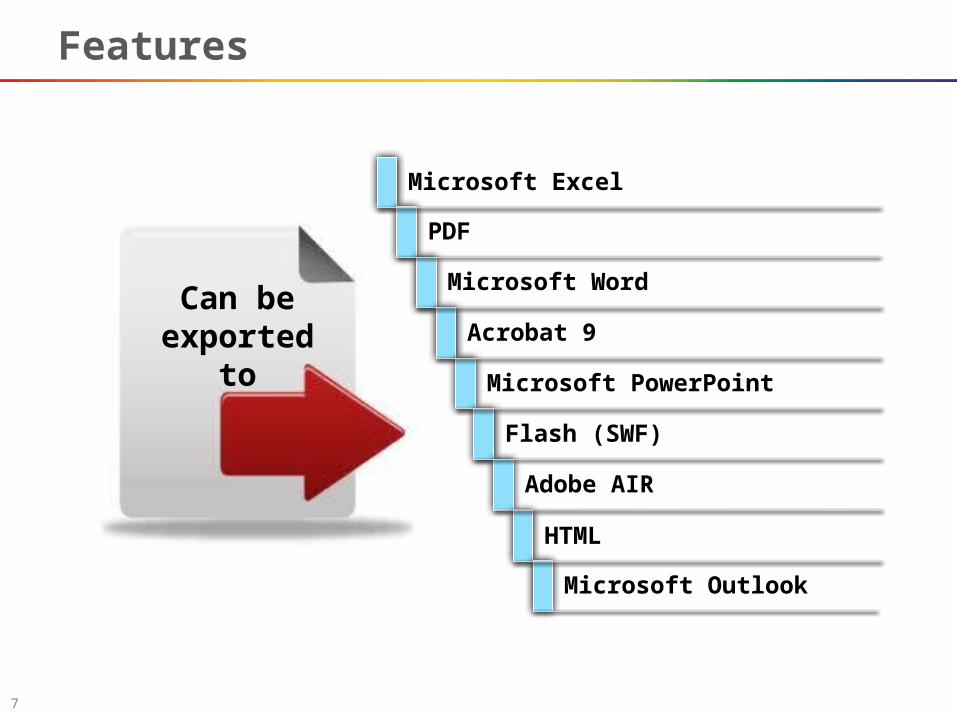
Features
Can be exported to
Microsoft Excel
Microsoft Word
Acrobat 9
Microsoft PowerPoint
Flash (SWF)
Adobe AIR
HTML
Microsoft Outlook
8
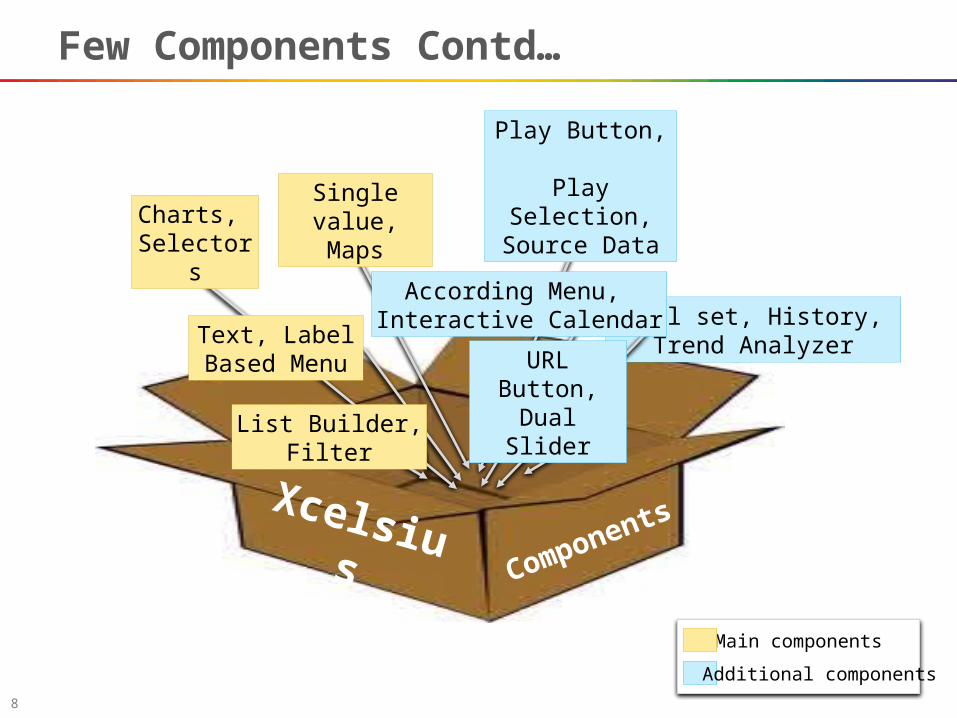
Few Components Contd…
Panel set, History, Trend Analyzer
Xcelsius Components
Single value, Maps
Text, Label Based Menu
URL Button,Dual Slider
List Builder, Filter
According Menu, Interactive Calendar
Play Button, Play Selection, Source DataCharts,
Selectors
Main components
Additional components

9
File formats
SWF is the vector-based graphics format designed to run in the Adobe Flash Player
12
Xcelsius models conform to Shock Wave Flash (SWF) file format11
Also, a vector-based file usually has a smaller file size than other animations
14
Because a SWF file is vector-based, its graphics are scalable and play back smoothly on any screen size and across multiple platforms
13
10
MS Excel vs. SAP Xcelsius
11
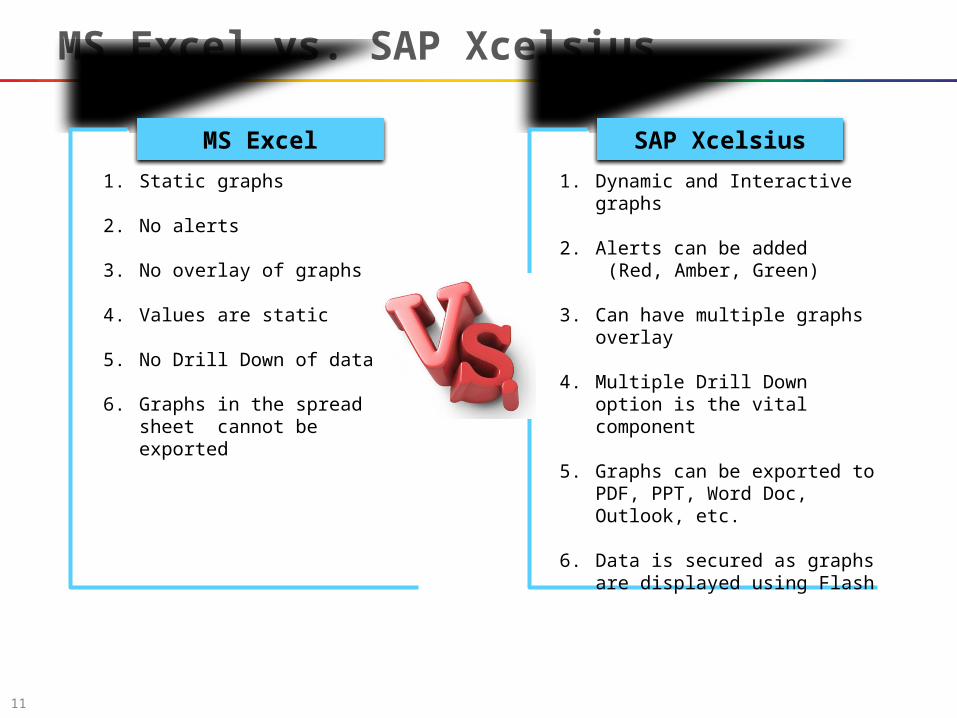
MS Excel vs. SAP Xcelsius
1. Dynamic and Interactive graphs
2. Alerts can be added (Red, Amber, Green)
3. Can have multiple graphs overlay
4. Multiple Drill Down option is the vital component
5. Graphs can be exported to PDF, PPT, Word Doc, Outlook, etc.
6. Data is secured as graphs are displayed using Flash
1. Static graphs
2. No alerts
3. No overlay of graphs
4. Values are static
5. No Drill Down of data
6. Graphs in the spread sheet cannot be exported
SAP XcelsiusMS Excel
12
Xcelsius Report/Dashboard Screenshots
13
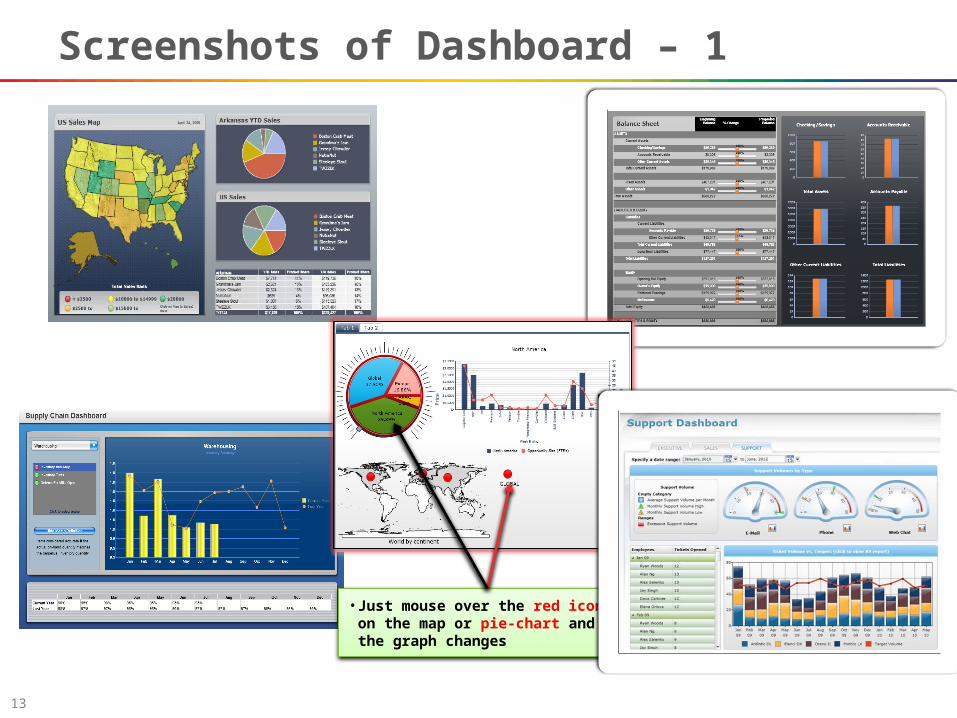
• Just mouse over the red icon on the map or pie-chart and the graph changes
Screenshots of Dashboard – 1
14
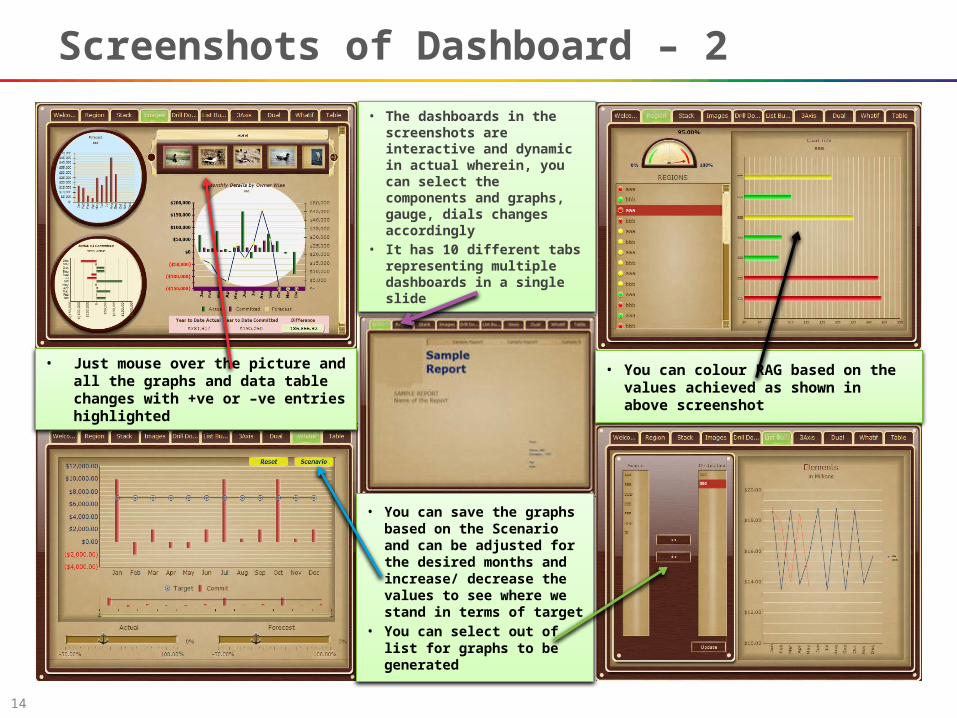
• The dashboards in the screenshots are interactive and dynamic in actual wherein, you can select the components and graphs, gauge, dials changes accordingly
• It has 10 different tabs representing multiple dashboards in a single slide
• You can save the graphs based on the Scenario and can be adjusted for the desired months and increase/ decrease the values to see where we stand in terms of target
• You can select out of list for graphs to be generated
• You can colour RAG based on the values achieved as shown in above screenshot
• Just mouse over the picture and all the graphs and data table changes with +ve or –ve entries highlighted
Screenshots of Dashboard – 2
15
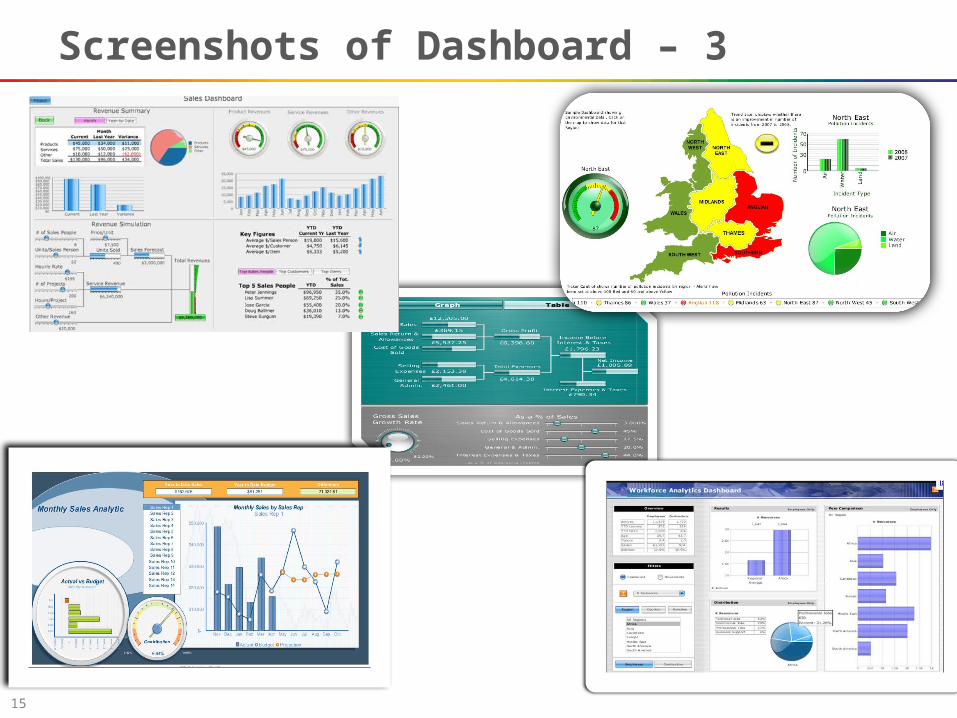
Screenshots of Dashboard – 3
16
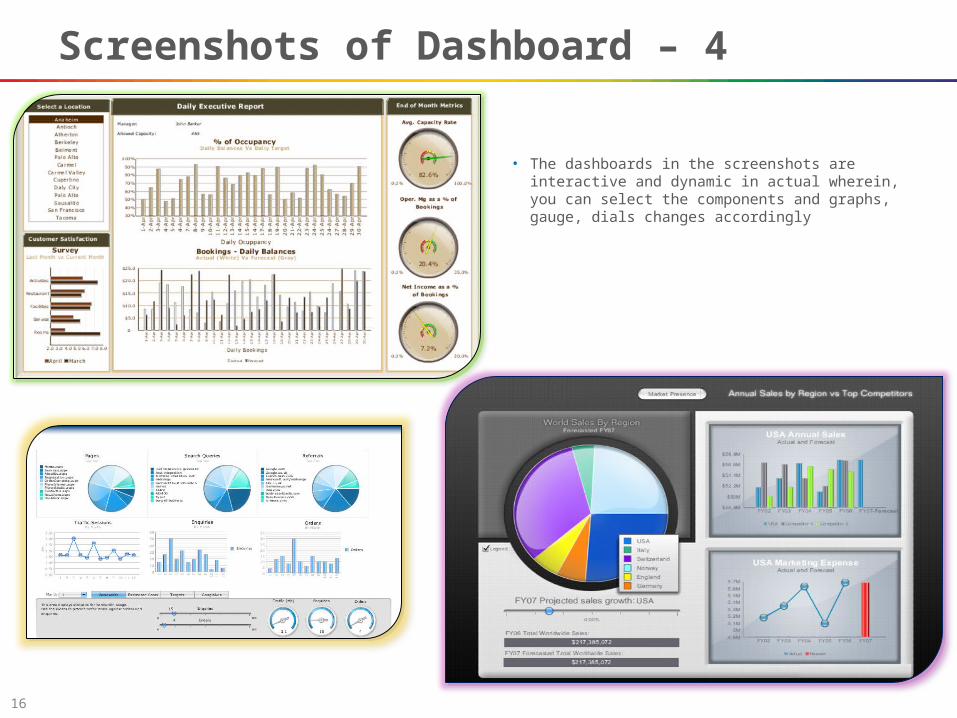
Screenshots of Dashboard – 4
• The dashboards in the screenshots are interactive and dynamic in actual wherein, you can select the components and graphs, gauge, dials changes accordingly
17
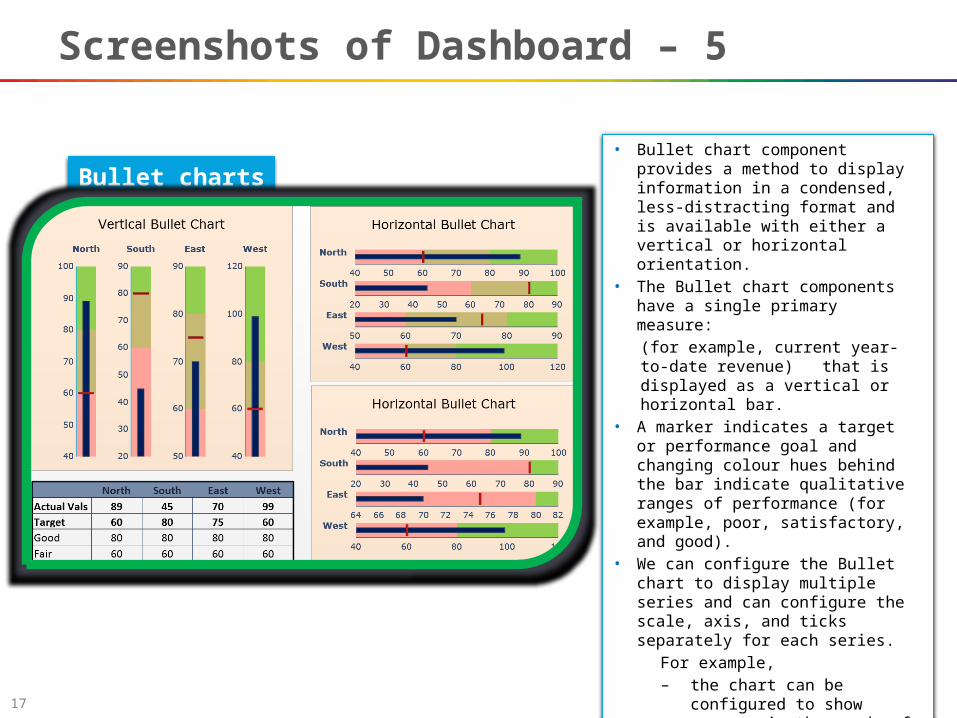
Bullet charts• Bullet chart component provides a
method to display information in a condensed, less-distracting format and is available with either a vertical or horizontal orientation.
• The Bullet chart components have a single primary measure:
(for example, current year-to-date revenue) that is displayed as a vertical or horizontal bar.
• A marker indicates a target or performance goal and changing colour hues behind the bar indicate qualitative ranges of performance (for example, poor, satisfactory, and good).
• We can configure the Bullet chart to display multiple series and can configure the scale, axis, and ticks separately for each series.
For example,– the chart can be configured to
show revenue in thousands of dollars, profit in dollars, and order size as a count.
Screenshots of Dashboard – 5
18
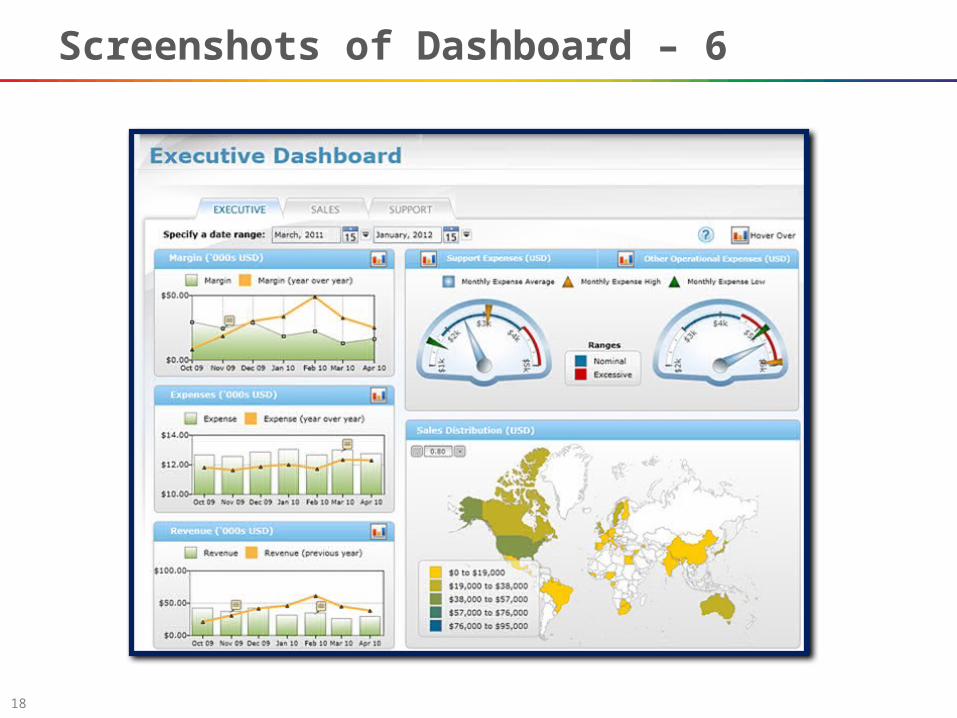
Screenshots of Dashboard – 6
19
Xcelsius Sample Report/Dashboard
Note: The data & information in the Dashboard slides are only for Demo Purpose
20
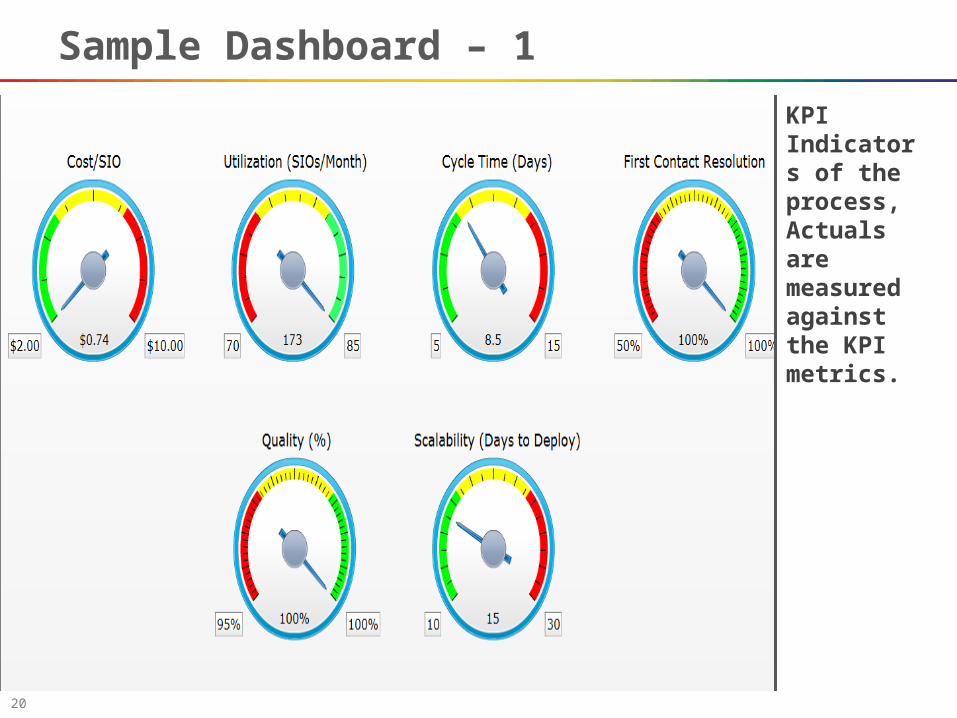
Sample Dashboard – 1
KPI Indicators of the process,Actuals are measured against the KPI metrics.
21
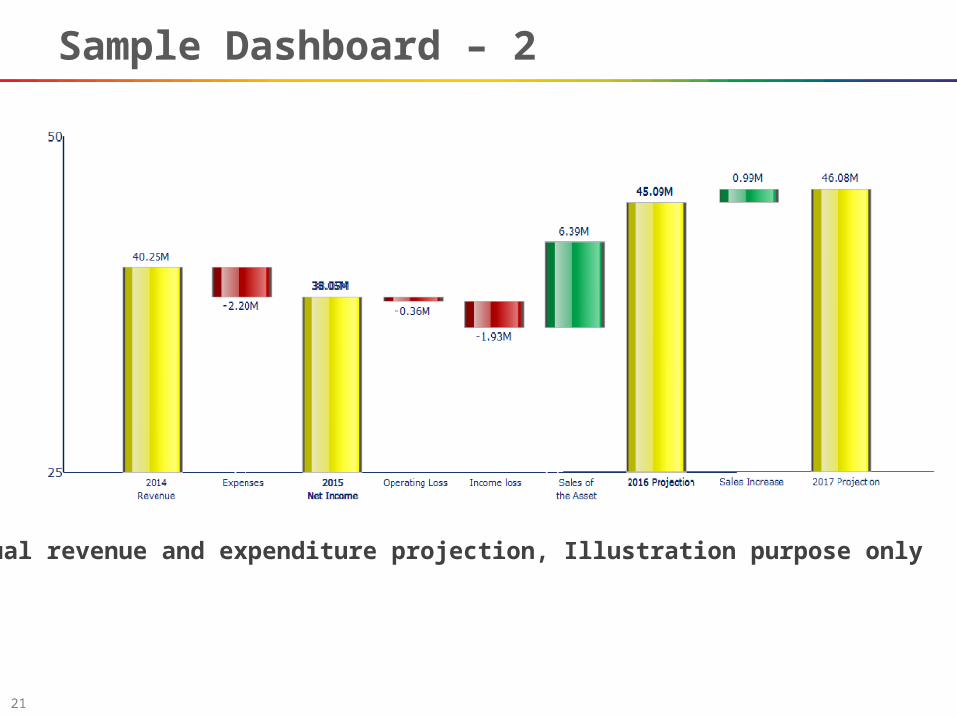
Sample Dashboard – 2
Annual revenue and expenditure projection, Illustration purpose only
22
THANK YOU
Prasad BKR


