Challenge H: For an even safer and more secure railway COMPUTATION OF THE SAFE EMERGENCY BRAKING DECELERATION FOR TRAINS OPERATED BY ETCS/ERTMS USING THE MONTE CARLO STATISTICAL APPROACH 1. Abstract 2. Introduction The purpose of speed control systems is to protect the train and trigger an emergency braking in case of danger. The system takes into account the speed and position of the train relative to the limits allowed for the safety of railway operation. If the allowed limits are exceeded, the driver is first informed and in the absence of appropriate reaction, the emergency brakes are applied automatically. These systems have been developed on a national basis and the philosophy used to build the control strategy is closely linked to the underlying signalling system, with specific functional concepts. In France for instance the KVB (Speed control by balise) is used for conventional railway whereas the TVM (Track to train transmission) is dedicated to high speed lines. Different solutions exist also for the transmission media (balise, rail, GSM-R…) and for the type of monitoring (piecewise constant speed threshold, parabolic speed threshold…). Speed control systems have been constantly upgraded to increase the performance and to incorporate the latest technological improvements. The development of numeric systems in the 90s has also deeply modified the design of train control systems and opened new perspectives in terms of performance. As a consequence, a large variety of incompatible speed control systems exists in Europe and represents an obstacle for interoperability and for the development of rail transport at the European level. ETCS is the European Train Control System created to address these incompatibility issues by creating a unique train control system, to replace the existing national speed control systems. The deployment of ERTMS enables the creation of a seamless European railway system. ETCS is based on an a set of braking curves, computed in real time and depending on different physical parameters (estimated speed of the train, track profile, train acceleration, etc. …). On the one hand, some of these curves provide useful information to the driver: the Pre-Indication curve and the Indication curve for instance, inform the driver that he has to initiate a service brake to respect the signals. On the other hand, the safety of the system is based on the Emergency Brake Deceleration curve (EBD). This parabolic shaped curve starts from the Supervised Location (SvL) and is computed with the guaranteed emergency brake deceleration, which incorporates the safety margin. As a result, the statistical dispersion of the emergency braking performance is taken into account, as illustrated in Figure 1 below. Typically, a large safety margin will result in a flat EBD curve, spanning a more important distance range. The Emergency Brake Intervention curve (EBI) which is used to trigger the emergency brake is then directly shifted from the EBD curve with the equivalent emergency brake build up time. To respect ergonomic principles, the curves related to the service brake are positioned upstream compared to the EBI curve: thus a driver who respects the signals will not be impacted by the EBI curve.
Transcript
Challenge H: For an even safer and more secure railway
COMPUTATION OF THE SAFE EMERGENCY BRAKINGDECELERATION FOR TRAINS OPERATED BY ETCS/ERTMS
USING THE MONTE CARLO STATISTICAL APPROACH
1. Abstract
2. IntroductionThe purpose of speed control systems is to protect the train and trigger an emergency braking in caseof danger. The system takes into account the speed and position of the train relative to the limitsallowed for the safety of railway operation. If the allowed limits are exceeded, the driver is firstinformed and in the absence of appropriate reaction, the emergency brakes are applied automatically.
These systems have been developed on a national basis and the philosophy used to build the controlstrategy is closely linked to the underlying signalling system, with specific functional concepts. InFrance for instance the KVB (Speed control by balise) is used for conventional railway whereas theTVM (Track to train transmission) is dedicated to high speed lines. Different solutions exist also forthe transmission media (balise, rail, GSM-R…) and for the type of monitoring (piecewise constantspeed threshold, parabolic speed threshold…). Speed control systems have been constantlyupgraded to increase the performance and to incorporate the latest technological improvements. Thedevelopment of numeric systems in the 90s has also deeply modified the design of train controlsystems and opened new perspectives in terms of performance.
As a consequence, a large variety of incompatible speed control systems exists in Europe andrepresents an obstacle for interoperability and for the development of rail transport at the Europeanlevel. ETCS is the European Train Control System created to address these incompatibility issues bycreating a unique train control system, to replace the existing national speed control systems. Thedeployment of ERTMS enables the creation of a seamless European railway system.
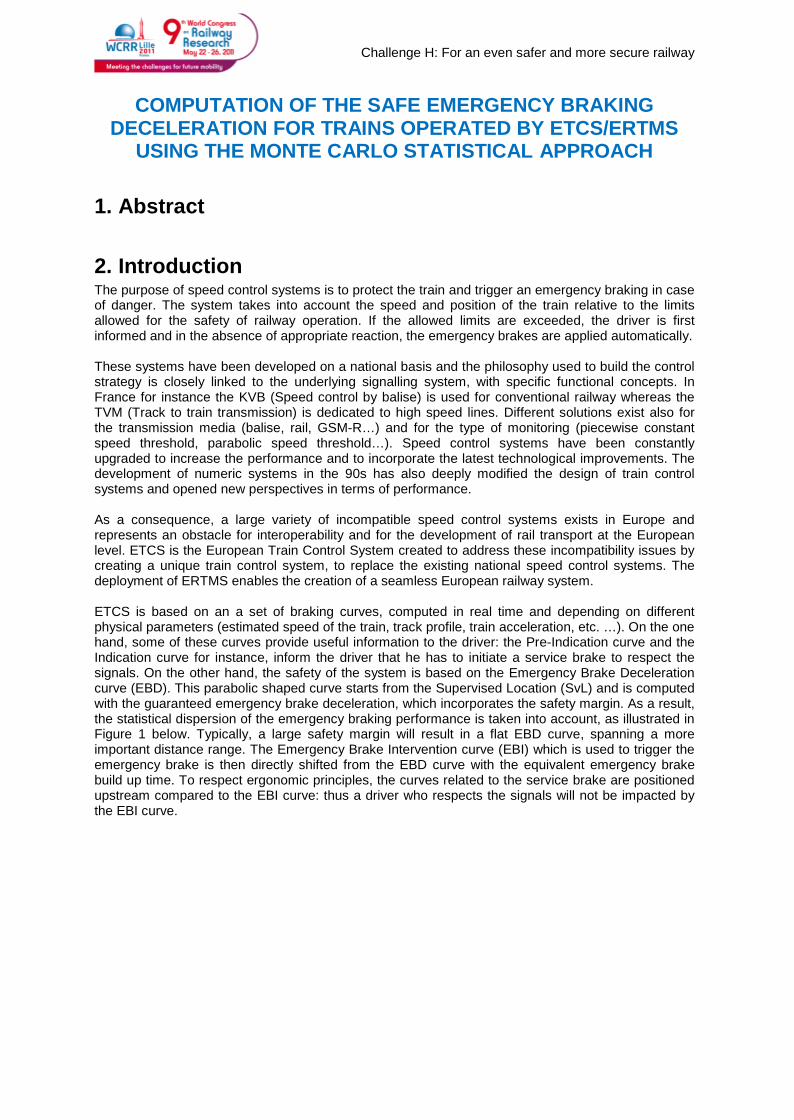
ETCS is based on an a set of braking curves, computed in real time and depending on differentphysical parameters (estimated speed of the train, track profile, train acceleration, etc. …). On the onehand, some of these curves provide useful information to the driver: the Pre-Indication curve and theIndication curve for instance, inform the driver that he has to initiate a service brake to respect thesignals. On the other hand, the safety of the system is based on the Emergency Brake Decelerationcurve (EBD). This parabolic shaped curve starts from the Supervised Location (SvL) and is computedwith the guaranteed emergency brake deceleration, which incorporates the safety margin. As a result,the statistical dispersion of the emergency braking performance is taken into account, as illustrated inFigure 1 below. Typically, a large safety margin will result in a flat EBD curve, spanning a moreimportant distance range. The Emergency Brake Intervention curve (EBI) which is used to trigger theemergency brake is then directly shifted from the EBD curve with the equivalent emergency brakebuild up time. To respect ergonomic principles, the curves related to the service brake are positionedupstream compared to the EBI curve: thus a driver who respects the signals will not be impacted bythe EBI curve.
Challenge H: For an even safer and more secure railway
Figure 1 : Statistical dispersion of the emergency brake performance
3. ERTMS/ETCS framework for safety marginsThe management of safety margins is strongly influenced by the existing signalling systems and thespeed control systems used. The safety margin can be materialized by a global fixed margin, appliedto the overall braking distance and taking into account rolling stock and trackside dispersion. Inaddition the safety margin is often not ensuring alone the overall safety: it is also supported byoperational rules and trackside characteristics. This global value is usually confirmed by operationalfeedback. However one major inconvenient of this approach is that it doesn’t allow any optimization ofthe system and that it can be an obstacle to handle the case of cross border trains: the same marginis applied independently from the braking performance.
ETCS has introduced a unified framework to take into account safety margins. This method,described in detail in the latest release of the ERTMS/ETCS System Requirement Specifications(SRS Baseline 3), uses different parameters for safety margins. The main sources of dispersion areseparated, making the representation closer to the real apportionment and allowing a more accurateallocation of the safety target. Adhesion, which has a great influence on the performance and which isat the interface between trackside and rolling stock is handled specifically. The approach is based ontwo multiplicative rolling stock correction factors Kdry_rst and Kwet_rst, applied to the nominalemergency brake performance and which depend themselves on two trackside parameters,respectively EBCL and AVADH:
Kdry_rst takes into account the rolling stock characteristics and represents the statisticaldispersion of braking effort on dry rails. It is provided as a table indexed by the confidencelevel EBCL.
The Emergency Brake Confidence Level (EBCL) is transmitted by trackside and correspondsto the confidence level on the emergency brake deceleration on dry rails. It is used to selectthe appropriate Kdry_rst value. It corresponds to the probability of the event “The rolling stockemergency brake subsystem of the train does ensure a deceleration at least equal toKdry_rst(EBCL) * A_brake_emergency”. Confidence level values are usually between 90%(equivalent to 10-1) and 99.9999999% (equivalent to 10-9).
Kwet_rst is a rolling stock parameter which represents the dispersion due to adhesiondegradation. Since adhesion loss depends both on rolling stock and trackside characteristics,the margin is separated from Kdry_rst. Kwet_rst corresponds to the deceleration degradationbetween wet and dry rail conditions as defined in the UIC leaflet 541-05. It is directlymodulated by the weighting factor AVADH transmitted by trackside.
The parameter AVADH (AVailable ADHesion) is transmitted by trackside and is used as aweighting factor for the correction factor Kwet_rst. It is used by the Infrastructure Manager tomodulate Kwet_rst on the basis of the trackside characteristics (for instance during autumn tohandle the case of dead leaves).
Distance
Speed
Train A Train B
EBD curveSafe Emergency
Brake DecelerationSupervised
Location
Safety Margin
Nominal EmergencyBrake Deceleration
Challenge H: For an even safer and more secure railway
Figure 2 : Calculation of correction factors
Nominal EmergencyBrake Deceleration
A_brake_emergency
Braking curvecomputation
Available AdhesionWeighting Factor
AVADH
Correction Factor
Kwet_rst
Correction factor Kdry_rst TABLEKdry_rst(v,EBCL9)
Kdry_rst(v,EBCLi)
Kdry_rst(v,EBCL1)
Emergency BrakeConfidence Level
EBCLTRACKSIDE
ROLLING STOCK
A_brake_safeA_brake_dry
Challenge H: For an even safer and more secure railway
4. Optimization of the safety margin with ETCSThe trackside and the rolling stock characteristics play an important role in the determination of thesafe emergency brake deceleration. To take benefit from the new safety margin structure laid down inBaseline 3, the correction factors and the trackside parameters must reflect as much as possiblerolling stock and trackside characteristics respectively. The next paragraphs propose methods usedby the SNCF Rolling Stock Engineering Center that exploits this new leverage for the safety marginmanagement.
4.1. The safety allocation: first step toward optimization
The confidence level used in the ETCS braking curves concerns the emergency braking performanceof the train. It is only a component of the overall safety of train operation. The overall safety target isassociated to the probability of the following unwanted event “the train overruns the Danger Point”.The Danger Point (DP) corresponds to the fouling point of a crossing or to beginning of an occupiedblock. The Supervised Location (SvL) is the point targeted by the EBD curve and is located a distanceФ called overlap before the Danger Point. All the braking events which can lead to overrun the dangerpoint must be considered in the safety study. The safety target is usually expressed as follows:
P(Train overruns DP = SvL + Ф) ≤ 10-x
A first approach consists in allocating directly the overall safety target to the Emergency brakingdeceleration EBD. Mathematically it corresponds to the equation:
P(Train overruns SvL) ≤ 10-x
The overall safety target is respected on the Supervised Location and as a consequence on theDanger Point. This means that the whole safety of the system is affected to the emergency brakingcurve EBD. This is illustrated in Figure 3 where the parameter x is directly used for the EBD curve,thus selecting a relatively low level of deceleration. The Indication curve which is shifted from the EBDcurve will be impacted by the selected confidence level and the train A will see it’s braking instruction(materialized by the yellow circle) relatively in advance: as a consequence the driver will apply thebrakes early.
It is also possible to take into account the contribution of trackside margins, materialized by theoverlap distance. The overlap distance depends on several parameters (speed of the line, trafficdensity, trackside configuration…) and can vary from few meters to thousand meters. If the probability10-y is associated to the overlap distance, then the confidence level of the EBD curve can be set tothe value 10-x+y as follows:
P(Train overruns SvL) ≤ 10-x+y
By selecting the confidence level EBCL = 10-x+y for the emergency brake safe deceleration, the overallsafety target is still respected, and the margin is then shared between trackside overlap and rollingstock emergency deceleration:
P(Train overruns DP) ≤ 10-x
Figure 4 shows the shortening of the stopping distance obtained with a steeper EBD curve. Thus thedriver observes the braking instruction later and the stopping distance is shorter. The main advantageof the optimized approach is that the allocation of the safety target takes into account each existingmargin, and that the performance is increased. The perturbation point is reduced by the distance:
Challenge H: For an even safer and more secure railway
Figure 3 : Safety allocation - direct approach
Figure 4 : Safety allocation - optimized approach
Distance
OverlapDistance
Speed
DangerPoint
SupervisedLocation
Train A
Train B10-x
BrakingInstruction
EBDcurve
Indicationcurve
10-x+y
Distance
OverlapDistance
Speed
DangerPoint
Train A
Train B10-x
BrakingInstruction
EBDcurve
Indicationcurve
SupervisedLocation
Challenge H: For an even safer and more secure railway
4.2. Rolling stock correction factors optimization with theMonte Carlo method
4.2.1. Origin and development of the method
The main principles of the method have been established by the UIC Workgroup B126.15C, whoseobjective was to define a unified algorithm to obtain the safety margins in order to facilitateinteroperability. The determination of Kdry_rst is not straightforward since there is no analyticalrelation between the correction factors and the parameters of the braking architecture. Differentoptions have been investigated and the probabilistic Monte Carlo method was found to be the mostsuited for the calculation of correction factors to be applied to the emergency brake deceleration.Today Railway Undertakings are still free of choosing their own method for the computation of safetymargins; however the European Railway Agency (ERA) encourages the use of this probabilisticmethod. In the end of 2009, ERA has organized a call for tender for the provision of case studies tocompute the correction factor. In the frame of this procedure, the tool developed by the SNCF RollingStock Engineering center was submitted and finally selected. A 4 year contract was concludedbetween ERA and the Rolling Stock Engineering center to deliver correction factor for RailwayUndertakings who plan to equip their rolling stock with ERTMS/ETCS.
4.2.2. Description of the methodology
The methodology used to compute the correction factor is composed of following steps:
Functional description of the braking architecture
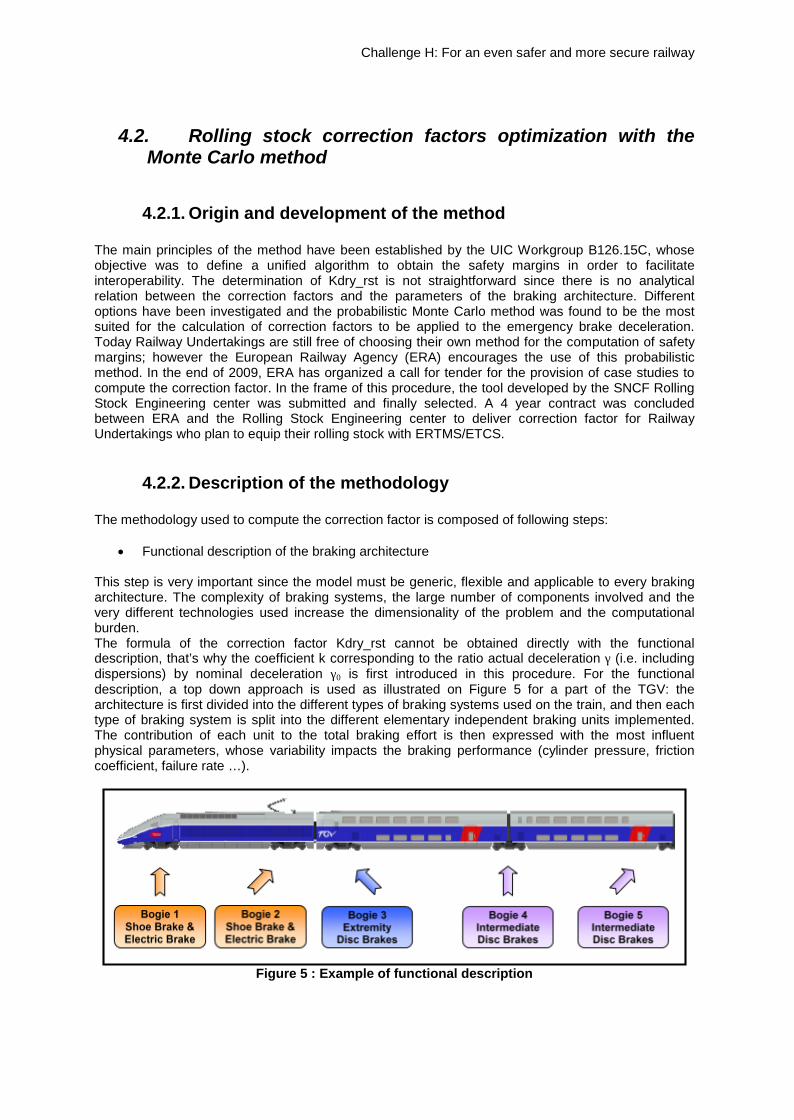
This step is very important since the model must be generic, flexible and applicable to every brakingarchitecture. The complexity of braking systems, the large number of components involved and thevery different technologies used increase the dimensionality of the problem and the computationalburden.The formula of the correction factor Kdry_rst cannot be obtained directly with the functionaldescription, that’s why the coefficient k corresponding to the ratio actual deceleration γ (i.e. includingdispersions) by nominal deceleration γ0 is first introduced in this procedure. For the functionaldescription, a top down approach is used as illustrated on Figure 5 for a part of the TGV: thearchitecture is first divided into the different types of braking systems used on the train, and then eachtype of braking system is split into the different elementary independent braking units implemented.The contribution of each unit to the total braking effort is then expressed with the most influentphysical parameters, whose variability impacts the braking performance (cylinder pressure, frictioncoefficient, failure rate …).
Figure 5 : Example of functional description
Bogie 1Shoe Brake &Electric Brake
Bogie 2Shoe Brake &Electric Brake
Bogie 4IntermediateDisc Brakes
Bogie 3Extremity
Disc Brakes
Bogie 5IntermediateDisc Brakes
Challenge H: For an even safer and more secure railway
The result of this step is the equation of the ratio k, as a function of the most influent physicalparameters:
),...,,( 210
qxxxfk
Description of the variability of the physical parameters
The dispersion of the physical parameters is described with the type and the characteristics of theirstatistical distribution. Uniform and normal laws for the continuous variability and Bernoulli law for thepartial/total loss of braking effort are the most commonly used distributions to represent dispersion.The selection of the distribution and the definition of the parameters are important tasks and arebased on experimental data or on the braking expert’s knowledge. If necessary, customizeddistributions can also be introduced to interpolate operational data.
Numerical simulation with the Monte Carlo Method
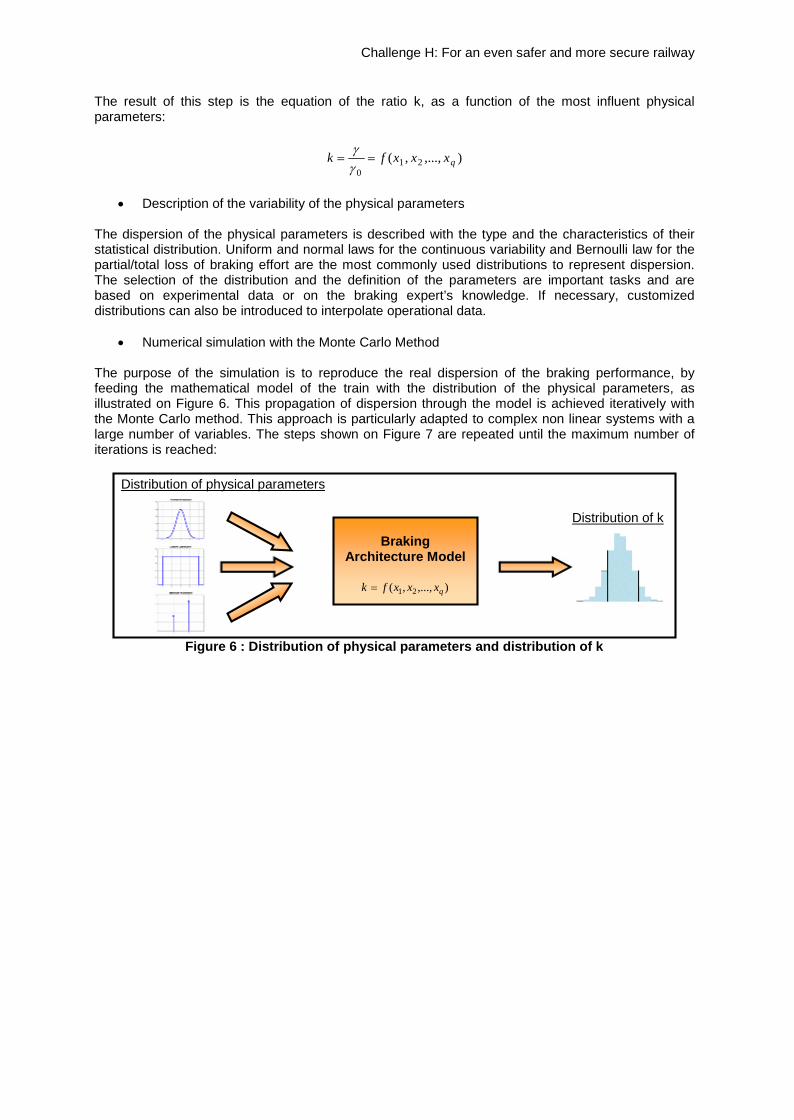
The purpose of the simulation is to reproduce the real dispersion of the braking performance, byfeeding the mathematical model of the train with the distribution of the physical parameters, asillustrated on Figure 6. This propagation of dispersion through the model is achieved iteratively withthe Monte Carlo method. This approach is particularly adapted to complex non linear systems with alarge number of variables. The steps shown on Figure 7 are repeated until the maximum number ofiterations is reached:
Figure 6 : Distribution of physical parameters and distribution of k
BrakingArchitecture Model
),...,,( 21 qxxxfk
Distribution of k
Distribution of physical parameters
Challenge H: For an even safer and more secure railway
Figure 7 : Structure of the Monte Carlo method
The maximum number of iterations depends on the confidence level that is requested for thecorrection factor. The results of the individual evaluations of the model are then aggregated in order toproduce the statistical distribution of parameter k. In case of several speed ranges with differentdeceleration values, the previous method needs to be repeated separately on each speed range.
Determination of the correction factor Kdry_rst
The next step consists in processing the statistical distribution of k in order to extract the correctionfactor values Kdry_rst for each requested confidence level. From a probabilistic point of view,Kdry_rst is defined as the value, such as the probability to have a value of k greater or equal is EBCL.Mathematically, this can be expressed by following equations, with probabilities or with the cumulativedistribution function Fk:
EBCLrstKdryF
or
EBCLKkP
k
rstdry
1_
_
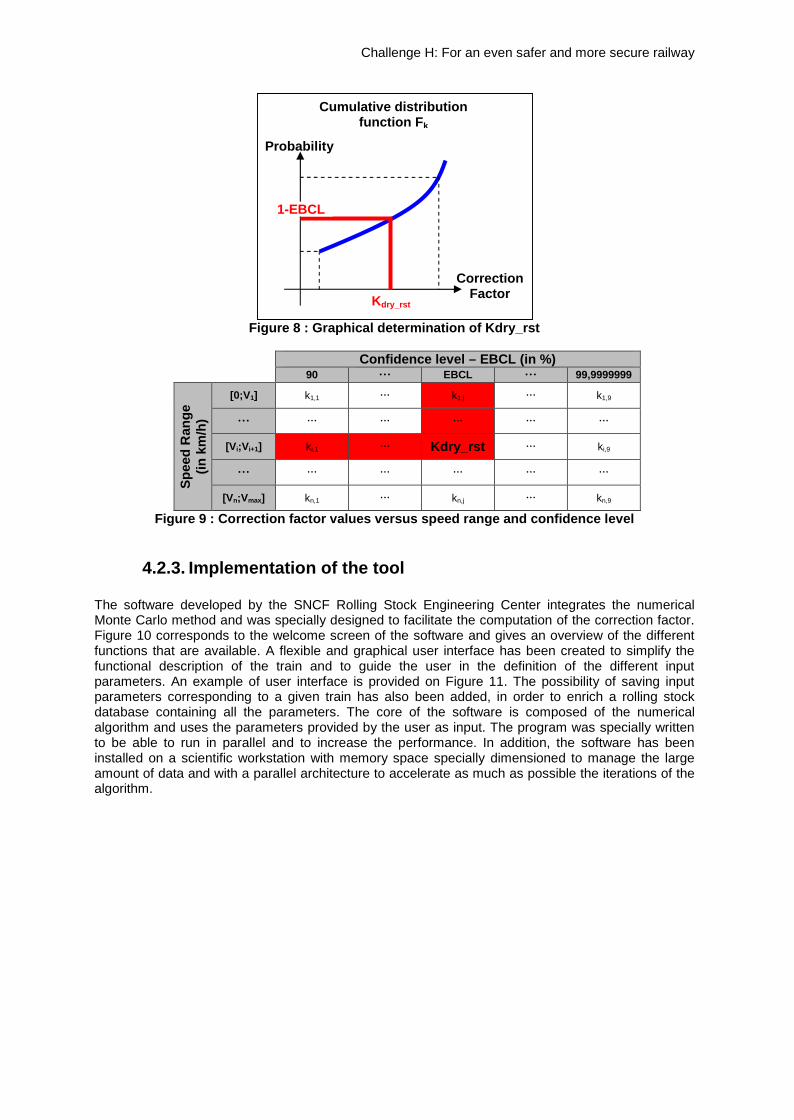
The last equation can be used to determine graphically Kdry_rst. On the representation of thecumulative distribution function of Figure 8, the correction factor is directly the value that correspondsto the value 1-EBCL.The results are synthesized in a table, indicating the correction factor values infunction of the speed range and the confidence value, according to the template of Figure 9:
iter greaterthan maximum
number ofiteration ?
no1 iteriter
2 – Evaluation of the model iter
qiteriter
iter xxxfk ,...,, 21
1 – Generation of the statistic samples iter
qiteriter xxx ,...,, 21
3 – Processing of input data and results iter
qiteriter
iter xxxk ,...,,et 21
Start of simulation0iter
End of simulation
Challenge H: For an even safer and more secure railway
Figure 8 : Graphical determination of Kdry_rst
Confidence level – EBCL (in %)90 EBCL 99,9999999
Spee
d R
ange
(in k
m/h
)
[0;V1] k1,1 k1,j k1,9
[Vi;Vi+1] ki,1 Kdry_rst ki,9
[Vn;Vmax] kn,1 kn,j kn,9
Figure 9 : Correction factor values versus speed range and confidence level
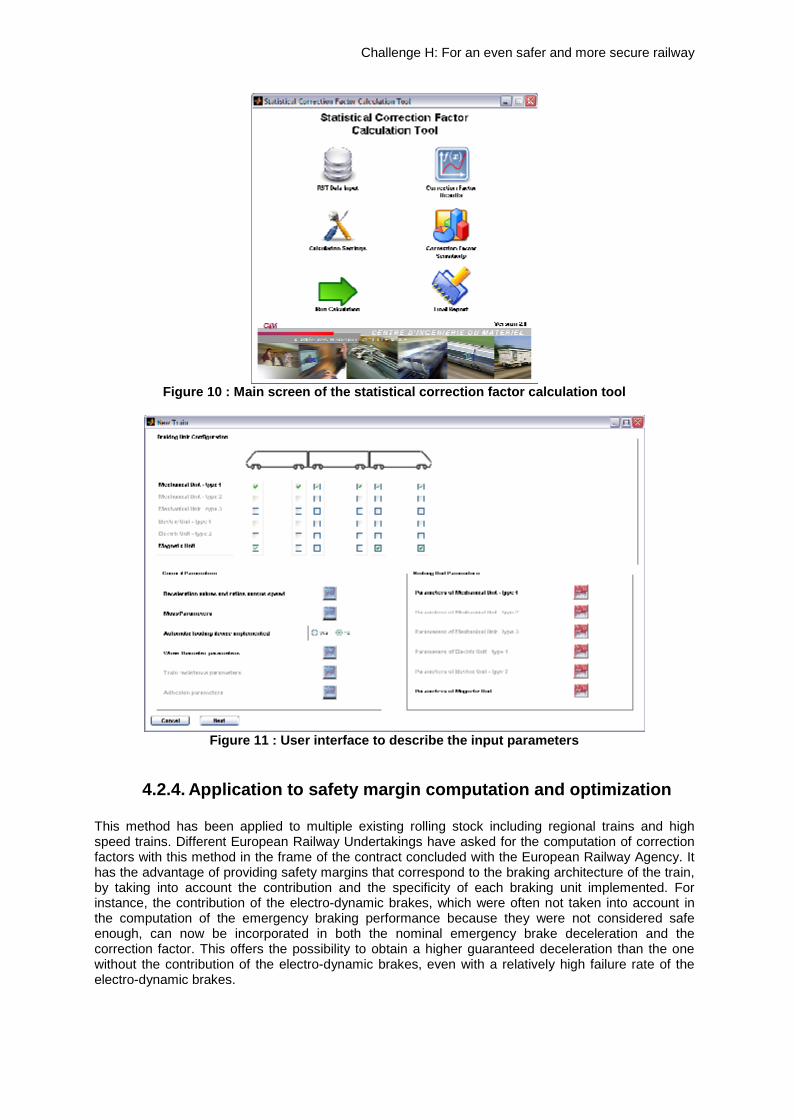
4.2.3. Implementation of the tool
The software developed by the SNCF Rolling Stock Engineering Center integrates the numericalMonte Carlo method and was specially designed to facilitate the computation of the correction factor.Figure 10 corresponds to the welcome screen of the software and gives an overview of the differentfunctions that are available. A flexible and graphical user interface has been created to simplify thefunctional description of the train and to guide the user in the definition of the different inputparameters. An example of user interface is provided on Figure 11. The possibility of saving inputparameters corresponding to a given train has also been added, in order to enrich a rolling stockdatabase containing all the parameters. The core of the software is composed of the numericalalgorithm and uses the parameters provided by the user as input. The program was specially writtento be able to run in parallel and to increase the performance. In addition, the software has beeninstalled on a scientific workstation with memory space specially dimensioned to manage the largeamount of data and with a parallel architecture to accelerate as much as possible the iterations of thealgorithm.
Probability
Kdry_rst
CorrectionFactor
1-EBCL
Cumulative distributionfunction Fk
Challenge H: For an even safer and more secure railway
Figure 10 : Main screen of the statistical correction factor calculation tool
Figure 11 : User interface to describe the input parameters
4.2.4. Application to safety margin computation and optimization
This method has been applied to multiple existing rolling stock including regional trains and highspeed trains. Different European Railway Undertakings have asked for the computation of correctionfactors with this method in the frame of the contract concluded with the European Railway Agency. Ithas the advantage of providing safety margins that correspond to the braking architecture of the train,by taking into account the contribution and the specificity of each braking unit implemented. Forinstance, the contribution of the electro-dynamic brakes, which were often not taken into account inthe computation of the emergency braking performance because they were not considered safeenough, can now be incorporated in both the nominal emergency brake deceleration and thecorrection factor. This offers the possibility to obtain a higher guaranteed deceleration than the onewithout the contribution of the electro-dynamic brakes, even with a relatively high failure rate of theelectro-dynamic brakes.
Challenge H: For an even safer and more secure railway
The relevancy of the model and of the quantification of physical parameters can be checked with asensitivity analysis: the sources of dispersion are ranked and the variables that need a refinement inthe distribution description step are identified. As a consequence, the procedure is not necessarilyrestricted to a single step but includes several loops until the convergence is guaranteed.
The method is useful also during the design phase of the rolling stock, as a prediction tool to estimatethe performance of the braking architecture. It gives indications about the impact of the brakingarchitecture on performance. It can lead for instance to equip the train with additional elements to gettime intervals below critical thresholds.
To illustrate this last point, the method is applied to a general 3 cars train architecture, equipped withdisc brakes on each axle and a distributor on each car. The option consisting in equipping each bogiewith a distributor is investigated. The input parameters used for this simulation correspond to generalarchitectures and are determined according to the expertise of the SNCF Rolling Stock EngineeringCenter. The characteristics and the performance results are described in Figure 12 and Figure 13below. Architecture B with one distributor on each bogie allows to achieve a significant increase inperformance, as proved by the computed EBI and Indication distances.
Architecture A Architecture B
γnominal 1,2 m/s² 1,2 m/s²
γsafe(10-9) 0,70 m/s² 0,86 m/s²
γsafe(10-6) 0,80 m/s² 0,97 m/s²
EBI(10-9) at Vmax 1570 m 1310 m
EBI(10-6) at Vmax 1390 m 1180 m
IND(10-9) at Vmax 1970 m 1710 m
IND(10-6) at Vmax 1790 m 1580 mFigure 13 : Results of Architectures A & B
Architecture A
“Disc brakes”“One distributor
on each car”
Nom. EmergencyDeceleration 1.2 m/s²
Max speed 160 km/h
Architecture B
“Disc brakes”“One distributoron each bogie”
Nom. EmergencyDeceleration 1.2 m/s²
Max speed 160 km/hFigure 12 : Characteristics of architectures A and B
Bog. 1Disc Brakes
Bog. 2Disc Brakes
Bog. 3Disc Brakes
Bog. 4Disc Brakes
Bog. 5Disc Brakes
Bog. 6Disc Brakes
Bog. 1Disc Brakes
Bog. 2Disc Brakes
Bog. 3Disc Brakes
Bog. 4Disc Brakes
Bog. 5Disc Brakes
Bog. 6Disc Brakes
Distributor
Distr. Distr. Distr. Distr. Distr. Distr.
Distributor Distributor
Challenge H: For an even safer and more secure railway
5. ConclusionThe approach presented in this document, based on the correction factor structure established by theEuropean Railway Agency (ERA), allows to optimize the performance of the signaling system and torespect at the same time the safety target. The first step consists in the allocation of the safety targetto the Emergency Brake Deceleration curve (EBD) by taking into account trackside margins. Thecomputation of the rolling stock correction factor with the probabilistic Monte Carlo method whichincorporates all the characteristics of the braking architecture is another way to optimize the system.With this method, the constant fixed margins often used for classical signaling can be replaced by aset of correction factors particular to each rolling stock architecture or / trackside design. Anapplication of the method to the design phase is also shown to pre-determine the performance ofspecific braking architectures. Further work has to be done in the statistical modeling, especially forinnovative braking systems.
[2] "Methodology for the safety margin calculation of the emergency brake intervention curve fortrains operated by ETCS/ERTMS". UIC B 126 / DT 414, June 2006
[3] “Comparison between probabilistic mathematical safety margins calculations and operationaldata”. UIC B 126 /DT 421, May 2008
[4] "Monte Carlo Statistical Methods". George Casella and Christian Robert. Springer,24/08/2005
[5] “A numerical model for the probabilistic analysis of braking performance in railways”. MonicaMalvezzi, Alain Bonnet, Cliff Cork, Robert Karbstein, Paolo Presciani. November 2006
7. Authors
Pierre MEYER (1) Richard CHAVAGNAT(1) Franck BOURGETEAU(1)
(1): SNCF, CIM/ESF - Safety Equipments and Brake Department, LE MANS - FRANCE


![ERTMS UNIT ASSIGNMENT OF VALUES TO ETCS … · In its role as system authority [1] for ERTMS, the European Railway Agency is responsible for the assignment of values to ETCS …](https://static.documents.pub/doc/80x56/5b5e280f7f8b9a310a8be306/ertms-unit-assignment-of-values-to-etcs-in-its-role-as-system-authority-1.jpg)

![ERTMS UNIT ASSIGNMENT OF VALUES TO ETCS … · ERTMS UNIT ASSIGNMENT OF VALUES TO ETCS VARIABLES ... of the ETCS SRS [2]. ... means values really used in projects or reservation confirmed](https://static.documents.pub/doc/80x56/5b58e7f37f8b9a657c8c92ba/ertms-unit-assignment-of-values-to-etcs-ertms-unit-assignment-of-values-to-etcs.jpg)
