20
1 Bicycle Use Trends in Germany Funded by
| Date post: | 16-Dec-2015 |
| Category: |
Documents |
| Upload: | isaac-arnold |
| View: | 214 times |
| Download: | 0 times |

1
Bicycle Use Trends in Germany
Funded by

2
Contents
Methodology: How was the use of bicycles measured?
Comparison of bikes to other means of transport
Bicycle ownership in Germany
Who travels by bike often and who seldom
What types of journeys do people take by bike
Where do people travel by bike? Purpose of travel
In what areas are bikes used? Area types
(Printed edition of the issue: Cycling Expertise No. A-1 by Difu, Berlin 2010)

3
Bicycle Use Trends in Germany
Between 1975 and 1980 cycling began experiencing a renaissance.
This has continued to an even greater extent in recent years.
Since the 1970s: Systematic study of transportation use has been ongoing in Germany.
Mobility figures for individual cities have been recorded even longer.
What are the actual findings of transport studies regarding bicycle use in Germany?

4
Methodology
How was the use of different means of transport measured?
Statistically substantiated conclusions regarding bike use can be proven by using surveys of representative households.
A predefined number of residents or households are questioned on their everyday travel habits.
This was previously done using written questionnaires alone, today it is often done in phone interviews.
The data pools gathered are then analysed in different studies with different focuses.

5
Methodology
The studies Mobilität in Deutschland (MID) and Mobilität in Städten (SrV)
In 1976 the study series Kontinuierliche Erhebungen zum Verkehrsverhalten (KONTIV) was launched in the Federal Republic of Germany.
In the meantime it has been expanded to the study Mobility in Germany (MID).
1972 the GDR began conducting the study System repräsentativer Verkehrsumfragen (SrV).
It was continued as Mobility in Cities (SrV), a nationwide study series conducted by the TU Dresden on numerous individual cities.
6
Methodology
When viewed together, these series of studies offer an overall picture of mobility in Germany
MID provides data on the development of transport over large areas > primarily to assist in federal and Länder planning.
SrV offers data for the examination of local transport habits within individual cities > represents an important instrument for municipal transport planning.
7
Comparison of bikes to other means of transport
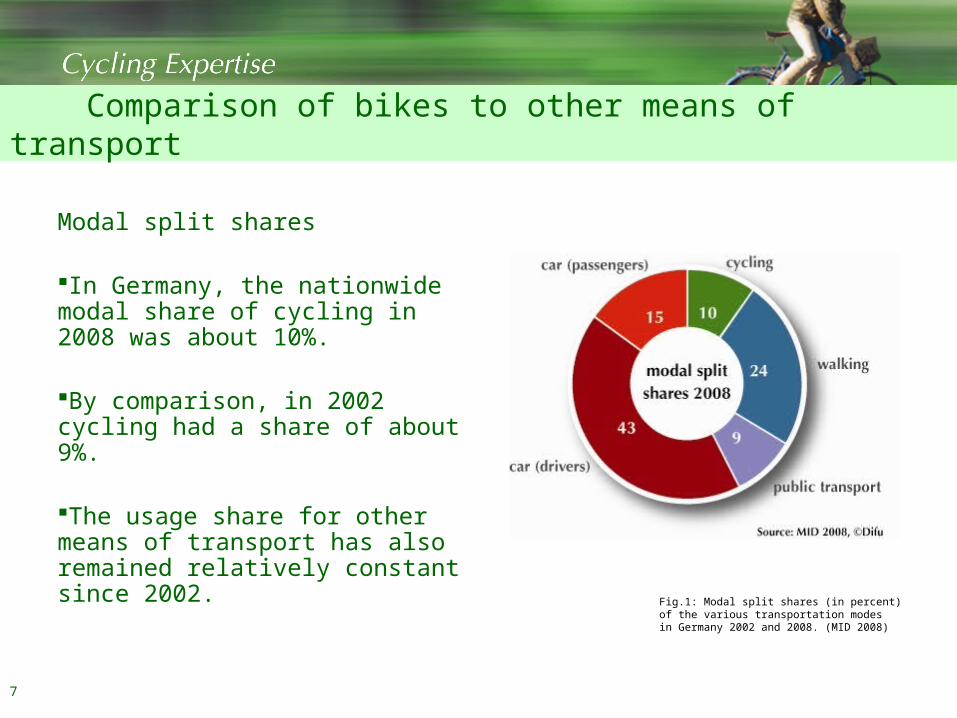
Modal split shares
In Germany, the nationwide modal share of cycling in 2008 was about 10%.
By comparison, in 2002 cycling had a share of about 9%.
The usage share for other means of transport has also remained relatively constant since 2002.
Fig.1: Modal split shares (in percent)of the various transportation modesin Germany 2002 and 2008. (MID 2008)
8
Comparison of bikes to other means of transport
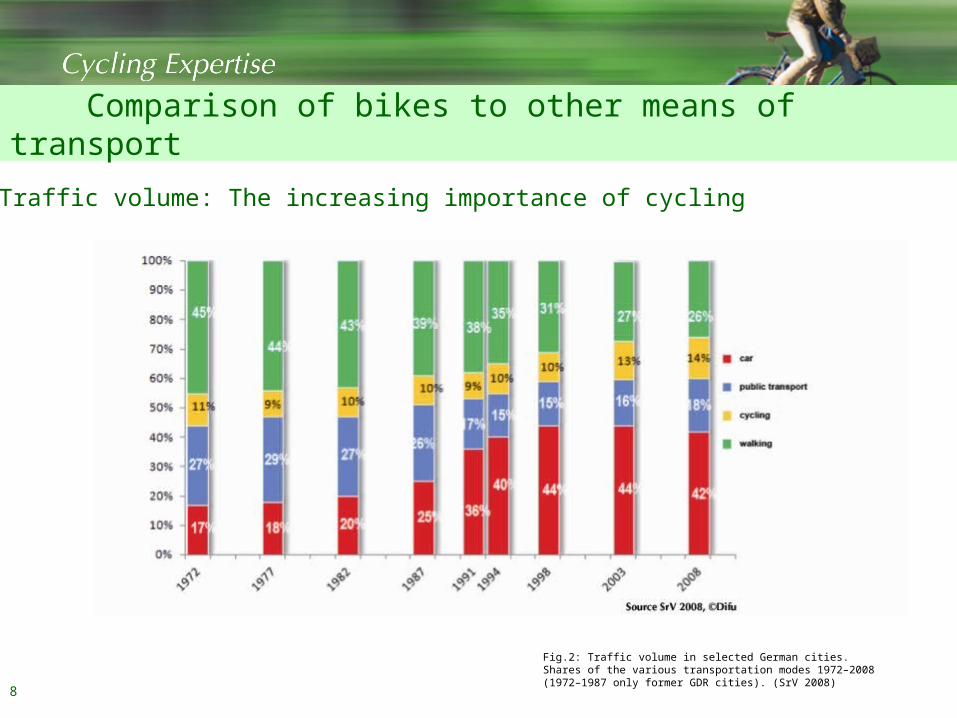
Fig.2: Traffic volume in selected German cities.Shares of the various transportation modes 1972–2008(1972–1987 only former GDR cities). (SrV 2008)
car
cycling
walking
Traffic volume: The increasing importance of cycling
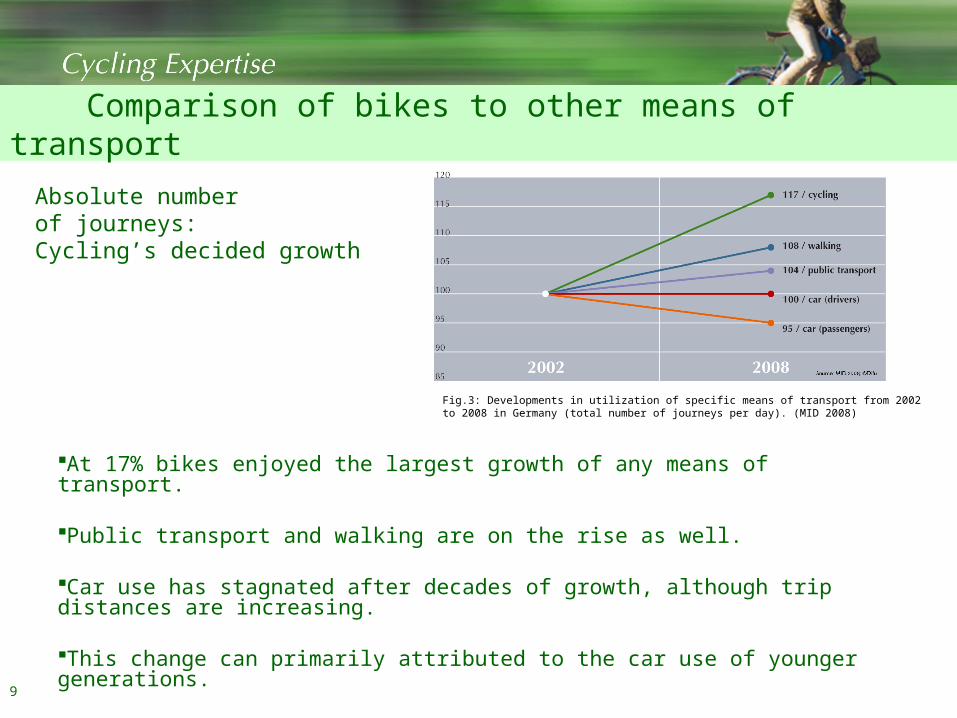
At 17% bikes enjoyed the largest growth of any means of transport.
Public transport and walking are on the rise as well.
Car use has stagnated after decades of growth, although trip distances are increasing.
This change can primarily attributed to the car use of younger generations.
Comparison of bikes to other means of transport
Fig.3: Developments in utilization of specific means of transport from 2002 to 2008 in Germany (total number of journeys per day). (MID 2008)
Absolute number of journeys:Cycling’s decided growth
9

The number of households which own no bike is decreasing.
The average number of bicycles per capita has slightly increased: from 0,9 in 2002 to 0,9 in 2008.
Bike ownership varies between different kinds of households:o Younger persons own
more bikes than older ones.
o Bigger Households own more bikes than single person households.
Bicycle ownership in Germany
Fig.4: Bicycle ownership in Germany, broken down according tonumber of bikes per household (% of all households). (MID 2008)
10
11
Wo travels by bike often and who seldom?
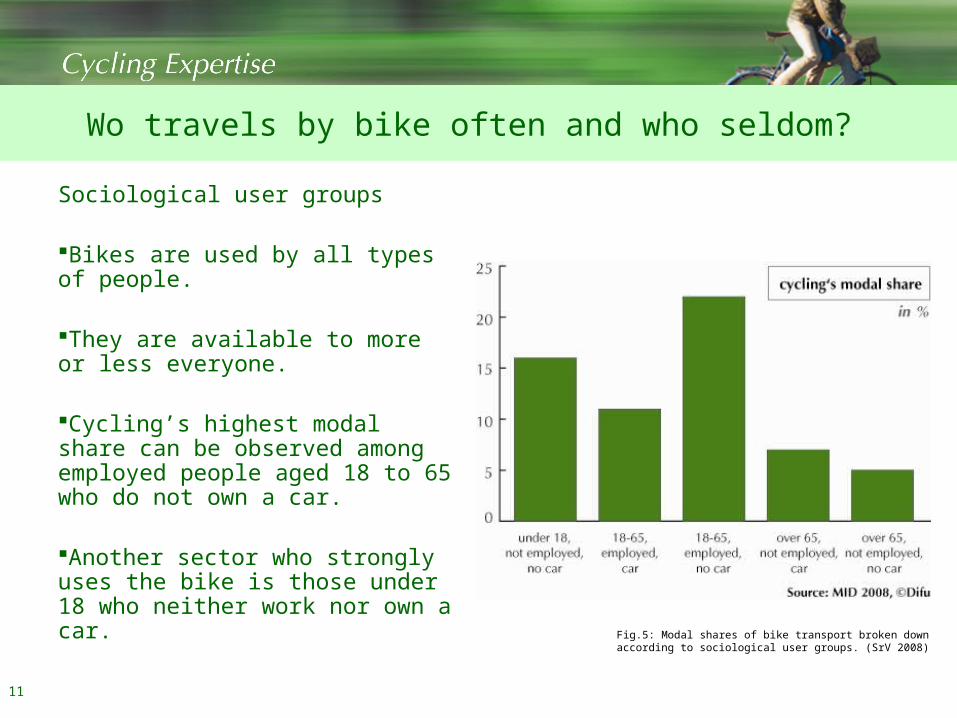
Sociological user groups
Bikes are used by all types of people.
They are available to more or less everyone.
Cycling’s highest modal share can be observed among employed people aged 18 to 65 who do not own a car.
Another sector who strongly uses the bike is those under 18 who neither work nor own a car.
Fig.5: Modal shares of bike transport broken down according to sociological user groups. (SrV 2008)
12
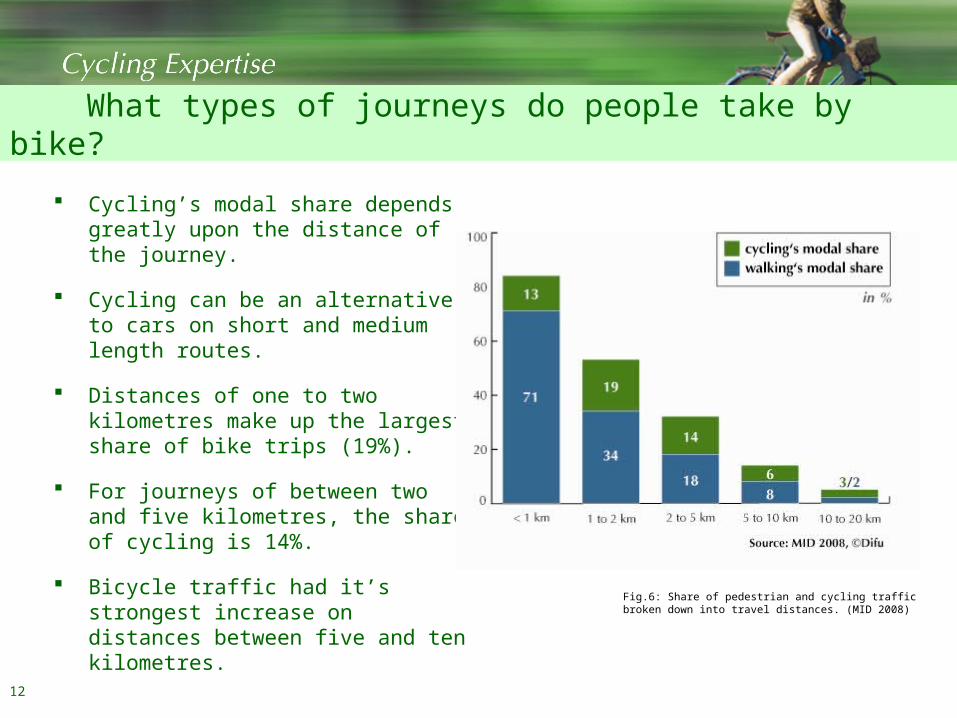
What types of journeys do people take by bike?
Cycling’s modal share depends greatly upon the distance ofthe journey.
Cycling can be an alternative to cars on short and medium length routes.
Distances of one to two kilometres make up the largest share of bike trips (19%).
For journeys of between twoand five kilometres, the shareof cycling is 14%.
Bicycle traffic had it’s strongest increase on distances between five and ten kilometres.
Fig.6: Share of pedestrian and cycling traffic broken down into travel distances. (MID 2008)
13
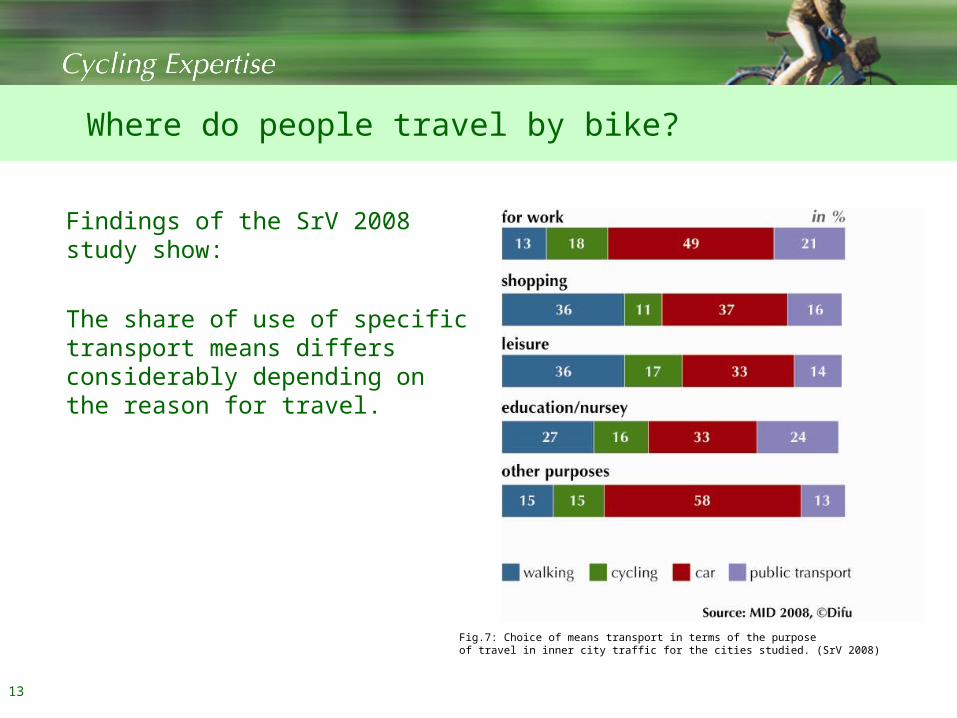
Where do people travel by bike?
Findings of the SrV 2008 study show:
The share of use of specific transport means differs considerably depending on the reason for travel.
Fig.7: Choice of means transport in terms of the purposeof travel in inner city traffic for the cities studied. (SrV 2008)

14
Where do people travel by bike?
Trips for work
Trips to and from work account for a somewhat higher proportion of bike travel (18%) than trips for other purposes.
This can be attributed to the very low share of people who walk to workplaces.
Trips to work represent a great opportunity to increase the share of bike traffic, e.g. through business mobility management schemes.
Trips for shopping
The lowest share of bicycle travel (11%) was recorded for shopping trips.
This can be attributed to the fact that distances travelled become much longer.
The main reason for that is the concentration of retailers in commercial centres on the outskirts of cities.

15
In what areas are bikes used?
People’s mobility requirements basically remain the same regardless the type of area they live in.
There are, however, varying conditions for mobility in different areas.
People who live in big cities travel different routes in their everyday lives than people in rural areas.
Several traditionally bicycle-friendly cities (Freiburg, Münster, Dessau, Göttingen, Bremen, and lesser-known race leaders like Greifswald and Oldenburg) perfectly illustrate what role bikes can assume as a mean of transport.
The increase in the bike share in transport in major cities in recent years is particularly noteworthy (Berlin, Munich, Frankfurt am Main).
16
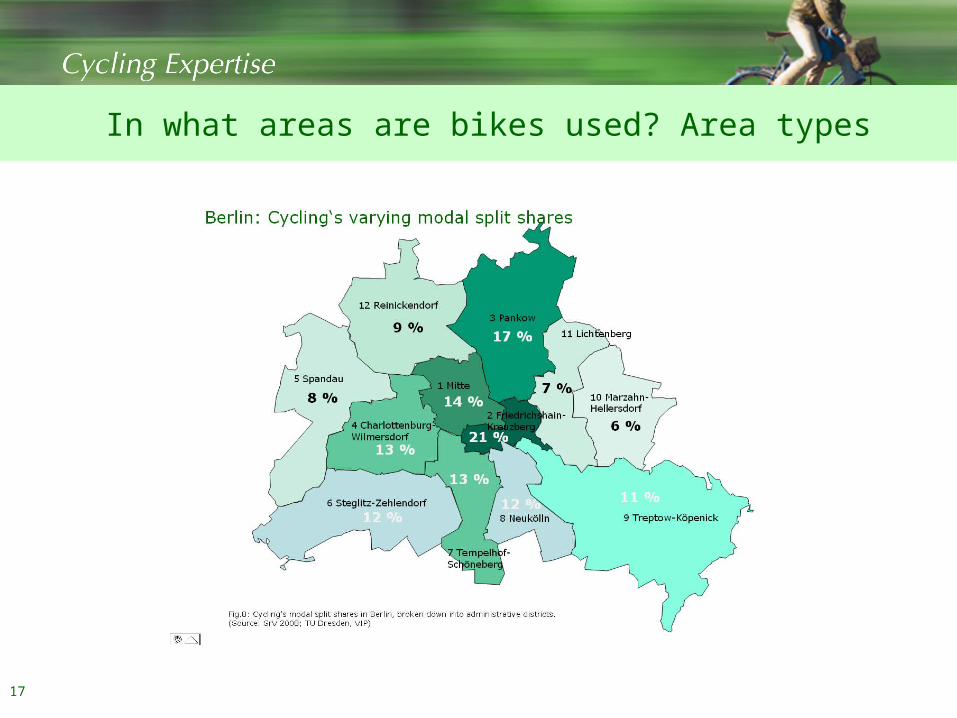
In what areas are bikes used? Area types
The share of bike transport varies strongly within cities: The bike share in the cities and municipalities studied by SrV 2008 ranges from 2% to 28%.
The findings of the SrV 2008 study for Berlin illustrate this: Modal split shares in various large and multifaceted districts of the German capital lies between 6% and 21% (c.f. next slide):
o 6% in Marzahn-Hellersdorf, on the edge of the city.o 21% in Friedrichshain-Kreuzberg, an urban inner-city district with
older building stock.
17
In what areas are bikes used? Area types

18
Conclusion
MID 2008 and SrV 2008 studies verify that bike use in Germany has grown noticeably.
This process has taken place over an extended period of time, and most particularly in recent years.
It is obvious that societal trends have been the primary motive for this development.
Such tendencies have been supported to varying degrees by active cycling policies in cities and regions.

19
Conclusion
Other determining factors include:
Settlement pattern development (distances between residential areas, workplaces, shopping centres)
The shrinking importance of topography (is the landscape flat or hilly?) due to better bike technology
The quality of cycling infrastructure
The local attitude towards bikes, i.e. acceptance of cycling by the general public
Local transport policy
20
Links and sources
Hompage of the research project Mobilität in Städten (SrV): www.tu-dresden.de/srv/SrV_Web/
Homepage of the research project Mobilität in Deutschland (MID), english version: www.mobilitaet-in-deutschland.de/engl 2008/
BMBVS – Bundesministerium für Verkehr, Bau und Stadtentwicklung / infas – Institut für angewandte Sozialforschung / DLR – Deutsches Zentrum für Luft- und Raumfahrt e.V. (2010): MID 2008. Mobility in Germany. Project presentation at the user workshop in September 2009, March 2010 version; www.mobilitaet-in-Germany.de/pdf/MiD2008_Projektpraesentation_Nutzerworkshop_Sept09.pdf
Imprint Publisher: German Institute of Urban Affairs (Difu) gGmbH, Zimmerstraße 13–15, 10969 Berlin, Department Mobility and Infrastructure. Editors: Tobias Mettenberger, Jörg Thiemann-Linden [email protected], [email protected]


