water Review Past, Present, and Future of Virtual Water and Water Footprint Weijing Ma 1, * , Christian Opp 1 and Dewei Yang 2, * 1 Faculty of Geography, Philipps-Universität Marburg, 35032 Marburg, Germany; opp@staff.uni-marburg.de 2 School of Geographical Sciences, Southwest University, Chongqing 400715, China * Correspondence: mawe@staff.uni-marburg.de (W.M.); [email protected] (D.Y.) Received: 28 September 2020; Accepted: 30 October 2020; Published: 2 November 2020 Abstract: Virtual water and water footprint have received increasing attention. However, no published research has conducted a quantitative and objective review of this field from the perspective of bibliometrics. Therefore, based on the Web of Science Core Collection, this study employs CiteSpace to quantitatively analyze and visualize information about countries, institutions, and authors that have conducted virtual water and water footprint research over the past two decades. As of July 2020, there were 1592 publications on virtual water and water footprint, showing an increasing trend overall. The annual average number of publications was only 7.4 in 1998–2008, while it was 126.5 in 2009–2019. Among them, up to 618 publications in the field of environmental science, accounting for 46%. China was the most productive country with a total of 344 articles, but the Netherlands had the strongest influence with a betweenness centrality of 0.33, indicating its leading position. It is essential to strengthen cooperation between developed (water-rich) and developing (water-poor) countries and to incorporate virtual water into social water cycle research. This study is expected to provide a new perspective for investigating the research frontiers and hot spots of virtual water and water footprint research. Keywords: virtual water; water footprint; CiteSpace; web of science; bibliometrics 1. Introduction 1.1. Motivation Water resource is an indispensable natural capital for human production and life [1]. However, with the rapid growth of the global population, the transformation of human lifestyles, consumption patterns approaching high-water-consuming foods, and unreasonable ways of water extraction and utilization, as well as climate change, water resources are under increasingly severe pressure [2–5]. The shortage of available water resources not only restricts the sustainable development of society and economy but also poses a serious threat to ecological and environmental security [6,7]. The water resource crisis has evolved into one of the most concerning resources and environmental issues in the world, which is considered to be the biggest challenge facing mankind in this century [8]. Therefore, ensuring water availability is set as one of the 2030 sustainable development goals (SDGs) [9,10]. It is predicted that 47% of the population will live in countries and regions with severe water shortages by 2030 [11], due to the extremely unequal distribution of global freshwater resources. In this context, “virtual water” has been heralded as the answer to this imbalance [12], which has aroused great interest of scholars in the fields of water resource management, agricultural production, environmental assessment, etc. Water 2020, 12, 3068; doi:10.3390/w12113068 www.mdpi.com/journal/water
Transcript
water
Review
Past, Present, and Future of Virtual Water andWater Footprint
Weijing Ma 1,* , Christian Opp 1 and Dewei Yang 2,*1 Faculty of Geography, Philipps-Universität Marburg, 35032 Marburg, Germany; [email protected] School of Geographical Sciences, Southwest University, Chongqing 400715, China* Correspondence: [email protected] (W.M.); [email protected] (D.Y.)
Received: 28 September 2020; Accepted: 30 October 2020; Published: 2 November 2020�����������������
Abstract: Virtual water and water footprint have received increasing attention. However, no publishedresearch has conducted a quantitative and objective review of this field from the perspective ofbibliometrics. Therefore, based on the Web of Science Core Collection, this study employs CiteSpaceto quantitatively analyze and visualize information about countries, institutions, and authors thathave conducted virtual water and water footprint research over the past two decades. As of July 2020,there were 1592 publications on virtual water and water footprint, showing an increasing trendoverall. The annual average number of publications was only 7.4 in 1998–2008, while it was 126.5 in2009–2019. Among them, up to 618 publications in the field of environmental science, accounting for46%. China was the most productive country with a total of 344 articles, but the Netherlands had thestrongest influence with a betweenness centrality of 0.33, indicating its leading position. It is essentialto strengthen cooperation between developed (water-rich) and developing (water-poor) countriesand to incorporate virtual water into social water cycle research. This study is expected to providea new perspective for investigating the research frontiers and hot spots of virtual water and waterfootprint research.
Keywords: virtual water; water footprint; CiteSpace; web of science; bibliometrics
1. Introduction
1.1. Motivation
Water resource is an indispensable natural capital for human production and life [1]. However,with the rapid growth of the global population, the transformation of human lifestyles, consumptionpatterns approaching high-water-consuming foods, and unreasonable ways of water extraction andutilization, as well as climate change, water resources are under increasingly severe pressure [2–5].The shortage of available water resources not only restricts the sustainable development of societyand economy but also poses a serious threat to ecological and environmental security [6,7]. The waterresource crisis has evolved into one of the most concerning resources and environmental issues in theworld, which is considered to be the biggest challenge facing mankind in this century [8]. Therefore,ensuring water availability is set as one of the 2030 sustainable development goals (SDGs) [9,10].It is predicted that 47% of the population will live in countries and regions with severe watershortages by 2030 [11], due to the extremely unequal distribution of global freshwater resources.In this context, “virtual water” has been heralded as the answer to this imbalance [12], which hasaroused great interest of scholars in the fields of water resource management, agricultural production,environmental assessment, etc.
Water 2020, 12, 3068; doi:10.3390/w12113068 www.mdpi.com/journal/water
Virtual water (VW) refers to the freshwater consumed by a product or service in its place oforigin, and which is then traded and transported to another region embedded in these products orservices [13]. The volume of global trade has continued to expand since the 20th century, resulting in anincreasing amount of virtual water exchange through commodities [14]. VW theory has thus laid a solidfoundation for accurately measuring the real water consumption of a country or region. Meanwhile,by seeing water itself as an internationally traded commodity, it also offers an alternative way forwater-poor regions to effectively solve the shortage of water resources by importing “freshwater”through international trade [15].
However, VW has received relatively little attention until “water footprint (WF)” was proposedand introduced to international researchers [16]. Based on VW theory, WF represents the total amountof water consumed by a country (region or individual) in a given period, including the water containedin all products and services, which is an analog to the concept of ecological footprint proposed bythe Canadian economist Willian E. Rees in the early 1990s [17,18]. WF is a supplement to traditionalmeasurement indicators of water consumption due to the following features it possesses: (1) it made aconnection between physical water and VW, and extended VW assessment from the geographical scale(country, region, and watershed) to the individual and product scale. (2) It expanded the boundaryof water resources research from the consumption of blue WF to green WF and gray WF [19,20].Blue WF means water comes from surface or groundwater; green WF means water comes fromprecipitation which is stored in the soil; gray WF means water used to assimilate pollutants [21].By doing this, the problems of insufficient research on green water and independent evaluationof water quality and quantity have been solved, thereby broadening the evaluation system andconnotation of water resources (Qian et al., 2019). (3) It linked water resources assessment with humanconsumption patterns [22,23]. Calculating the real occupancy of water resources from the perspectiveof consumption, which can help people understand the meaning of VW and increase their awarenessof saving water [24]. Because of the above advantages, WF has been widely concerned by scholarsaround the world since its introduction and has become one of the important indicators for measuringand evaluating the environmental impact of human activities.
The research methods of VW and WF are similar, which can be summarized as two typesof “bottom-up” and “top-down” methods [25,26]. The “bottom-up” methods are mainly used inthe agricultural sector, that is, using crop growth models such as CropWat [10,27,28], EPIC [29],AquaCrop [30,31], and LPJmL [32] to calculate crop growth water footprint, including blue WF andgreen WF. The “top-down” approaches, similar to life cycle assessment (LCA), are mainly basedon the inter-sector input-output (IO) tables. Input-output models are used (including single-regioninput-output models and multi-regional input-output models) to measure direct and indirect WFs andVW flow between all sectors. Therefore, the bottom-up approach is mainly suitable for estimatingthe WF of agricultural products. A large body of physical water from irrigation is consumed duringthe growth of crops. The top-down approach can take the VW (indirect water resources) contained inthe raw materials between sectors into account, it is thus suitable for estimating the regional waterconsumption of all sectors and VW flows between countries and regions.
The research on VW and WF has extended from the initial global, national, or regional level tosmall watersheds, cities, and single products, and from a single annual evaluation to inter-annualcomparative research. As for the research content, it has gone from quantitative accounting of cropWF, regional VW flow, to qualitative analysis of WF sensitivity and inter-regional VW flow drivingfactors. In general, VW and WF research has developed rapidly in the past two decades, which hasattracted increasing attention of international scholars. In addition to research articles, there are alsosome reviews, which qualitatively elaborate and explain VW and WF research in terms of conceptualinterpretation, research content, research objects, and research scale [33].
However, few academic endeavors have been made from the perspective of bibliometric statistics.As far as we know, only Zhang, et al. [34] conducted a bibliometric study of WF in 2006–2015, but it did
Water 2020, 12, 3068 3 of 20
not include VW. The WF mostly refers to water consumed in the local production process, and the VWrefers to the water embedded in the product being transported to other regions, that is, the WF has afeature of “static”, while the VW has a feature of “dynamic”. The essence of WF accounting is still VWaccounting, and it can even be said that VW accounting is the basis of WF accounting [35]. Therefore,the two concepts complement each other and it is necessary to analyze both at the same time.
1.3. Bibliometrics
In the face of a huge amount of literature, the qualitative literature analysis method has certainlimitations of subjectivity and one-sidedness, and cannot comprehensively, objectively, and intuitivelyreflect the research trends and dynamic development of a field. The application of modern scientometricsand information metrology technology can conduct a multivariate and historical dynamic analysisof massive literature. Mapping Knowledge Domains is one of the important methods of documentanalysis and visualization [36]. In recent years, the development of literature analysis tools representedby CiteSpace has provided an effective way for the big data measurement analysis and visual displayof literature [37]. CiteSpace can identify research frontiers, detect research characteristics and evolutiontrends, and identify the interactive relationship between different research topics through co-citingliterature and collaborative network analysis. Since its release, the software has been widely used indocument measurement and analysis and data visualization [38]. At present, it has been graduallyapplied in the fields of geography, ecology, and the environment [34,38–40].
1.4. Objectives
With the help of CiteSpace, this study attempts to use the knowledge map to display the researchliterature of VW and WF, find out the key literature, and make a further summary and analysis ofthe VW and WF research since they were proposed. It aims to reveal the development path andresearch trend of VW and WF more objectively, provide a new perspective for the exploration ofresearch frontiers and hot spots in this field, and deliver some innovative clues and suggestions forfuture research.
The main research objectives are to (1) investigate the development trajectory of VW and WFresearch, including the number of articles and research fields; (2) clarify the team and distributionof VW and WF research, including major countries, institutions, and research teams; (3) summarizethe temporal and spatial dynamics of the research topics and research hotspots of VW and WF;and (4) explore the current deficiencies and future development directions of VW and WF research.
2. Materials and Methods
2.1. CiteSpace
CiteSpace was developed by Chen [41] to analyze and visualize scientific literature. It can extractand analyze the hidden information of keywords, topics, authors, institutions, cited documents,cited authors, cited journals, and other information, and visually present relevant information withthe help of visual knowledge maps. Through the convergence of this information, it can show thedevelopment path of a field and the relationships of interdisciplinary fields in a certain period, and fullyreveal the research status of this field, which helps to understand and predict research hotspots andfrontiers. In addition to information science and library science, CiteSpace has been increasingly usedin economics, sociology, geography, and environmental science [37].
In the knowledge map of CiteSpace, N represents the number of network nodes, and the color andsize of the nodes represent the year and quantity. E represents the number of connections. Modularityis a reflection of network structure. When the value of the modularity larger than 0.3, it means that thenetwork community structure is remarkable. The value of silhouette is an index for measuring thenetwork homogeneity. When it is greater than 0.5, indicating that the clustering result is reasonable.Regarding the Keyword Co-appearance Analysis map, Li, et al. [42] believe that frequency is the
Water 2020, 12, 3068 4 of 20
number of occurrences of words in the analyzed documents. The distribution of keyword frequencycan reflect the frequency of citations or the number of articles published in a certain field. The fieldswith the most published articles or the most frequently cited articles are often research hotspots.
The main indicators used in this article include betweenness centrality and burst terms.Betweenness centrality is an indicator that reflects the importance of a node, indicating that thenode serves as the number of shortest paths between the other two nodes. The higher the betweennesscentrality of a node, the greater its influence in the network. Generally, nodes whose betweennesscentrality is greater than or equal to 0.1 are regarded as key nodes. Burst terms refer to research termsthat appear to have a sudden and rapid increase in frequency, and it can more accurately reveal researchfrontiers than keywords due to their dynamic change characteristics over time. The emergence of burstterms indicates that scholars have discovered new research fields and research perspectives during thisperiod, and thus appear as academic frontiers, which are often shown in red in the knowledge map.
2.2. Data Collection
The Web of Science Core Collection (WOSCC) is considered as a reliable database for visualanalysis [40]. Water footprint and virtual water usually appear in the title of research in this field in theform of fixed phrases. Therefore, we first searched for all publications containing the phrases “virtualwater” or “water footprint” in the title from 1993 to 2020, and then we manually removed publicationsunrelated to virtual water and water footprint research. Finally, a total of 1592 publications wereretrieved on 22 July 2020.
3. Results
3.1. Characteristics of Publication Outputs
In general, the number of annual publications can reflect the importance of a particular fieldand the degree of attention it receives. As shown in Figure 1, although VW was proposed as early as1993, the first publication retrieved was in 1998. This is an editorial in which Allan [15] explained thestrategic significance of VW from the perspective of “the definition of water deficit, the relationshipbetween water and food, and water resources and politics”, and VW could be a global way to addressregional water deficits. He argued that reducing the rate of population growth and water-intensivefood consumption is the fundamental solution to water shortages.
Water 2020, 12, x FOR PEER REVIEW 5 of 20
Figure 1. The number of publications.
In terms of disciplines, although VW and WF are concerned with the sustainable use of water resources, there are up to 618 publications in the field of environmental science, accounting for 46% (Figure 2), followed by water resources (371, 28%), engineering environmental (241, 18%), and green sustainable science technology (235, 17%). This shows that VW and WF have become important methods and indicators in the field of environmental impact assessment, and WF has therefore been regarded as one of the environmental footprint indicators.
Figure 2. The number of publications in different subjects.
3.2. Cooperative Network Analysis
3.2.1. Contribution of Country Analysis
As shown in Figure 3, a total of 84 countries have published articles in the field of VW or WF, and the density of cooperation networks among countries is 0.0813. In terms of publication time, the United States published the earliest article in 2001. Other countries with earlier publication times include Japan (2002), the United Kingdom (2003), Italy (2003), France (2003), Sweden (2004), the Netherlands (2005), China (2005), and India (2005). China is the most productive country with the largest number of 344 articles, accounting for 27%, followed by the United States (245, 20%), the Netherlands (139, 11%), and Italy (105, 8%).
0
200
400
600
800
Enviromantalsciences
Water resources
Engineeringenvironmental
Greensustainable
scienceEnvironmental
studies
Engineering civil
Geosciencesmultidisciplinary
Ecology
Figure 1. The number of publications.
Water 2020, 12, 3068 5 of 20
It was not until the WF theory was developed in 2002 that clarify the team and distribution ofVW and WF research gradually began to receive more attention. As of July 2020, there were a totalof 1592 publications on VW and WF, showing an increasing trend overall. Among them, the annualaverage number of publications was only 7.4 in 1998–2008, while it was 126.5 in 2009–2019. It indicatesthat after 2008, the year that Allan won the Stockholm Water Award for virtual water, the research onVW and WF grew rapidly.
These publications were classified into 12 types, of which there were 1252 articles, accountingfor 79%; 143 proceedings papers, accounting for 9%; 35 reviews, accounting for 2%; and 162 otherpublications, accounting for 10%.
In terms of disciplines, although VW and WF are concerned with the sustainable use of waterresources, there are up to 618 publications in the field of environmental science, accounting for 46%(Figure 2), followed by water resources (371, 28%), engineering environmental (241, 18%), and greensustainable science technology (235, 17%). This shows that VW and WF have become importantmethods and indicators in the field of environmental impact assessment, and WF has therefore beenregarded as one of the environmental footprint indicators.
Water 2020, 12, x FOR PEER REVIEW 5 of 20
Figure 1. The number of publications.
In terms of disciplines, although VW and WF are concerned with the sustainable use of water resources, there are up to 618 publications in the field of environmental science, accounting for 46% (Figure 2), followed by water resources (371, 28%), engineering environmental (241, 18%), and green sustainable science technology (235, 17%). This shows that VW and WF have become important methods and indicators in the field of environmental impact assessment, and WF has therefore been regarded as one of the environmental footprint indicators.
Figure 2. The number of publications in different subjects.
3.2. Cooperative Network Analysis
3.2.1. Contribution of Country Analysis
As shown in Figure 3, a total of 84 countries have published articles in the field of VW or WF, and the density of cooperation networks among countries is 0.0813. In terms of publication time, the United States published the earliest article in 2001. Other countries with earlier publication times include Japan (2002), the United Kingdom (2003), Italy (2003), France (2003), Sweden (2004), the Netherlands (2005), China (2005), and India (2005). China is the most productive country with the largest number of 344 articles, accounting for 27%, followed by the United States (245, 20%), the Netherlands (139, 11%), and Italy (105, 8%).
0
200
400
600
800
Enviromantalsciences
Water resources
Engineeringenvironmental
Greensustainable
scienceEnvironmental
studies
Engineering civil
Geosciencesmultidisciplinary
Ecology
Figure 2. The number of publications in different subjects.
3.2. Cooperative Network Analysis
3.2.1. Contribution of Country Analysis
As shown in Figure 3, a total of 84 countries have published articles in the field of VW or WF,and the density of cooperation networks among countries is 0.0813. In terms of publication time,the United States published the earliest article in 2001. Other countries with earlier publicationtimes include Japan (2002), the United Kingdom (2003), Italy (2003), France (2003), Sweden (2004),the Netherlands (2005), China (2005), and India (2005). China is the most productive country withthe largest number of 344 articles, accounting for 27%, followed by the United States (245, 20%),the Netherlands (139, 11%), and Italy (105, 8%).
Water 2020, 12, 3068 6 of 20
Water 2020, 12, x FOR PEER REVIEW 6 of 20
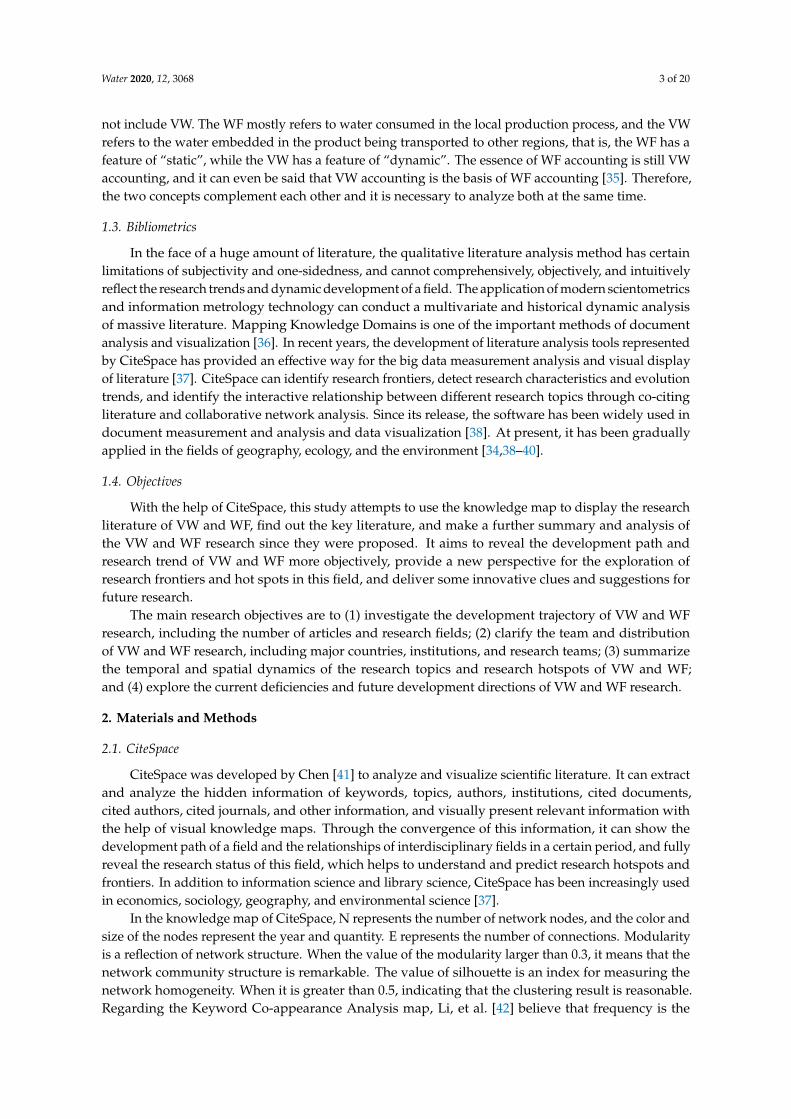
Figure 3. Cooperative network among countries (the size of the node represents the number of articles, and the location of the node represents the time when the earliest article was published).
In terms of influence, the betweenness centralities of Netherlands (0.33), USA (0.29), China (0.23), Germany (0.22), Sweden (0.11), and the United Kingdom (0.10) are higher than or equal to 0.1, which indicates that these six countries played the most influential role in the field of VW and WF research. Although the number of articles published in the Netherlands is smaller than that of China and the United States, the betweenness centrality is greater than that of China and the United States, highlighting the leading role of the Netherlands in this field.
Through further analysis, a total of 414 funds have supported research on VW and WF over the past ten years, of which 377 funds came from China, accounting for 91%, while only 37 funds came from other countries or institutions, accounting for 9%. This could explain why research on VW and WF developed rapidly in China after 2010.
3.2.2. Contribution of the Institutions
In terms of research institutions, of the 11 institutions in the top 10 in terms of the number of articles, there are eight in China, and one in the Netherlands, Singapore, and Japan. As shown in Figure 4, the institution that published the most articles was the University of Twente (94). The institutions ranked second to tenth are the Chinese Academy of Sciences (80), Beijing Normal University (55), Hohai University (39) and Northwest Agriculture and Forestry University (33), University of Chinese Academy of Sciences (28), National University of Singapore (26), China Agricultural University (19), Beijing Forestry University (19), Shanghai Jiaotong University (14) and the National Institute for Environmental Studies, Japan (14). In terms of influence, only the betweenness centralities of the Chinese Academy of Sciences (0.22) and University of Twente (0.17) were higher than 0.1, reflecting the key role of these two institutions in the field of VW and WF research. The betweenness centralities of Beijing Normal University (0.09) and Hohai University (0.08) were close to 0.1, which is expected to become the core institution of VW and WF research. Overall, the density of institutional cooperation networks is only 0.0099, indicating that cooperation among institutions is relatively low. Through further analysis, it can be seen that closely cooperating institutions are often in the same country or city.
Figure 3. Cooperative network among countries (the size of the node represents the number of articles,and the location of the node represents the time when the earliest article was published).
In terms of influence, the betweenness centralities of Netherlands (0.33), USA (0.29), China (0.23),Germany (0.22), Sweden (0.11), and the United Kingdom (0.10) are higher than or equal to 0.1,which indicates that these six countries played the most influential role in the field of VW and WFresearch. Although the number of articles published in the Netherlands is smaller than that of Chinaand the United States, the betweenness centrality is greater than that of China and the United States,highlighting the leading role of the Netherlands in this field.
Through further analysis, a total of 414 funds have supported research on VW and WF over thepast ten years, of which 377 funds came from China, accounting for 91%, while only 37 funds camefrom other countries or institutions, accounting for 9%. This could explain why research on VW andWF developed rapidly in China after 2010.
3.2.2. Contribution of the Institutions
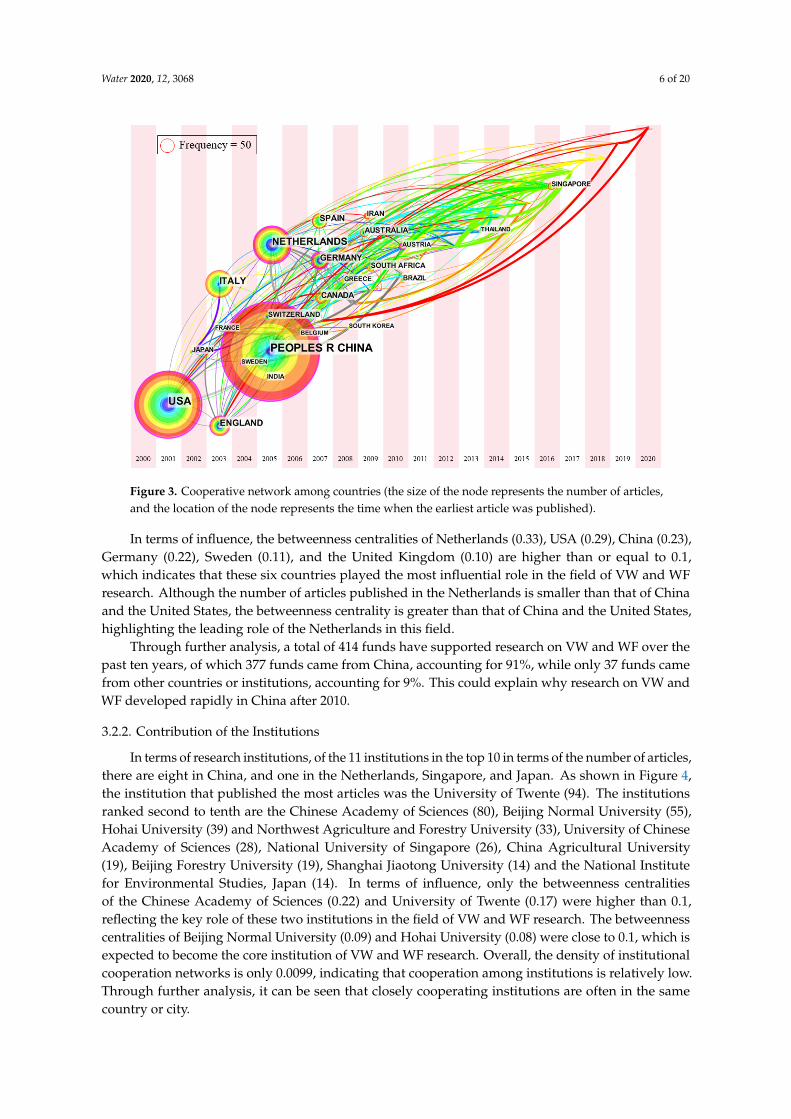
In terms of research institutions, of the 11 institutions in the top 10 in terms of the number of articles,there are eight in China, and one in the Netherlands, Singapore, and Japan. As shown in Figure 4,the institution that published the most articles was the University of Twente (94). The institutionsranked second to tenth are the Chinese Academy of Sciences (80), Beijing Normal University (55),Hohai University (39) and Northwest Agriculture and Forestry University (33), University of ChineseAcademy of Sciences (28), National University of Singapore (26), China Agricultural University(19), Beijing Forestry University (19), Shanghai Jiaotong University (14) and the National Institutefor Environmental Studies, Japan (14). In terms of influence, only the betweenness centralitiesof the Chinese Academy of Sciences (0.22) and University of Twente (0.17) were higher than 0.1,reflecting the key role of these two institutions in the field of VW and WF research. The betweennesscentralities of Beijing Normal University (0.09) and Hohai University (0.08) were close to 0.1, which isexpected to become the core institution of VW and WF research. Overall, the density of institutionalcooperation networks is only 0.0099, indicating that cooperation among institutions is relatively low.Through further analysis, it can be seen that closely cooperating institutions are often in the samecountry or city.
Water 2020, 12, 3068 7 of 20
Water 2020, 12, x FOR PEER REVIEW 7 of 20
Figure 4. Cooperative network among institutions.
3.2.3. Contribution of Authors
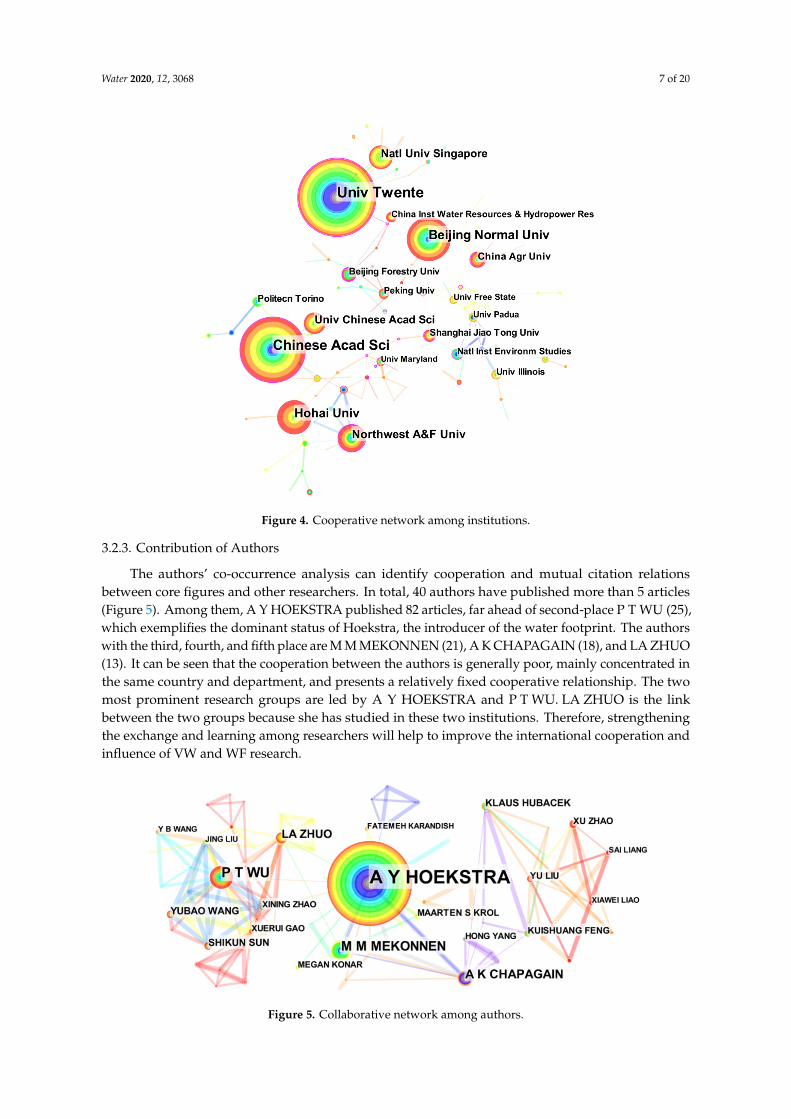
The authors’ co-occurrence analysis can identify cooperation and mutual citation relations between core figures and other researchers. In total, 40 authors have published more than 5 articles (Figure 5). Among them, A Y HOEKSTRA published 82 articles, far ahead of second-place P T WU (25), which exemplifies the dominant status of Hoekstra, the introducer of the water footprint. The authors with the third, fourth, and fifth place are M M MEKONNEN (21), A K CHAPAGAIN (18), and LA ZHUO (13). It can be seen that the cooperation between the authors is generally poor, mainly concentrated in the same country and department, and presents a relatively fixed cooperative relationship. The two most prominent research groups are led by A Y HOEKSTRA and P T WU. LA ZHUO is the link between the two groups because she has studied in these two institutions. Therefore, strengthening the exchange and learning among researchers will help to improve the international cooperation and influence of VW and WF research.
Figure 5. Collaborative network among authors.
Figure 4. Cooperative network among institutions.
3.2.3. Contribution of Authors
The authors’ co-occurrence analysis can identify cooperation and mutual citation relationsbetween core figures and other researchers. In total, 40 authors have published more than 5 articles(Figure 5). Among them, A Y HOEKSTRA published 82 articles, far ahead of second-place P T WU (25),which exemplifies the dominant status of Hoekstra, the introducer of the water footprint. The authorswith the third, fourth, and fifth place are M M MEKONNEN (21), A K CHAPAGAIN (18), and LA ZHUO(13). It can be seen that the cooperation between the authors is generally poor, mainly concentrated inthe same country and department, and presents a relatively fixed cooperative relationship. The twomost prominent research groups are led by A Y HOEKSTRA and P T WU. LA ZHUO is the linkbetween the two groups because she has studied in these two institutions. Therefore, strengtheningthe exchange and learning among researchers will help to improve the international cooperation andinfluence of VW and WF research.
Water 2020, 12, x FOR PEER REVIEW 7 of 20
Figure 4. Cooperative network among institutions.
3.2.3. Contribution of Authors
The authors’ co-occurrence analysis can identify cooperation and mutual citation relations between core figures and other researchers. In total, 40 authors have published more than 5 articles (Figure 5). Among them, A Y HOEKSTRA published 82 articles, far ahead of second-place P T WU (25), which exemplifies the dominant status of Hoekstra, the introducer of the water footprint. The authors with the third, fourth, and fifth place are M M MEKONNEN (21), A K CHAPAGAIN (18), and LA ZHUO (13). It can be seen that the cooperation between the authors is generally poor, mainly concentrated in the same country and department, and presents a relatively fixed cooperative relationship. The two most prominent research groups are led by A Y HOEKSTRA and P T WU. LA ZHUO is the link between the two groups because she has studied in these two institutions. Therefore, strengthening the exchange and learning among researchers will help to improve the international cooperation and influence of VW and WF research.
Figure 5. Collaborative network among authors. Figure 5. Collaborative network among authors.
Water 2020, 12, 3068 8 of 20
3.3. The Evolution of the Frontier on VW and WF Research
3.3.1. Keywords Analysis
Keywords represent the core topics of the article and can better reflect the research hotspots.Visual analysis of keywords in a certain field can intuitively present the research frontier and dynamicevolution path. As shown in Figure 6, in the keywords network for VW and WF research, there are 149nodes, 265 connections, and a density of 0.024. Among them, there are 31 keywords with an occurrencefrequency greater than 50.
Water 2020, 12, x FOR PEER REVIEW 8 of 20
3.3. The Evolution of the Frontier on VW and WF Research
3.3.1. Keywords Analysis
Keywords represent the core topics of the article and can better reflect the research hotspots. Visual analysis of keywords in a certain field can intuitively present the research frontier and dynamic evolution path. As shown in Figure 6, in the keywords network for VW and WF research, there are 149 nodes, 265 connections, and a density of 0.024. Among them, there are 31 keywords with an occurrence frequency greater than 50.
The largest node is “water footprint”, which has appeared 408 times. The nodes closely connected to it are virtual water (269) and flow (122), indicating that the WF is the development and continuation of VW theory. The second-largest node is “consumption (348)”. The main nodes connected to it are resource (248), trade (201), impact (189), environmental impact (78), energy (98), and food (69), indicating that research of VW and WF focuses on the consumption of resources, especially energy and food, and its environmental impact has also received increasing attention.
In terms of influence, the node “agriculture” has the highest betweenness centrality of 0.44, and it has entered the top 50 keywords since 2004, reflecting that VW and WF research has been mainly concentrated in the agricultural sector. Land had the second-highest betweenness centrality of 0.40, which entered the top 50 keywords for the first time in 2012. This is because the land is another important resource in agricultural production, and agricultural water resources research cannot conduct without consideration of factors such as land productivity. Climate change (0.29) and sustainability (0.17) also had a greater influence in the keyword network, reflecting that research on virtual water and water footprint was increasingly concerned with sustainable development in the context of climate change.
Figure 6. Keywords with a frequency of more than 50.
3.3.2. Burst Terms Analysis
Burst terms are extracted from keywords, titles, abstracts, etc., which are often used to judge the development trajectory and trend of a field. As shown in Table 1, there were 24 burst terms in the field of VW and WF. These burst terms can be divided into three time periods (2003–2010, 2011–2015,
Figure 6. Keywords with a frequency of more than 50.
The largest node is “water footprint”, which has appeared 408 times. The nodes closely connectedto it are virtual water (269) and flow (122), indicating that the WF is the development and continuationof VW theory. The second-largest node is “consumption (348)”. The main nodes connected to itare resource (248), trade (201), impact (189), environmental impact (78), energy (98), and food (69),indicating that research of VW and WF focuses on the consumption of resources, especially energy andfood, and its environmental impact has also received increasing attention.
In terms of influence, the node “agriculture” has the highest betweenness centrality of 0.44,and it has entered the top 50 keywords since 2004, reflecting that VW and WF research has beenmainly concentrated in the agricultural sector. Land had the second-highest betweenness centralityof 0.40, which entered the top 50 keywords for the first time in 2012. This is because the land isanother important resource in agricultural production, and agricultural water resources researchcannot conduct without consideration of factors such as land productivity. Climate change (0.29) andsustainability (0.17) also had a greater influence in the keyword network, reflecting that research onvirtual water and water footprint was increasingly concerned with sustainable development in thecontext of climate change.
Water 2020, 12, 3068 9 of 20
3.3.2. Burst Terms Analysis
Burst terms are extracted from keywords, titles, abstracts, etc., which are often used to judgethe development trajectory and trend of a field. As shown in Table 1, there were 24 burst termsin the field of VW and WF. These burst terms can be divided into three time periods (2003–2010,2011–2015, and 2016–2020). The three burst terms with the highest strength are virtual water (11.34),water resources management (6.90), and environmental impacts (6.85), which respectively representresearch hotspots in different periods.
Table 1. Burst terms of virtual water and water footprint research.
Burst Terms Strength Begin Year End Year 2003–2020
total waterfootprint 5.85 2018 2020 ������������������
water scarcityfootprint 5.48 2018 2020 ������������������
life cycleassessment 6.11 2018 2020 ������������������
In 2003–2010, the burst terms reflected that the research hotspots at this stage were mainly basedon VW theory, focusing on water-food nexus and international trade. The input-output analysiswas the representative method. In 2011–2015, the burst terms reflected that the research hotspots atthis stage were dominated by WF theory, mainly focusing on the estimation of crop water footprint,environmental impact assessment. Research on the combination of water footprint and other footprint
Water 2020, 12, 3068 10 of 20
indicators at this stage began to attract attention. In 2016–2020, the burst terms reflected that researchhotspots at this stage were more closely integrated with sustainable development, and researcherswere trying to apply VW and WF to traditional water resources management. The LCA method hasreceived more and more attention at this stage. However, the overall duration of each prominent wordwas relatively short, reflecting that systematic research in these fields has not yet been formed.
3.4. Co-Citation Analysis
As shown in Figure 7, 30 publications have been cited more than 50 times by these 1252 articles,of which Hoekstra is the first or corresponding author of 15 articles. In terms of the number ofcitations, the book “The water footprint assessment manual” published in Earthscan by Hoekstra,Chapagain, Aldaya and Mekonnen [21] has the highest citations of 421. The book introduces in detailthe “Goals and Scope of WF Evaluation”, “WF Account”, “WF Sustainability Evaluation” and howdifferent stakeholders, such as consumers, farmers, enterprises, and governments, can reduce WFs.
Water 2020, 12, x FOR PEER REVIEW 10 of 20
country in 1997–2001 and concluded that the WF of a country is mainly affected by climate conditions, agricultural structure, and consumption patterns.
In addition to the research group of Hoekstra, the most influential publication is “national water footprint in an input-output framework: A case study of China 2002” with third-place of betweenness Centrality (0.35), which was published by Zhao, et al. [44]. In this article, the national WFs of all industry departments were calculated, which was divided into 23 sectoral units per the input-output table. On this basis, a new indicator of national WF intensity was proposed to evaluate the intensities of water use in different sectors for an accurate water-saving strategy.
In addition to the research group of Hoekstra, the most cited publication is “Assessing the environmental impacts of freshwater consumption in LCA”, ranking eighth with 88 citations, which is published by Pfister, et al. [45]. Based on LCA, this paper has developed a method to assess the impact of freshwater consumption on the environment from the three dimensions of human health, ecosystem production, and water resources, which is also very useful for researchers to assess the environmental impacts of VW and WF.
Figure 7. Publications cited more than 50 times by these 1252 articles.
4. Discussion
4.1. Problems
In recent years, research on VW and WF has received extensive attention [18,34]. However, it can be known from this study that most of the research is mainly conducted in a few nations of China, the United States, and the Netherlands, and even in individual institutions and research groups in these countries, and there is little cooperation between them. In theory, research of VW and WF should be given more attention in water-scarcity countries and regions, such as the Middle East, Central Asia, and Africa, because the original intention of VW is to provide an alternative method for
Figure 7. Publications cited more than 50 times by these 1252 articles.
In terms of time, the earliest publication with citations of more than 50 is a book of “Water footprintsof nations”, which was published by Chapagain and Hoekstra [43]. It is also the most influentialpublication with a betweenness Centrality of 0.6. The book estimated the WF of each country in1997–2001 and concluded that the WF of a country is mainly affected by climate conditions, agriculturalstructure, and consumption patterns.
In addition to the research group of Hoekstra, the most influential publication is “national waterfootprint in an input-output framework: A case study of China 2002” with third-place of betweennessCentrality (0.35), which was published by Zhao, et al. [44]. In this article, the national WFs of all
Water 2020, 12, 3068 11 of 20
industry departments were calculated, which was divided into 23 sectoral units per the input-outputtable. On this basis, a new indicator of national WF intensity was proposed to evaluate the intensitiesof water use in different sectors for an accurate water-saving strategy.
In addition to the research group of Hoekstra, the most cited publication is “Assessing theenvironmental impacts of freshwater consumption in LCA”, ranking eighth with 88 citations, which ispublished by Pfister, et al. [45]. Based on LCA, this paper has developed a method to assess theimpact of freshwater consumption on the environment from the three dimensions of human health,ecosystem production, and water resources, which is also very useful for researchers to assess theenvironmental impacts of VW and WF.
4. Discussion
4.1. Problems
In recent years, research on VW and WF has received extensive attention [18,34]. However, it canbe known from this study that most of the research is mainly conducted in a few nations of China,the United States, and the Netherlands, and even in individual institutions and research groups inthese countries, and there is little cooperation between them. In theory, research of VW and WF shouldbe given more attention in water-scarcity countries and regions, such as the Middle East, Central Asia,and Africa, because the original intention of VW is to provide an alternative method for solvingwater shortages in water-scarce regions [15]. It is thus necessary for international academic groupsto strengthen exchanges and cooperation, especially between developed and developing countries,water-rich and water-poor countries (regions), to further promote the development of VW and WF.
Currently, most research on VW and WF is published in journals in the field of ecologicalenvironment and sustainable development [17]. This reflects that research on VW and WF is stillin the stage of theoretical exploration and improvement, and has not been widely adopted in theoptimal allocation of water resources utilization. It is well known that VW, as an intangible but actuallyexisting resource, always participates in the flow of water resources. It should be incorporated intothe water conservancy planning together with physical water to promote the rational planning andmanagement of water resources, so as to better meet the needs of economic development. “VW flow”is essentially the circulation of the water resources “embedded” in the product in the socio-economicsystem, including blue water and green water. Although it is estimated that 80% of water consumptionin agricultural production comes from green water, green water has not received correspondingattention in traditional water resources research. We believe that the “VW flow” phenomenon canbe regarded as the secondary distribution of water resources, especially for precipitation. Therefore,it should become one of the focuses of social water cycle research, and only by incorporating it into thesocial water cycle can VW and WF research is recognized and funded by policymakers.
The “bottom-up” method has been well applied for calculating crop WF [25], while it has beendifficult to estimate the WF of animal products and industrial products. This is because various existinghydrological, ecological, and crop models can be directly applied to crop WF calculation, and dataacquisition is relatively easy. Although the application of hybrid technology based on the LCA methodin recent years has provided novel ideas for solving the VW calculation of animal products andindustrial products [46], they are still in the initial stage. The quantification of water consumption ofanimal products and industrial products is still the frontier of future research on VW and WF. Regardingthe “top-down” method, the input-output model is mainly used to investigate VW consumptionbetween different industrial sectors and VW flow between regions. However, because this methodrequires input-output tables, it is currently only applicable to some countries and large regional studies.Therefore, how to calculate the VW consumption of various industrial sectors in small areas of lackinginput-output data will still be the challenge for future research on VW and WF.
Water 2020, 12, 3068 12 of 20
4.2. Future Research Trends
4.2.1. Water–Food–Energy–Land–Climate Nexus
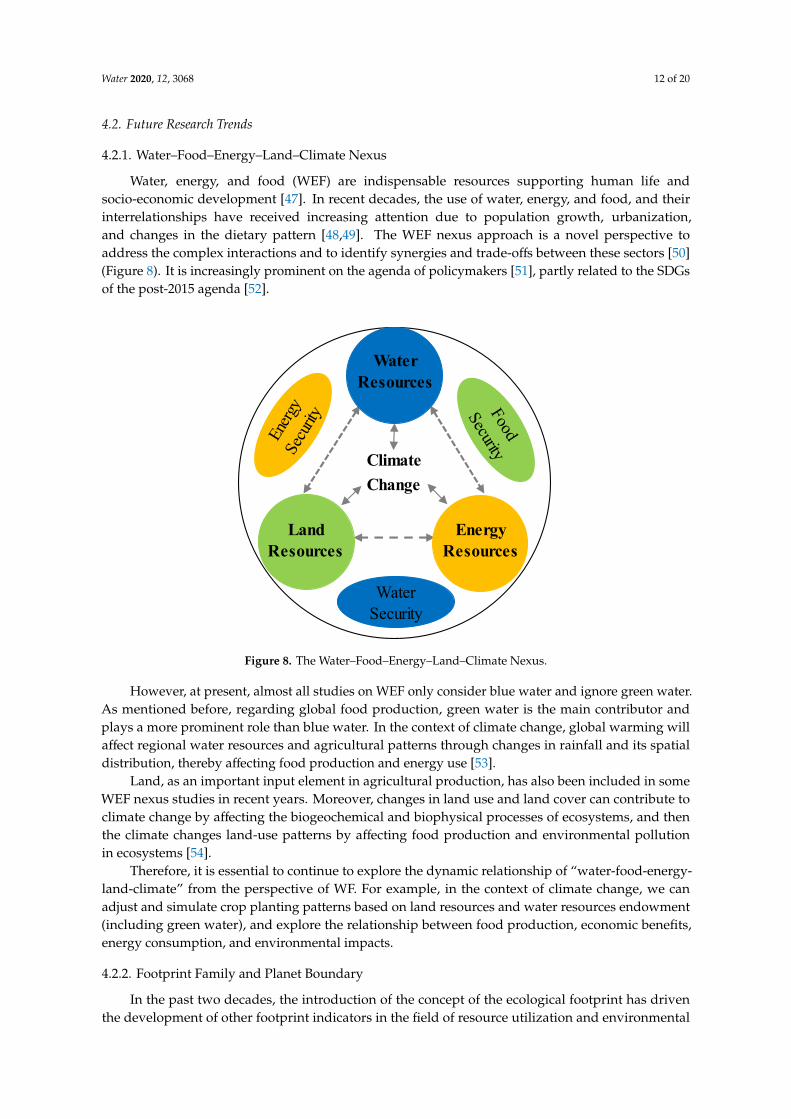
Water, energy, and food (WEF) are indispensable resources supporting human life andsocio-economic development [47]. In recent decades, the use of water, energy, and food, and theirinterrelationships have received increasing attention due to population growth, urbanization,and changes in the dietary pattern [48,49]. The WEF nexus approach is a novel perspective toaddress the complex interactions and to identify synergies and trade-offs between these sectors [50](Figure 8). It is increasingly prominent on the agenda of policymakers [51], partly related to the SDGsof the post-2015 agenda [52].
Water 2020, 12, x FOR PEER REVIEW 12 of 20
Therefore, it is essential to continue to explore the dynamic relationship of “water-food-energy-land-climate” from the perspective of WF. For example, in the context of climate change, we can adjust and simulate crop planting patterns based on land resources and water resources endowment (including green water), and explore the relationship between food production, economic benefits, energy consumption, and environmental impacts.
Figure 8. The Water–Food–Energy–Land–Climate Nexus.
4.2.2. Footprint Family and Planet Boundary
In the past two decades, the introduction of the concept of the ecological footprint has driven the development of other footprint indicators in the field of resource utilization and environmental impact assessment [33]. A series of footprint indicators such as water footprint, carbon footprint, nitrogen footprint, energy footprint, land footprint, and biodiversity footprint came into being [55–57], which have substantially enriched the quantitative assessment indicators of the influence of human activities on the ecosystem [58].
However, the occupation of various natural capitals by human activities and the interference with ecosystems are not independent of each other. Therefore, Galli, et al. [59] conducted a detailed comparison of ecological footprint, water footprint, and carbon footprint for the first time in 2012, and the concept of footprint family was proposed. The footprint family is a series of index clusters, which track the pressure of human activities on the ecosystem from multiple perspectives. Subsequently, Čuček, et al. [60] reviewed the definition, methods, and measurement units of various types of footprint indicators comprehensively, and proposed a series of social and economic footprint indicators in addition to environmental indicators. Hoekstra and Wiedmann [61] put forward the concept of maximum sustainable footprint, which provides a reference basis for quantitative assessment of the environmental sustainability of human activities. Based on the theory of LCA, Ridoutt, et al. [62] argued that all footprint indicators should be able to support the comprehensive evaluation of environmental impact characterized by a single value. The concept of footprint family measures the resource occupancy and the environmental impacts of human activities from the perspective of consumption, but most footprint indicators lack corresponding carrying capacity indicators that can be used to assess whether they exceed the threshold of sustainable development.
To explore whether the increasingly serious resource and environmental problems such as carbon emissions, water resource utilization, and climate change have exceeded the sustainable “boundary”, Rockstrom, et al. [63] proposed the concept of planetary boundaries from the perspective of carrying capacity. Based on this concept, the study for the first time clarified the
Climate Change
Water Resources
LandResources
Energy Resources
Water Security
Figure 8. The Water–Food–Energy–Land–Climate Nexus.
However, at present, almost all studies on WEF only consider blue water and ignore green water.As mentioned before, regarding global food production, green water is the main contributor andplays a more prominent role than blue water. In the context of climate change, global warming willaffect regional water resources and agricultural patterns through changes in rainfall and its spatialdistribution, thereby affecting food production and energy use [53].
Land, as an important input element in agricultural production, has also been included in someWEF nexus studies in recent years. Moreover, changes in land use and land cover can contribute toclimate change by affecting the biogeochemical and biophysical processes of ecosystems, and thenthe climate changes land-use patterns by affecting food production and environmental pollutionin ecosystems [54].
Therefore, it is essential to continue to explore the dynamic relationship of “water-food-energy-land-climate” from the perspective of WF. For example, in the context of climate change, we canadjust and simulate crop planting patterns based on land resources and water resources endowment(including green water), and explore the relationship between food production, economic benefits,energy consumption, and environmental impacts.
4.2.2. Footprint Family and Planet Boundary
In the past two decades, the introduction of the concept of the ecological footprint has driventhe development of other footprint indicators in the field of resource utilization and environmental
Water 2020, 12, 3068 13 of 20
impact assessment [33]. A series of footprint indicators such as water footprint, carbon footprint,nitrogen footprint, energy footprint, land footprint, and biodiversity footprint came into being [55–57],which have substantially enriched the quantitative assessment indicators of the influence of humanactivities on the ecosystem [58].
However, the occupation of various natural capitals by human activities and the interferencewith ecosystems are not independent of each other. Therefore, Galli, et al. [59] conducted a detailedcomparison of ecological footprint, water footprint, and carbon footprint for the first time in 2012,and the concept of footprint family was proposed. The footprint family is a series of index clusters,which track the pressure of human activities on the ecosystem from multiple perspectives. Subsequently,Cucek, et al. [60] reviewed the definition, methods, and measurement units of various types of footprintindicators comprehensively, and proposed a series of social and economic footprint indicators inaddition to environmental indicators. Hoekstra and Wiedmann [61] put forward the concept ofmaximum sustainable footprint, which provides a reference basis for quantitative assessment of theenvironmental sustainability of human activities. Based on the theory of LCA, Ridoutt, et al. [62] arguedthat all footprint indicators should be able to support the comprehensive evaluation of environmentalimpact characterized by a single value. The concept of footprint family measures the resource occupancyand the environmental impacts of human activities from the perspective of consumption, but mostfootprint indicators lack corresponding carrying capacity indicators that can be used to assess whetherthey exceed the threshold of sustainable development.
To explore whether the increasingly serious resource and environmental problems such as carbonemissions, water resource utilization, and climate change have exceeded the sustainable “boundary”,Rockstrom, et al. [63] proposed the concept of planetary boundaries from the perspective of carryingcapacity. Based on this concept, the study for the first time clarified the biophysical critical thresholdsor tipping points of several global resource and environmental issues and received extraordinaryattention and discussion [64,65]. The concept of planetary boundary makes up for the shortcomings ofenvironmental carrying capacity indicators that have not been comprehensive enough for a long time.Due to their respective advantages and strong complementarities (Figure 9), the combined research ofthe footprint family and the planetary boundary has gained momentum in recent years [33,66,67].
Water 2020, 12, x FOR PEER REVIEW 13 of 20
biophysical critical thresholds or tipping points of several global resource and environmental issues and received extraordinary attention and discussion [64,65]. The concept of planetary boundary makes up for the shortcomings of environmental carrying capacity indicators that have not been comprehensive enough for a long time. Due to their respective advantages and strong complementarities (Figure 9), the combined research of the footprint family and the planetary boundary has gained momentum in recent years [33,66,67].
Therefore, in the future, it is not only imperative to strengthen the research on the integration of WF and other footprint indicators, but also need to measure the “critical threshold” of sustainable water use from the perspective of VW and WF.
Figure 9. Sustainability assessment based on footprint family and planetary boundaries.
4.2.3. Material Metabolism
The interplay between human activities and ecosystems in the given region is likened to a metabolic process of “material exchange and energy transfer” [68]. The most commonly used method of material metabolism research is material flow analysis (MFA), which involves the source, path, and sink of material circulation [69]. Material metabolism research investigates the natural resources entering the socio-economic system and the pollutants discharged into the eco-environment system through material flow analysis, thereby evaluating the interaction between human activities and the natural environment. The material flow account is currently a more systematic account system for measuring the use of human material and its impact on the natural environment. It has been applied at global, national, and city scales [70–73] and has formed a relatively complete theoretical method system.
The social water cycle is defined as the circulation process of water in the socio-economic system [74], which generally includes four subsystems: water supply, water use, drainage, and sewage reuse. There is a large body of water transfer in the social water cycle is in the form of VW [75], and closely related to socioeconomic development. The exploration of the mechanism of VW flow is a pivot of the study of the social water cycle, and it is also the entry point to truly understand the driving mechanism and evolution of the social water cycle.
Figure 9. Sustainability assessment based on footprint family and planetary boundaries.
Water 2020, 12, 3068 14 of 20
Therefore, in the future, it is not only imperative to strengthen the research on the integrationof WF and other footprint indicators, but also need to measure the “critical threshold” of sustainablewater use from the perspective of VW and WF.
4.2.3. Material Metabolism
The interplay between human activities and ecosystems in the given region is likened to ametabolic process of “material exchange and energy transfer” [68]. The most commonly used methodof material metabolism research is material flow analysis (MFA), which involves the source, path,and sink of material circulation [69]. Material metabolism research investigates the natural resourcesentering the socio-economic system and the pollutants discharged into the eco-environment systemthrough material flow analysis, thereby evaluating the interaction between human activities andthe natural environment. The material flow account is currently a more systematic account systemfor measuring the use of human material and its impact on the natural environment. It has beenapplied at global, national, and city scales [70–73] and has formed a relatively complete theoreticalmethod system.
The social water cycle is defined as the circulation process of water in the socio-economicsystem [74], which generally includes four subsystems: water supply, water use, drainage, and sewagereuse. There is a large body of water transfer in the social water cycle is in the form of VW [75],and closely related to socioeconomic development. The exploration of the mechanism of VW flow is apivot of the study of the social water cycle, and it is also the entry point to truly understand the drivingmechanism and evolution of the social water cycle.
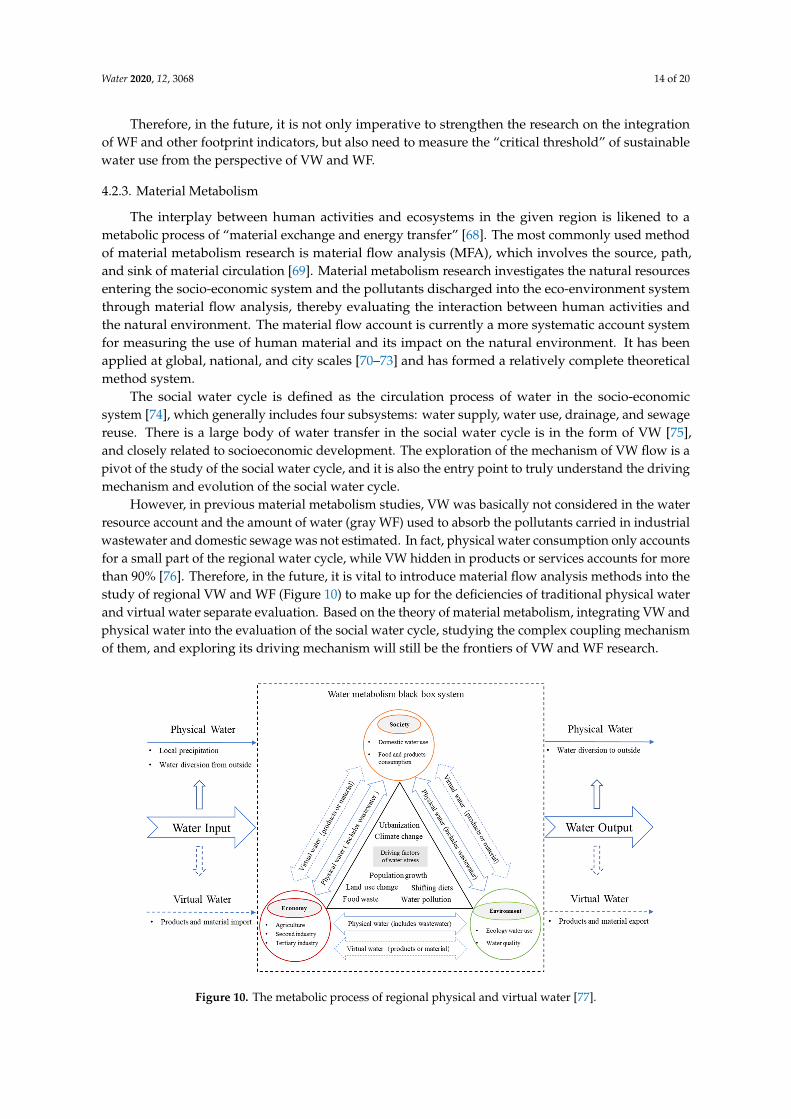
However, in previous material metabolism studies, VW was basically not considered in the waterresource account and the amount of water (gray WF) used to absorb the pollutants carried in industrialwastewater and domestic sewage was not estimated. In fact, physical water consumption only accountsfor a small part of the regional water cycle, while VW hidden in products or services accounts for morethan 90% [76]. Therefore, in the future, it is vital to introduce material flow analysis methods into thestudy of regional VW and WF (Figure 10) to make up for the deficiencies of traditional physical waterand virtual water separate evaluation. Based on the theory of material metabolism, integrating VW andphysical water into the evaluation of the social water cycle, studying the complex coupling mechanismof them, and exploring its driving mechanism will still be the frontiers of VW and WF research.
Water 2020, 12, x FOR PEER REVIEW 14 of 20
However, in previous material metabolism studies, VW was basically not considered in the water resource account and the amount of water (gray WF) used to absorb the pollutants carried in industrial wastewater and domestic sewage was not estimated. In fact, physical water consumption only accounts for a small part of the regional water cycle, while VW hidden in products or services accounts for more than 90% [76]. Therefore, in the future, it is vital to introduce material flow analysis methods into the study of regional VW and WF (Figure 10) to make up for the deficiencies of traditional physical water and virtual water separate evaluation. Based on the theory of material metabolism, integrating VW and physical water into the evaluation of the social water cycle, studying the complex coupling mechanism of them, and exploring its driving mechanism will still be the frontiers of VW and WF research.
Figure 10. The metabolic process of regional physical and virtual water [77].
4.2.4. Telecoupling Sustainability Assessment
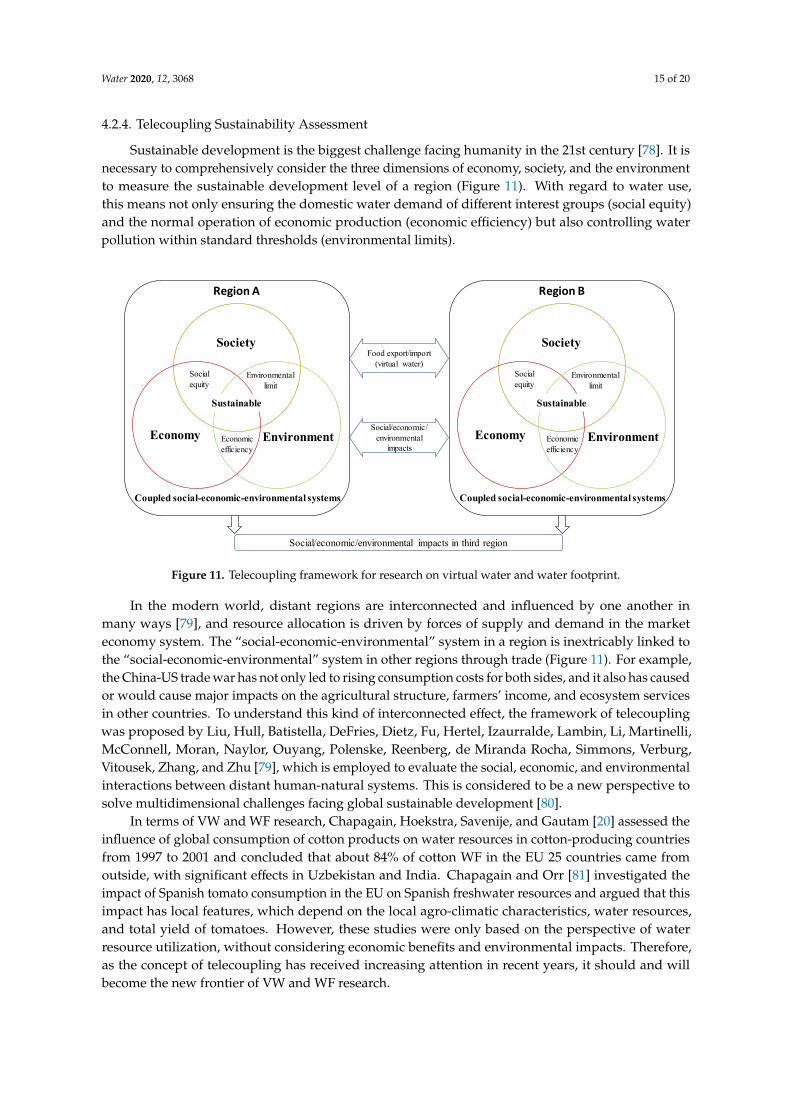
Sustainable development is the biggest challenge facing humanity in the 21st century [78]. It is necessary to comprehensively consider the three dimensions of economy, society, and the environment to measure the sustainable development level of a region (Figure 11). With regard to water use, this means not only ensuring the domestic water demand of different interest groups (social equity) and the normal operation of economic production (economic efficiency) but also controlling water pollution within standard thresholds (environmental limits).
In the modern world, distant regions are interconnected and influenced by one another in many ways [79], and resource allocation is driven by forces of supply and demand in the market economy system. The “social-economic-environmental” system in a region is inextricably linked to the “social-economic-environmental” system in other regions through trade (Figure 11). For example, the China-US trade war has not only led to rising consumption costs for both sides, and it also has caused or would cause major impacts on the agricultural structure, farmers’ income, and ecosystem services in other countries. To understand this kind of interconnected effect, the framework of telecoupling was proposed by Liu, Hull, Batistella, DeFries, Dietz, Fu, Hertel, Izaurralde, Lambin, Li, Martinelli, McConnell, Moran, Naylor, Ouyang, Polenske, Reenberg, de Miranda Rocha, Simmons, Verburg, Vitousek, Zhang, and Zhu [79], which is employed to evaluate the social, economic, and environmental interactions between distant human-natural systems. This is considered to be a new perspective to solve multidimensional challenges facing global sustainable development [80].
In terms of VW and WF research, Chapagain, Hoekstra, Savenije, and Gautam [20] assessed the influence of global consumption of cotton products on water resources in cotton-producing countries
Figure 10. The metabolic process of regional physical and virtual water [77].
Water 2020, 12, 3068 15 of 20
4.2.4. Telecoupling Sustainability Assessment
Sustainable development is the biggest challenge facing humanity in the 21st century [78]. It isnecessary to comprehensively consider the three dimensions of economy, society, and the environmentto measure the sustainable development level of a region (Figure 11). With regard to water use,this means not only ensuring the domestic water demand of different interest groups (social equity)and the normal operation of economic production (economic efficiency) but also controlling waterpollution within standard thresholds (environmental limits).
Water 2020, 12, x FOR PEER REVIEW 15 of 20
from 1997 to 2001 and concluded that about 84% of cotton WF in the EU 25 countries came from outside, with significant effects in Uzbekistan and India. Chapagain and Orr [81] investigated the impact of Spanish tomato consumption in the EU on Spanish freshwater resources and argued that this impact has local features, which depend on the local agro-climatic characteristics, water resources, and total yield of tomatoes. However, these studies were only based on the perspective of water resource utilization, without considering economic benefits and environmental impacts. Therefore, as the concept of telecoupling has received increasing attention in recent years, it should and will become the new frontier of VW and WF research.
Figure 11. Telecoupling framework for research on virtual water and water footprint.
5. Conclusions
Based upon the Web of Science Core Collection, this study employs CiteSpace to quantitatively analyze and visualize information about countries, institutions, and authors that have conducted VW and WF research over the past two decades, and the changing characteristics of research hotspots are analyzed through keywords and burst terms. On this basis, the future research frontiers of VW and WF are further predicted. The main results are as follows:
As of July 2020, there were 1592 publications on VW and WF, showing an increasing trend overall. The annual average number of publications was only 7.4 in 1998–2008, while it was 126.5 in 2009–2019. Among them, up to 618 publications belong to environmental science, accounting for 46%, followed by water resources (371, 28%), engineering environmental (241, 18%), and green sustainable science technology (235, 17%), which shows that VW and WF have become important methods and indicators of environmental impact assessment.
In total, 84 countries have published research articles on VW and WF. Although China was the most productive country with a total of 344 articles, and 8 of the 11 institutions with the most articles were in China, the Netherlands had the largest influence with a betweenness centrality of 0.33, indicating its leading position. Hoekstra has published 82 articles, far ahead of second-place P. T. WU (25), and he was also the first author, corresponding author, or co-author of half of the publications that have been cited more than 50 times by 1252 articles, which exemplifies his dominant role in the field of VW and WF.
It is essential to strengthen cooperation between developed and developing countries, water-rich countries (regions), and water-poor countries (regions), and to incorporate VW into social water cycle research. Besides, future research should also be conducted from the perspectives of the “water-food-energy-land-climate nexus”, “footprint family and planet boundary”, “material metabolism theory”, and “telecoupling sustainability assessment”.
Economy
Society
Environment
Sustainable
Social equity
Economic efficiency
Environmental limit
Coupled social-economic-environmental systems
Region A
Economy
Society
Environment
Sustainable
Social equity
Economic efficiency
Environmental limit
Coupled social-economic-environmental systems
Region B
Food export/import(virtual water)
Social/economic/environmental
impacts
Social/economic/environmental impacts in third region
Figure 11. Telecoupling framework for research on virtual water and water footprint.
In the modern world, distant regions are interconnected and influenced by one another inmany ways [79], and resource allocation is driven by forces of supply and demand in the marketeconomy system. The “social-economic-environmental” system in a region is inextricably linked tothe “social-economic-environmental” system in other regions through trade (Figure 11). For example,the China-US trade war has not only led to rising consumption costs for both sides, and it also has causedor would cause major impacts on the agricultural structure, farmers’ income, and ecosystem servicesin other countries. To understand this kind of interconnected effect, the framework of telecouplingwas proposed by Liu, Hull, Batistella, DeFries, Dietz, Fu, Hertel, Izaurralde, Lambin, Li, Martinelli,McConnell, Moran, Naylor, Ouyang, Polenske, Reenberg, de Miranda Rocha, Simmons, Verburg,Vitousek, Zhang, and Zhu [79], which is employed to evaluate the social, economic, and environmentalinteractions between distant human-natural systems. This is considered to be a new perspective tosolve multidimensional challenges facing global sustainable development [80].
In terms of VW and WF research, Chapagain, Hoekstra, Savenije, and Gautam [20] assessed theinfluence of global consumption of cotton products on water resources in cotton-producing countriesfrom 1997 to 2001 and concluded that about 84% of cotton WF in the EU 25 countries came fromoutside, with significant effects in Uzbekistan and India. Chapagain and Orr [81] investigated theimpact of Spanish tomato consumption in the EU on Spanish freshwater resources and argued that thisimpact has local features, which depend on the local agro-climatic characteristics, water resources,and total yield of tomatoes. However, these studies were only based on the perspective of waterresource utilization, without considering economic benefits and environmental impacts. Therefore,as the concept of telecoupling has received increasing attention in recent years, it should and willbecome the new frontier of VW and WF research.
Water 2020, 12, 3068 16 of 20
5. Conclusions
Based upon the Web of Science Core Collection, this study employs CiteSpace to quantitativelyanalyze and visualize information about countries, institutions, and authors that have conducted VWand WF research over the past two decades, and the changing characteristics of research hotspots areanalyzed through keywords and burst terms. On this basis, the future research frontiers of VW andWF are further predicted. The main results are as follows:
As of July 2020, there were 1592 publications on VW and WF, showing an increasing trend overall.The annual average number of publications was only 7.4 in 1998–2008, while it was 126.5 in 2009–2019.Among them, up to 618 publications belong to environmental science, accounting for 46%, followed bywater resources (371, 28%), engineering environmental (241, 18%), and green sustainable sciencetechnology (235, 17%), which shows that VW and WF have become important methods and indicatorsof environmental impact assessment.
In total, 84 countries have published research articles on VW and WF. Although China wasthe most productive country with a total of 344 articles, and 8 of the 11 institutions with the mostarticles were in China, the Netherlands had the largest influence with a betweenness centrality of0.33, indicating its leading position. Hoekstra has published 82 articles, far ahead of second-placeP. T. WU (25), and he was also the first author, corresponding author, or co-author of half of thepublications that have been cited more than 50 times by 1252 articles, which exemplifies his dominantrole in the field of VW and WF.
It is essential to strengthen cooperation between developed and developing countries, water-richcountries (regions), and water-poor countries (regions), and to incorporate VW into social watercycle research. Besides, future research should also be conducted from the perspectives of the“water-food-energy-land-climate nexus”, “footprint family and planet boundary”, “material metabolismtheory”, and “telecoupling sustainability assessment”.
Author Contributions: Conceptualization, W.M.; methodology, W.M.; software, W.M.; formal analysis, W.M.;investigation, W.M.; data curation, W.M.; writing—original draft preparation, W.M.; writing—review and editing,C.O.; visualization, W.M.; supervision, C.O.; project administration, D.Y.; funding acquisition, D.Y. All authorshave read and agreed to the published version of the manuscript.
Funding: This research was funded by the National Major Science and Technology Program for Water PollutionControl and Treatment, grant number 2017ZX07101001; the Major Program of National Natural Science Foundationof China, grant number 41690142; the Fundamental Research Funds for the Central Universities, grant numberSWU019047; and the China Scholarship Council, grant number 201704910850. The APC was funded byPhilipps-Universität Marburg.
Acknowledgments: The authors would like to thank the editors and reviewers for their insightful comments andefforts towards improving this manuscript.
Conflicts of Interest: The authors declare no conflict of interest.
References
1. Tuninetti, M.; Tamea, S.; Dalin, C. Water Debt Indicator Reveals Where Agricultural Water Use ExceedsSustainable Levels. Water Resour. Res. 2019, 55, 2464–2477. [CrossRef]
2. Sun, S.; Wu, P.; Wang, Y.; Zhao, X.; Liu, J.; Zhang, X. The impacts of interannual climate variability andagricultural inputs on water footprint of crop production in an irrigation district of China. Sci. Total Environ.2013, 444, 498–507. [CrossRef] [PubMed]
3. Karandish, F.; Hoekstra, A.Y.; Hogeboom, R.J. Reducing food waste and changing cropping patterns toreduce water consumption and pollution in cereal production in Iran. J. Hydrol. 2020, 586. [CrossRef]
4. Liu, J.; Yang, H.; Gosling, S.N.; Kummu, M.; Florke, M.; Pfister, S.; Hanasaki, N.; Wada, Y.; Zhang, X.;Zheng, C.; et al. Water scarcity assessments in the past, present and future. Earths Future 2017, 5, 545–559.[CrossRef] [PubMed]
5. Ma, W.; Meng, L.; Wei, F.; Opp, C.; Yang, D. Sensitive Factors Identification and Scenario Simulation of WaterDemand in the Arid Agricultural Area Based on the Socio-Economic-Environment Nexus. Sustainability2020, 12, 3996. [CrossRef]
9. van Vliet, M.T.H.; Flörke, M.; Wada, Y. Quality matters for water scarcity. Nat. Geosci. 2017, 10, 800–802.[CrossRef]
10. Ma, W.; Opp, C.; Yang, D. Spatiotemporal supply-demand characteristics and economic benefits of cropwater footprint in the semi-arid region. Sci. Total Environ. 2020, 738, 139502. [CrossRef] [PubMed]
11. Connor, R. The United Nations World Water Development Report 2015: Water for a Sustainable World;UNESCO Publishing: Paris, France, 2015; Volume 1.
12. Whitney, K.S.; Whitney, K.J.A. John Anthony Allan’s “Virtual Water”: Natural Resources Management in theWake of Neoliberalism. Arcadia 2018. [CrossRef]
13. Allan, J.A. Fortunately there are substitutes for water otherwise our hydro-political futures would beimpossible. Priorities Water Resour. Alloc. Manag. 1993, 13, 26.
14. Shtull-Trauring, E.; Bernstein, N. Virtual water flows and water-footprint of agricultural crop production,import and export: A case study for Israel. Sci. Total Environ. 2018, 622–623, 1438–1447. [CrossRef] [PubMed]
15. Allan, J.A. Virtual water: A strategic resource global solutions to regional deficits. Ground Water 1998,36, 545–546. [CrossRef]
16. Hoekstra, A.Y. Virtual Water Trade: Proceedings of the International Expert Meeting on Virtual Water Trade;Value of Water Research Report Series No. 12; UNESCO-IHE: Delft, The Netherlands, 2003.
17. Hoekstra, A.Y. Water Footprint Assessment: Evolvement of a New Research Field. Water Resour. Manag.2017, 31, 3061–3081. [CrossRef]
18. Hoekstra, A.Y.; Chapagain, A.K.; van Oel, P.R. Progress in Water Footprint Assessment: Towards CollectiveAction in Water Governance. Water 2019, 11, 1070. [CrossRef]
19. Qian, Y.; Tian, X.; Geng, Y.; Zhong, S.; Cui, X.; Zhang, X.; Moss, D.A.; Bleischwitz, R. Driving Factors ofAgricultural Virtual Water Trade between China and the Belt and Road Countries. Environ. Sci. Technol.2019, 53, 5877–5886. [CrossRef]
20. Chapagain, A.K.; Hoekstra, A.Y.; Savenije, H.H.G.; Gautam, R. The water footprint of cotton consumption:An assessment of the impact of worldwide consumption of cotton products on the water resources in thecotton producing countries. Ecol. Econ. 2006, 60, 186–203. [CrossRef]
21. Hoekstra, A.Y.; Chapagain, A.K.; Aldaya, M.M.; Mekonnen, M.M. The Water Footprint Assessment Manual;Earthscan: London, UK, 2011.
22. Song, J.; Yin, Y.; Xu, H.; Wang, Y.; Wu, P.; Sun, S. Drivers of domestic grain virtual water flow: A study forChina. Agric. Water Manag. 2020, 239. [CrossRef]
23. Wang, Z.; Zhang, L.; Ding, X.; Mi, Z. Virtual water flow pattern of grain trade and its benefits in China.J. Clean. Prod. 2019, 223, 445–455. [CrossRef]
24. Hoekstra, A.Y.; Mekonnen, M.M. The water footprint of humanity. Proc. Natl. Acad. Sci. USA 2012,109, 3232–3237. [CrossRef]
25. Lovarelli, D.; Bacenetti, J.; Fiala, M. Water Footprint of crop productions: A review. Sci. Total Environ. 2016,548–549, 236–549. [CrossRef] [PubMed]
26. Vanham, D.; Bidoglio, G. A review on the indicator water footprint for the EU28. Ecol. Indic. 2013, 26, 61–75.[CrossRef]
27. Hoekstra, A.Y.; Hung, P.Q. Virtual Water Trade: A Quantification of Virtual Water Flows between Nationsin Relation to International Crop Trade; Value of Water Research Report Series No. 11; UNESCO-IHE:Delft, The Netherlands, 2002.
28. Zeng, Z.; Liu, J.; Koeneman, P.H.; Zarate, E.; Hoekstra, A.Y. Assessing water footprint at river basin level:A case study for the Heihe River Basin in northwest China. Hydrol. Earth Syst. Sci. 2012, 16, 2771–2781.[CrossRef]
29. Liu, J.; Williams, J.R.; Zehnder, A.J.B.; Yang, H. GEPIC—Modelling wheat yield and crop water productivitywith high resolution on a global scale. Agric. Syst. 2007, 94, 478–493. [CrossRef]
30. Chukalla, A.D.; Krol, M.S.; Hoekstra, A.Y. Green and blue water footprint reduction in irrigated agriculture:Effect of irrigation techniques, irrigation strategies and mulching. Hydrol. Earth Syst. Sci. 2015, 19, 4877–4891.[CrossRef]
31. Zhuo, L.; Mekonnen, M.M.; Hoekstra, A.Y. The effect of inter-annual variability of consumption, production,trade and climate on crop-related green and blue water footprints and inter-regional virtual water trade:A study for China (1978–2008). Water Res. 2016, 94, 73–85. [CrossRef] [PubMed]
32. Fader, M.; Gerten, D.; Thammer, M.; Heinke, J.; Lotze-Campen, H.; Lucht, W.; Cramer, W. Internal andexternal green-blue agricultural water footprints of nations, and related water and land savings throughtrade. Hydrol. Earth Syst. Sci. 2011, 15, 1641–1660. [CrossRef]
33. Vanham, D.; Leip, A.; Galli, A.; Kastner, T.; Bruckner, M.; Uwizeye, A.; van Dijk, K.; Ercin, E.; Dalin, C.;Brandão, M.; et al. Environmental footprint family to address local to planetary sustainability and deliver onthe SDGs. Sci. Total Environ. 2019, 693. [CrossRef]
34. Zhang, Y.; Huang, K.; Yu, Y.; Yang, B. Mapping of water footprint research: A bibliometric analysis during2006–2015. J. Clean. Prod. 2017, 149, 70–79. [CrossRef]
35. Hoekstra, A.Y.; Chapagain, A.K. Water footprints of nations: Water use by people as a function of theirconsumption pattern. Water Resour. Manag. 2006, 21, 35–48. [CrossRef]
37. Chen, C. Visualizing and Exploring Scientific Literature with CiteSpace. In Proceedings of the 2018 Conferenceon Human Information Interaction&Retrieval—CHIIR ′18, New Brunswick, NJ, USA, 11–15 March 2018;pp. 369–370.
38. Zhang, Y.; Li, C.; Ji, X.; Yun, C.; Wang, M.; Luo, X. The knowledge domain and emerging trends inphytoremediation: A scientometric analysis with CiteSpace. Environ. Sci. Pollut. Res. Int. 2020,27, 15515–15536. [CrossRef] [PubMed]
39. Fang, Y.; Yin, J.; Wu, B. Climate change and tourism: A scientometric analysis using CiteSpace. J. Sustain. Tour.2017, 26, 108–126. [CrossRef]
40. Hu, W.; Li, C.-H.; Ye, C.; Wang, J.; Wei, W.-W.; Deng, Y. Research progress on ecological models in the field ofwater eutrophication: CiteSpace analysis based on data from the ISI web of science database. Ecol. Model.2019, 410. [CrossRef]
41. Chen, C. The Citespace Manual; College of Computing and Informatics: Philadelphia, PA, USA, 2014; Volume 1,pp. 1–84.
42. Li, J.; Reniers, G.; Cozzani, V.; Khan, F. A bibliometric analysis of peer-reviewed publications on dominoeffects in the process industry. J. Loss Prev. Process Ind. 2017, 49, 103–110. [CrossRef]
43. Chapagain, A.K.; Hoekstra, A.Y. Water Footprints of Nations; UNESCO-IHE: Delft, the Netherlands, 2004.44. Zhao, X.; Chen, B.; Yang, Z.F. National water footprint in an input–output framework—A case study of
China 2002. Ecol. Model. 2009, 220, 245–253. [CrossRef]45. Pfister, S.; Koehler, A.; Hellweg, S. Assessing the environmental impacts of freshwater consumption in LCA.
Environ. Sci. Technol. 2009, 43, 4098–4104. [CrossRef]46. Boulay, A.M.; Hoekstra, A.Y.; Vionnet, S. Complementarities of water-focused life cycle assessment and
Zhang, L.; et al. Quantifying the Urban Food-Energy-Water Nexus: The Case of the Detroit MetropolitanArea. Environ. Sci. Technol. 2019, 53, 779–788. [CrossRef]
51. Li, P.-C.; Ma, H.-W. Evaluating the environmental impacts of the water-energy-food nexus with a life-cycleapproach. Resour. Conserv. Recycl. 2020, 157. [CrossRef]
52. Zhang, P.; Zhang, L.; Chang, Y.; Xu, M.; Hao, Y.; Liang, S.; Liu, G.; Yang, Z.; Wang, C. Food-energy-water(FEW) nexus for urban sustainability: A comprehensive review. Resour. Conserv. Recycl. 2019, 142, 215–224.[CrossRef]
53. Howells, M.; Hermann, S.; Welsch, M.; Bazilian, M.; Segerström, R.; Alfstad, T.; Gielen, D.; Rogner, H.;Fischer, G.; van Velthuizen, H.; et al. Integrated analysis of climate change, land-use, energy and waterstrategies. Nat. Clim. Chang. 2013, 3, 621–626. [CrossRef]
54. Arneth, A.; Brown, C.; Rounsevell, M.D.A. Global models of human decision-making for land-basedmitigation and adaptation assessment. Nat. Clim. Chang. 2014, 4, 550–557. [CrossRef]
55. Fang, K.; Heijungs, R.; De Snoo, G.R. Understanding the complementary linkages between environmentalfootprints and planetary boundaries in a footprint–boundary environmental sustainability assessmentframework. Ecol. Econ. 2015, 114, 218–226. [CrossRef]
56. Mekonnen, M.M.; Romanelli, T.L.; Ray, C.; Hoekstra, A.Y.; Liska, A.J.; Neale, C.M.U. Water, Energy,and Carbon Footprints of Bioethanol from the US and Brazil. Environ. Sci. Technol. 2018, 52, 14508–14518.[CrossRef] [PubMed]
57. Siddik, M.A.; Chini, C.M.; Marston, L. Water and Carbon Footprints of Electricity Are Sensitive to GeographicalAttribution Methods. Environ. Sci. Technol. 2020, 54, 7533–7541. [CrossRef]
58. O’Neill, D.W.; Fanning, A.L.; Lamb, W.F.; Steinberger, J.K. A good life for all within planetary boundaries.Nat. Sustain. 2018, 1, 88–95. [CrossRef]
59. Galli, A.; Wiedmann, T.; Ercin, E.; Knoblauch, D.; Ewing, B.; Giljum, S. Integrating Ecological, Carbon andWater footprint into a “Footprint Family” of indicators: Definition and role in tracking human pressure onthe planet. Ecol. Indic. 2012, 16, 100–112. [CrossRef]
60. Cucek, L.; Klemeš, J.J.; Kravanja, Z. A Review of Footprint analysis tools for monitoring impacts onsustainability. J. Clean. Prod. 2012, 34, 9–20. [CrossRef]
62. Ridoutt, B.G.; Pfister, S.; Manzardo, A.; Bare, J.; Boulay, A.-M.; Cherubini, F.; Fantke, P.; Frischknecht, R.;Hauschild, M.; Henderson, A.; et al. Area of concern: A new paradigm in life cycle assessment for thedevelopment of footprint metrics. Int. J. Life Cycle Assess. 2015, 21, 276–280. [CrossRef]
63. Rockstrom, J.; Steffen, W.; Noone, K.; Persson, A.; Chapin, F.S., 3rd; Lambin, E.F.; Lenton, T.M.; Scheffer, M.;Folke, C.; Schellnhuber, H.J.; et al. A safe operating space for humanity. Nature 2009, 461, 472–475. [CrossRef]
65. Lewis, S.L. We must set planetary boundaries wisely. Nature 2012, 485, 417. [CrossRef]66. Li, M.; Wiedmann, T.; Hadjikakou, M. Towards meaningful consumption-based planetary boundary
indicators: The phosphorus exceedance footprint. Glob. Environ. Chang. 2019, 54, 227–238. [CrossRef]67. Dao, H.; Peduzzi, P.; Friot, D. National environmental limits and footprints based on the Planetary Boundaries
framework: The case of Switzerland. Glob. Environ. Chang. 2018, 52, 49–57. [CrossRef]68. Wolman, A. The metabolism of cities. Sci. Am. 1965, 213, 178–193. [CrossRef]69. Hashimoto, S.; Moriguchi, Y. Proposal of six indicators of material cycles for describing society’s metabolism:
From the viewpoint of material flow analysis. Resour. Conserv. Recycl. 2004, 40, 185–200. [CrossRef]70. Allesch, A.; Brunner, P.H. Material Flow Analysis as a Tool to improve Waste Management Systems: The Case
of Austria. Environ. Sci. Technol. 2017, 51, 540–551. [CrossRef]71. Condeixa, K.; Haddad, A.; Boer, D. Material flow analysis of the residential building stock at the city of Rio
de Janeiro. J. Clean. Prod. 2017, 149, 1249–1267. [CrossRef]72. Sun, X.; Hao, H.; Zhao, F.; Liu, Z. Tracing global lithium flow: A trade-linked material flow analysis.
Resour. Conserv. Recycl. 2017, 124, 50–61. [CrossRef]73. Song, J.; Yan, W.; Cao, H.; Song, Q.; Ding, H.; Lv, Z.; Zhang, Y.; Sun, Z. Material flow analysis on critical raw
materials of lithium-ion batteries in China. J. Clean. Prod. 2019, 215, 570–581. [CrossRef]74. Qin, D.; Lu, C.; Liu, J.; Wang, H.; Wang, J.; Li, H.; Chu, J.; Chen, G. Theoretical framework of dualistic
nature–social water cycle. Chin. Sci. Bull. 2014, 59, 810–820. [CrossRef]
75. D’Odorico, P.; Carr, J.; Dalin, C.; Dell’Angelo, J.; Konar, M.; Laio, F.; Ridolfi, L.; Rosa, L.; Suweis, S.; Tamea, S.; et al.Global virtual water trade and the hydrological cycle: Patterns, drivers, and socio-environmental impacts.Environ. Res. Lett. 2019, 14. [CrossRef]
76. Graham, N.T.; Hejazi, M.I.; Kim, S.H.; Davies, E.G.R.; Edmonds, J.A.; Miralles-Wilhelm, F. Future changes inthe trading of virtual water. Nat. Commun. 2020, 11, 3632. [CrossRef]
77. Meng, L.; Yang, D.; Ding, Z.; Wang, Y.; Ma, W. Spatiotemporal variations of water resources metabolismefficiency in the Beijing-Tianjin-Hebei region, China. Water Supply 2020, 20, 1178–1188. [CrossRef]
78. Wu, J. Landscape sustainability science: Ecosystem services and human well-being in changing landscapes.Landsc. Ecol. 2013, 28, 999–1023. [CrossRef]
79. Liu, J.; Hull, V.; Batistella, M.; DeFries, R.; Dietz, T.; Fu, F.; Hertel, T.W.; Izaurralde, R.C.; Lambin, E.F.;Li, S.; et al. Framing Sustainability in a Telecoupled World. Ecol. Soc. 2013, 18. [CrossRef]
80. Hull, V.; Liu, J. Telecoupling: A new frontier for global sustainability. Ecol. Soc. 2018, 23. [CrossRef]81. Chapagain, A.K.; Orr, S. An improved water footprint methodology linking global consumption to local
water resources: A case of Spanish tomatoes. J. Environ. Manag. 2009, 90, 1219–1228. [CrossRef]
Publisher’s Note: MDPI stays neutral with regard to jurisdictional claims in published maps and institutionalaffiliations.