33
1 CREDICORP November, 2005
| Date post: | 15-Dec-2015 |
| Category: |
Documents |
| Upload: | lee-welles |
| View: | 216 times |
| Download: | 2 times |

1
CREDICORP
November, 2005
2
Agenda
Peruvian Economy
Credicorp Ltd.
Peruvian Financial System
Credicorp’s main subsidiaries
Credicorp’s earnings contributions
Overview
3
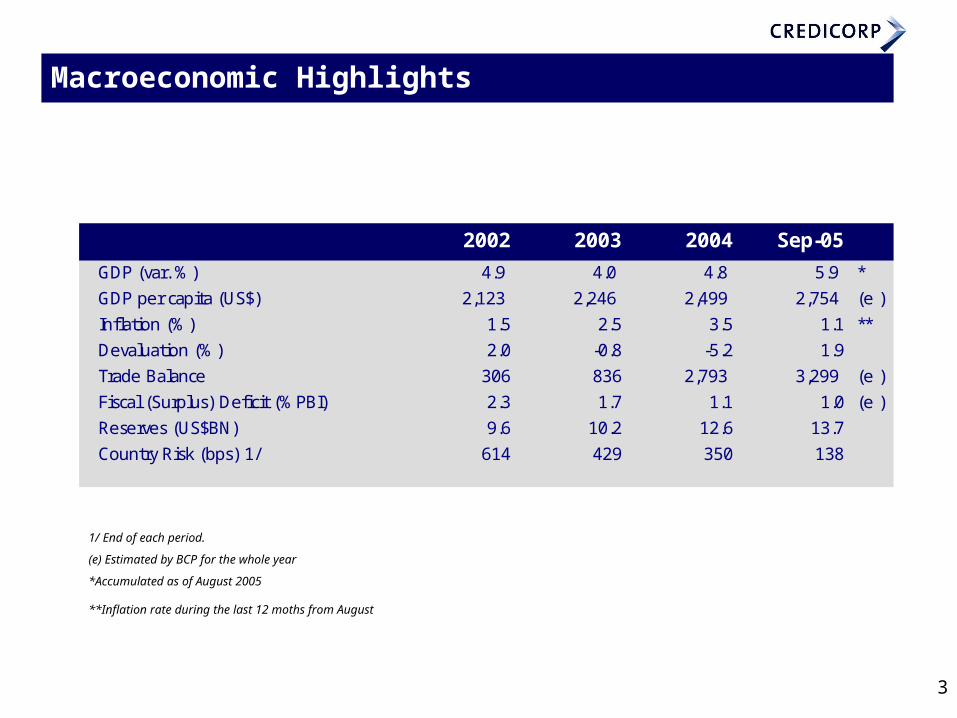
Macroeconomic Highlights
1/ End of each period.
(e) Estimated by BCP for the whole year
*Accumulated as of August 2005
**Inflation rate during the last 12 moths from August
2002 2003 2004 Sep-05
GDP (var. %) 4.9 4.0 4.8 5.9 *
GDP per capita (US$) 2,123 2,246 2,499 2,754 (e )
Inflation (%) 1.5 2.5 3.5 1.1 **
Devaluation (%) 2.0 -0.8 -5.2 1.9
Trade Balance 306 836 2,793 3,299 (e )
Fiscal (Surplus) Deficit (%PBI) 2.3 1.7 1.1 1.0 (e )
Reserves (US$BN) 9.6 10.2 12.6 13.7
Country Risk (bps) 1/ 614 429 350 138
4
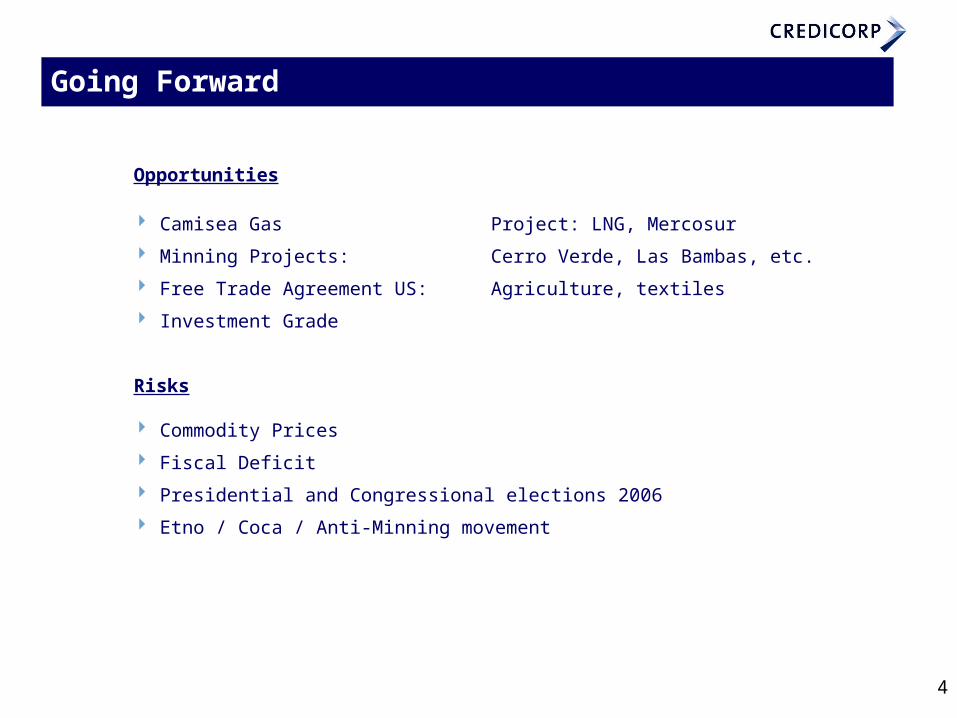
Going Forward
Opportunities
Camisea Gas Project: LNG, Mercosur
Minning Projects: Cerro Verde, Las Bambas, etc.
Free Trade Agreement US: Agriculture, textiles
Investment Grade
Risks
Commodity Prices
Fiscal Deficit
Presidential and Congressional elections 2006
Etno / Coca / Anti-Minning movement
5
Agenda
Peruvian Economy
Credicorp Ltd.
Peruvian Financial System
Credicorp’s main subsidiaries
Credicorp’s earnings contributions
Overview
6
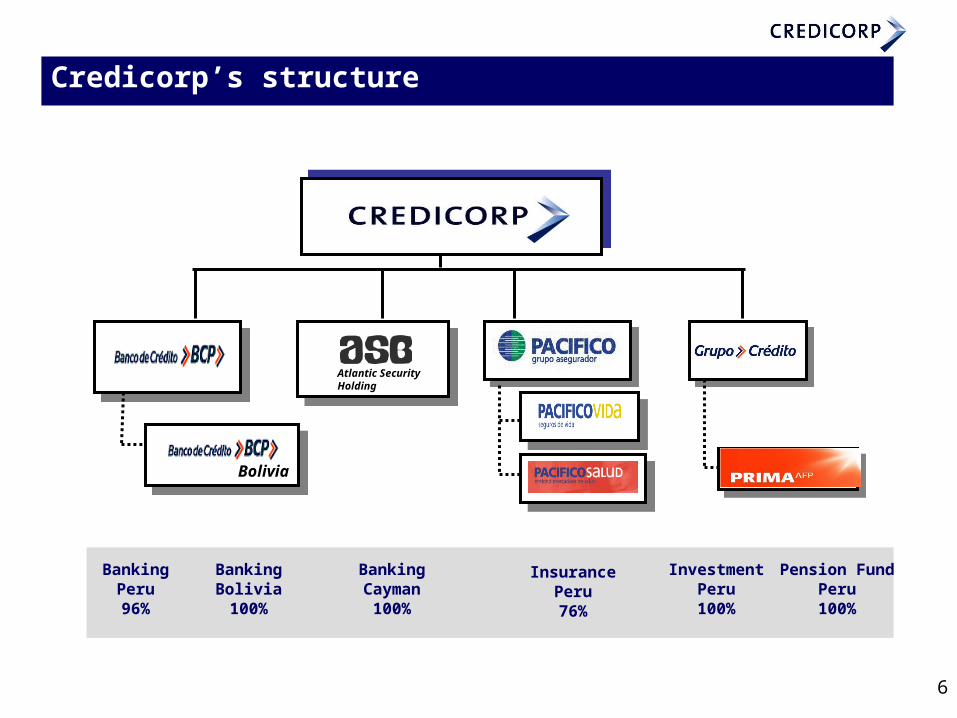
Credicorp’s structure
BoliviaBolivia
BankingPeru96%
BankingBolivia100%
BankingCayman100%
InsurancePeru76%
InvestmentPeru100%
Pension FundPeru100%
Atlantic Security Holding
7
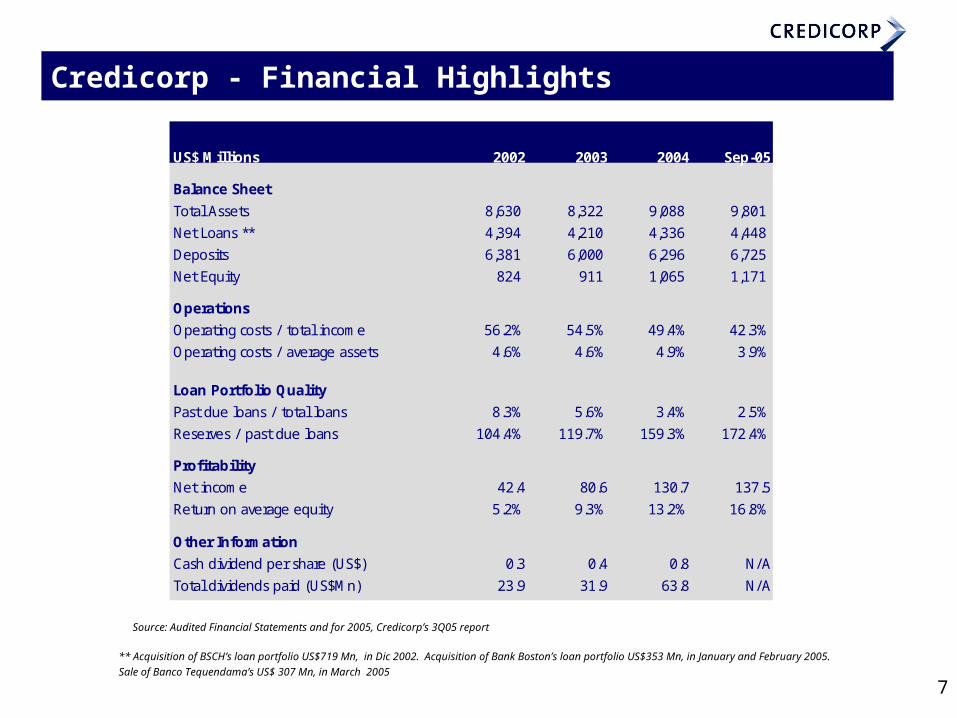
Credicorp - Financial Highlights
US$ Millions 2002 2003 2004 Sep-05
Balance Sheet
Total Assets 8,630 8,322 9,088 9,801
Net Loans ** 4,394 4,210 4,336 4,448
Deposits 6,381 6,000 6,296 6,725
Net Equity 824 911 1,065 1,171
Operations
Operating costs / total income 56.2% 54.5% 49.4% 42.3%
Operating costs / average assets 4.6% 4.6% 4.9% 3.9%
Loan Portfolio Quality
Past due loans / total loans 8.3% 5.6% 3.4% 2.5%
Reserves / past due loans 104.4% 119.7% 159.3% 172.4%
Profitability
Net income 42.4 80.6 130.7 137.5
Return on average equity 5.2% 9.3% 13.2% 16.8%
Other Information
Cash dividend per share (US$) 0.3 0.4 0.8 N/A
Total dividends paid (US$Mn) 23.9 31.9 63.8 N/A
** Acquisition of BSCH’s loan portfolio US$719 Mn, in Dic 2002. Acquisition of Bank Boston’s loan portfolio US$353 Mn, in January and February 2005. Sale of Banco Tequendama’s US$ 307 Mn, in March 2005
Source: Audited Financial Statements and for 2005, Credicorp’s 3Q05 report
8
Agenda
Peruvian Economy
Credicorp Ltd.
Peruvian Financial System
Credicorp’s main subsidiaries
Credicorp’s earnings contributions
Overview

9
2002 2003 2004 Sept05
Loans in dollars (%)Loans in dollars (%) 79.679.6 77.977.9 75.675.6 73.573.5
Deposits in dollars (%)Deposits in dollars (%) 71.571.5 69.569.5 67.167.1 65.965.9
PDL / Loans (%)PDL / Loans (%) 7.67.6 5.85.8 3.73.7 2.72.7
Reserves / PDLs (%)Reserves / PDLs (%) 133.2133.2 141.1141.1 176.4176.4 205.3205.3
ROE (%)ROE (%) 8.48.4 10.910.9 11.311.3 19.519.5
Bank Deposits (US$Bn)Bank Deposits (US$Bn) 13.513.5 13.213.2 14.314.3 16.016.0
Bank Loans (US$Bn)Bank Loans (US$Bn) 10.610.6 10.310.3 10.810.8 11.911.9
Mutul Funds (US$Mn)Mutul Funds (US$Mn) 1,5031,503 2,0072,007 1,7671,767 1,9651,965
Corporate Bonds (US$Mn)Corporate Bonds (US$Mn) 1,1821,182 1,7511,751 2,2932,293 2,3252,325
Peruvian Financial System - Highlights
Source: SBS
10
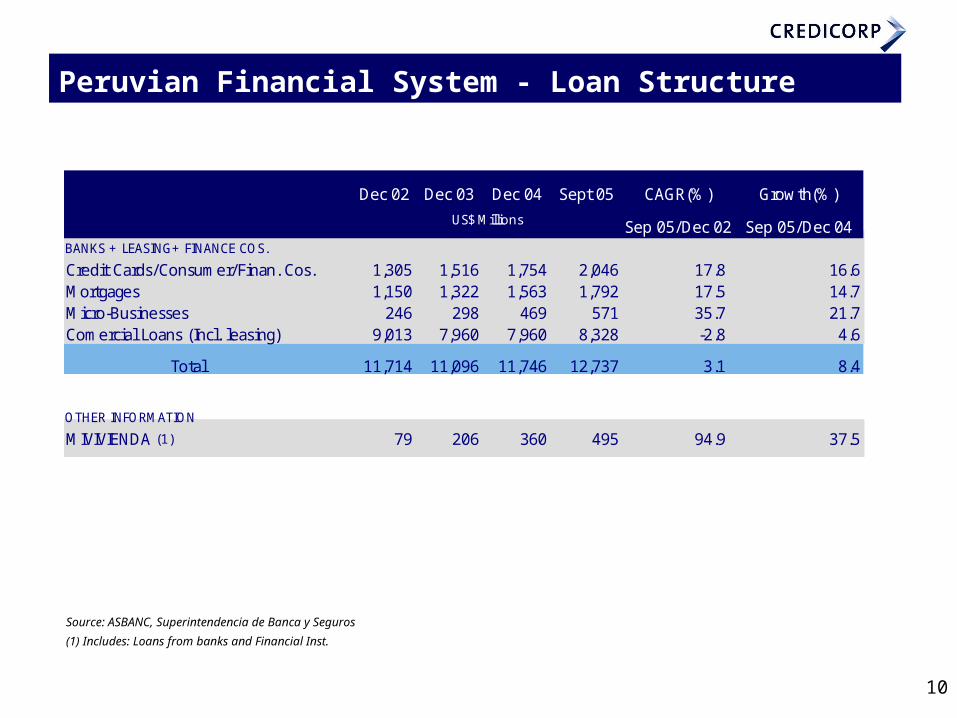
Dec 02 Dec 03 Dec 04 Sept 05 CAGR(%) Growth(%)
Sep 05/Dec 02 Sep 05/Dec 04BANKS + LEASING+ FINANCE COS.
Credit Cards/Consumer/Finan. Cos. 1,305 1,516 1,754 2,046 17.8 16.6Mortgages 1,150 1,322 1,563 1,792 17.5 14.7Micro-Businesses 246 298 469 571 35.7 21.7Comercial Loans (Incl. leasing) 9,013 7,960 7,960 8,328 -2.8 4.6
Total 11,714 11,096 11,746 12,737 3.1 8.4
OTHER INFORMATION
MIVIVIENDA (1) 79 206 360 495 94.9 37.5
US$ Millions
Source: ASBANC, Superintendencia de Banca y Seguros
(1) Includes: Loans from banks and Financial Inst.
Peruvian Financial System - Loan Structure

11
Peruvian Financial System - Market Share (1)
(1) Includes Banks, Finance Institut., Leasing Companies, S&L Regional Institut..
Loan
(%) 2002 2003 2004 Sep-05
BCP 33.6% 31.2% 29.1% 29.0%BBVA 15.2% 16.6% 18.6% 20.2%BWS 17.4% 14.6% 12.8% 12.9%Interbank 7.6% 8.4% 9.0% 8.9%Citibank 4.7% 4.1% 3.4% 4.1%Otros 21.6% 25.1% 27.2% 24.9%
Deposits
(%) 2002 2003 2004 Sep-05
BCP 36.6% 34.1% 31.9% 31.5%BBVA 22.1% 22.4% 24.5% 25.4%BWS 15.5% 15.4% 15.0% 14.7%Interbank 7.4% 8.4% 8.6% 8.4%Citibank 2.8% 2.6% 2.6% 2.6%Otros 15.6% 17.2% 17.3% 17.5%
Source: BCP, SBS Source: BCP, SBS
12
Agenda
Peruvian Economy
Credicorp Ltd.
Peruvian Financial System
Credicorp’s main subsidiaries - BCP Consolidated
- Banco de Credito de Bolivia
- Atlantic Security Holding
- Pacifico Peruano Suiza
- Prima AFP
Credicorp’s earnings contributions
Overview
13
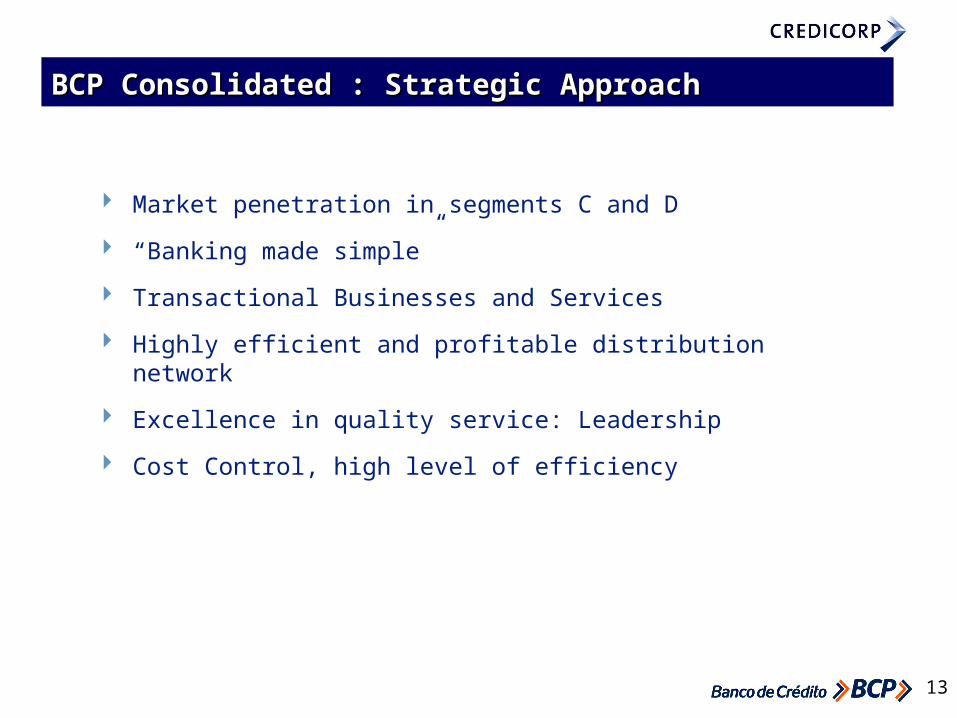
BCP Consolidated : Strategic ApproachBCP Consolidated : Strategic Approach
Market penetration in segments C and D
“Banking made simple”
Transactional Businesses and Services
Highly efficient and profitable distribution network
Excellence in quality service: Leadership
Cost Control, high level of efficiency
14
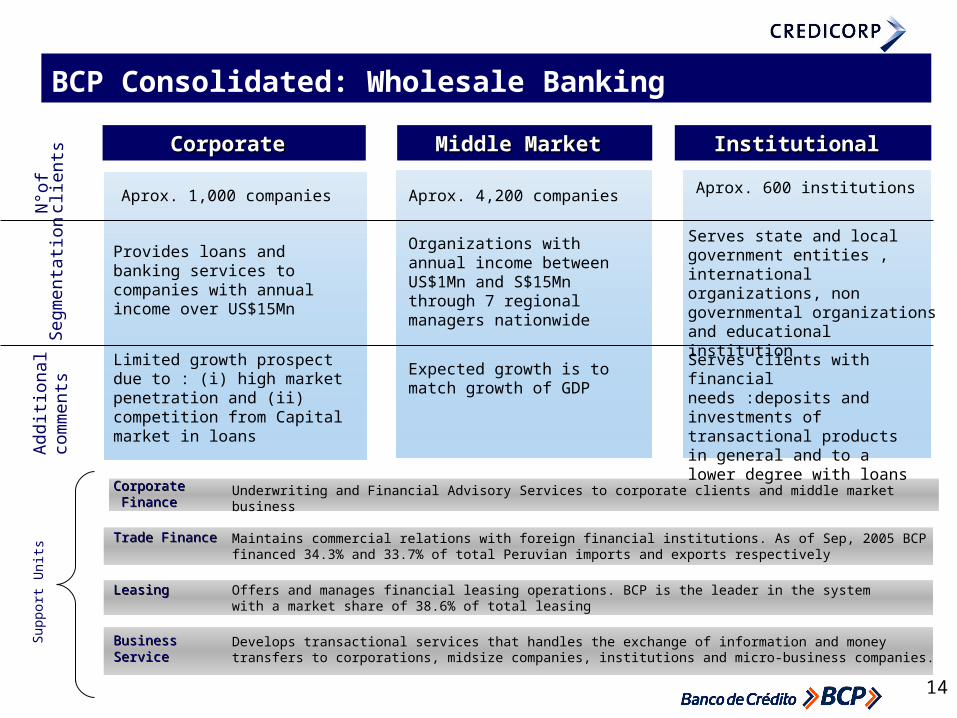
CorporateCorporate Middle Market Middle Market InstitutionalInstitutional
N°o
f cl
ients
Seg
menta
tion
Aprox. 1,000 companies Aprox. 4,200 companies Aprox. 600 institutions
CorporateCorporate Finance Finance
Trade FinanceTrade Finance
LeasingLeasing
Business Business ServiceService
Underwriting and Financial Advisory Services to corporate clients and middle market business
Maintains commercial relations with foreign financial institutions. As of Sep, 2005 BCP financed 34.3% and 33.7% of total Peruvian imports and exports respectively
Offers and manages financial leasing operations. BCP is the leader in the system with a market share of 38.6% of total leasing
Develops transactional services that handles the exchange of information and money transfers to corporations, midsize companies, institutions and micro-business companies.
Provides loans and banking services to companies with annual income over US$15Mn
Organizations with annual income between US$1Mn and S$15Mn through 7 regional managers nationwide
Serves state and local government entities , international organizations, non governmental organizations and educational institution
Limited growth prospect due to : (i) high market penetration and (ii) competition from Capital market in loans
Ad
dit
i onal
com
ments Expected growth is to
match growth of GDP
Serves clients with financial needs :deposits and investments of transactional products in general and to a lower degree with loans
Su
pp
ort
Un
its
BCP Consolidated: Wholesale Banking

15
2000
2500
3000
3500
4000
4500
5000
5500
6000
Mar-03 Jun-03 Set-03 Dec-03 Mar-04 Jun-04 Sep-04 Dic-04 Mar-05 Jun-05 Ago-05
Syst
em L
oan
s (U
S$M
n)
40%
41%
42%
43%
44%
45%
46%
47%
48%
49%
50%
Mar
ket Sh
are
System Loans (US$Mn) Market share
Wholesale Banking Sep-03 Dec-03 Mar-04 Jun-04 Sep-04 Dec-04 Mar-05 Jun-05 Ago-05
Market Share 43.2% 43.5% 43.5% 43.1% 43.4% 42.4% 43.3% 42.3% 45.0%
System Loans 5,274 5,246 5,076 5,515 5,322 5,350 5,684 6,051 5,352
BCP Loans 2,276 2,280 2,208 2,378 2,312 2,269 2,461 2,559 2,406
BCP Consolidated: Market Share Wholesale Banking

16
Consumer Consumer Exclusive Exclusive Small Small Business Business
Micro-Micro-Business Business
N°o
f c
lients
1,653,481 households 54,132 households 8,149 clients 139,004 clients
Segm
enta
tio
n
Offers traditional products to the mass consumer segment
Profitable segment. Generates high volume of business. Segment:US$10 thousand in loans and US$20 thousand in deposits
Serves small and middle market business with annual sales less than US$1Mn
Serves small and micro-business, mostly personal and family businesses, which are offered standard and simple products
CMR / 16.6% Interbank / 13.5% Fincor / 10.3% BBVA / 30.1%BWS / 8.2%Interbank / 6.2%BBVA / 18.5%BWS / 14.5%Interbank / 11.4%Del Trabajo / 10.6%Mi Banco / 11.4%BWS / 5.3%BBVA / 23.2%BWS / 10.3%Interfondos / 15.6%
990Mutual Funds 7.7% 50.7%8.6%
Pyme 210 47.9% 19.8%30.4%
Mortgages 575 21.3%
Mi Vivienda 132 85.9%
% Growth Sep 05 / Sep 04
Loan Vol US$MnProduct
Market share
% Growth Sep 05/Dec
04
Credit Cards 271 19.9% 26.1%9.3%
17.8%
52.1%
Competitors / Mkt shr.
44.1%
27.0%
BCP Consolidated: Retail Banking
Figures as of Sep 2005
17
(In thousands) Monthly Average 2002
Monthly Average 2003
Monthly Average 2004
Monthly Average Sep
2005 CAGR (%)
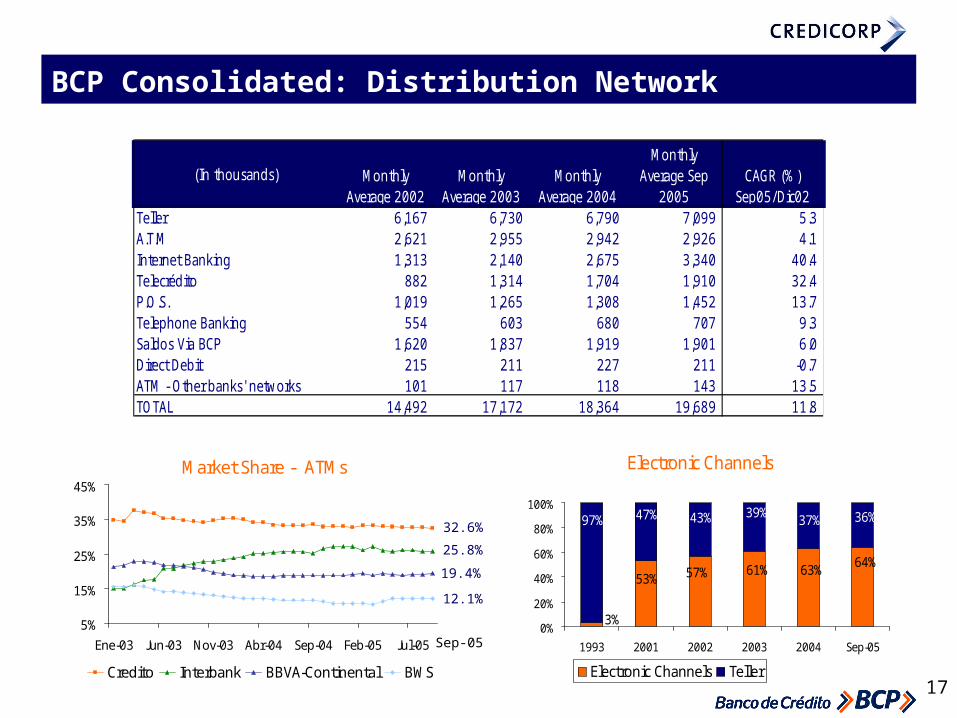
Sep05/Dic02Teller 6,167 6,730 6,790 7,099 5.3 A.T.M 2,621 2,955 2,942 2,926 4.1 Internet Banking 1,313 2,140 2,675 3,340 40.4 Telecrédito 882 1,314 1,704 1,910 32.4 P.O.S. 1,019 1,265 1,308 1,452 13.7 Telephone Banking 554 603 680 707 9.3 Saldos Via BCP 1,620 1,837 1,919 1,901 6.0 Direct Debit 215 211 227 211 -0.7 ATM - Other banks' networks 101 117 118 143 13.5 TOTAL 14,492 17,172 18,364 19,689 11.8
Electronic Channels
64%63%61%57%53%
3%
36%37%97% 47% 43% 39%
0%
20%
40%
60%
80%
100%
1993 2001 2002 2003 2004 Sep-05
Electronic Channels Teller
Market Share - ATMs
5%
15%
25%
35%
45%
Ene-03 Jun-03 Nov-03 Abr-04 Sep-04 Feb-05 Jul-05
Credito Interbank BBVA-Continental BWS
BCP Consolidated: Distribution Network
32.6%
25.8%
19.4%
12.1%
Sep-05
18
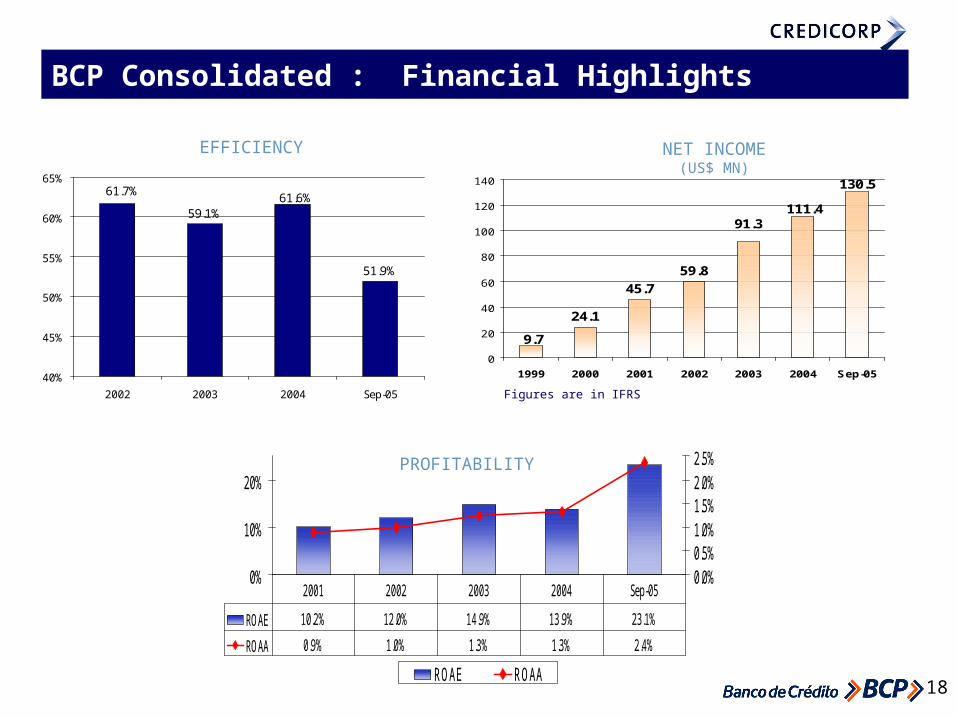
0%
10%
20%
0.0%0.5%1.0%1.5%2.0%2.5%
ROAE ROAA
ROAE 10.2% 12.0% 14.9% 13.9% 23.1%
ROAA 0.9% 1.0% 1.3% 1.3% 2.4%
2001 2002 2003 2004 Sep-05
PROFITABILITY
59.1%
51.9%
61.7% 61.6%
40%
45%
50%
55%
60%
65%
2002 2003 2004 Sep-05
EFFICIENCY
24.1
59.8
9.7
45.7
91.3111.4
130.5
0
20
40
60
80
100
120
140
1999 2000 2001 2002 2003 2004 Sep-05
Figures are in IFRS
NET INCOME(US$ MN)
BCP Consolidated : Financial Highlights

19
Past due Ratio (%) Coverage Ratio (%)
BCP Consolidated : Loan portfolio quality
7.0%
10.0%
13.6%
15.3%17.3%
18.9%
0%
3%
6%
9%
12%
15%
18%
21%
2000 2001 2002 2003 2004 Sep-05
BCP Consolidated
Substandard loans (C+D+E) /Total RiskRatio (%)
8.6
6.1
3.72.6
9.1 8.8
2.7
3.7
5.8
7.6
9.09.8
2000 2001 2002 2003 2004 Sep-05
BCP consolidated
Peruvian BankingSystem
94105 109
125
160
175
133
205
177
141
119
104
2000 2001 2002 2003 2004 Sep-05

20
CTS9%
Demand33%
Time32%
Savings26%
US$ 6,169 Mn
Deposits Loans
Retail36%
Consumer4%
Small Business 10%
Middle Mkt25%
Corporate39%
Credit cards4%
Mortgages18%
US$ 4,479 Mn
Figures as of Sept 2005
BCP Consolidated: Deposits and Loans Structure

21
BCP Peru Dec 02 Dec 03 Dec 04 Sep. 05 % CAGR % Growth
Sep05/Dec02 Sep05/Sep04
Commercial 3,497 2,914 2,762 2,907 -6.5 2.1
Credit cards/Cons. 194 243 271 320 20.0 25.5
Mortgages 347 494 575 707 29.5 29.7
Micro-Businesses 103 141 170 210 29.6 47.9
Total * 4,141 3,792 3,777 4,144 0.0 9.4
BCB 313 310 321 335 2.5 10.9
Total BCP Consol. 4,454 4,102 4,098 4,479 0.2 9.5
US$ Millions
* Acquisition of BSCH’s loan portfolio US$719 Mn, in Dic 2002. Acquisition of Bank Boston’s loan portfolio US$353 Mn, in January and February 2005.
BCP Consolidated: Loans by segment
22
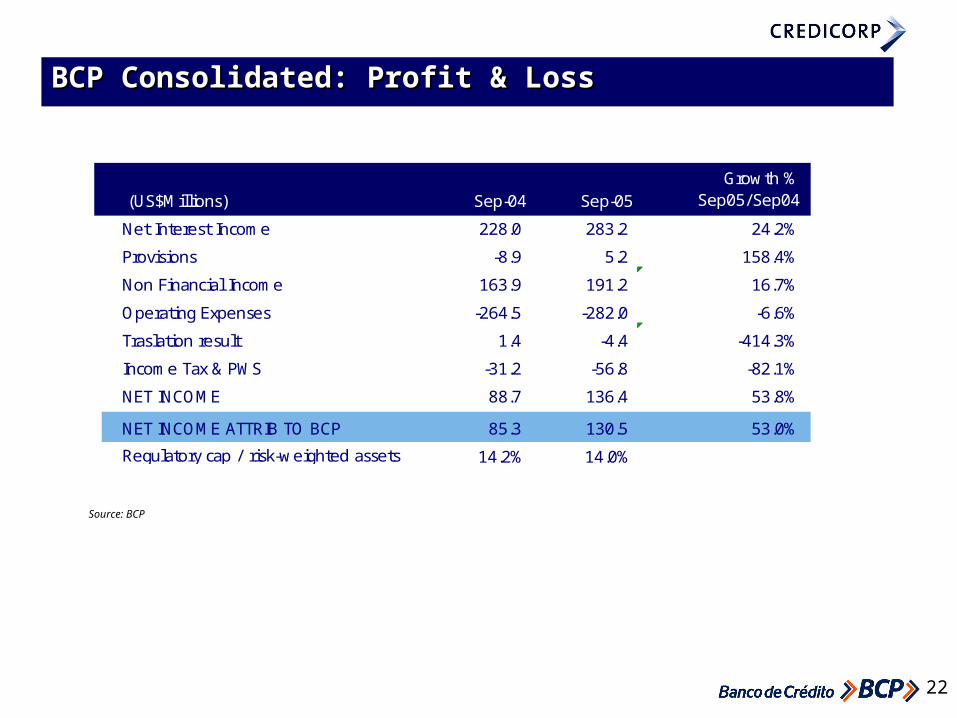
BCP Consolidated: Profit & LossBCP Consolidated: Profit & Loss
(US$Millions) Sep-04 Sep-05Growth %
Sep05/Sep04
Net Interest Income 228.0 283.2 24.2%
Provisions -8.9 5.2 158.4%
Non Financial Income 163.9 191.2 16.7%
Operating Expenses -264.5 -282.0 -6.6%
Traslation result 1.4 -4.4 -414.3%
Income Tax & PWS -31.2 -56.8 -82.1%
NET INCOME 88.7 136.4 53.8%
NET INCOME ATTRIB TO BCP 85.3 130.5 53.0%
Regulatory cap / risk-weighted assets 14.2% 14.0%
Source: BCP
23
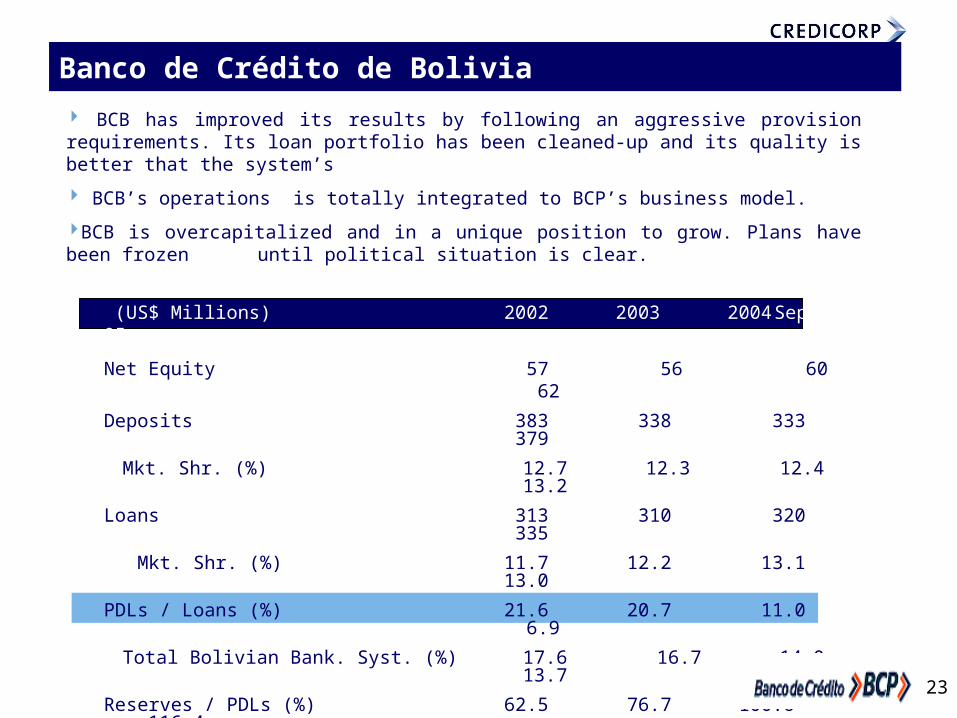
(US$ Millions) 2002 2003 2004 Sep 05
Net Equity 57 56 60 62
Deposits 383 338 333 379
Mkt. Shr. (%) 12.7 12.3 12.4 13.2
Loans 313 310 320 335
Mkt. Shr. (%) 11.7 12.2 13.1 13.0
PDLs / Loans (%) 21.6 20.7 11.0 6.9
Total Bolivian Bank. Syst. (%) 17.6 16.7 14.0 13.7
Reserves / PDLs (%) 62.5 76.7 100.6 116.4
Total Bolivian Banking Syst. (%) 63.7 74.0 84.3 74.7
Net Income 0.0 1.5 4.8 6.5
ROE 0.0% 2.7% 8.4% 14.2%
BCB has improved its results by following an aggressive provision requirements. Its loan portfolio has been cleaned-up and its quality is better that the system’s
BCB’s operations is totally integrated to BCP’s business model.
BCB is overcapitalized and in a unique position to grow. Plans have been frozen until political situation is clear.
BoliviaBanco de Crédito de Bolivia
24
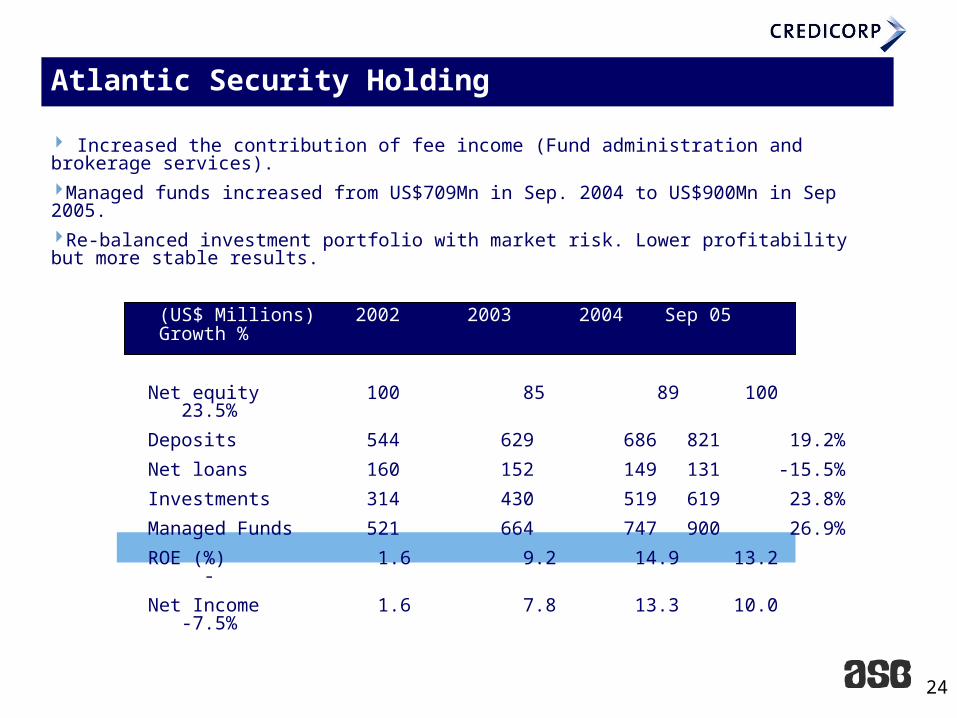
Atlantic Security Holding
(US$ Millions) 2002 2003 2004 Sep 05 Growth %
Sep05/Sep04
Net equity 100 85 89 100 23.5%
Deposits 544 629 686 821 19.2%
Net loans 160 152 149 131 -15.5%
Investments 314 430 519 619 23.8%
Managed Funds 521 664 747 900 26.9%
ROE (%) 1.6 9.2 14.9 13.2 -
Net Income 1.6 7.8 13.3 10.0 -7.5%
Increased the contribution of fee income (Fund administration and brokerage services). Managed funds increased from US$709Mn in Sep. 2004 to US$900Mn in Sep 2005. Re-balanced investment portfolio with market risk. Lower profitability but more stable results.
25
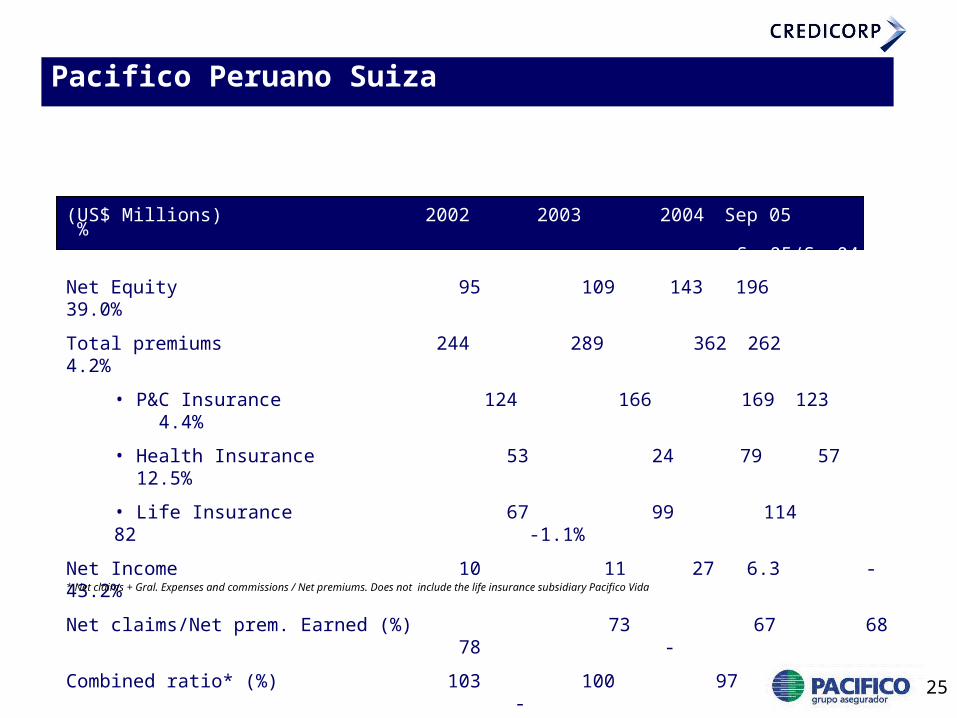
(US$ Millions) 2002 2003 2004 Sep 05 %Sep05/Sep04
Net Equity 95 109 143 196 39.0%
Total premiums 244 289 362 262 4.2%
• P&C Insurance 124 166 169 123 4.4%
• Health Insurance 53 24 79 57 12.5%
• Life Insurance 67 99 114 82 -1.1%
Net Income 10 11 27 6.3 -43.2%
Net claims/Net prem. Earned (%) 73 67 68 78 -
Combined ratio* (%) 103 100 97 102 -
* Net claims + Gral. Expenses and commissions / Net premiums. Does not include the life insurance subsidiary Pacifico Vida
Pacifico Peruano Suiza
26
Higher casualties in the marine hull business during the year. P&C premiums, which represent 47% of total premiums, increased 4.4% from Sept 2004 to
Sept 2005, mainly due to an increase in all of its segments with the exception of premiums in the fire insurance line, which fell 7%.
The annuities line of business is under competitive disadvantage versus other domestic players due to: 1. Our usage of more conservative mortality rate tables than those established by the local
regulators 2. A more conservative fixed income investment policy (minimum rating A).
The health insurance company registered a US$1.5 million provision for reserves during the year as a consequence of recalculating those reserves according to IFRS actuarial practices.
Pacifico Peruano Suiza
27
• Prima AFP has generated higher competition in the Private Pension Fund System.
• Prima’s strategy to introduce low commission rates is based on a low cost and efficient operating structure.
• Its commission rate is 1.5% of workers salary, which is 33% lower than the average commission of the system.
• It started operating in the most relevant cities across the country. Arequipa, Chiclayo, Trujillo and Piura.
• Average net income expected for each year is between US$6 million and US$8 million.
• It is expected to generate US$10 million loss during the year and reach break even in first half of 2007.
• Results reached US$3.5 million loss as of Sep 2005
• The start up capital contributed to Prima is of US$15 million and is expected to
increase by additional US$ 15 million by the end of the year.
Prima AFP
28
Agenda
Peruvian Economy
Credicorp Ltd.
Peruvian Financial System
Credicorp’s main subsidiaries
Credicorp’s earnings contributions
Overview
29
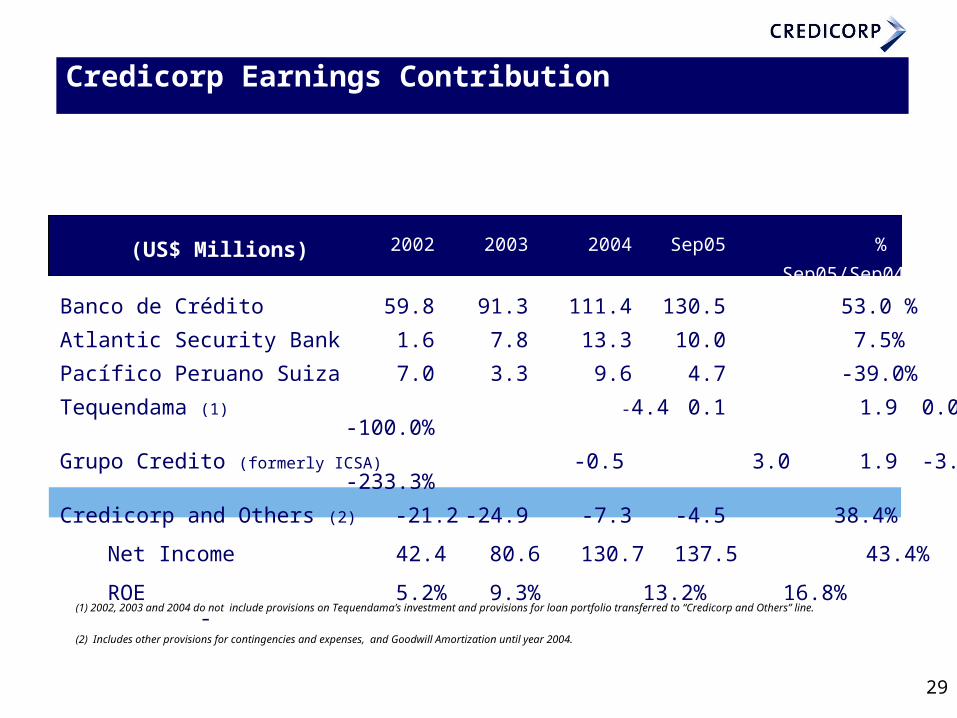
2002 2003 2004 Sep05 %
Sep05/Sep04
Banco de Crédito 59.8 91.3 111.4 130.5 53.0 %
Atlantic Security Bank 1.6 7.8 13.3 10.0 7.5%
Pacífico Peruano Suiza 7.0 3.3 9.6 4.7 -39.0%
Tequendama (1) -4.4 0.1 1.9 0.0 -100.0%
Grupo Credito (formerly ICSA) -0.5 3.0 1.9 -3.1 -233.3%
Credicorp and Others (2) -21.2 -24.9 -7.3 -4.5 38.4%
Net Income 42.4 80.6 130.7 137.5 43.4%
ROE 5.2% 9.3% 13.2% 16.8% -
(US$ Millions)
(1) 2002, 2003 and 2004 do not include provisions on Tequendama’s investment and provisions for loan portfolio transferred to “Credicorp and Others” line.
(2) Includes other provisions for contingencies and expenses, and Goodwill Amortization until year 2004.
Credicorp Earnings Contribution
30
Agenda
Peruvian Economy
Credicorp Ltd.
Peruvian Financial System
Credicorp’s main subsidiaries
Credicorp’s earnings contributions
Overview

31
Credicorp’s results are ahead of our expectations:
Positive trends in banking subsidiaries.
Lower provisioning requirements for BCP’s loan portfolio, higher net interest income and growth of fee income.
Rigid operating cost control in BCP
ASH will continue to concentrate on increasing its fee income related to its wealth management business and maintaining a lower risk profile in its proprietary investment.. Atlantic’s ROE is 13%
BCB’s has improved its results due to lower provisioning requirements PDL and Coverage ratios are better than the system’s. BCB’s ROE reached 14% during the first nine months of the year compared to 6% reached in the same period a year ago.
PPS had a negative impact in the marine hull business due to higher casualties during the first two quarters of the year. Consolidated total premiums increased during the first nine months of the year mainly in P&C business and Health insurance segment.
Prima AFP started its operations in August. With a low cost strategy, the company offers to its customers competitive rates with value added services. Prima’s commission rate is 33% lower than the average of the system. Prima AFP will generate US$10 million loss during the year. Break even will be reached at first half of 2007.
Overview

32
Safe Harbor for forward-looking statements
This material includes “forward-looking statements” within the meaning of Section 21E of the Securities Exchange Act of 1934. All statement other than statements of historical information provided herein are forward-looking and may contain information about financial results, economic conditions, trends and known uncertainties.
The Company cautions readers that actual results could differ materially from those expected by the Company, depending on the outcome of certain factors, including, without limitation: (1) adverse changes in the Peruvian economy with respect to the rates of inflation, economic growth, currency devaluation, and other factors, (2) adverse changes in the Peruvian political situation, including, without limitation, the reversal of market-oriented reforms and economic recovery measures, or the failure of such measures and reforms to achieve their goals, and (3) adverse changes in the markets in which the Company operates, including increased competition, decreased demand for financial services, and other factors. Readers are cautioned not to place undue reliance on these forward-looking statements, which speak only as of the date hereof.
The Company undertakes no obligation to release publicly the result of any revisions to these forward-looking statements which may be made to reflect events or circumstances after the date hereof, including, without limitation, changes in the Company’s business strategy or planned capital expenditures, or to reflect the occurrence of unanticipated events.

33
CREDICORP
November, 2005


