1 Factors influencing the dynamics of excessive algal blooms Richard F. Ambrose Environmental Science and Engineering Program Department of Environmental Health Sciences, School of Public Health Center For Embedded Networked Sensing Public Health and Water Quality Robert Gilbert, Ph.D. student – Environmental Health Sciences Gerald Kim, Yeung Lam, undergraduate students - Electrical Engineering Victor Chen, Michael Stealey, M.S. students - Electrical Engineering Brett Jordan, undergraduate student - Mechanical Engineering
Transcript
1
Factors influencing the dynamics of excessive algal blooms
Richard F. AmbroseEnvironmental Science and Engineering Program
Department of Environmental Health Sciences, School of Public Health
Center For Embedded Networked Sensing
Public Health and Water Quality
Robert Gilbert, Ph.D. student – Environmental Health Sciences Gerald Kim, Yeung Lam, undergraduate students - Electrical Engineering
Victor Chen, Michael Stealey, M.S. students - Electrical EngineeringBrett Jordan, undergraduate student - Mechanical Engineering
2
Excessive algal blooms
• “Nuisance” algal blooms impair the “beneficial uses” of streams and rivers
• Urban runoff is rich in nutrients that can lead to algal blooms, but many factors are involved– Nutrients, light, substrate,
water flow
• Complex interaction among factors means uncertainty about how and why algal blooms form– Especially important in
REGULATORY context
Malibu Creek, July 2005
Los Angeles Regional Water Quality Control Board is proposing a Total Maximum Daily Load (TMDL) limit of 1.0 mg/L for nitrate. The major discharger is arguing that this limit is excessively strict and may not solve the problem with nuisance algae, and will be extremely expensive to meet.
3
Hypotheses and Questions
• Do weather, urban runoff, and biological activity affect nutrient levels in streams temporally and spatially?
• Do these dynamics affect algal conditions? • Where and when are the appropriate times to
sample nutrients and other water parameters in these systems?
We are using NIMS to sample much more intensely in space and time than is possible with conventional sampling, providing a high resolution description of the dynamics of this complex system.
4
Sample site NIMS-RD site
N
Sampling locations in Malibu Creek Watershed
5
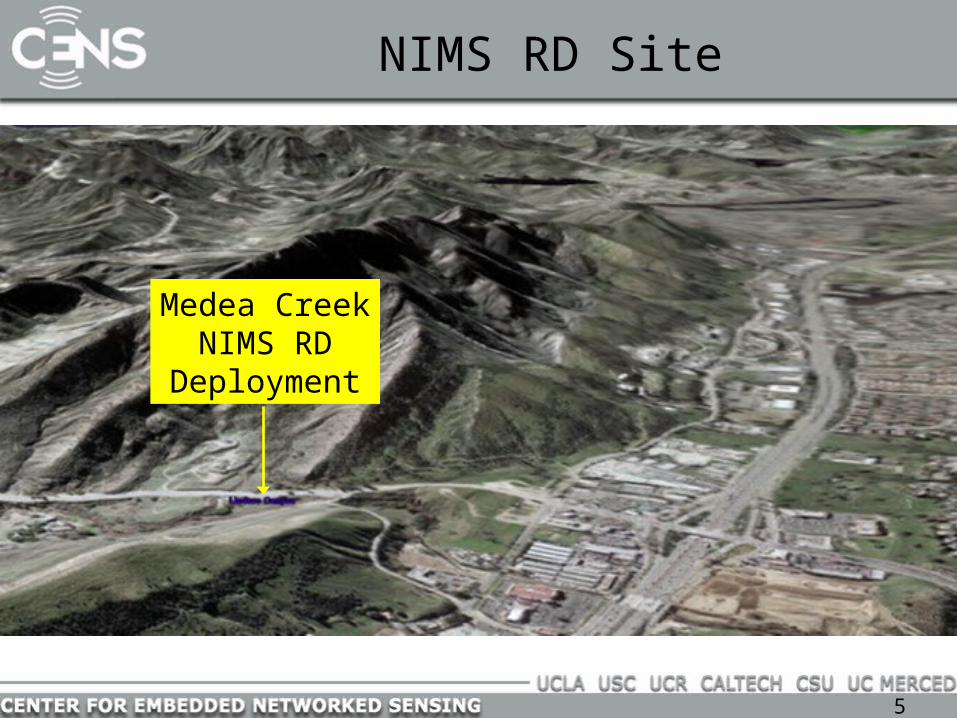
NIMS RD Site
Medea CreekNIMS RD
Deployment
6
NIMS RDRapidly Deployable Class
7
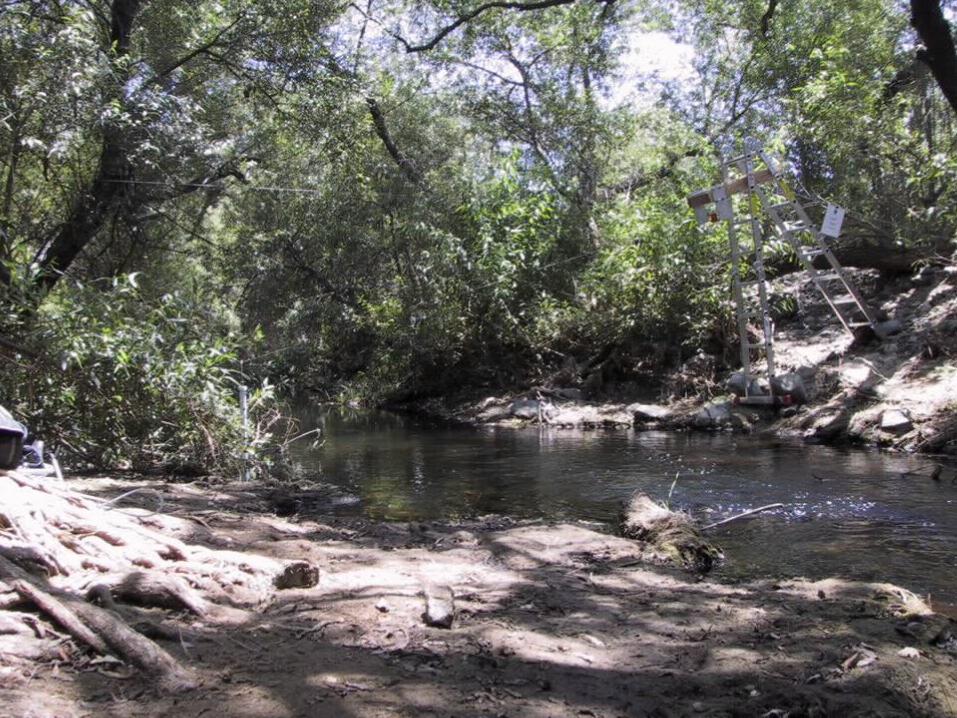
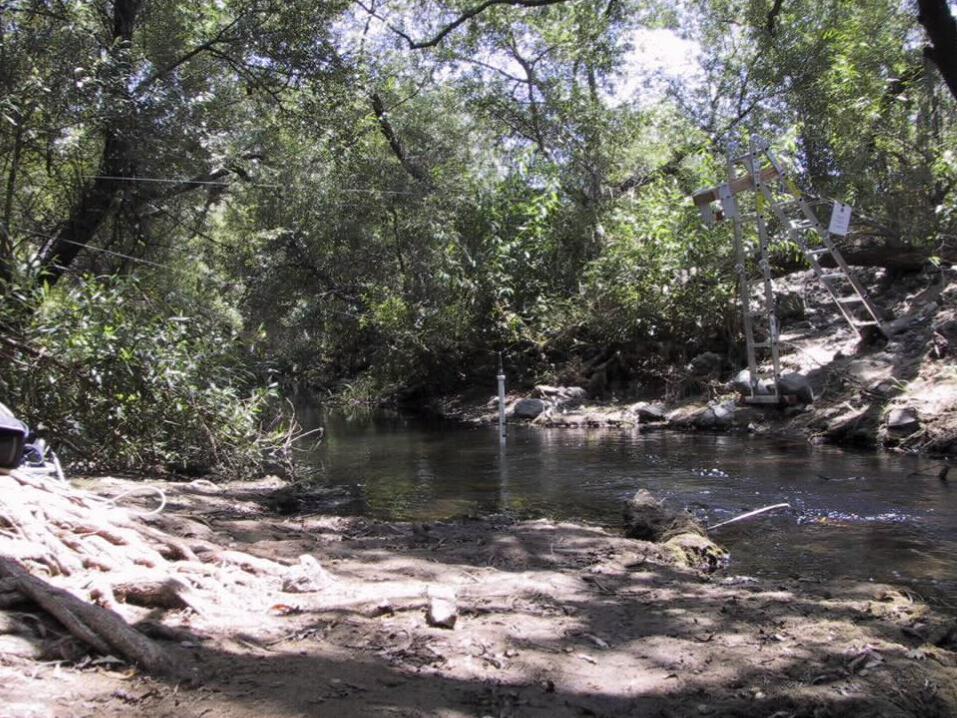
NIMS RD at Medea Creek field site
TemperaturepHConductivityNitrateAmmonium
8
Medea Creek NIMS RD sampling path
Sample cycle: 16 minutes
9
10
11
12
13
14
15
16
17
18
19
20
21
22
23
24
25
Spatial distribution within the stream
26
Changes at water surface over time
Nitrate
Conductivity
Ammonium
Temperature
27
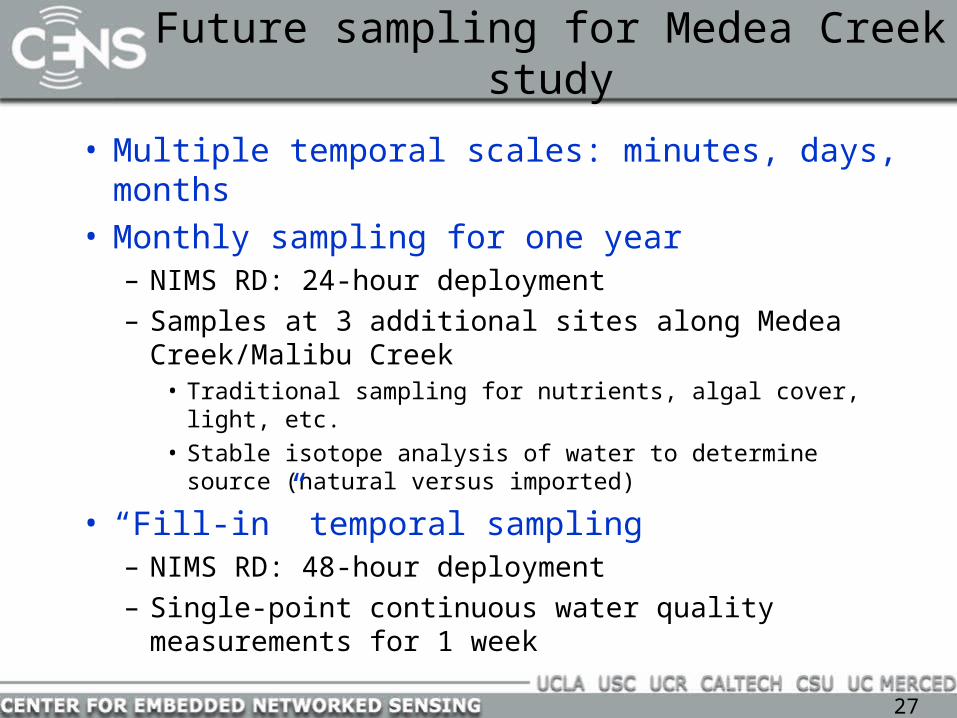
Future sampling for Medea Creek study
• Multiple temporal scales: minutes, days, months• Monthly sampling for one year
– NIMS RD: 24-hour deployment– Samples at 3 additional sites along Medea
Creek/Malibu Creek• Traditional sampling for nutrients, algal cover, light, etc.• Stable isotope analysis of water to determine source
• Laboratory experiments to evaluate dynamics under controlled conditions– Experimental streams
• Nutrient additions, varying amounts and schedule of delivery
• Different algal species
– NIMS 3D
• Field deployment of NIMS 3D
33
Conclusions
• NIMS RD provides an efficient platform for temporally and spatially intensive measurements of water quality
• Initial results are already providing insight into the dynamic nature of water quality parameters, as well as raising new hypotheses to explore– Small scale variation– Temporal trends