Seismic Hazard for the Burlington and Colchester, Vermont USGS 7-1/2 Minute Quadrangles June 5, 2013 By John E. Lens 1 , Mandar M. Dewoolkar 1 , George E. Springton 2 , and Laurence R. Becker 3 1. School of Engineering, University of Vermont 2. Norwich University, 3. Vermont Geological Survey Vermont Geological Survey Open File Report VG13-3 Objectives The objectives of the study are to describe and delineate the earthquake related hazard potential within the Burlington and Colchester, Vermont 7.5 minute United States Geological Survey (USGS) quadrangles using regional maps. This June 5, 2013 final report is an update of a December 16, 2011 report and hazard mapping effort. New shear wave velocity data obtained after December 16, 2011 are considered to evaluate if site classifications as originally reported are supported with the new data, and to make corresponding changes to the original report and map where warranted. The map accompanying this report, entitled “Seismic Site Classification for Amplification Potential, Burlington and Colchester 7.5 Minute Quadrangles, 2013”, depicts the seismic site classification for amplification potential at a regional scale. Subsurface conditions can vary abruptly and borings and/or other characterization techniques are required to estimate site classification at any specific location. This map is not to be used in place of proper site-specific engineering evaluation with appropriate subsurface explorations and testing which are performed under the direction of a qualified engineering professional in accordance with accepted standards of practice. Background Northwestern Vermont is an area of greater earthquake hazard potential relative to elsewhere in Vermont and the northeast United States based on probabilistic seismic hazard analysis performed by the USGS. The USGS Open File Report 2008-1128 entitled Documentation for the 2008 Update of the United States National Seismic Hazard Map (Petersen, et al., 2008), presents a probabilistic evaluation of the seismic ground shaking potential, including descriptions of the predictive modeling used to estimate the earthquake shaking motions. These motions correspond to an earthquake with a return period of about 2,500 years. This return period is specified in the National Earthquake Hazard Reduction Program (NEHRP, 2003) Recommended Provisions for Seismic Regulations for New Buildings and Other Structures, FEMA 450- 1/2003 Edition, Part 1. It is also in the current State Building Code for structural design and follows the current national practice as set forth in the International Building Code (IBC, 2012). The probable intensity of ground shaking in northwestern Vermont is less than that in more recognized seismic hazard risk areas of the United States but it has the fifth highest probable intensity in the continental Page | 1
Transcript
Seismic Hazard for the Burlington and Colchester, Vermont USGS 7-1/2 Minute Quadrangles
June 5, 2013
By
John E. Lens1, Mandar M. Dewoolkar1, George E. Springton2, and Laurence R. Becker3
1. School of Engineering, University of Vermont 2. Norwich University, 3. Vermont Geological Survey
Vermont Geological Survey Open File Report VG13-3
Objectives
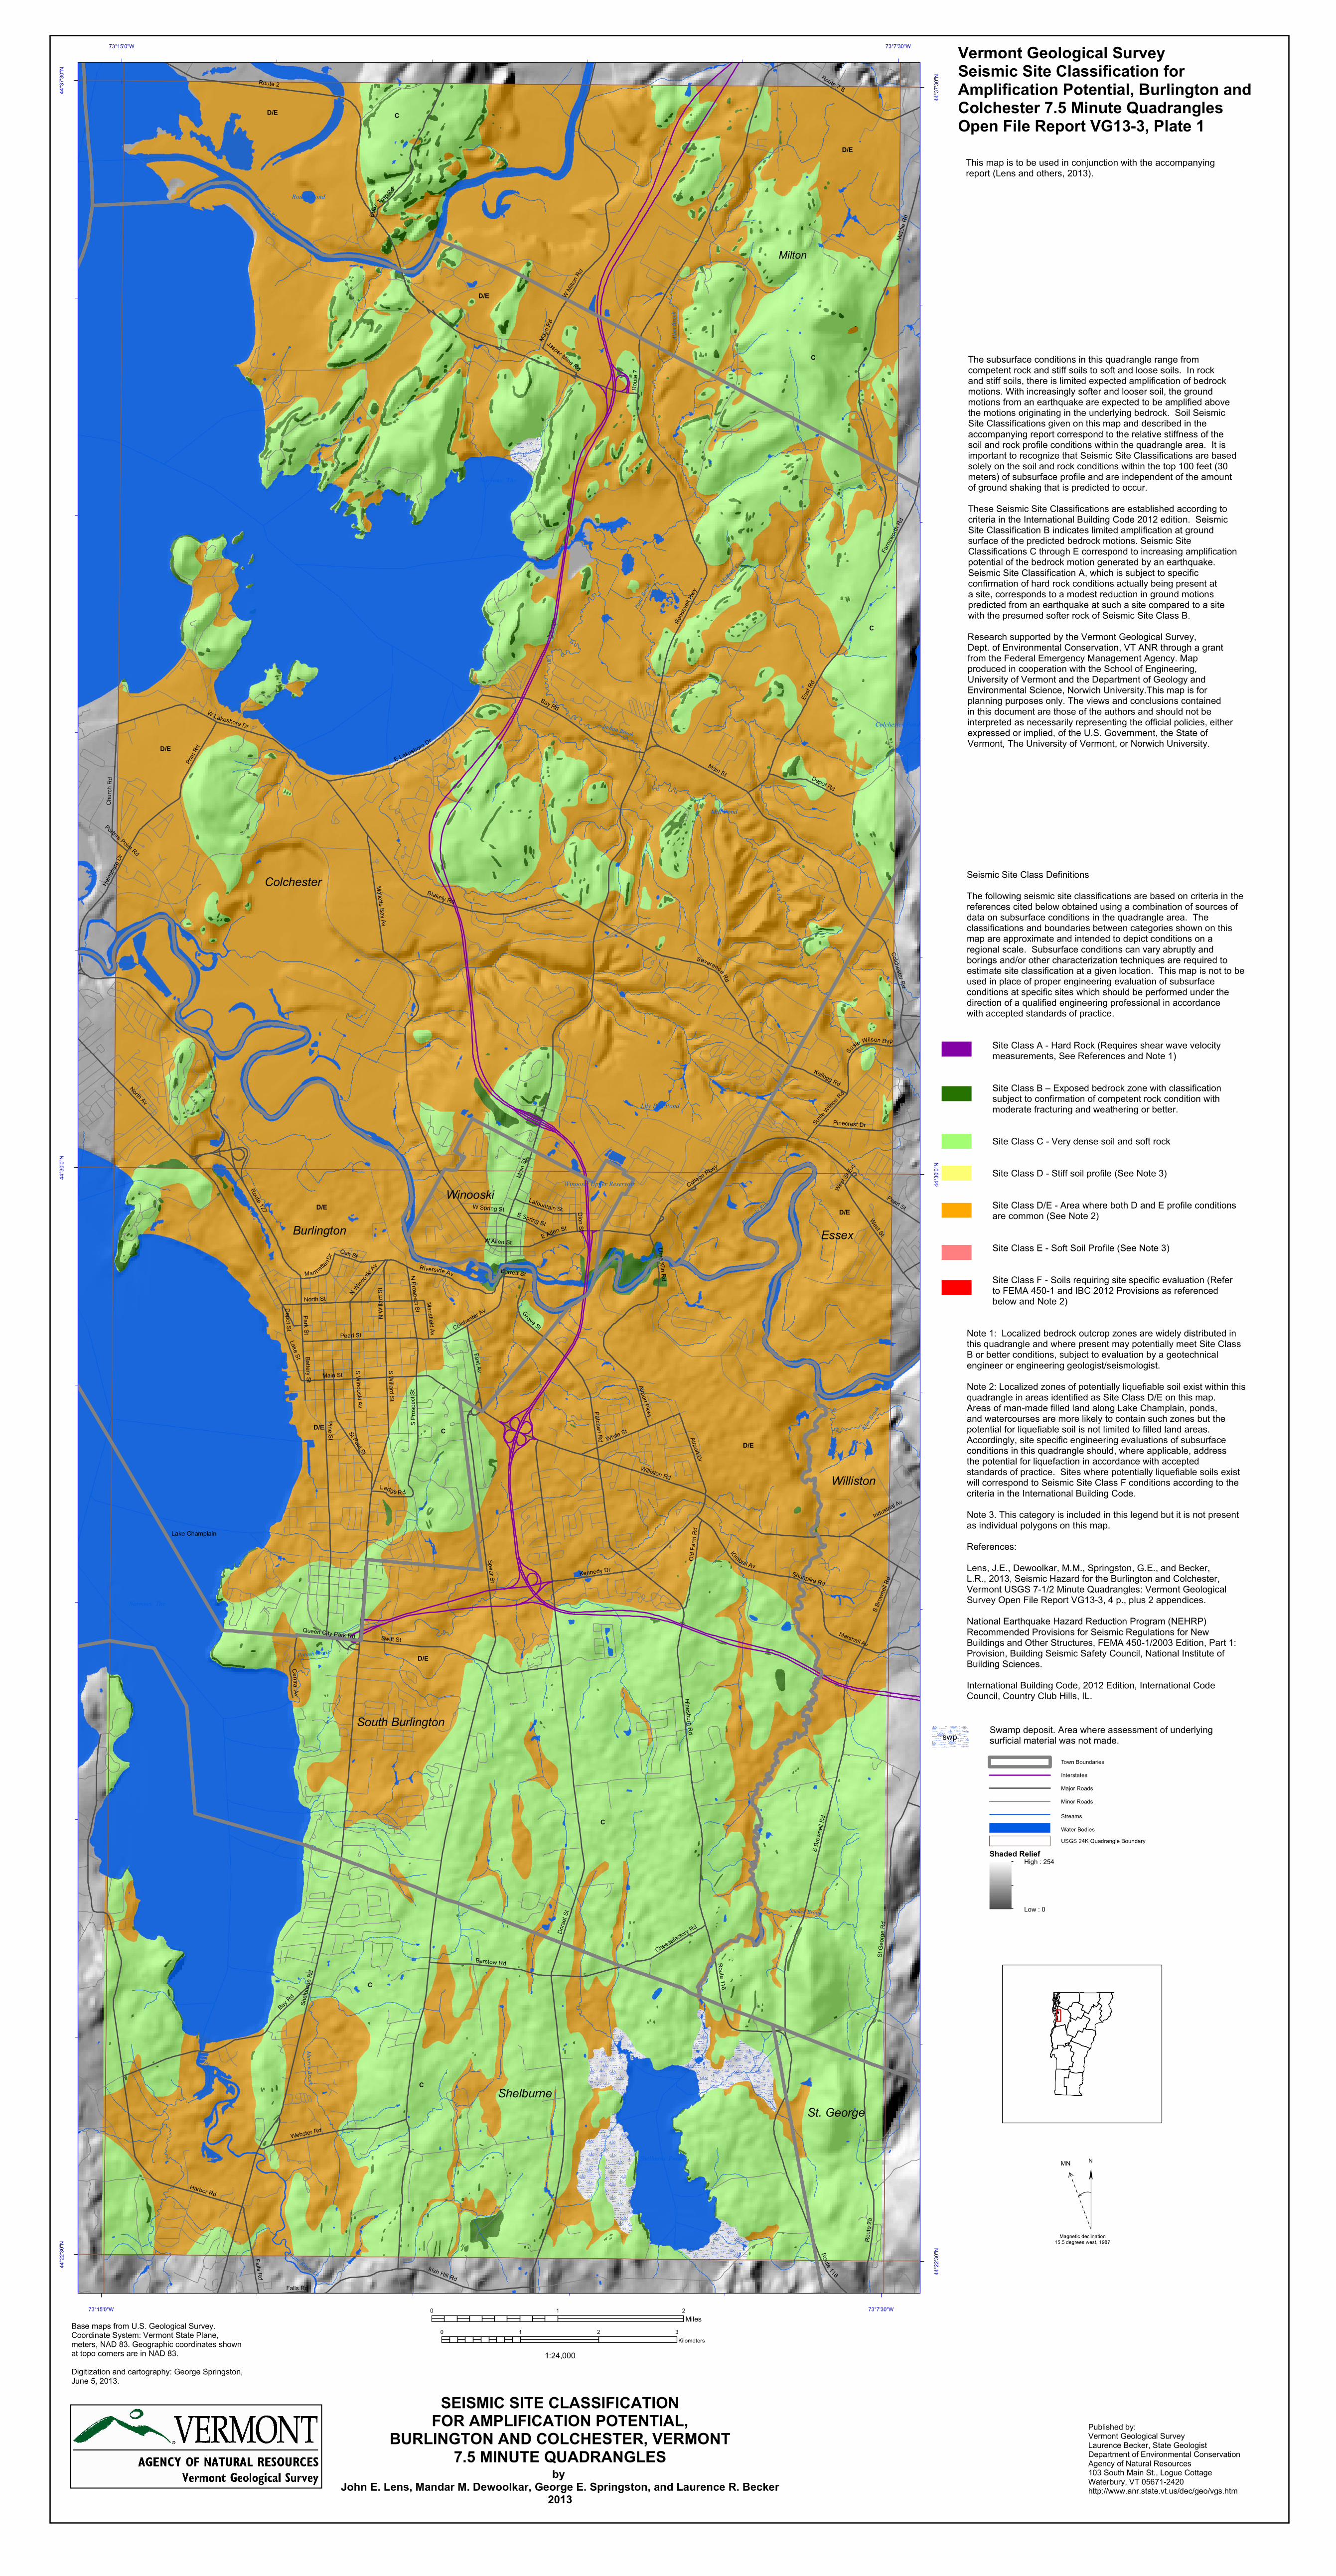
The objectives of the study are to describe and delineate the earthquake related hazard potential within the Burlington and Colchester, Vermont 7.5 minute United States Geological Survey (USGS) quadrangles using regional maps. This June 5, 2013 final report is an update of a December 16, 2011 report and hazard mapping effort. New shear wave velocity data obtained after December 16, 2011 are considered to evaluate if site classifications as originally reported are supported with the new data, and to make corresponding changes to the original report and map where warranted. The map accompanying this report, entitled “Seismic Site Classification for Amplification Potential, Burlington and Colchester 7.5 Minute Quadrangles, 2013”, depicts the seismic site classification for amplification potential at a regional scale. Subsurface conditions can vary abruptly and borings and/or other characterization techniques are required to estimate site classification at any specific location. This map is not to be used in place of proper site-specific engineering evaluation with appropriate subsurface explorations and testing which are performed under the direction of a qualified engineering professional in accordance with accepted standards of practice. Background Northwestern Vermont is an area of greater earthquake hazard potential relative to elsewhere in Vermont and the northeast United States based on probabilistic seismic hazard analysis performed by the USGS. The USGS Open File Report 2008-1128 entitled Documentation for the 2008 Update of the United States National Seismic Hazard Map (Petersen, et al., 2008), presents a probabilistic evaluation of the seismic ground shaking potential, including descriptions of the predictive modeling used to estimate the earthquake shaking motions. These motions correspond to an earthquake with a return period of about 2,500 years. This return period is specified in the National Earthquake Hazard Reduction Program (NEHRP, 2003) Recommended Provisions for Seismic Regulations for New Buildings and Other Structures, FEMA 450-1/2003 Edition, Part 1. It is also in the current State Building Code for structural design and follows the current national practice as set forth in the International Building Code (IBC, 2012). The probable intensity of ground shaking in northwestern Vermont is less than that in more recognized seismic hazard risk areas of the United States but it has the fifth highest probable intensity in the continental
Page | 1
United States. The seismic ground shaking risk is expected to be greater in four regions of the continental United States, namely the West Coast states, eastern Utah and Western Wyoming, the New Madrid, Missouri and Charleston, South Carolina locale (Petersen, et al., 2008). The earthquake shaking hazard in northwestern Vermont derives from its proximity to areas of significant seismic activity in the northern portion of New York State and the St. Lawrence River valley in Canada. Recognizing the seismic hazard potential in Vermont is important and beneficial because it provides opportunity to take appropriate precautions in terms of preparedness, and the knowledge thereof facilitates proper design of structures and lifeline facilities such as roadways, pipelines, and electrical transmission lines. Seismic Site Classifications This study specifically addresses seismic risks in the Burlington and Colchester Quadrangles. These risks include ground shaking, amplification of bedrock motions within overlying soil profiles, and the potential for soils to liquefy and/or laterally spread in situations where earthquake shaking is intense and long enough to weaken the soils to a liquefied or nearly liquefied condition. The subsurface conditions in this quadrangle range from competent rock and stiff soils to soft and loose soils. In rock and stiff soils, there is limited expected amplification of bedrock motions. With increasingly softer and looser soil, the ground motions from an earthquake are expected to be amplified above the motions originating in the underlying bedrock. Soil Seismic Site Classifications given on the maps and described in this report correspond to the relative stiffness of the soil and rock profile conditions within the quadrangle area. It is important to recognize that Seismic Site Classifications are based solely on the soil and rock conditions within the top 100 feet (30 meters) of subsurface profile and are independent of the amount of ground shaking that is predicted to occur. These Seismic Site Classifications are established according to criteria in the International Building Code 2012 edition. Seismic Site Classification B indicates limited amplification at ground surface of the predicted bedrock motions. Seismic Site Classifications C through E correspond to increasing amplification potential of the bedrock motion generated by an earthquake. Seismic Site Classification A, which is subject to specific confirmation of hard rock conditions actually being present at a site, corresponds to a modest reduction in ground motions predicted from an earthquake at such a site compared to a site with the presumed softer rock of Seismic Site Class B. The seismic site classifications shown on Plate 1 are based on a combination of the following data: (1) Site specific subsurface information which primarily includes soil borings, along with a limited number of seismic cone penetration test (SCPT) soundings, including shear wave velocity measurements at some of the SCPT soundings, and shear wave velocity measurements made by Springston (2011b) on behalf of the Vermont Geological Survey at sites including one location along the Burlington waterfront, and two sites at the University of Vermont campus, and several sites in the Colchester Quadrangle; (2) drilled water well information principally providing depth to bedrock and general overburden soil descriptions in Wright, (1998); bedrock outcrop mapping by Springston (2011a); and (3) the Vermont Geological Survey surficial geology maps by Wright (2009) and Wright, et al., (2009). In addition, further shear wave velocity measurements were made in 2012 by Springston (2013a) at six sites in the Burlington quadrangle and one site at the south end of the Colchester quadrangle. Measurements were
Page | 2
also made in 2013 by Springston (2013b) at an additional site in Colchester. These measurements were made in areas originally designated as Seismic Site Class D/E on Figure 1 (December 16, 2011). These subsequent shear wave velocity measurements averaged over the top 100 feet of soil profile, designated as Vs100, ranged between 710 and 1,190 feet per second, corresponding to a Seismic Site Class D. These results indicate that the Seismic Site Class D/E delineations given in the December 16, 2011 report and associated map remain valid. Soil boring data used for seismic site classification were available from approximately 45 sites in the Burlington Quadrangle and 20 sites in the Colchester quadrangle. Each site contained between 1 and about 20 soil borings, with most sites consisting of 1 to 5 borings. The Burlington quadrangle soil boring data were associated with bridge and building projects ranging from the 1960’s to the present. The equipment, methods, and documentation of drilling and sampling used to obtain this soil boring data varied considerably as a consequence of factors such as changes in the standards of practice over the 50 year time span involved, several firms performing the work, and the specific purposes of the explorations. Engineering judgment was used to apply the data from soil borings to the current criteria for seismic site classification. The sites are geographically distributed in primarily the northern half of that quadrangle. Sites in the southern half of the quadrangle are more limited, corresponding to comparatively less infrastructure and building development than in the northern half, with the sites being scattered along Route 7 and in the Shelburne Village area and no soil boring sites in the southeast corner of the quadrangle. In contrast to the soil borings, water wells were most common in the less developed portions of the quadrangle, where they provided private water supplies. The Colchester quadrangle is overall less developed than the Burlington quadrangle, which is reflected in less available soil boring data. The majority of the soil boring data were from the Circumferential Highway project route within the southern portion of the quadrangle. Shear wave velocity measurements at 8 sites in the center and northern portions of the quadrangle augmented the soil boring data. There is a substantial amount of water well data in this quadrangle, as with the less developed portions of the Burlington quadrangle. The conditions encompassed by the seismic site classifications correspond to the following: Seismic Site Class B conditions correspond to the exposed bedrock which has been mapped within the quadrangles. These include the exposed rock alongside the Winooski River in Winooski, Colchester, Burlington and South Burlington as well as a large number of generally smaller outcrops scattered throughout the quadrangles. These are exposed bedrock zones with their classification remaining subject to confirmation of competent rock conditions meeting the IBC criteria for site class B, which are specifically a rock with no more than moderate fracturing and weathering. The confirmation of Seismic Site Class A conditions requires evaluation by a geotechnical engineer, geologist, or engineering geologist/seismologist. In accordance with the IBC seismic site classifications, zones of hard bedrock can be classified as Seismic Site Class A provided this is supported by shear wave velocity measurements as outlined in the IBC (2012). Seismic Site Class C conditions generally correspond to areas mapped as glacial till in Burlington, Colchester, Milton, South Burlington, Shelburne, St. George, and Williston along with an area in Winooski between the Winooski River and the northern extent of the Burlington quadrangle where surficial soils are mapped as fine, medium and coarse sand and where bedrock is within 5 meters of ground surface based on the water well and boring information from Wright (1998).
Page | 3
Seismic Site Class D/E conditions correspond to the remaining areas. These include areas mapped as medium fine sand in Burlington and South Burlington, a wide variety of sands, gravels and clay in Colchester, artificial fill (i.e., not naturally deposited soil) along the Lake Champlain waterfront and adjacent to the Intervale, and all of the alluvium along the Winooski River. This classification is based on several factors. Within each of these deposits there are soil borings with locally loose and soft soils which meet the site class E conditions, as well relatively firmer soils meeting the site class D conditions. Local variations can be abrupt, with D and E conditions sometimes both present at a site, and sometimes sharp transitions occurring from firmer B and C to D/E conditions. In addition, this site class condition is applied to areas mapped as Champlain Sea “clay” within the uplands areas of South Burlington and Shelburne otherwise mapped as glacial till. There is also a zone north of Appletree Point in Burlington which meets these conditions. This classification applied to the Champlain Sea “clay” deposits within the glacial till uplands is based on multiple sites where soil borings indicated sufficiently thick amounts of soft clay leading to a seismic site classification of E based on a weighted average of standard penetration test (SPT) blow count values per the IBC criteria. In Shelburne, the area along the LaPlatte River which is shown on the surficial geologic map by Wright, et al., (2009) as medium fine sand, alluvium, and Champlain Sea “clay” in Shelburne is also designated as Seismic Site Class D/E. Existing subsurface data indicate relatively thick deposits of soft and loose granular soils transitioning over short distances from the surrounding site class C conditions of glacial till. This seismic site class reflects the variability in site class conditions indicated by the existing subsurface data for the corresponding soil deposits and the observed overall variability in the composition of those deposits. Seismic Site Class F conditions are not explicitly depicted on Plate 1 but this evaluation suggests that there could be areas where subsurface characteristics meet the Site Class F soils definition per the IBC (2012). These include swamp deposits that are greater than 10 feet thick, and areas containing potentially liquefiable soils as well as sensitive clays, peat or organic soils, highly plastic clays and thick deposits of soft to medium stiff clays, as described in the IBC (2012) criteria. There were no definitively Seismic Site Class F conditions evident on a widespread basis in the subsurface data obtained for this study. In scattered locations in the areas designated as Seismic Site Class D/E there were soils with low SPT blow count values which indicated that they could potentially be liquefiable. However, further data would be needed for proper liquefaction analyses, as per Youd, et al., (2001), including laboratory test results on soil fines content and complete explanations of the drilling procedures, which were not available for this study. As discussed in the following section, the potential for Seismic Site Class F conditions at specific sites needs to be considered in engineering studies made for specific individual sites in these quadrangles. Liquefaction Hazard Potential The liquefaction potential of soils in these quadrangles was evaluated using two methods. The first method involved the criteria based on regional geologic mapping described in Youd and Perkins (1978), and which is reiterated in the current Hazus – MH MR5 (2011) user manual, Table 9.1, and as discussed in Holzer, et al. (2011). Second, where some quantitative data on subsurface conditions, typically soil boring logs, were available evaluations were made utilizing analytical methods prescribed by Youd, et al., (2001). The amount of information available for such site specific analytical liquefaction evaluations was limited. The evaluation indicates that liquefaction potential exists in soil deposits except those consisting of dense glacial till and clay. It is clear that site specific liquefaction potential analyses using accepted standards of practice need to be part of the subsurface condition evaluations performed at sites in these quadrangles. In
Page | 4
general, locations with submerged, loose sandy soils are of concern for liquefaction hazard. Areas within these quadrangles which are designated as Seismic Site Class D/E have the most potential for containing zones of liquefaction prone soils and therefore warrant careful evaluation for the presence of this potential hazard. Recommendations The overriding recommendation with the use of the data contained in this report and accompanying map is to recognize that these data are for use at a regional scale. This report and map should not be used in place of proper site-specific seismic evaluation using site-specific subsurface conditions both of which should be performed under the direction of a qualified engineering professional in accordance with accepted standards of practice. Acknowledgements The site specific data used in this evaluation were obtained through cooperative effort from Laurence Becker, James P. Olson, George Springston, Stephen Wright, Christopher Benda, Chad Allen, Drew Gelfenbein, Jason Gaudette, William Waite, Richard Dall, Eric Goddard, Kirsten Merriman-Shapiro, Russell Miller-Johnson, Robert Neeld, David Libby, Steven Roy, James Foster, the Vermont Agency of Transportation, St. Michael’s College, and other numerous local consulting engineering firms and businesses. Field work performed to obtain shear wave velocity measurements was by George Springston of Norwich University and Bradford Berry of the University of Vermont. The study was funded by the Vermont Geological Survey through a grant provided by the Federal Emergency Management Agency. References Hazus -MHMR5 (2011), Multi-hazard Loss Estimation Methodology, Earthquake Model User Manual, Department of Homeland Security, Federal Emergency Management Agency, Washington, D.C. Holzer, T.L., Noce, T.E., and Bennett, M.J., (2011) Liquefaction probability curves for surficial geologic deposits, Environmental and Engineering Geoscience, Vol. XVII, No. 1, February 2011, pp.1-21. International Building Code (2012), International Code Council, Country Club Hills, IL. Lens, J.E., Dewoolkar, M.N., Springston, G., (2013), Report on the Comparison of Shear Wave Velocity Measurements with Multispectral Analysis of Surface Waves (MASW), Microtremor Array Method (MAM), Seismic Cone Penetration Tests (SCPT), and Standard Penetration Tests (SPT) for the Burlington and Colchester, Vermont USGS 7-1/2 Minute Quadrangles, June 5, 2013,Vermont Geological Survey National Earthquake Hazard Reduction Program (NEHRP, 2003) Recommended Provisions for Seismic Regulations for New Buildings and Other Structures, FEMA 450-1/2003 Edition, Part 1: Provision, Building Seismic Safety Council, National Institute of Building Sciences.
Petersen, et al., (2008) Documentation for the 2008 Update of the United States National Seismic Hazard Maps, Open File Report 2008-1128, United States Geological Survey.
Page | 5
Springston, G., (2011a), File Information on Mapping of Exposed Bedrock in the Burlington and Colchester Quadrangles. Springston, G., (2011b), Shear Wave Analysis in the Colchester Quadrangle and Vicinity, Northwest Vermont, Norwich University Department of Geology and Environmental Science, Draft Internal Report Springston, G., (2013a), File information on Shear Wave Velocity Measurements at the UVM Horticultural Farm, UVM East Woods, Burlington Intervale, Essex Overlook, LaPlatte Park, Muddy Brook, and Ethan Allen Homestead. Springston, G., (2013b), File information on Shear Wave Velocity Measurements at the State of Vermont Public Health Building Site in Colchester. Wright, S.F., (1998) Report on Seismic Hazard Mapping Burlington, Vermont 7.5 Minute Quadrangle, Vermont Geological Survey. Wright, S.F., Fuller, S., Jones, S., McKinney, A., Rupard, S., and Shaw, S.D., (2009) Surficial Geologic Map of the Burlington, Vermont 7.5 Minute Quadrangle, Vermont Geological Survey. Wright, S.F., (2003) Surficial Geology of the Burlington and Colchester 7.5-minute Quadrangles: Final Report, Vermont Geological Survey Youd and Perkins, (1978), Mapping liquefaction-induced ground failure potential, Journal Geotechnical Engineering, Vol. 104, No. 4, pp. 433-446. Youd, T. L., Idriss, I. M., Andrus, R. D., Arango, I., Castro, G., Christian, J. T., Dobry, R., Finn, W. D. L., Harder, Jr., L. F., Hynes, M. E., Ishihara, K., Koester, J. P., Liao, S. S. C., Marcuson III, W. F., Martin, G. R., Mitchell, J. K., Moriwaki, Y., Power, M. S., Robertson, P. K., Seed R. B., Stokoe II, K. H. (2001), “Liquefaction resistance of soils: summary report from the 1996 NCEER and 1998 NCEER/NSF workshops on evaluation of liquefaction resistance of soils”, Journal of Geotechnical and Geoenvironmental Engineering, ASCE, October, 817-833.
Page | 6
Spear St
Dorse
t St
Shelb
urne R
d
Roose
velt H
wy
Harbor Rd
East R
d
North Av
Route 2
Williston Rd
Main St
Route 127
Hinesburg Rd
Pine St
Route 7 S
Bay Rd
Midd
le Rd
Blakely Rd
Route 116
Malletts Bay Av
Swift St
Route
2a
S Brow
nell R
d
Pearl St
St Ge
orge R
d
W Milto
n Rd
Prim Rd
Irish Hill Rd
North St
Severance Rd
West St
Kennedy Dr
St Paul St
W Lakeshore Dr
S Willard St
Bear
Trap Rd
White St
Kimball Av
Webster Rd
College Pkwy
Riverside Av
E Lakeshore DrPatchen Rd
S Pros
pect
St
East Av
Colchester Rd
Falls Rd
Barstow Rd
Marshall Av
Churc
h Rd
Airport Pkwy
E Allen St
Cheesefactory Rd
Airport Dr
Park St
Heine
berg
Dr
Pinecrest Dr
S Winooski Av
Colchester Av
Depot Rd
Route
7
Old F
arm R
d
Grove St
N Wi
llard
St
Industrial Av
Farns
worth
Rd
Battery St
Mayo
Rd
N Winoosk
i Av
Kellogg Rd
Centra l Av
N Prospect St
Lake St
Lime Kiln Rd
Lafountain StE Spring St
Susie Wilson Byp
Ledge R d
Oak St
Susie Wilso
n Rd
Depot St
W Spring St
Queen City Park Rd
Man hattan Dr
Mansfield Av
Jasper Mine Rd
Dion St
Barrett St
W Allen St
Porters Point Rd
West St
Ext
Shunpike Rd
S Brow
nell R
d
Main St
Main
StRoute 116
Pearl St
Falls Rd
Bay Rd
Narrows, The
Narrows, The
Shelburne Pond
Colchester Pond
Round Pond
Lily Pad Pond
Mill Pond
Winooski Upper Reservoir
Winooski River
Indian Brook
Allen
Broo
k
Pond
Brook
Lamoille River
Potash Brook
Malletts C
reek
Munroe Brook
Platte River, La
Sucker Brook
La Platte River
Allen
Brook
73°7'30"W
73°7'30"W
73°15'0"W
73°15'0"W
44°37
'30"N
44°37
'30"N
44°30
'0"N
44°30
'0"N
44°22
'30"N
44°22
'30"N
Base maps from U.S. Geological Survey.Coordinate System: Vermont State Plane,meters, NAD 83. Geographic coordinates shownat topo corners are in NAD 83. Digitization and cartography: George Springston,June 5, 2013.
Research supported by the Vermont Geological Survey,Dept. of Environmental Conservation, VT ANR through a grant from the Federal Emergency Management Agency. Mapproduced in cooperation with the School of Engineering,University of Vermont and the Department of Geology andEnvironmental Science, Norwich University.This map is forplanning purposes only. The views and conclusions containedin this document are those of the authors and should not beinterpreted as necessarily representing the official policies, either expressed or implied, of the U.S. Government, the State ofVermont, The University of Vermont, or Norwich University.
Lake Champlain
SEISMIC SITE CLASSIFICATIONFOR AMPLIFICATION POTENTIAL,
BURLINGTON AND COLCHESTER, VERMONT7.5 MINUTE QUADRANGLES
by John E. Lens, Mandar M. Dewoolkar, George E. Springston, and Laurence R. Becker
2013
0 1 2Miles
1:24,000
0 1 2 3Kilometers
Published by:Vermont Geological SurveyLaurence Becker, State GeologistDepartment of Environmental ConservationAgency of Natural Resources103 South Main St., Logue CottageWaterbury, VT 05671-2420http://www.anr.state.vt.us/dec/geo/vgs.htm
Town BoundariesInterstatesMajor RoadsMinor Roads
StreamsWater BodiesUSGS 24K Quadrangle Boundary
Shaded ReliefHigh : 254
Low : 0
ÖNMN
Magnetic declination15.5 degrees west, 1987
D/E
D/E
D/E
D/E
D/E D/E
D/E
D/E
D/E
C
C
C
C
C
C
C
Swamp deposit. Area where assessment of underlyingsurficial material was not made.
Seismic Site Class Definitions The following seismic site classifications are based on criteria in thereferences cited below obtained using a combination of sources of data on subsurface conditions in the quadrangle area. The classifications and boundaries between categories shown on this map are approximate and intended to depict conditions on a regional scale. Subsurface conditions can vary abruptly and borings and/or other characterization techniques are required to estimate site classification at a given location. This map is not to beused in place of proper engineering evaluation of subsurfaceconditions at specific sites which should be performed under the direction of a qualified engineering professional in accordance with accepted standards of practice. Site Class A - Hard Rock (Requires shear wave velocity measurements, See References and Note 1) Site Class B – Exposed bedrock zone with classification subject to confirmation of competent rock condition with moderate fracturing and weathering or better.
Site Class C - Very dense soil and soft rock
Site Class D - Stiff soil profile (See Note 3) Site Class D/E - Area where both D and E profile conditions are common (See Note 2)
Site Class E - Soft Soil Profile (See Note 3)
Site Class F - Soils requiring site specific evaluation (Refer to FEMA 450-1 and IBC 2012 Provisions as referenced below and Note 2)
Note 1: Localized bedrock outcrop zones are widely distributed in this quadrangle and where present may potentially meet Site Class B or better conditions, subject to evaluation by a geotechnical engineer or engineering geologist/seismologist.Note 2: Localized zones of potentially liquefiable soil exist within thisquadrangle in areas identified as Site Class D/E on this map.Areas of man-made filled land along Lake Champlain, ponds, and watercourses are more likely to contain such zones but the potential for liquefiable soil is not limited to filled land areas. Accordingly, site specific engineering evaluations of subsurface conditions in this quadrangle should, where applicable, addressthe potential for liquefaction in accordance with acceptedstandards of practice. Sites where potentially liquefiable soils exist will correspond to Seismic Site Class F conditions according to the criteria in the International Building Code. Note 3. This category is included in this legend but it is not present as individual polygons on this map.References:Lens, J.E., Dewoolkar, M.M., Springston, G.E., and Becker,L.R., 2013, Seismic Hazard for the Burlington and Colchester,Vermont USGS 7-1/2 Minute Quadrangles: Vermont GeologicalSurvey Open File Report VG13-3, 4 p., plus 2 appendices. National Earthquake Hazard Reduction Program (NEHRP)Recommended Provisions for Seismic Regulations for New Buildings and Other Structures, FEMA 450-1/2003 Edition, Part 1: Provision, Building Seismic Safety Council, National Institute of Building Sciences.International Building Code, 2012 Edition, International CodeCouncil, Country Club Hills, IL.
This map is to be used in conjunction with the accompanyingreport (Lens and others, 2013).
The subsurface conditions in this quadrangle range fromcompetent rock and stiff soils to soft and loose soils. In rockand stiff soils, there is limited expected amplification of bedrockmotions. With increasingly softer and looser soil, the groundmotions from an earthquake are expected to be amplified abovethe motions originating in the underlying bedrock. Soil SeismicSite Classifications given on this map and described in the accompanying report correspond to the relative stiffness of thesoil and rock profile conditions within the quadrangle area. It isimportant to recognize that Seismic Site Classifications are basedsolely on the soil and rock conditions within the top 100 feet (30meters) of subsurface profile and are independent of the amountof ground shaking that is predicted to occur.These Seismic Site Classifications are established according tocriteria in the International Building Code 2012 edition. SeismicSite Classification B indicates limited amplification at groundsurface of the predicted bedrock motions. Seismic Site Classifications C through E correspond to increasing amplificationpotential of the bedrock motion generated by an earthquake. Seismic Site Classification A, which is subject to specific confirmation of hard rock conditions actually being present ata site, corresponds to a modest reduction in ground motionspredicted from an earthquake at such a site compared to a sitewith the presumed softer rock of Seismic Site Class B.