32
1 German Manzano UNICA – IPCVA IFFA 07-05-2007 Argentine Beef Industry Argentine Beef Industry Vision and Vision and perspectives perspectives
| Date post: | 26-Dec-2015 |
| Category: |
Documents |
| Upload: | abigayle-francis |
| View: | 215 times |
| Download: | 0 times |
1
German ManzanoUNICA – IPCVAIFFA 07-05-2007
Argentine Beef Industry Argentine Beef Industry Vision and perspectives Vision and perspectives

2
Topics
• Global Beef Production and Trade• Future Opportunities and challenges

3
Global Beef Trade

4
Brazil2004 1,63
2005 1,87
2006 (prov.) 1,87
Australia2004 1,39
2005 1,41
2006 (prov.) 1,42India
2004 0,50
2005 0,63
2006 (prov.) 0,75
New Zealand2004 0,61
2005 0,59
2006 (prov.) 0,54Argentina2004 0,62
2005 0,75
2006 (prov.) 0,56
Canada2004 0,56
2005 0,55
2006 (prov.) 0,46
Uruguay2004 0,40
2005 0,48
2006 (prov.) 0,52
USA2004 0,21
2005 0,32
2006 (prov.) 0,52
World beef exporters
5
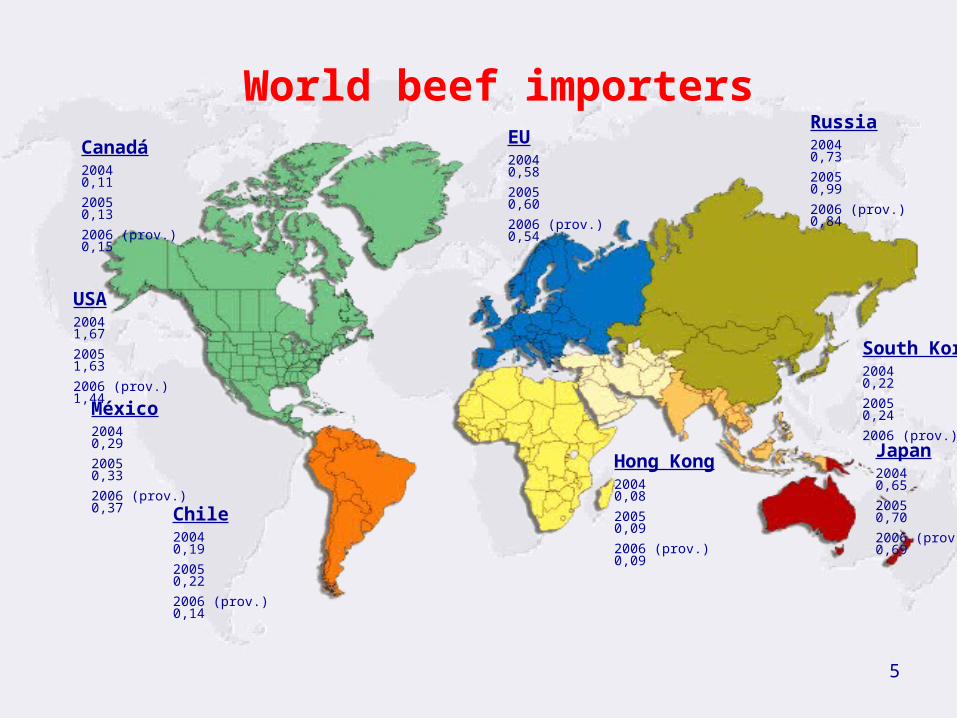
Russia2004 0,73
2005 0,99
2006 (prov.) 0,84
Japan2004 0,65
2005 0,70
2006 (prov.) 0,69
EU2004 0,58
2005 0,60
2006 (prov.) 0,54
USA2004 1,67
2005 1,63
2006 (prov.) 1,44
Chile2004 0,19
2005 0,22
2006 (prov.) 0,14
Hong Kong2004 0,08
2005 0,09
2006 (prov.) 0,09
México2004 0,29
2005 0,33
2006 (prov.) 0,37
South Korea2004 0,22
2005 0,24
2006 (prov.) 0,19
Canadá2004 0,11
2005 0,13
2006 (prov.) 0,15
World beef importers
6
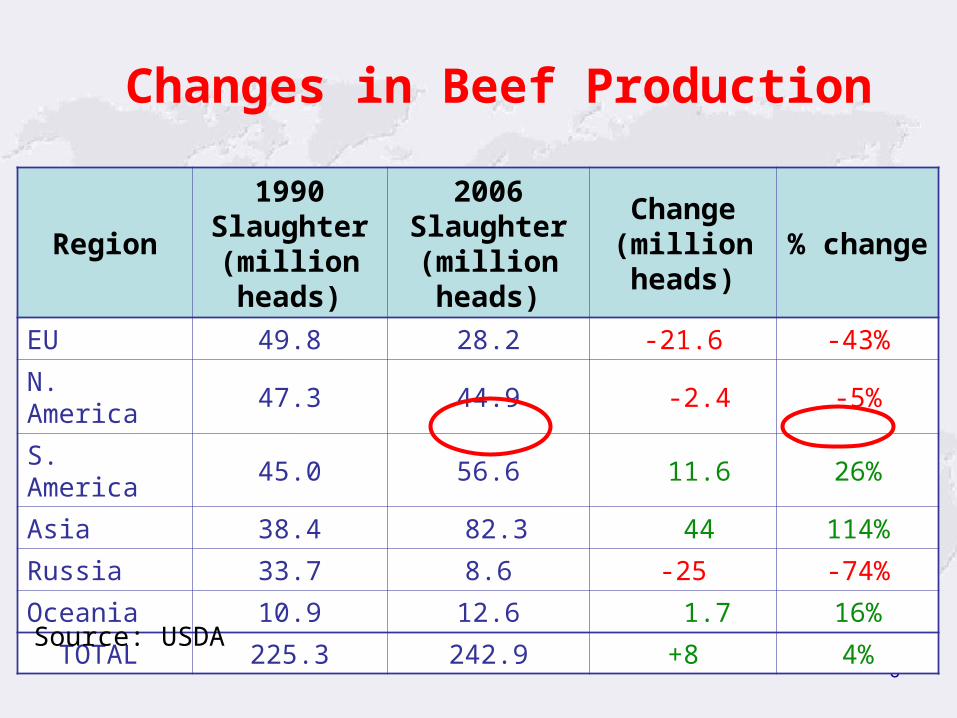
Changes in Beef Production
Region
1990 Slaughter (million heads)
2006 Slaughter (million heads)
Change (million heads)
% change
EU 49.8 28.2 -21.6 -43%
N. America 47.3 44.9 -2.4 -5%
S. America 45.0 56.6 11.6 26%
Asia 38.4 82.3 44 114%
Russia 33.7 8.6 -25 -74%
Oceania 10.9 12.6 1.7 16%
TOTAL 225.3 242.9 +8 4%
Source: USDA

7
Mercosur facts
Facts Brazil Argentina Uruguay Paraguay
Cattle (million hd) 204 55 12 10
Slaughter (million hd) 38 13 3 2
Production (mill tons) 8,800 3,000 0.650 0.330
Consumption (kgs pc) 33 62 26 25
Exports (million tons) 1,900 0.600 0.500 0.200
Total slaughterhouses 1400 480 26 30
National habilitation 750 260 26 12
Export habilitation 480 90 22 6
Steer prices (usdkg) 0.83 0.76 0.98 0.81
Source: own estimates

8
Global Beef Trade Top 10

9
2006 World Beef Production – Top 10Rank Country Total Production
million MT (CWE)
1 U.S. 11.9
2 Brazil 8.85
3 EU-25 7.88
4 China 7.5
5 Argentina 3.1
6 India 2.37
7 Mexico 2.17
8 Australia 2.15
9 Russia 1.46
10 Canada 1.37Source: USDA

10
2006 World Beef Consumption – Top 10
Ranking Country Total Consumption million tons (CWE)
1 U.S. 12.8
2 EU-25 8.22
3 China 7.4
4 Brazil 6.9
5 Argentina 2.6
6 Mexico 2.5
7 Russia 2.3
8 India 1.6
9 Japan 1.2
10 Canada 1.0
Source: USDA

11
2006 World Beef Exports – Top 10Rank Country Exports 000 MT
1 Brazil 1,903
2 Australia 1,140
3 U.S. 656
4 Argentina 600
5 Uruguay 500
6 India 485
7 New Zealand 412
8 Canada 370
9 Paraguay 202
10 Nicaragua 52
Source: USDA estimates
12
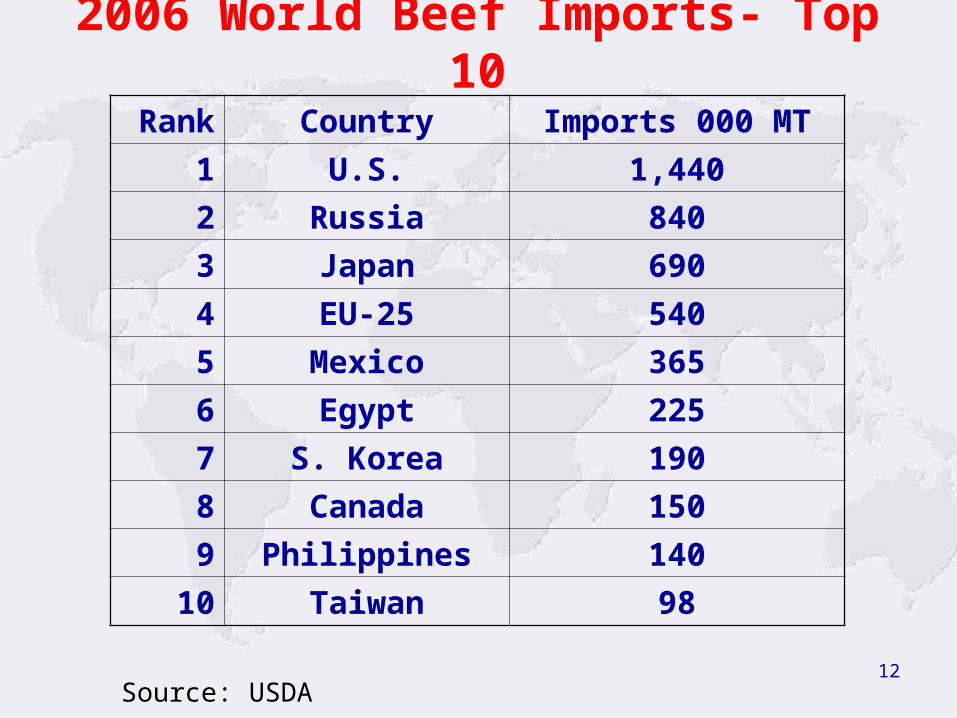
2006 World Beef Imports- Top 10
Rank Country Imports 000 MT
1 U.S. 1,440
2 Russia 840
3 Japan 690
4 EU-25 540
5 Mexico 365
6 Egypt 225
7 S. Korea 190
8 Canada 150
9 Philippines 140
10 Taiwan 98
Source: USDA

13
Beef Trends Projections

14
World Beef Trends
• Increasing costs of production• Growing focus on attributes of end
product• Consumer driven production and focus
on niche marketing• Small but growing demand for natural
and organic beef• Focus on food safety and animal
disease prevention

15
Mercosur potential growth
Facts BrazilArgentin
aUruguay Paraguay
Cattle (million hd) 204 55 12 10
Slaughter (million hd) 38 13 3 2
Production (mill tons) 8,800 3,000 0.650 0.330
Consumption (kgs pc) 33 62 26 25
Exports (million tons) 1,900 0.600 0.500 0.200
Total slaughterhouses 1400 480 26 30
National habilitation 750 260 26 12
Export habilitation 480 90 22 6
Steer prices (usd/kg) 0.83 0.76 0.98 0.81
Source: own estimates

16
World Population GrowthWorld Population Growth
0
1
2
3
4
5
6
7
'50 '55 '60 '65 '70 '75 '80 '85 '90 '95 '00
Billion
0123456789
10
'05 '10 '15 '20 '25 '30 '35 '40 '45 '50
Billion
HistoricalHistorical
Projected
Double 1980 by 2050

17
Red Meat Consumption – FAO Estimates
Source: OECD/FAO
0
50
100
150
200
250
mill
ion
me
tric
to
ns
2006 est 2014 est 2030 est
PorkLambBeef
+14%
+28%
% change from 2006
An increase of over 25 million mtons by 2014

18
Growth Trend Projections Beef Production
0
2000
4000
6000
8000
10000
12000
14000
'00 '01 '02 '03 '04 '05 '06 '07 '08 '09 '10 '11 '12 '13 '14 '15
00
0 M
T
U.S.
Brazil
China
EU-25
India
Argentina
Australia
Canada
Mexico
N. Zealand
Source: OECD/FAO

19
Growth Trend Projections
Beef Consumption
0
2000
4000
6000
8000
10000
12000
14000
'00 '01 '02 '03 '04 '05 '06 '07 '08 '09 '10 '11 '12 '13 '14 '15
00
0 M
T
U.S.
China
Brazil
EU-25
India
Russia
Argentina
Mexico
Japan
Source: OECD/USMEF

20
Growth Trend Projections Beef exports
0
500
1,000
1,500
2,000
2,50020
05
2006
2007
2008
2009
2010
2011
2012
2013
2014
2015
2016
Brazil
Australia
New Zealand
United States
Argentina
Canada
Source: USDA; thousand MT (CWE)

21
Growth Trend ProjectionsBeef Imports
0
200
400
600
800
1,000
1,200
1,400
1,600
1,800
2005
2007
2009
2011
2013
2015
United States
Russia
Japan
EU-25
Mexico
Egypt
South Korea
Canada
Source: USDA; thousand MT (CWE)

22
Foods market trends
Product Level Organoleptic Time Price %
Delicatessen high optimun no no 5-10 medium natural light Standard medium flavour-colour short yes 60-70 taste
Commodities low nutritician no much 20-30

23
Consumers driver’s
• Consumer trust• Brands• Sophisticated markets• Ethical brands• Natural and organic production and standards• Food safety• Nutritional value • Industry image

24
Future opportunities and challenges

25
High-priority subjects
• Installed capacity advantage
• Product development
• Add value and shell life
• By-products advantage
• Quality
• Food safety
• Logistic

26
Installed capacity advantage
• Coordination (Contracts of supplying)
• Informal slaughter elimination
• Internal export-market integration
• Increase capacity of debonning
• Concentration (Integration)
• Increase slaughtering weight
27
Add value and shell life
• Capacity of cold and maturation of beef carcass
• Portion control and special packing (supermarkets, hotels, etc)
• News packing materials (fresh pack)
• Cooked beef
• Commercial sterilization
• Cured and smoked products

28
By-products advantage
• Edible products (offals)
• Industrial use (tallow, blood, leather and bones)
• Opoterapics (glands)
• Pet foods
• Risk material (marrow, brains)

29
Quality
• Cattle and cuts evaluation systems
• Desensitizing methods
• Tenderness process
• Quality audits to correct defects
• Uniform and consistence quality

30
Food safety
• Control of microorganisms
• Conservation at low temperatures
• Alternatives in vacuum packaging
• Microbiological criteria of food safety
• Standardized Norms (SSOP, BMP, HACCP, QUACP, ISO)

31
Logistic
• Cattle trazability
• Product identification
• Animal wellfare in the cattle transport
• Beef cuts transport
• Efluent treatment

32
Thanks!


