1 Predictors of Smoking among Ugandan adolescent between 2007 and 2011 Ebusu P and Ayo-Yusuf OA. School of Health Systems and Public Health Faculty of Health Sciences UNIVERSITY OF PRETORIA Email: [email protected]
Transcript
1
Predictors of Smoking among Ugandan adolescent between
• Tobacco is the leading cause of preventable death, annually killing about 6million people globally (WHO, 2007)
• About 70% of tobacco deaths will occur in Low- and Middle -income countries (Warner, 2005)
• There are about 1.3 billion smoke globally and the number is estimated to reach 1.5 billion by 2025 (Mackay, Eriksen, & Shafey, 2006: 72).
3
Background cont’
• Global trends show decreasing tobacco use in high- income countries but with growth in middle- and low income countries (Jha & Chaloupka, 2000; World Bank, 1999)
• Between 1970 to 2000, per capita cigarette consumption fell by 14% in developed countries and rose by 46% in developing counties (Guindon & Boisclair, 2003).
4
Trends in smoking behaviour by education in Europe
Source: J Epidemiol Community Health 2005;59:395–40 (reconstructed)
Combined country smoking inequalities and smoking by education level among several Western European countries between 1985 and 2000 (25–79 years of age)
Age standardised prevalence of current smoking (%)Education level 1985 1990 1995 2000
Men1 (low) 44.88 43.74 39.50 36.302 40.40 38.88 35.22 35.943 39.14 31.05 27.49 27.174 (high) 28.87 26.60 25.71 22.56RII (95% CI) 2.63 (2.34 to 2.95) 3.17 (2.81 to 3.56) 3.08 (2.67 to 3.55) 2.67 (2.30 to 3.11
Women1 (low) 25.94 29.82 29.63 31.492 24.70 25.56 24.83 24.943 22.74 21.55 21.89 21.044 (high) 18.83 18.62 17.67 16.61RII (95% CI) 1.53 (1.33 to 1.75) 2.21 (1.91 to 2.57) 2.67 (2.26 to 3.14) 3.16 (2.67 to 3.75
Adjusted by age and country. Countries included: Norway, Sweden, Finland, UK, Germany, Italy, and Spain.
5
Uganda TC efforts
• Ratified the WHO Framework Convention on Tobacco Control (FCTC) in 2007 but treaty not yet domesticated (in process)
• Has got somewhat TC policies like; The National Environment (control of smoking in public places) Regulations 2004, Occupational Safety and Health Act, 2006 among others.
6
Uganda TC efforts cont’
• A number of smoking studies have been conducted in Uganda, but little is known about predictors of smoking and especially among adolescents
• Under ager smoking is reported to be as low as 9years and the smoking gap between boys and girls is said to be closing.
7
Objectives
To explore smoking predictors and gender difference in smoking prevalence among adolescents in Uganda during 2007 and 2011
8
Methods • This was a cross-sectional study, involving secondary
data analysis of the merged 2007 (n=4,071) and 2011 (n=3,434) Ugandan Global Youth Tobacco Surveys (GYTS) (N=7,505 emerged).
• The outcome measure – current smoker, was defined as having smoked at least once during the past 30 days. Other information obtained included friends and parental smoking status, among others.
• Data analysis included chi-square and multivariale logistic regression. The level of statistical significance was set at p< 0.05
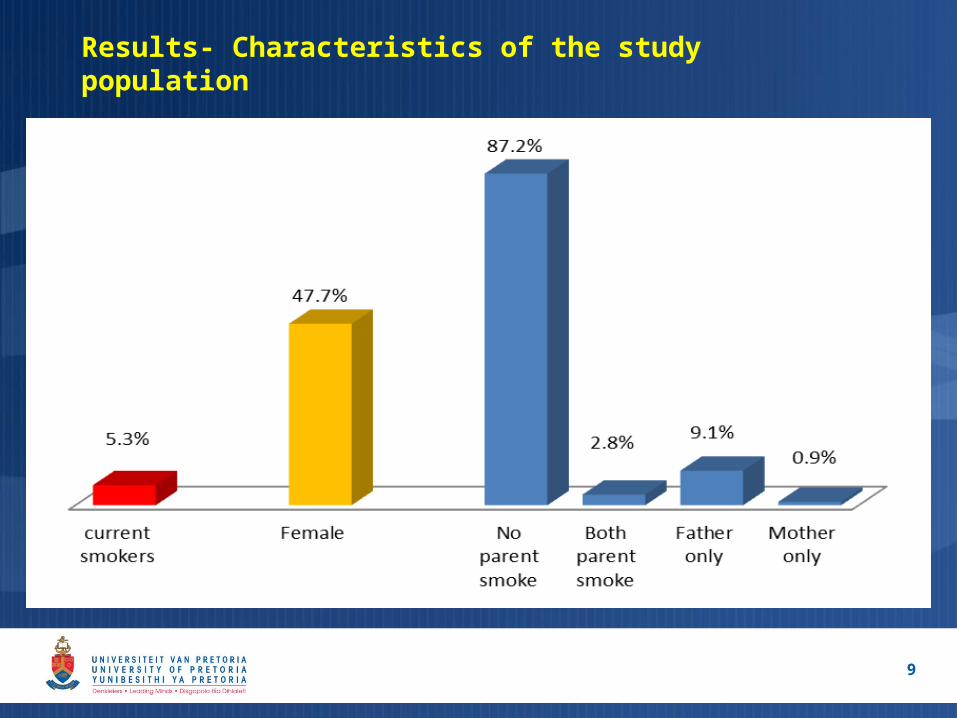
Results- Characteristics of the study population
9
Percentage of current smokers in the study population in relation to various characteristics
10
Variable(s) % Current smokers (n) p-value
SexBoys Girls
6.3 (293) 4.2 (139)
0.11
Parents smokingNoneBothFather onlyMother only
3.7 (303) 38.2 (36)12.9 (101)11.7 (11)
0.00
Friends smokingNone of themSome of themMost/all of them
2.7 (181)19.9 (218)26.4 (58)
0.00
Exposure to SHS at homeNot exposedExposed
2.7 (196)15.2 (256)
0.00
Actors seen smoking on mediaNeverSometimesA lot
3.1 (64) 5.2 (123)7.8 (264)
0.04
.
11
Seen cigarette brand name on mediaNeverSometimesA lot
3.4 (145) 7.0 (149) 8.2 (161)
0.00
Seen billboard advertisementNoneA fewA lot
3.5 (107) 6.2 (200) 7.5 (137)
0.02
Seen anti-smoking media messagesNoneA fewA lot
3.1 (67) 6.4 (142) 6.3 (238)
0.06
Boys who smoke have more/less friendsNo differenceLess friendsMore friends
5.5 (84)4.1 (175) 7.7 (186)
0.10
Girls who smoke have more/less friendsNo differenceLess friendsMore friends
8.0 (64) 4.2 (292) 8.0 (99)
0.06
Factors independently associated with smoking among Ugandan adolescents between 2007 and 2011
12
Factors Adjusted OR (95% Conf Int)
Parent smokingNoneBoth parentsFather onlyMother only
17.52 1.22 1.34
1.23 - 45.910.65 - 2.280.37 -5.05
Close friend smokingNoneFew of themAll/most of them
16.59 4.52
3.70 -11.742.50 -8.18
Exposure to SHS at homeNot exposedExposed
13.69
2.02 - 6.74
Difference in smoking prevalence among Ugandan adolescent in 2007 as compared to 2011
13
Year
Smoking Rate (%)
95% CI
P-value
Boys
20072011
10.86.1
8.47 - 13.724.18 - 8.69
0.01
Girls
20072011
5.04.2
3.79 - 6.652.59 - 6.57
0.48
Boys and Girls
20072011
8.25.1
6.49 - 10.293.82 - 6.86
0.01
Discussion
14
• Reduced open advertising for tobacco (Billboard, TV, and Radio)
• Growing women emancipation
Conclusion
Uganda needs to implement strong smoke-free policies and promote voluntary adoption of smoke-free homes.
Awareness raising especially targeting parents should be intensified and adolescents need to be given life skills to overcome peer pressure.
Smoking interventions for adolescents need to target girls as much as they do for boys in order to cause effect in both genders.
15
Acknowledgement
This research is supported by a grant from American Cancer Society (ACS)