59
1 President’s Report to the Board Western’s 278 th Convocation June 17 Ontario Budget Admissions and Student Mobility Performance and Activity Indicators Dr. Paul Davenport June 25, 2002
| Date post: | 19-Dec-2015 |
| Category: |
Documents |
| View: | 221 times |
| Download: | 0 times |

1
President’s Report to the Board
Western’s 278th Convocation
June 17 Ontario Budget
Admissions and Student Mobility
Performance and Activity Indicators
Dr. Paul DavenportJune 25, 2002

2
PSE in the Budget Speech
“Because we live and compete today in a global, knowledge-based economy, post-secondary education is central to our future prosperity”
…. “The government is committed to providing full
average-cost funding for enrolment growth for our colleges and universities”
Hon. Janet EckerMinister of Finance

3
Operating and Capital Funding An additional $75 million in base budget operating
grants, reaching $368 million by 2003-04, to support full average-cost funding Western is working to determine the likely size and
timing of any additional grants to UWO Fulfills commitment of the Throne Speech
New round of post-secondary SuperBuild Western will be seeking support for the Medical
Science Building renovation

4
Investment in Research
Ontario Research & Development Challenge fund $250 million expansion over five years
Ontario Innovation Trust $300 million enhancement
Ontario Research Performance Fund In 2000, $30 million annual commitment Will increase by $2 million per year

5
Ontario Centres of Excellence Program $161 million renewal for five years
Premier’s Biotechnology Initiative $51 million Strategy $30 million Biotechnology Cluster
Innovation Program $20 million Medical and Related Sciences
Discovery District (Toronto) Ontario Bioprocessing Institute
(announcement forthcoming)

6
Other Post-secondary Education Measures
Special Grants ($16 million) for Northern and Rural Institutions
University of Ontario Institute of TechnologyOngoing commitments to collaborative
programs in Nursing and increases in undergraduate Medicine enrolments
Second phase of Ontario Student Opportunity Trust Fund – assistance to 400,000 students over the next decade

7
Year 1 of the Increased Cohort Excerpt from Minister’s June 24 Press Release
“The Ontario Universities’ Application Centre has confirmed that acceptances for Ontario secondary school students applying directly into university this year increased by 16.3 per cent which matches the 16.3 per cent increase in secondary school applicants.”
“‘This demonstrates that our plan for double cohort students is on track. The numbers show that the proportion of Ontario high school students that were accepted into full-time university programs this fall is the same as in the fall of 2001,’ Cunningham said.”

8
Year 1 of the Increased Cohort Percentage increases varied by university. Five
universities had an increase in confirmed admissions from Ontario secondary schools of over 30%: Brock, Lakehead, McMaster, Ottawa, and Trent.
The increase at UWO (including affiliates) was 6.4%, in line with targets approved by Senate and Board.
Western’s situation reflects the high mobility of Ontario students: 80% of our Ontario secondary school students come from outside London and Middlesex County, and 60% of L&MC students to whom Western makes an offer choose not to come.

9
Admissions & Student Mobility: Background Western’s campus: all data include the Affiliated
Colleges, which are also included in data used by the Ministry for funding purposes
The increased cohort will appear over three years—2002 to 2004.
We focus on admissions for Current Year Ontario Secondary School Graduates (“SSG”), because this is the only group with the increased cohort
Data on London and Middlesex County (“L&MC”) illustrate the mobility into Western and out of the county to other institutions

10
Student Mobility
Western’s commitment: as compared to the SuperBuild base year 1998-99, when we registered 3,980 SSG, Western and the Affiliates will register an additional 2,700 SSG during the three increased cohort years of 2002-2004
Mobility: in 2001-02, 4,435 SSG were admitted and registered at Western, of which 895 (20%) were from L&MC, with the balance of 3,540 from the rest of Ontario

11
Student Mobility
As a provincially funded public institution, we can not discriminate against Ontario SSG from outside L&MC
If we seek to admit even higher numbers of SSG to Western, on average for every additional student from L&MC, we will receive four more SSG students from the rest of the Province.
We must balance accessibility and quality, and our L&MC students and parents want high quality

12
Student Mobility
Priority for SSG: the share of SSG in total first year enrolment at Western will rise from 76% in 2001 to 80% to 2003. A temporary measure which recognizes the pressures
of the increased cohort Mobility of local students: 2,292 offers of admission were
made last year to SSG in L&MC 895 students decided to register at Western 1,397 students decided not to come to Western; most
presumably went to another universiy.

13
President’s Annual Report onPerformance and Activity Indicators
June 25, 2002

14
Performance Indicators Mandated by MTCU
Calculated by MTCU Graduation rate OSAP Default rate
Survey of Graduates Employment rates Relation between degree and
employment

15
Graduation Rates in Ontario UniversitiesStudents Entering in 1992 who had Graduated by 1999
91%
82% 80%74% 72%
68%
46%
74%78%78%
83%
0%
20%
40%
60%
80%
100%
Que Tor Gue McM Wat UWO Ott Win Yor Car Total
16
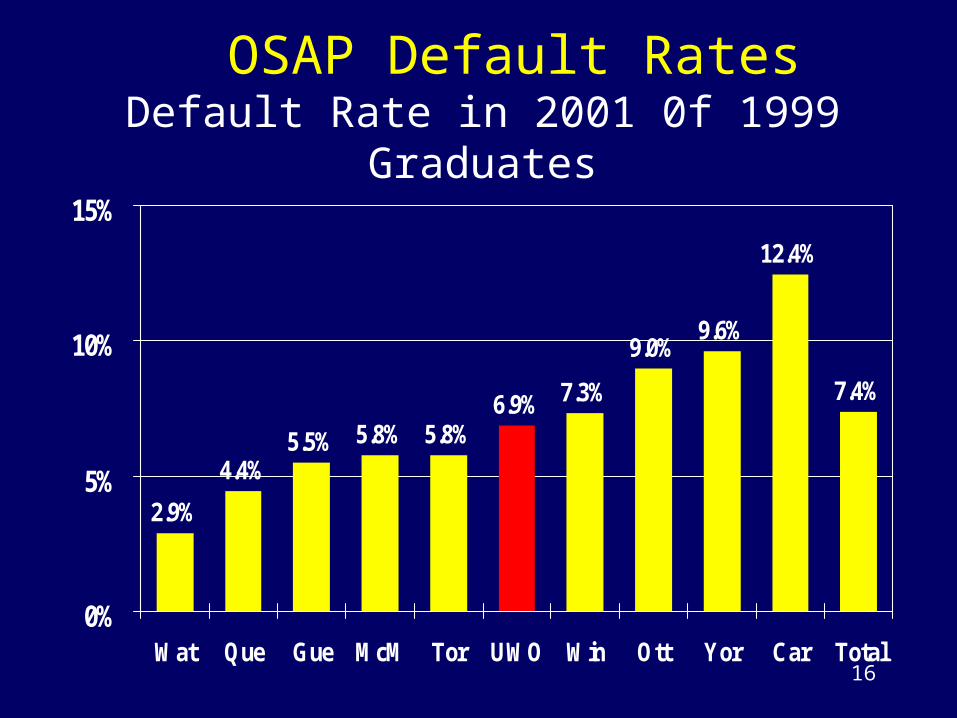
OSAP Default RatesDefault Rate in 2001 0f 1999 Graduates
2.9%
4.4%5.5% 5.8%
9.0%9.6%
12.4%
7.4%6.9%5.8%
7.3%
0%
5%
10%
15%
Wat Que Gue McM Tor UWO Win Ott Yor Car Total
17
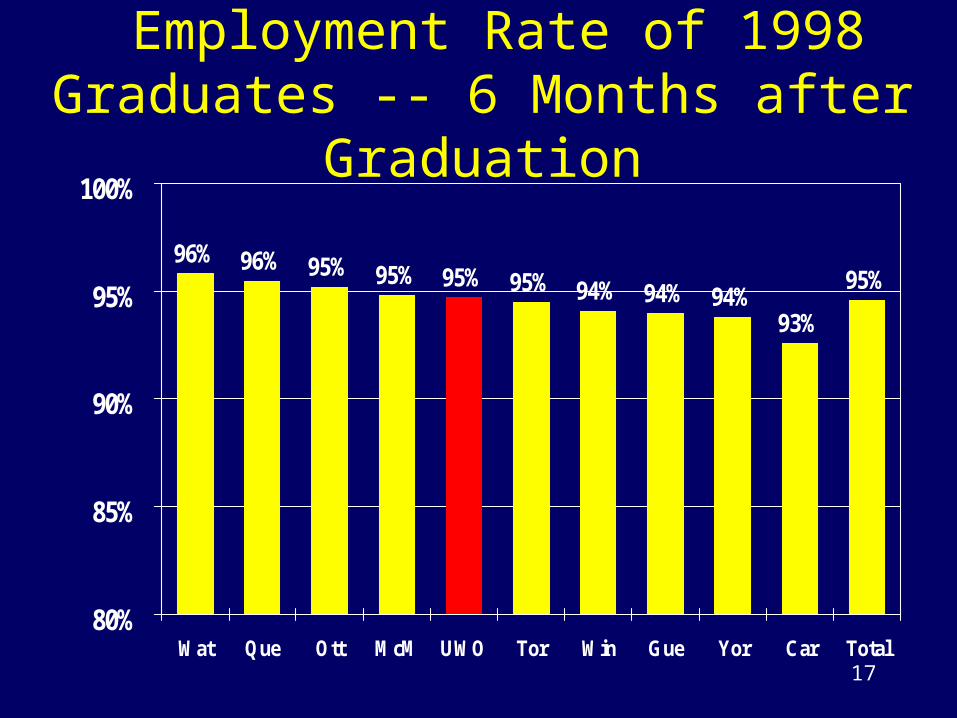
Employment Rate of 1998 Graduates -- 6 Months after Graduation
96% 95%95% 94% 94% 94%
93%
95%95%95%96%
80%
85%
90%
95%
100%
Wat Que Ott McM UWO Tor Win Gue Yor Car Total

18
Employment Rate of 1998 Graduates -- 2 Years after Graduation98% 98% 97% 97% 97%
96%95%
97%97%98%98%
80%
85%
90%
95%
100%
Wat Que Tor Gue Ott McM Win UWO Car Yor Total

19
Employment Rates of 1999 Western Graduates2 Years after Graduation
100% 100% 100% 100%99% 99%
97% 97% 97%
93%92%
96%
80%
85%
90%
95%
100%
Den Law Med Mus HS Edu Bus Eng Arts Sci SS Total
20
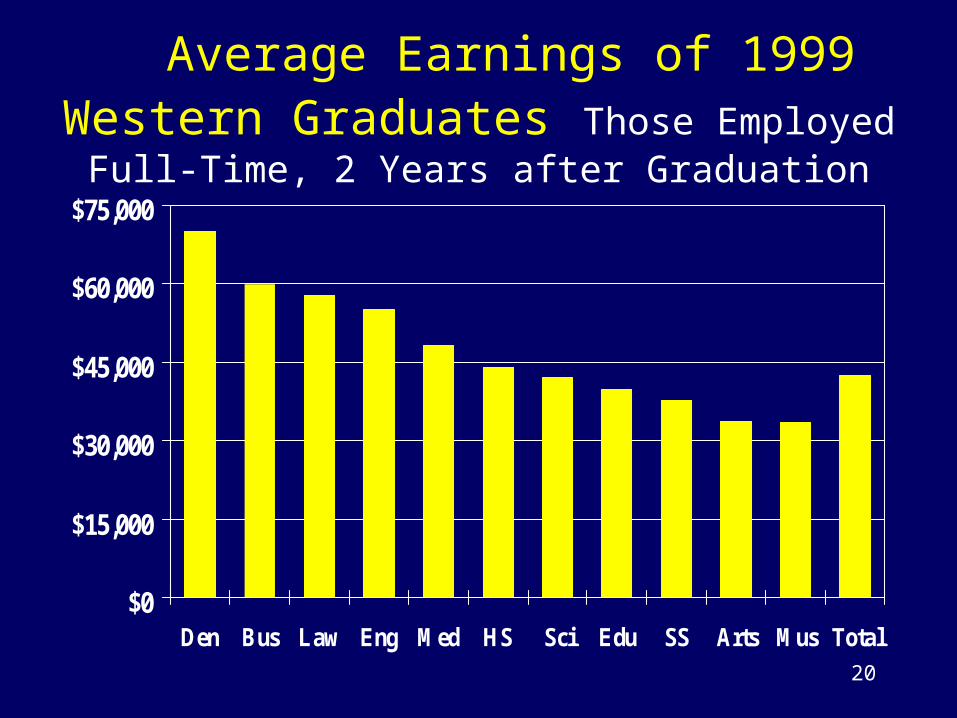
Average Earnings of 1999 Western Graduates Those Employed Full-Time, 2 Years after Graduation
$0
$15,000
$30,000
$45,000
$60,000
$75,000
Den Bus Law Eng Med HS Sci Edu SS Arts Mus Total

21
Indicators at Western
StudentsFacultyStaffAlumni and AdvancementCapital and DebtSupport Units

22
Students

23
Average Entering Grades of New Full-Time 1st Year OAC Students
75%
76%
77%
78%
79%
80%
81%
82%
83%
85-8
6
86-8
7
87-8
8
88-8
9
89-9
0
90-9
1
91-9
2
92-9
3
93-9
4
94-9
5
95-9
6
96-9
7
97-9
8
98-9
9
99-0
0
00-0
1
01-0
2
Ontario
Western
24
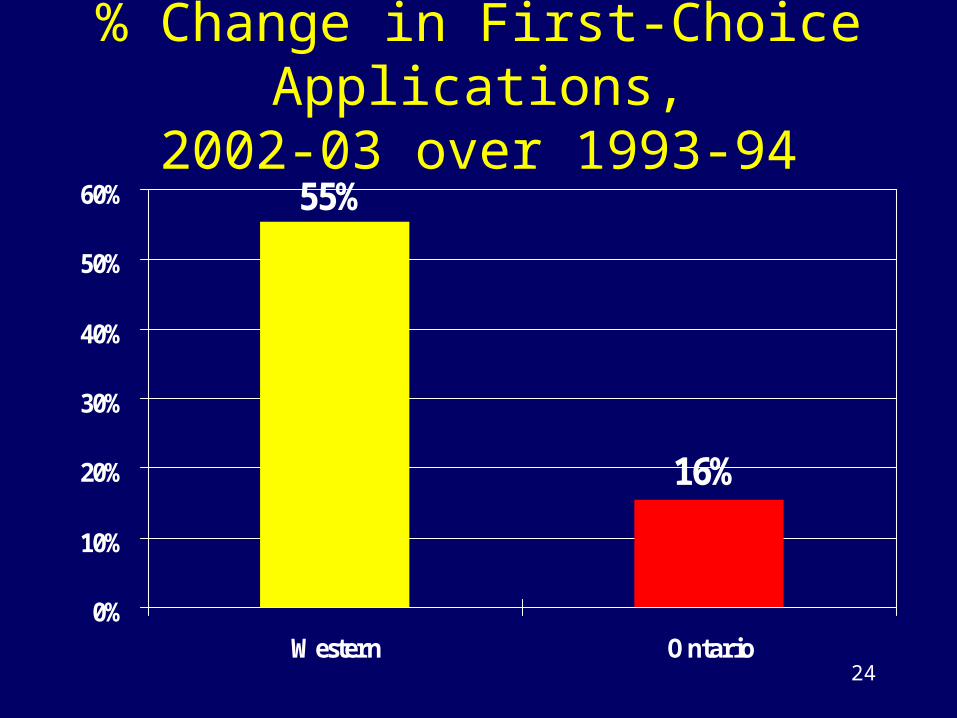
% Change in First-Choice Applications,2002-03 over 1993-94
55%
16%
0%
10%
20%
30%
40%
50%
60%
Western Ontario

25
Overall Effectiveness of InstructorSource: Student Course Evaluations0% 10% 20% 30% 40%
Outstanding
Very Good
Good
Satisfactory
Borderline
Unsatisfactory
Very Poor2001-02p1999-001996-97

26
Course as a Learning Experience Source: Student Course Evaluations
0% 10% 20% 30% 40%
Outstanding
Very Good
Good
Satisfactory
Borderline
Unsatisfactory
Very Poor 2001-02p1999-001996-97

27
Overall Satisfaction With Education Received
Source: Survey of Students at Graduation
0% 10% 20% 30% 40% 50% 60% 70% 80%
Very Satisfied
Somewhat Satisfied
Less than Satisfied
2001-021999-001995-96

28
Students Who Would Recommend UWO to a FriendSource: Survey of Students at Graduation
0% 20% 40% 60% 80% 100%
No
Yes
2001-021999-001995-96

29
Masters Degrees Awarded at Western
600
700
800
900
1,000
1,100
1,200
1,300
1,40019
80
1982
1984
1986
1988
1990
1992
1994
1996
1998
2000
2002
2004
2006
Making Choices Target in 2005 = 1370

30
Ph.D. Degrees Awarded at Western
50
75
100
125
150
17519
80
1982
1984
1986
1988
1990
1992
1994
1996
1998
2000
2002
2004
2006
Making Choices Target in 2005 = 170

31
Faculty

32
15
16
17
18
19
20
2190
-91
91-9
2
92-9
3
93-9
4
94-9
5
95-9
6
96-9
7
97-9
8
98-9
9
99-0
0
00-0
1
01-0
2
Student/Faculty Ratio at Western
A 26% Increase

33
Number of Full-Time Faculty at Western(Excludes Clinicians)
900
950
1,000
1,050
1,100
1,150
1,20090
-91
91-9
2
92-9
3
93-9
4
94-9
5
95-9
6
96-9
7
97-9
8
98-9
9
99-0
0
00-0
1
01-0
2

34
43
35 35 34
48
28
58
41
63
76
60
0
10
20
30
40
50
60
70
80
91-92 92-93 93-94 94-95 95-96 96-97 97-98 98-99 99-00 00-01 01-02
New Tenured/Probationary Faculty Appointments at Western
(Includes Limited-Term Faculty Receiving Tenured/Probationary Appts)

35
17
42
71
93
115
0
20
40
60
80
100
120
02-03 03-04 04-05 05-06 06-07
Cumulative Faculty Retirements at Western

36
Employees, Enrolment, and ResearchFunding at Western -- 2001-02 over 1993-94
9%
36%
98%
-9%-20%
0%
20%
40%
60%
80%
100%
120%
Western
Employees
Undergrad
Enrolment
Graduate
Enrolment
ResearchFunding

37
Research Revenue at Western ($M)Includes Affiliated Hospitals and Research Institutes
6571 68
83 8493
102
125 129
0
20
40
60
80
100
120
140
93-94 94-95 95-96 96-97 97-98 98-99 99-00 00-01 01-02

38
Staff

39
6
7
8
9
10
11
1290
-91
91-9
2
92-9
3
93-9
4
94-9
5
95-9
6
96-9
7
97-9
8
98-9
9
99-0
0
00-0
1
01-0
2
Student/Staff Ratio at Western
A 49% Increase

40
1,500
1,700
1,900
2,100
2,300
2,50090
-91
91-9
2
92-9
3
93-9
4
94-9
5
95-9
6
96-9
7
97-9
8
98-9
9
99-0
0
00-0
1
01-0
2
Number of Full-Time Staff at Western

41
Alumni and Advancement

42
Number of Western Alumni
80,000
100,000
120,000
140,000
160,000
180,00019
85
1986
1987
1988
1989
1990
1991
1992
1993
1994
1995
1996
1997
1998
1999
2000
2001
43
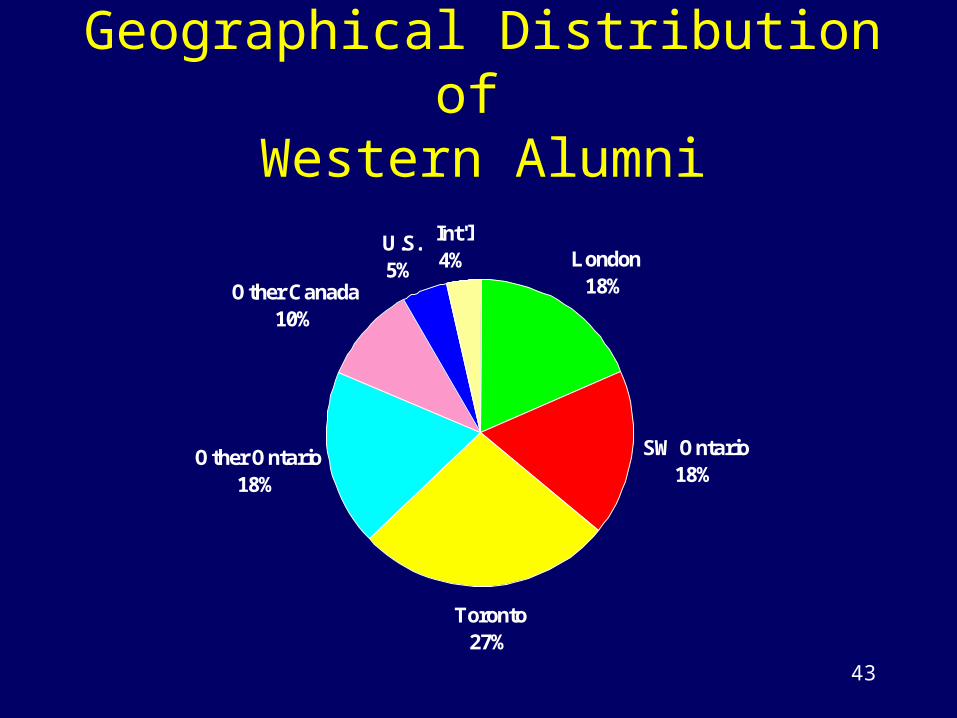
Geographical Distribution of Western Alumni
London18%
SW Ontario18%
Toronto27%
Other Ontario18%
Other Canada10%
U.S.5%
Int'l4%

44
Tax-Receipted Donations to Western($ Millions; excludes Government Grants)
05
101520253035404550
1980
1982
1984
1986
1988
1990
1992
1994
1996
1998
2000
2002

45
Cumulative Gifts and Pledges to Campaign Western ($ Millions)
44
78
115
155
195
235
270
192
234
135
44
86
0
50
100
150
200
250
300
1998 1999 2000 2001 2002 2003 2004
Target Actual

46
Capital and Debt

47
Western: Deferred Maintenance Funding ($M)
0
5
10
15
20
25
92-93 93-94 94-95 95-96 96-97 97-98 98-99 99-00 00-01 01-02 02-03
All Other Funds
Operating Budget (One-Time)
Operating Budget (Base)

48
Ratio of Actual to Standard Space Standard space generated by MTCU/COU Formulas
70%
75%
80%
85%
90%
95%
100%
86-87 89-90 92-93 95-96 98-99 01-02e
Western
Ontario

49
0
1,000
2,000
3,000
4,000
5,000
6,00019
55
1960
1965
1970
1975
1980
1985
1990
1995
2000
2005
Number of Undergraduate Residence Spaces
Elgin
EssexNew

50
Projected UWO Capital Debt $ Millions at April 30, Projects Planned as of June, 2002
0
20
40
60
80
100
120
140
160
180
2000a 2001a 2002 2003 2004 2005 2006 2007 2008 2009 2010 2011 2012
Capital & Operating Fund Ancillaries & Associated Companies

51
20%
25%
30%
35%
40%
45%
2000a 2001a 2002 2003 2004 2005 2006 2007 2008 2009 2010 2011 2012
Ratio of Capital Debt to Operating Revenue Debt includes only projects planned as of June, 2002
Revenue from Table 1 of the Operating Budget (about 60% ofTotal Revenue in the Financial Statements)

52
Support Units

53
Treasury ServicesInvestment Returns at Dec 31/2000
7.8%9.0%
11.7%12.6%
7.9%9.0%
11.0%
12.4%
0%
2%
4%
6%
8%
10%
12%
14%
Year-Ending Annualized 2 Years
Annualized 4 Years
Annualized 10Years
UWO Canadian University Median

54
Purchasing: Ratio of Revenue to Purchasing Employees ($M)
41
51
0
10
20
30
40
50
60
UWO 2000-01 1998 CAPS Benchmark
55
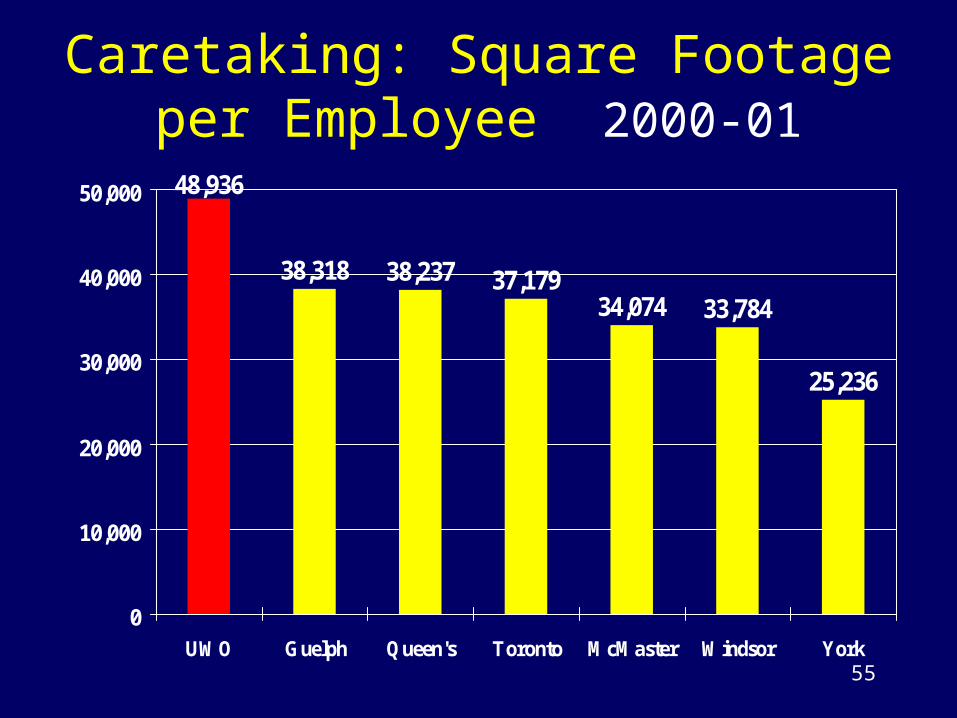
Caretaking: Square Footage per Employee 2000-01
48,936
38,318 38,237 37,17934,074 33,784
25,236
0
10,000
20,000
30,000
40,000
50,000
UWO Guelph Queen's Toronto McMaster Windsor York

56
Book StoreSales per Square Foot, 2000-01
$729
$1,399
$0
$250
$500
$750
$1,000
$1,250
$1,500
UWO Large Store Group Median

57
Book StoreSales per FTE Student, 1999-00
$703$746
$0
$200
$400
$600
$800
UWO Large Store Group Median

58
Food ServicesSales per Labour Hour, 2000-01
39.2245.05
56.00
$0
$20
$40
$60
UWO Canadian UniversityAverage
Large CanadianUniversities (15,000+
Students)

59
President’s Report to the Board
Western’s 278th Convocation
June 17 Ontario Budget
Admissions and Student Mobility
Performance and Activity Indicators
Dr. Paul DavenportJune 25, 2002


