1 | Program Name or Ancillary Text eere.energy.gov Water Power Peer Review Quantifying the Value of Hydropower in the Electric Grid Tom Key Electric Power Research Institute [email protected]November 3, 2011
Transcript
1 | Program Name or Ancillary Text eere.energy.gov
Water Power Peer Review
Quantifying the Value of Hydropower in the Electric Grid
TASK 3: Evaluate National Hydropower Participation in Ancillary Services Markets
TASK 2: Establish Wide-Area Modeling Approach and Policy Scenarios
TASK 5: Develop Data Base of Cost Elements for Development Options
CONTRACT START
TASK 1: Prepare Industry Case Studies
TASK 4: Analyze Systemic Operating Constraints on Hydropower Resources
TASK 7: Determine Effects of Alternative Policy Scenarios on Value of Hydropower
TASK 6: Develop and Compute Scenario Simulations for WECC Projects
TASK 8: Define New Methodology for Planning and Applying Hydropower Assets
TASK 9: Documentation and Dissemination of Results
Internal Report Industry Review/Public Report
(See Project Milestones/Deliverables)
2a
4b
5b
1a 1b 1c
2b
3a 3b
4a 4c
6b
ES
5a 5c
6a
7a
3c
5d
Final
5 | Wind and Water Power Program eere.energy.gov
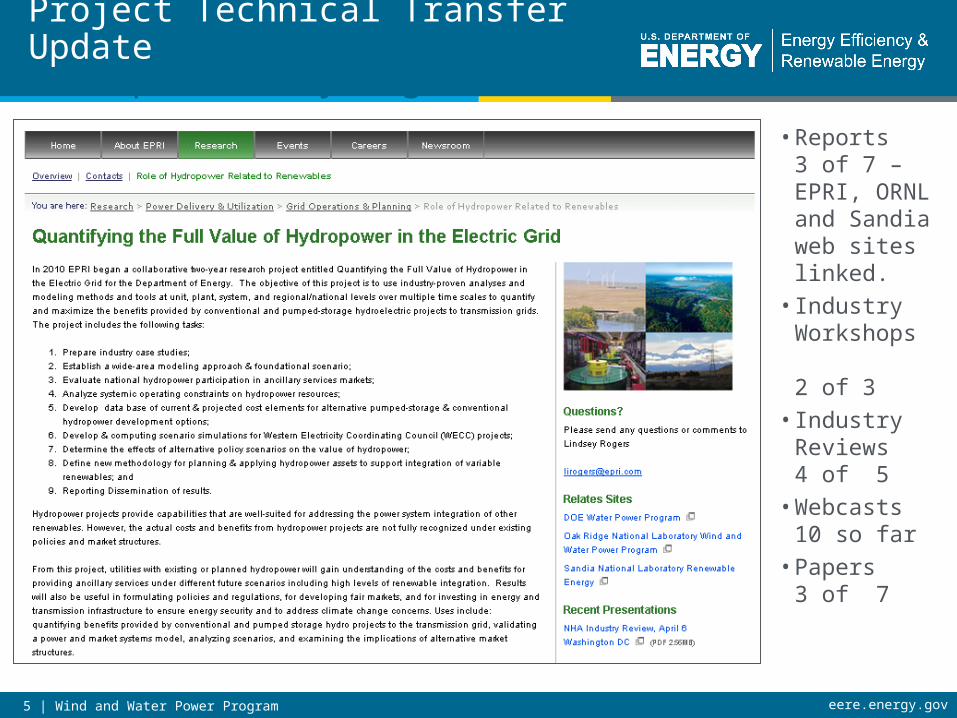
• Reports 3 of 7 – EPRI, ORNL and Sandia web sites linked.
• Industry Workshops 2 of 3
• Industry Reviews4 of 5
• Webcasts 10 so far
• Papers 3 of 7
Project Technical Transfer Updatewww.epri.com/hydrogrid
6 | Wind and Water Power Program eere.energy.gov
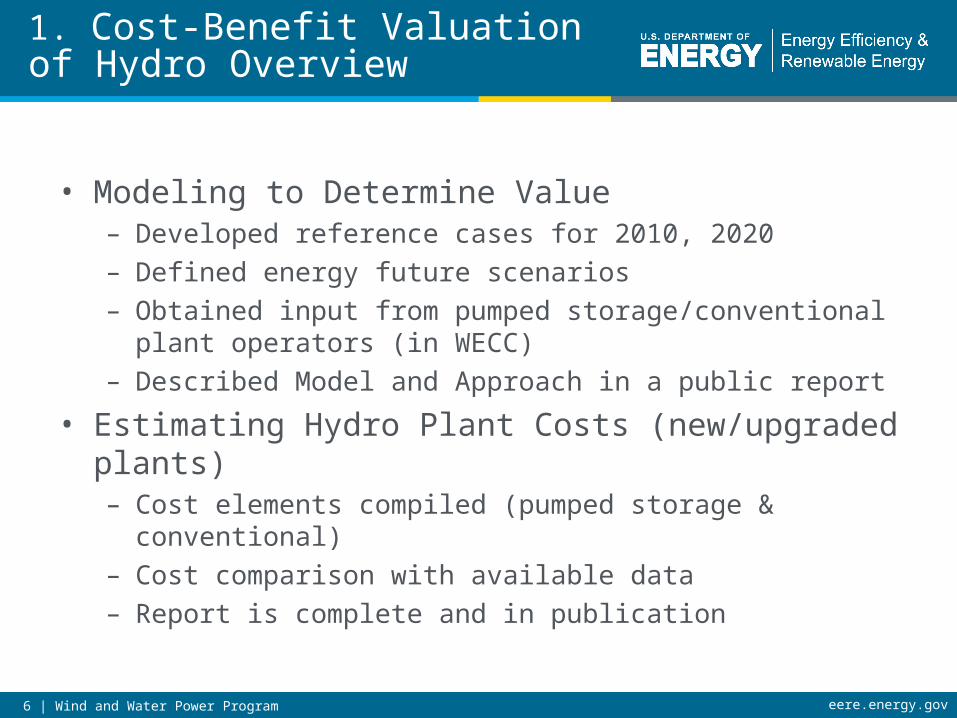
1. Cost-Benefit Valuation of Hydro Overview
• Modeling to Determine Value – Developed reference cases for 2010, 2020– Defined energy future scenarios– Obtained input from pumped storage/conventional plant
operators (in WECC)– Described Model and Approach in a public report
• Estimating Hydro Plant Costs (new/upgraded plants)– Cost elements compiled (pumped storage & conventional)– Cost comparison with available data– Report is complete and in publication
8 | Wind and Water Power Program eere.energy.gov
Pumped Storage:Conventional:• Idaho Power• Pacific Gas & Electric• Chelan County PUD• Sacramento Municipal Utility
District• US Bureau of Reclamation• Avista Corp• Pacific Corp• Portland General Electric• Southern California Edison• Seattle City Light• US Corps of Engineers
1. Modeling: Data Sent to Plant Owners/Operators in WECC
• California Dept. of Water Resources
• Salt River Project• Central Arizona Project• LA Dept. of Water &
Power/CDWR• Xcel Energy• US Bureau of Reclamation• Southern California Edison Co• Pacific Gas & Electric Co
9 | Wind and Water Power Program eere.energy.gov
1. Modeling: Plant Owner/Operator Feedback
• Are plant parameters properly modeled?• Is operation characterized
correctly in markets or utility • Do plant drivers and interaction
with other plants look rightInput/new learnings
incorporated into the modelInput/new learnings
incorporated into the model
10 | Wind and Water Power Program eere.energy.gov
1. Modeling: Pumped Storage Operations
Dramatic shifts in operations occur when the minimum loading constrained is altered to allow a very low set point.
11 | Wind and Water Power Program eere.energy.gov
1. Modeling: Primary Energy Future Scenarios
2010
2020
Timeframes Energy Futures Sensitivities
Carbon Costs
Load Growth
Gas Prices
Hydro Conditions
PS Expansion
Technology Upgrades
Energy Future Emission Costs Demand Generation Expansion
Future 1 None Average TEPPC (WECCs plan)
Future 2 None Average EPRI Estimate (NESSIE)
Future 3 Medium Average EPRI Estimate (NESSIE)
Future 4 Medium High NESSIE w/ High Gas price
12 | Wind and Water Power Program eere.energy.gov
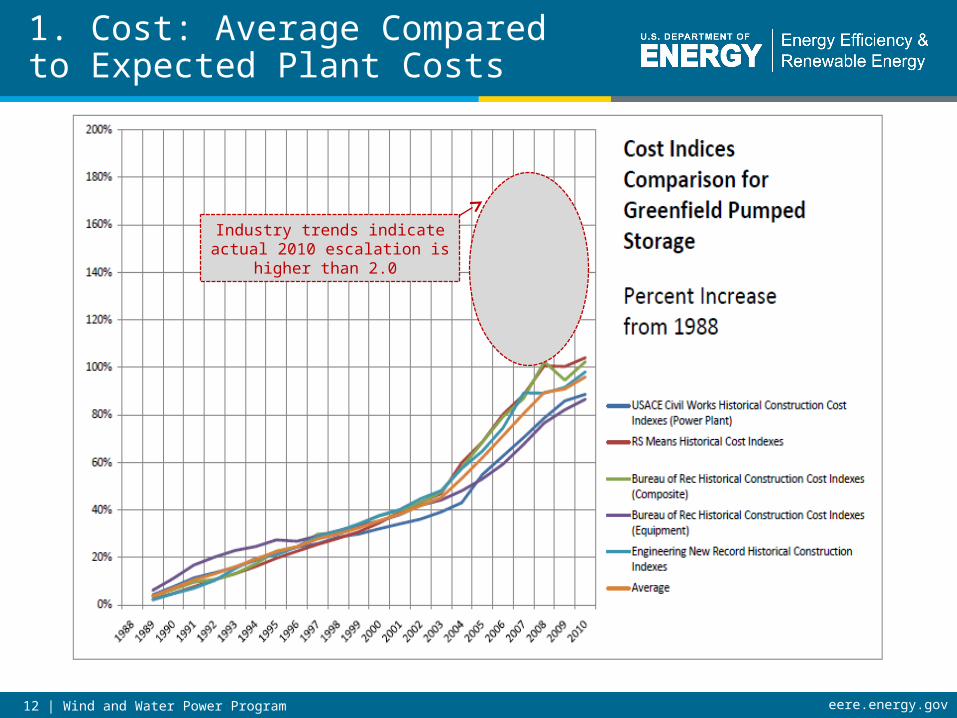
1. Cost: Average Compared to Expected Plant Costs
Industry trends indicate actual 2010 escalation is higher than 2.0
13 | Wind and Water Power Program eere.energy.gov
1. Cost: Importance of Head in Pumped Storage Economy
15 | Wind and Water Power Program eere.energy.gov
2. Market/Regulatory Drivers
• Market comparisons considering specific plant case studies, (ISOs)
– Completed report on market treatment of hydro power energy and ancillary services
– Conducted workshops with WECC/CAISO and at MISO– Will report on gaps with recommendations in final report , paper
proposed for HydroVision 2012
• Comparison with European Value Proposition– Input from stakeholders on pumped storage (final report and
paper proposed for HydroVision 2012) primarily from Voith
16 | Wind and Water Power Program eere.energy.gov
• Ease of market entry and exit– Limit requirements for market participation
• Absence of significant monopoly power– No dominant firms
• Widespread availability of information– All participants should simultaneously have the same information
• Absence of market externalities– No uncompensated services
• Achievement of public interest objectives– More competition leads to lower energy prices
2. Markets: Characteristics of well-functioning markets
17 | Wind and Water Power Program eere.energy.gov
2. Markets: Benefits of Optimizing single PS Plant Ancillary Services in CAISO (no VSD)
• Hydrological Constraints– Published Metrics for Hydropower Grid Services– Published Whitepaper on the Research Needed to Enable
Regional and National Modeling of Water Availability and Policy Impacts on Water Power Grid Services
– Final Report Systemic Plant Operating Constraints is under review
• Operational Opportunities– Continue work on 7 case studies to identify operational drivers– Each case include a report to owner– All cases will be summarized in a public report
19 | Wind and Water Power Program eere.energy.gov
3. Operational Opportunities: Case Study Locations
Pacific Gas & ElectricHelms
CAISO, WECC
Pacific Gas & ElectricHelms
CAISO, WECC
USACE
SWPA, MISO
USACEHarry S. Truman
Duke EnergyBad CreekSoutheast
Duke EnergyBad CreekSoutheast
AmerenUEOsageMISO
AmerenUEOsageMISO
AmerenUETaum Sauk
MISO
AmerenUETaum Sauk
MISO
Chelan County PUDRocky Reach
WECC
Chelan County PUDRocky Reach
WECC
Chelan County PUDRocky Reach
WECC
Chelan County PUDRocky Reach
WECC
New York Power Auth.Blenheim-Gilboa
NYISO
New York Power Auth.Blenheim-Gilboa
NYISO
New York Power Auth.Blenheim-Gilboa
NYISO
New York Power Auth.Blenheim-Gilboa
NYISO
Duke EnergyBad CreekSoutheast
Duke EnergyBad CreekSoutheast
AmerenUEOsageMISO
AmerenUEOsageMISO
AmerenUETaum Sauk
MISO
AmerenUETaum Sauk
MISO
New York Power Auth.Blenheim-Gilboa
NYISO
New York Power Auth.Blenheim-Gilboa
NYISO
New York Power Auth.Blenheim-Gilboa
NYISO
Exelon GenerationMuddy Run-
PJM
Chelan County PUDRocky Reach
WECC
Chelan County PUDRocky Reach
WECC
Chelan County PUDRocky Reach
WECC
Exelon GenerationConowingo
PJM
New York Power Auth.Blenheim-Gilboa
NYISO
New York Power Auth.Blenheim-Gilboa
NYISO
New York Power Auth.Blenheim-Gilboa
NYISO
TVARaccoon Mountain-
SoutheastConventional Hydro
Pumped-Storage
20 | Wind and Water Power Program eere.energy.gov
3. Operational Opportunities: Status of Case Studies
Plant Owner Type Status of Data Status of Analyses
Bad Creek Duke Energy P-S Received Completed
Osage Ameren Missouri Conv. Received Completed
Taum Sauk Ameren Missouri P-S Received Completed
Blenheim-Gilboa NYPA P-S Received Completed
Muddy Run Exelon P-S Received Completed
Conowingo Exelon Conv. Received Underway
Raccoon Mountain TVA P-S Received Completed
Rocky Reach CCPUD Conv. Received Underway
21 | Wind and Water Power Program eere.energy.gov
3. Operational Opportunities: Scheduling Analysis
Actual vs Optimized Energy
0
500
1000
1500
2000
2500
3000
3500
4000
4500
-200 0 200 400 600 800 1000 1200 1400 1600
Power (MW)
Sep
tem
ber2
010-
Ene
rgy
Hea
d 11
00
75
80
85
90
95
Opt
imiz
ed P
lant
Eff
icie
ncy
(%)
Scroll Data 'Show All
Select Series 'X-Axis Scale '
22 | Wind and Water Power Program eere.energy.gov
4. Application of Technology Advancements Overview
• New Technologies for Future Plants– Investigate options for plant upgrades
» Provide more generation capacity
» Provide more ancillary services (min/max operating points)
» Adding a turbine to existing dam
– Investigate new plant technologies» Incorporating Variable speed
» New turbine generator configurations
» Chapter in final report and a paper proposed for HydroVision 2012
23 | Wind and Water Power Program eere.energy.gov
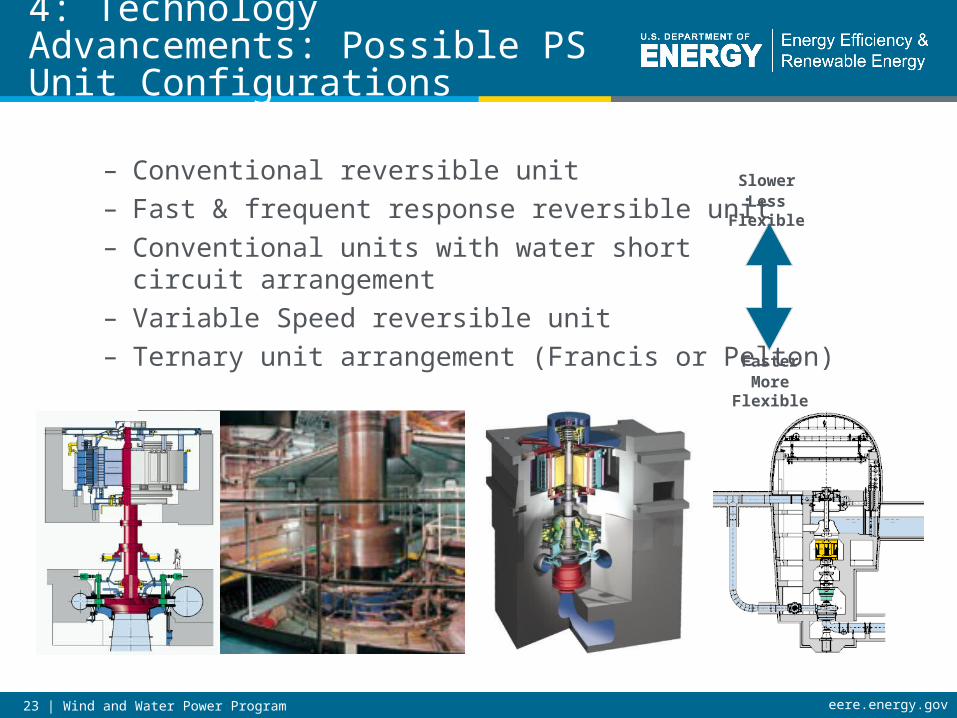
4: Technology Advancements: Possible PS Unit Configurations
– Conventional reversible unit – Fast & frequent response reversible unit– Conventional units with water short
circuit arrangement– Variable Speed reversible unit– Ternary unit arrangement (Francis or Pelton)
SlowerLess Flexible
FasterMore Flexible
24 | Wind and Water Power Program eere.energy.gov
Plan for Project Final Report
Executive Summary1. Value calculations – EPRI
• Energy and Ancillary Services – LCG Modeling• Costs – HDR|DTA Estimating
2. Market comparison gaps & recommendations to rules (ISOs)- Sandia National Lab and Kirby Consulting
3. Hydrological Constraints- Oak Ridge National Lab
4. Operational Opportunities - HPPi
5. New Technologies for Future Plants - Voith/HDR|DTA
6. Comparison with European Value Proposition- Voith
7. Conclusions & Future Research
25 | Wind and Water Power Program eere.energy.gov
Next Steps
Q4 2011
• Run scenarios to determine future value
• Finalize Case Studies
• Consider other values e.g. freq. regulation, reliability energy security
• Report on systemic water constraints
• Synthesis into valuing/methods report comparing alternatives


![1 | Program Name or Ancillary Texteere.energy.gov Water Power Peer Review [Project/Subtask Title] [Presenter] [Organization] [Contact Info] [Date] [Title.](https://static.documents.pub/doc/80x56/56649cd75503460f9499eaa8/1-program-name-or-ancillary-texteereenergygov-water-power-peer-review-projectsubtask.jpg)


