20
1 Regional Wind Energy Purchase Jim Caldwell Montgomery County Department of Environmental Protection April 5, 2004
| Date post: | 24-Dec-2015 |
| Category: |
Documents |
| Upload: | jewel-freeman |
| View: | 216 times |
| Download: | 0 times |

1
Regional Wind Energy
Purchase
Jim Caldwell
Montgomery CountyDepartment of Environmental
Protection
April 5, 2004

2
State Implementation Plan (SIP)
• Compliance with Clean Air Act• Reduce ground-level ozone by
reducing precursors: NOx and VOC
• Safeguard federal transportation dollars

3
Emissions
0
100
200
300
400
500
600
700
800
900
Pennsylvania
New York
Virginia
Maryland
Delaware
NOxVOC
ton
s p
er
year
Source: MDE, 1999 U.S. EPA data

4
0
2
4
6
8
10
12
14
16
18
Maryland
Pennsylvania
New YorkVirg
inia
Delaware
Ground-Level Ozone
# Days above 1-hour standard
Source: MDE, 2002 data—note: Baltimore Region is represented for Maryland

5
So, where does the ozone come from?
“Ozone Transport”
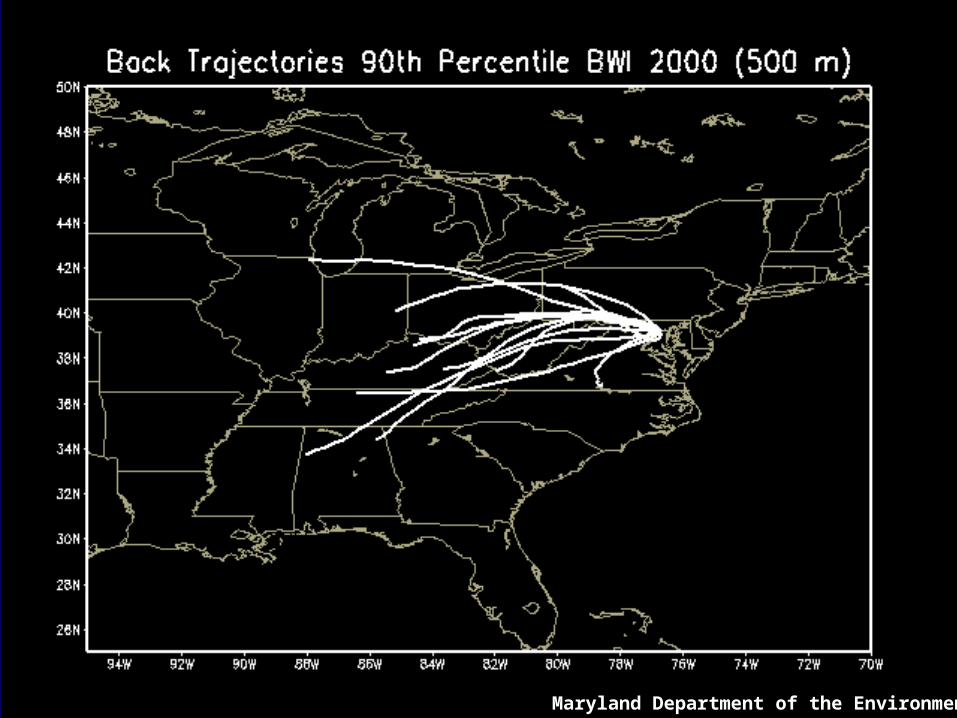
6
Maryland Department of the Environment

7Maryland Department of the Environment

8
And the Power Plants are…
The Nation’s largest 50 power plants (open circles). Source: NOAA

9
Wind Energy -Air Quality and other Benefits
No combustion occurs in wind, many pollutants are displaced, including-– NOx – Mercury– Acid Rain Precursors– Particulates– Greenhouse Gases
Displaced Pollutants, also means less pollutants entering our watersheds– Power plants are the greatest source of mercury– Up to 30% of the nitrogen in the bay is from air
depositionOther benefits-
– Reduced reliance on imported energy– No risk of fuel price hike

10
Dickerson Plant Emissions as a Portion of Local Air Quality Problems
•Point Sources, such as power plants account for 45% of all NOx emissions in the County.
•93% of the point source NOx emissions is attributable to fossil-fueled power generation.
•The on-road mobile category, which accounts for 34% of NOx emitted in the County, represents the emissions from 613,781 vehicles.
Source: MWCOG 1999 PEI

11
Wind Energy as a Control Measure or as a Strategy
• Montgomery County’s Wind Energy Purchase was included in March SIP package as a cost effective control measure :– Commitment letter from County– Montgomery County and Maryland
Department of the Environment worked together to adopt an appropriate strategy acceptable by the EPA with the use of Maryland’s “set aside” program.
• Wind Energy has also been included as a strategy in MWAQC’s Gold Book for other jurisdictions to adopt.

12
Emissions “Offset”• We buy wind from area where NOx
emissions occur (ozone transport)
• Wind power “offsets” some coal power generation
• MDE (or equivalent) awards NOx “allowances”
• Allowances are retired
• Credit for “allowances” taken in SIP

13
Price Premium:
1.5 ¢ 2 ¢ (per kWh)
Price for Wind Depends On:• Size of purchase• Contract Term• NOT electricity rates
Cost of Wind Power

14
Cost by Agency
Agency 5% WindkWh
cost @ 1.5 cents
cost @ 2 cents
Water 10,914,544 $163,718 $218,291
Schools 9,241,066 $138,616 $184,821
Government 3,549,996 $53,250 $71,000
Parks 2,525,126 $37,877 $50,503
Housing 1,282,956 $19,244 $25,659
College 1,217,320 $18,260 $24,346
Total 28,731,008 $430,965 $574,620

15
Control Measure Cost (ton/year)
Wind Energy $32,000
CNG Refueling Stations $54,701
55 CNG Busses $103,063
1967 Bike Lockers $247,111
Cost Effective NOx Reduction
16
Savings Offset Price
• Very simple measures – behavioral changes – no capital investment.
• Computers:– Monitor Management
• Ex.: Loudoun County has saved $17,000 with Monitor Management alone.
• Montgomery County estimates savings to range from $75,000 to $100,000.
• Lights – 40 hrs./week vs. 168 hrs./week• savings range from $140,000 to $400,000 per year
• Office Equipment – purchase “Energy Star” compliant, activate energy saving features, turn off at night

17
What is the Next Step?
• Even though the one-hour SIP has been submitted, it is never to late to take action.
• Other possiblities:– Inclusion as part of the 8-hour
SIP– Adopt as part of an air quality
improvement measure in your jurisdiction, following the gold book
• Questions regarding Montgomery County’s contract for wind energy ???

18
Wildlife Impacts
• Largest single bird kill incident in the history of the wind industry: ~ 30 birds killed on the night of May 23, 2003, heavy fog incident.
• Approximately 400 migrating bats killed between August and October 2003.
• Both incidents took place at the Mountaineer wind facility on Backbone Mountain, WV
• According to the National Wind Coordinating Committee, there are about 33,000 documented bird fatalities per year due to the 15,000 wind turbines in America.

19
Leading Causes of Bird Deaths
• Habitat Destruction: number one cause of bird and wildlife death and species extinction
• Glass: It is estimated that one bird per year is killed by impact with each of the 100 million homes, apartment buildings, office towers, schools, and storefronts that dot the American landscape. If you include towers and other structures, total kills may be as high as 1 billion per year.
• Cats: about 60 million cats in the U.S. kill hundreds of millions of birds each year, estimates vary.

20
Mountaintop Removal
vs.


