What is remote sensing? = Any data collected from a distance Images from: Air Images: www.aerialphotography.com/ NASA //www.NASA.gov Aircraft Satellites Active sensors P l a t f o r m s I n s t r u m e n t s Psssive scanners Camera /film or digital
Transcript
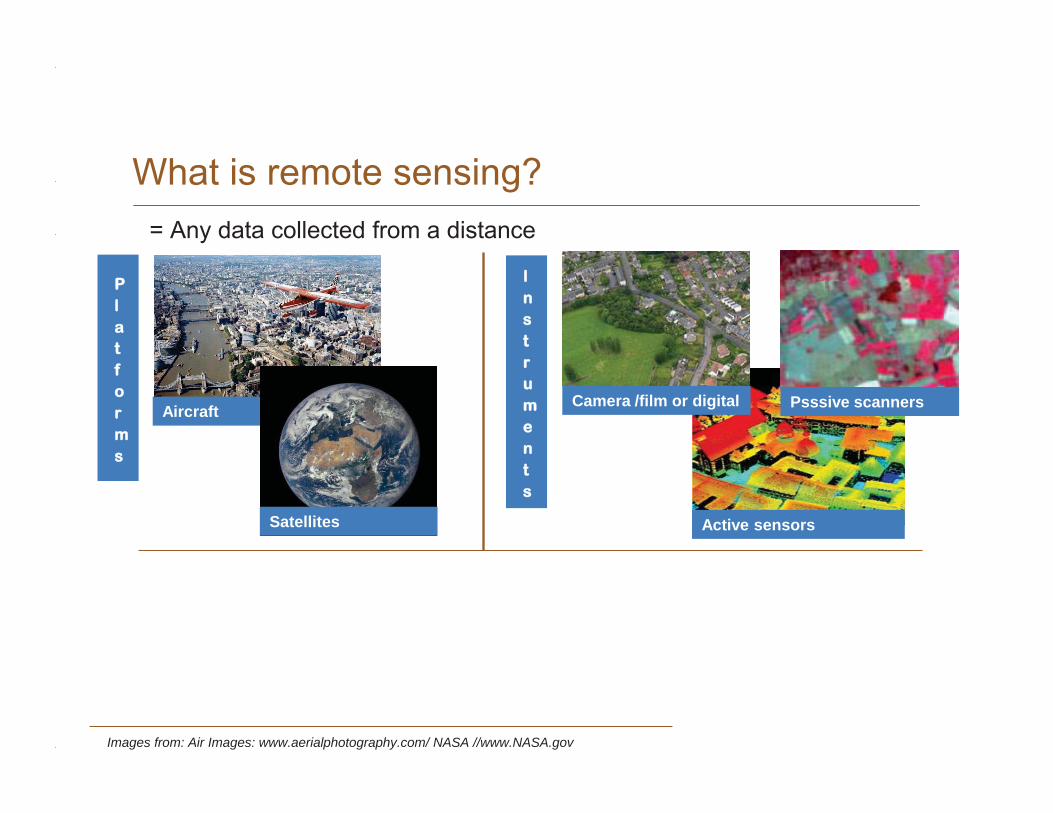
What is remote sensing? = Any data collected from a distance
Images from: Air Images: www.aerialphotography.com/ NASA //www.NASA.gov
Aircraft
Satellites Active sensors
Platforms
Instruments
Psssive scanners Camera /film or digital
What is remote sensing? = Any data collected from a distance
Images from: Air Images: www.aerialphotography.com/ NASA //www.NASA.gov
Focus: Earth observation remote sensing What can we... ...about the earth surface using remote sensing data?
Aircraft
Satellites Active sensor data
Platforms
See Interpret learn
Instruments
Passive sensor data Camera /film or digital
Why?
• Reach uninhabited areas -2/3 of the surface = water bodies, large parts of the land surface area hardly ever visited
Information from remote areas
Satellite MODIS captured this image of sea ice off Greenland on July 16, 2015. Large chunks of melting sea ice can be seen in the sea ice off the coast. The past ten years have included nine of the lowest ice extents on record.
• Reach uninhabited areas -large parts of earth surface is hardly ever visited.
• Cover large areas general overview of spatial patterns, new relationships may be discovered
Spatial patterns and relationships
“Researchers have uncovered a remarkably strong link between high wildfire risk in the Amazon basin and the devastating hurricanes that ravage North Atlantic shorelines.”
The climate scientists’ findings are appearing in the journal Geophysical Research Letters near the 10th anniversary of Hurricane Katrina’s calamitous August 2005 landfall at New Orleans and the Gulf Coast. More information here: https://www.nasa.gov/feature/goddard/nasa-and-university-researchers-find-link-between-amazon-fires-and-devastating-hurricanes
Why?
• Reach uninhabited areas -large parts of earth surface is hardly ever visited: water/ice (weather prediction)
• Cover large areas general overview of spatial patterns and relationships
• Provides up-to-date information overview spatial distribution/rapid changes
Why?
• Reach uninhabited areas -large parts of earth surface is hardly ever visited: water/ice (weather prediction)
• Cover large areas general overview for spatial patterns
• Provides up-to-date information overview spatial distribution/quick changes
• Reveal information from light sources/wavelength regions invisible to our eyes
Image of water vapor from Meteosat satellite
To view images in 15 min. Intervals, go here: http://cimss.ssec.wisc.edu/goes/blog/wp-content/uploads/2015/07/150725_meteosat10_water_vapor_Storm_Zeljko_anim.gif
Wavelength band: 6.25 μm (visible = 0.4 – 0.7 μm)
Summer storm Zeljko centered on Netherlands Some locations experienced hurricane-force surface winds. Meteosat = geostationary satellite –sense the same area all the time
White/green areas = water vapor
When?
• Weather prediction
• Detection/distribution of gases
• Crop forecasting
• Mineral detection
• Forest monitoring
• Land use change detection
• Climate changes
• ...
When?
• Weather prediction
• Detection/distribution of gases
• Crop forecasting
• Mineral exploration
• Forest monitoring
• Land use change
• ....
TASK ---
Present 1 example which involves remote
sensing
Source = free of choice (except course book), department home page (research pages), the internet...). BUT! Source must be presented as well.
2- 5 slides with images + explaining text on a pp. Presentation of about (2-3 minutes)
Remote sensing history
1900 1840 1860 1880 1920 1940 1960 1980 2000
1850 1870 1890 1930 1910 1950 1970 1990 2010
• 1490: Leonardo da Vinci describes the principles for the camera.
• 1666: Sir Isaac newton found that he could divide light into a spectrum of colors
• 1839 William Henry Fox Talbot invents a new method of photography –making it
possible to take photographs outside and with shorter exposure time.
Remote sensing history –as earth from above
1900 1840 1860 1880 1920 1940 1960 1980 2000
1850 1870 1890 1930 1910 1950 1970 1990 2010
~1840 - 1860: First remote pictures from cameras on tethered balloons. (Virginia). Purpose is topographic mapping. 1858: France (Versailles). French photographer and balloonist: Tournachon (Nadar) 1860: Photo over Boston –image is preserved. American photographer: Black. 630 m height. 1861 – 1865: American Civil War
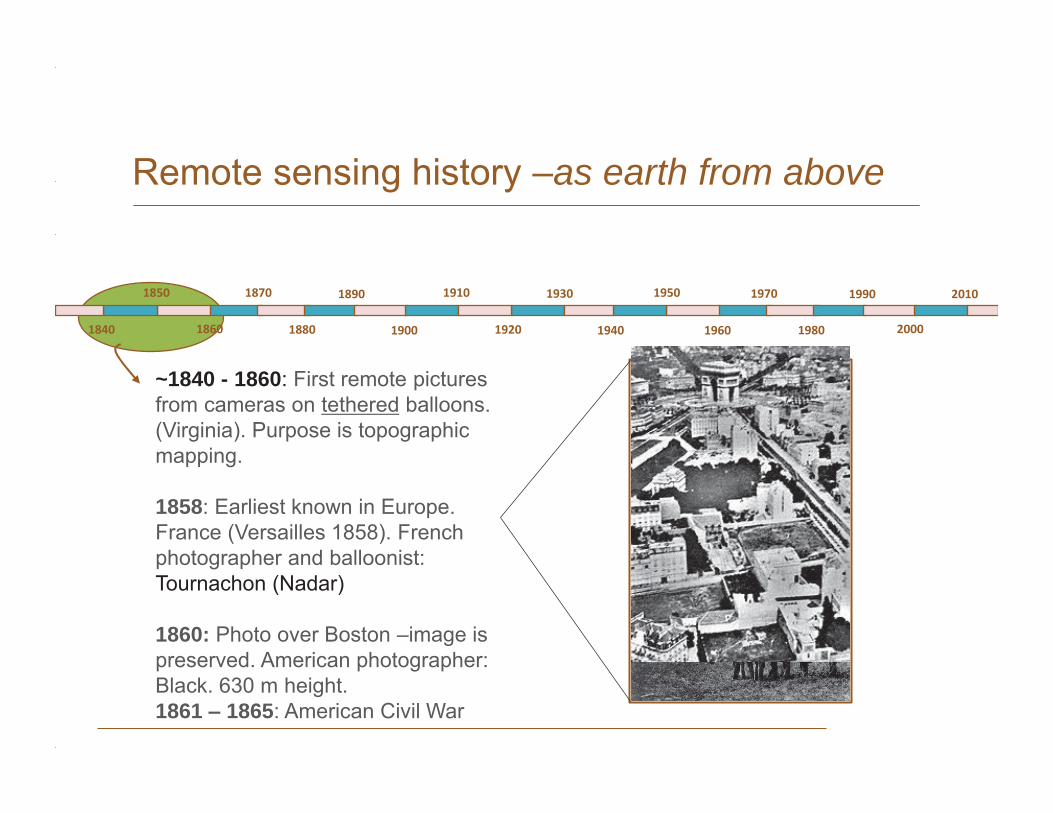
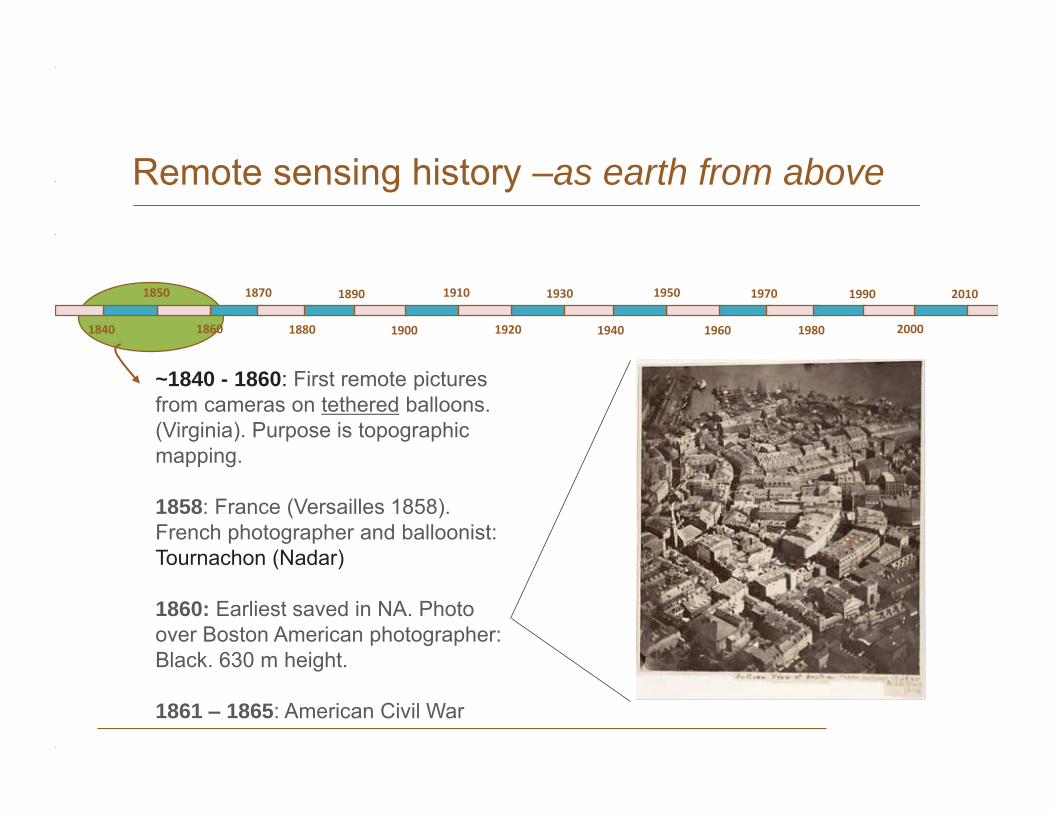
Picture from American civil war (1862). Prof. Lowe in his balon to look out on the Battle of Seven Pines in Virginia. Balloon ascension of Thaddeus Lowe at Seven Pines HD-SN-99-01888" by Mathew Brady -
Remote sensing history –as earth from above
1900 1840 1860 1880 1920 1940 1960 1980 2000
1850 1870 1890 1930 1910 1950 1970 1990 2010
~1840 - 1860: First remote pictures from cameras on tethered balloons. (Virginia). Purpose is topographic mapping. 1858: Earliest known in Europe. France (Versailles 1858). French photographer and balloonist: Tournachon (Nadar) 1860: Photo over Boston –image is preserved. American photographer: Black. 630 m height. 1861 – 1865: American Civil War
Remote sensing history –as earth from above
1900 1840 1860 1880 1920 1940 1960 1980 2000
1850 1870 1890 1930 1910 1950 1970 1990 2010
~1840 - 1860: First remote pictures from cameras on tethered balloons. (Virginia). Purpose is topographic mapping. 1858: France (Versailles 1858). French photographer and balloonist: Tournachon (Nadar) 1860: Earliest saved in NA. Photo over Boston American photographer: Black. 630 m height. 1861 – 1865: American Civil War
1900 1840 1860 1880 1920 1940 1960 1980 2000
1850 1870 1890 1930 1910 1950 1970 1990 2010
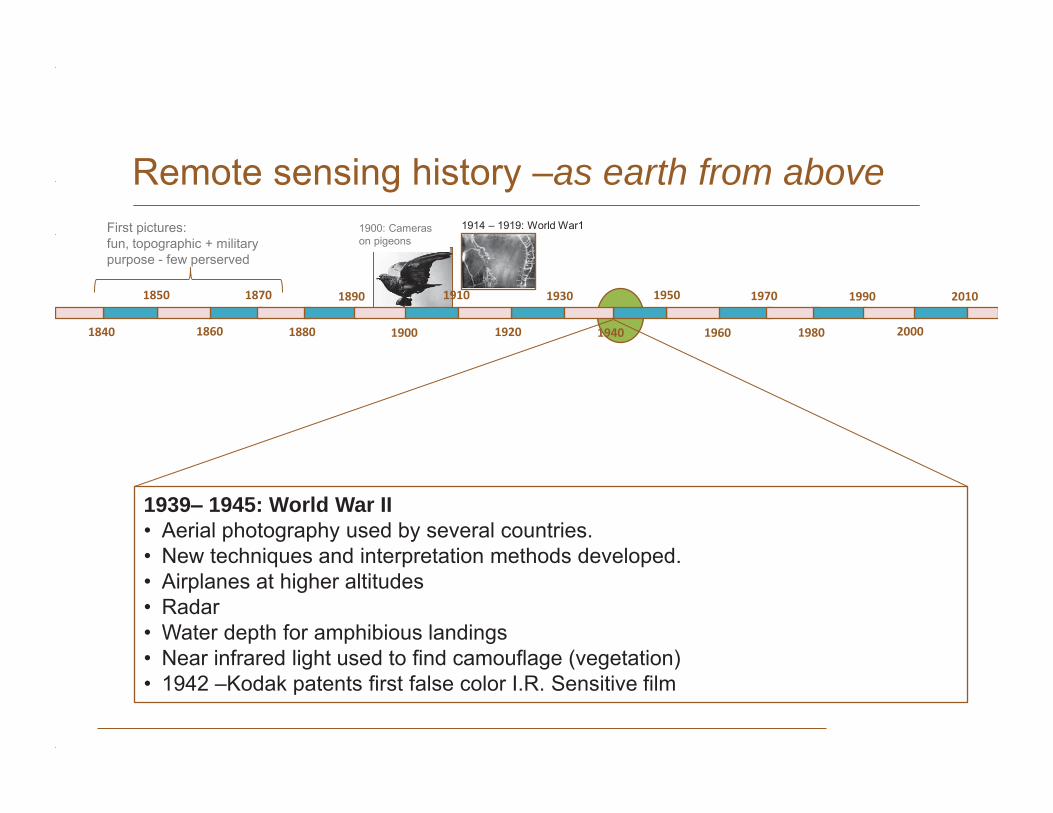
Remote sensing history –as earth from above First pictures: fun, topographic + military purpose - few perserved
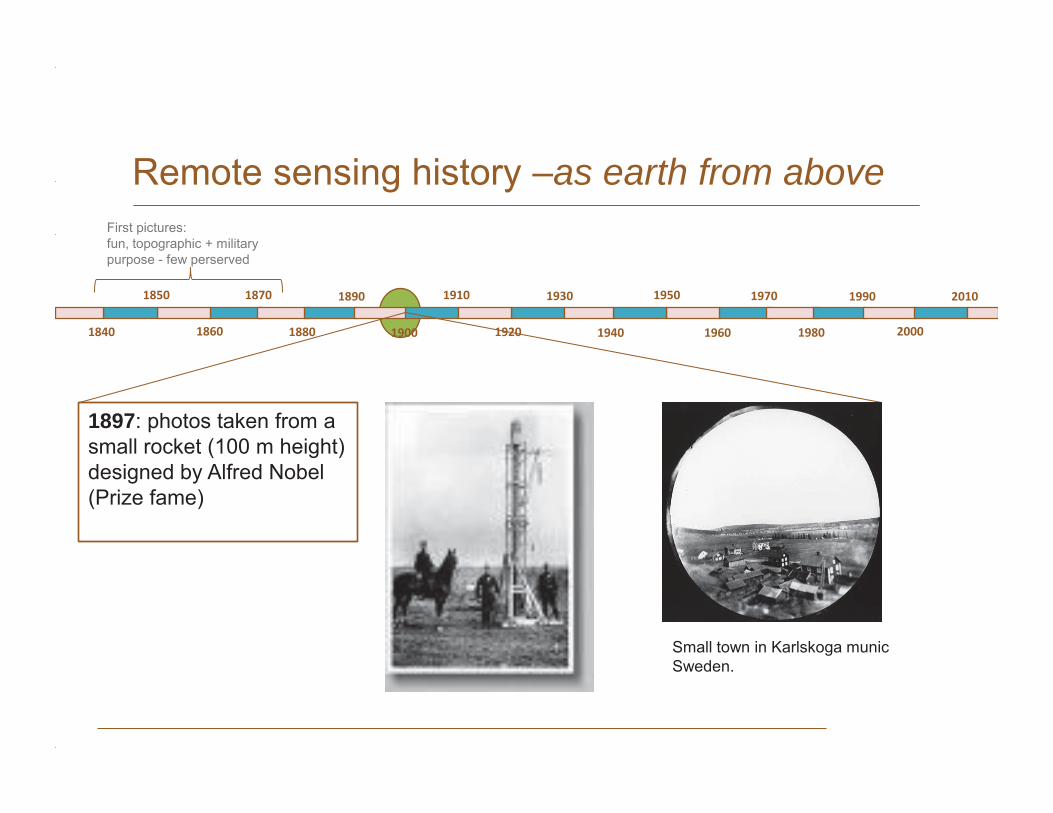
1897: photos taken from a small rocket (100 m height) designed by Alfred Nobel (Prize fame)
Small town in Karlskoga munic Sweden.
1900 1840 1860 1880 1920 1940 1960 1980 2000
1850 1870 1890 1930 1910 1950 1970 1990 2010
Remote sensing history –as earth from above First pictures: fun, topographic + military purpose - few perserved
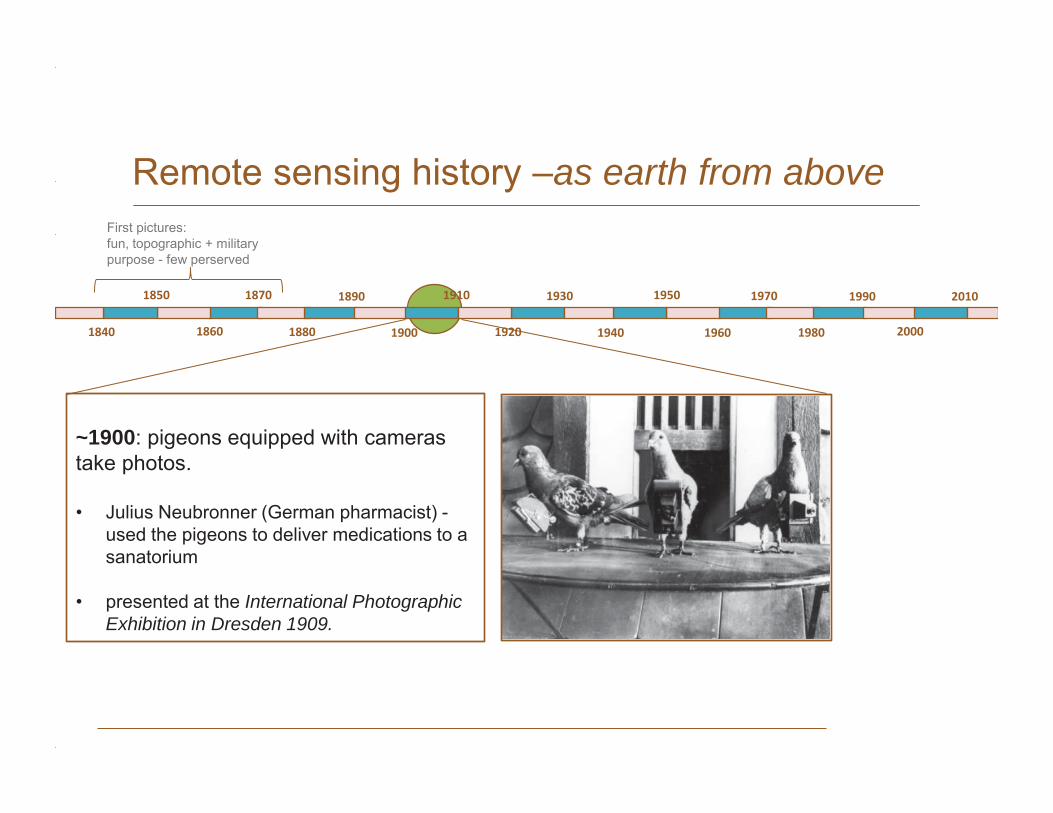
~1900: pigeons equipped with cameras take photos. • Julius Neubronner (German pharmacist) -
used the pigeons to deliver medications to a sanatorium
• presented at the International Photographic Exhibition in Dresden 1909.
Remote sensing history –as earth from above Cameras on pigeons
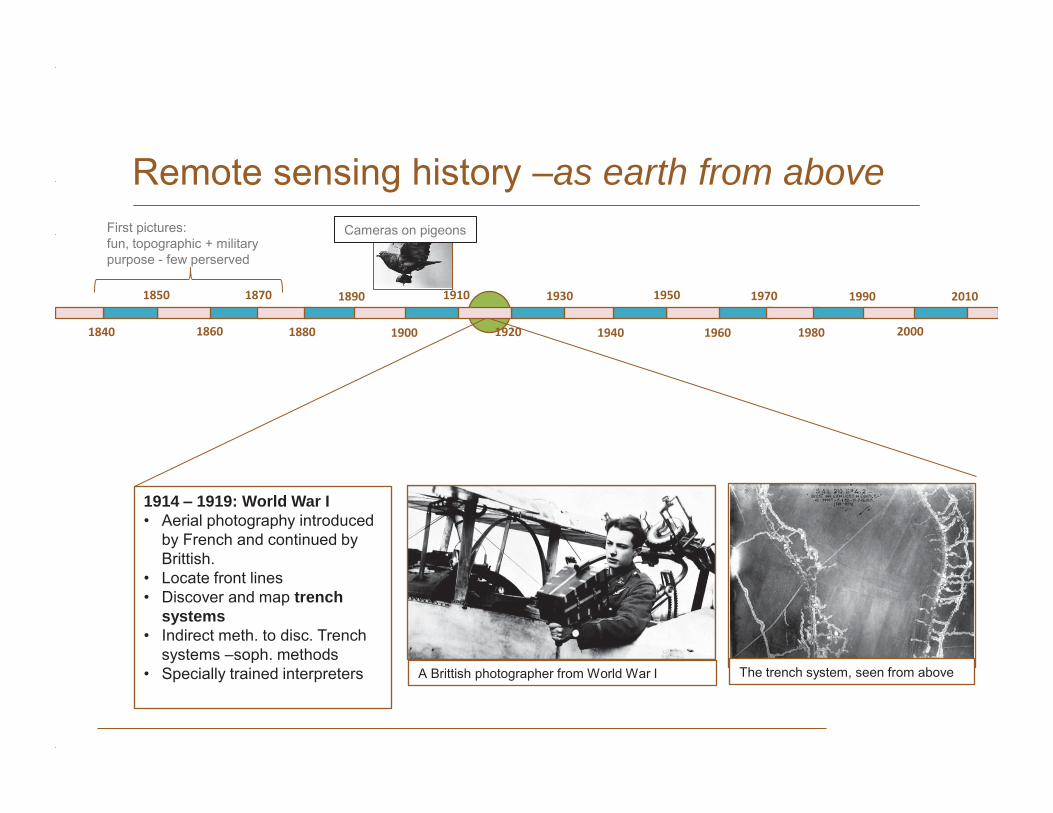
1914 – 1919: World War I • Aerial photography introduced
by French and continued by Brittish.
• Locate front lines • Discover and map trench
systems • Indirect meth. to disc. Trench
systems –soph. methods • Specially trained interpreters
A Brittish photographer from World War I The trench system, seen from above
1900 1840 1860 1880 1920 1940 1960 1980 2000
1850 1870 1890 1930 1910 1950 1970 1990 2010
First pictures: fun, topographic + military purpose - few perserved
Remote sensing history –as earth from above 1900: Cameras on pigeons
1939– 1945: World War II • Aerial photography used by several countries. • New techniques and interpretation methods developed. • Airplanes at higher altitudes • Radar • Water depth for amphibious landings • Near infrared light used to find camouflage (vegetation) • 1942 –Kodak patents first false color I.R. Sensitive film
1900 1840 1860 1880 1920 1940 1960 1980 2000
1850 1870 1890 1930 1910 1950 1970 1990 2010
First pictures: fun, topographic + military purpose - few perserved
1914 – 1919: World War1
Remote sensing history –as earth from above 1900: Cameras on pigeons
1939– 1945: World War II
1900 1840 1860 1880 1920 1940 1960 1980 2000
1850 1870 1890 1930 1910 1950 1970 1990 2010
First pictures: fun, topographic + military purpose - few perserved
1914 – 1919: World War1
1946: First space photograph from V-2 rockets. Cameras took images as the rockets ascended.
Remote sensing history –as earth from above 1900: Cameras on pigeons
1939– 1945: World War II
1900 1840 1860 1880 1920 1940 1960 1980 2000
1850 1870 1890 1930 1910 1950 1970 1990 2010
First pictures: fun, topographic + military purpose - few perserved
1914 – 1919: World War1
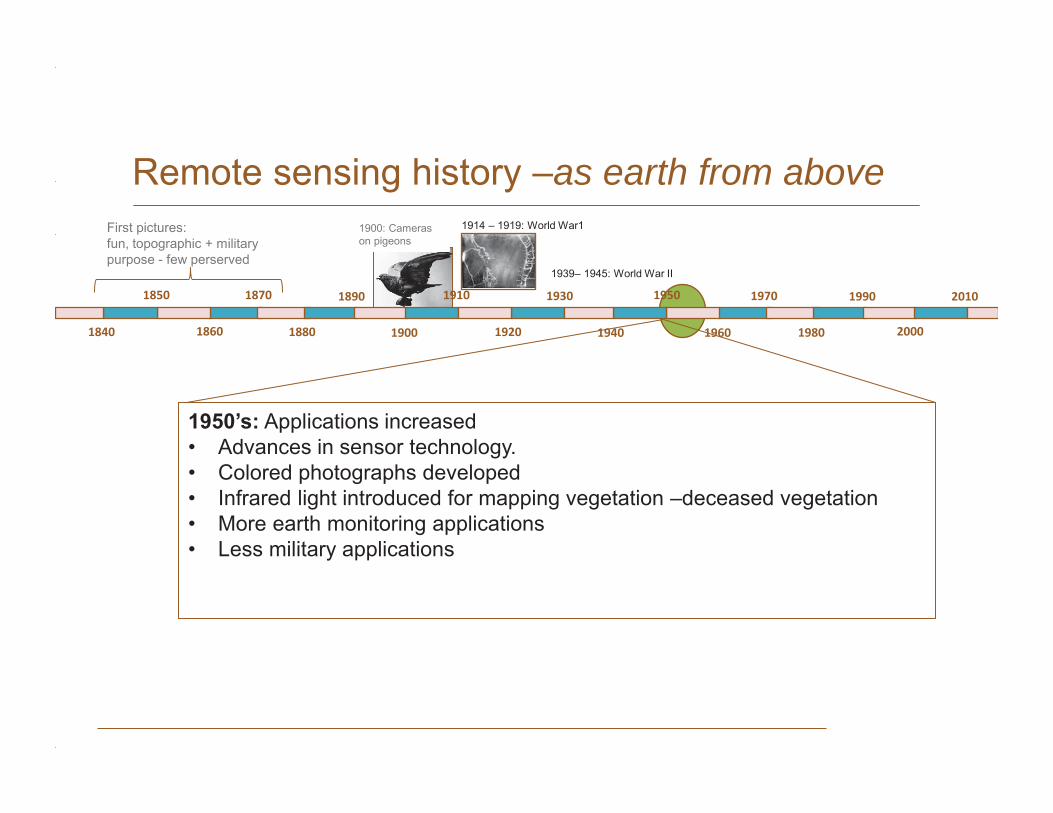
1950’s: Applications increased • Advances in sensor technology. • Colored photographs developed • Infrared light introduced for mapping vegetation –deceased vegetation • More earth monitoring applications • Less military applications
Remote sensing history –as earth from above 1900: Cameras on pigeons
1939– 1945: World War II
1900 1840 1860 1880 1920 1940 1960 1980 2000
1850 1870 1890 1930 1910 1950 1970 1990 2010
First pictures: fun, topographic + military purpose - few perserved
1914 – 1919: World War1
1960: The term ”remote sensing” is established Satellite remote sensing era begins: CORONA satellite system developes 1961: The Zenit 2 program 1961 (Soviet Union) 1960: TIROS: first Meteorological satellite -purpose to detect clouds
• Cold War intensifies. • US search for signs of
military activity • Air planes shot down
need for satellites. • These satellites were active
between 1960 and 1972. • Unknown until 1995. • Valuable for researchers –
land cover changes
Remote sensing history –as earth from above 1900: Cameras on pigeons
1939– 1945: World War II
1900 1840 1860 1880 1920 1940 1960 1980 2000
1850 1870 1890 1930 1910 1950 1970 1990 2010
First pictures: fun, topographic + military purpose - few perserved
1914 – 1919: World War1
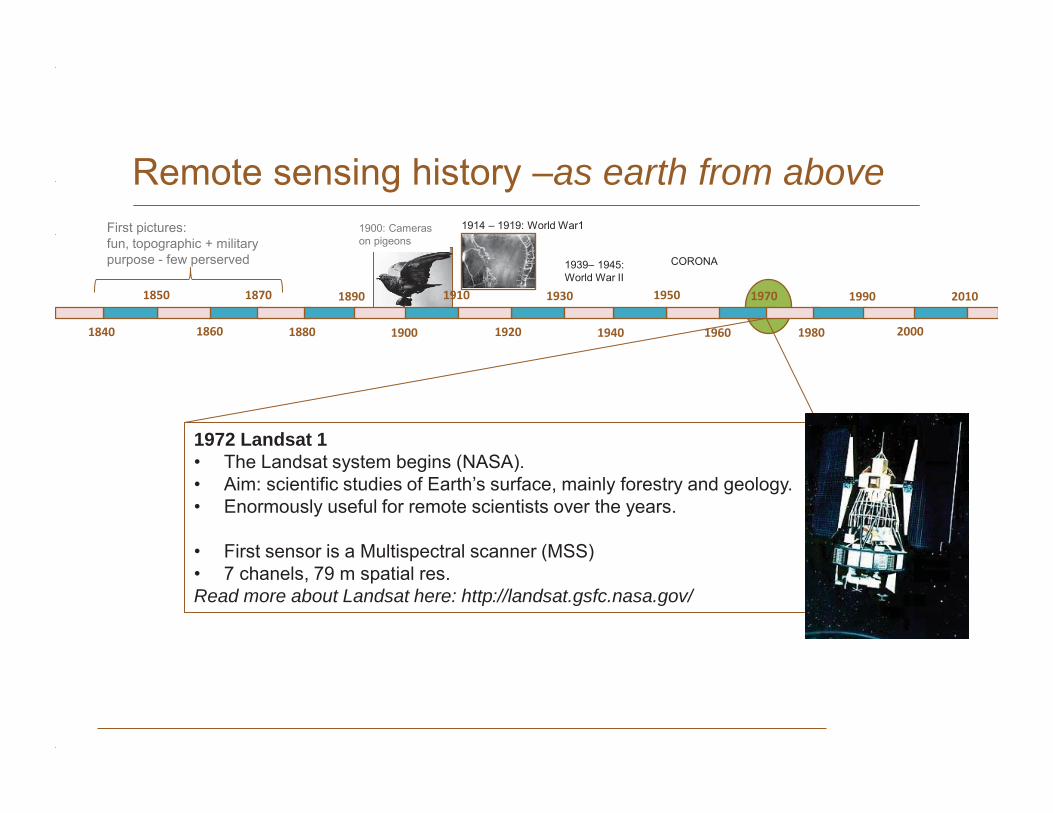
1972 Landsat 1 • The Landsat system begins (NASA). • Aim: scientific studies of Earth’s surface, mainly forestry and geology. • Enormously useful for remote scientists over the years.
• First sensor is a Multispectral scanner (MSS) • 7 chanels, 79 m spatial res. Read more about Landsat here: http://landsat.gsfc.nasa.gov/
CORONA
Remote sensing history –as earth from above 1900: Cameras on pigeons
1939– 1945: World War II
1900 1840 1860 1880 1920 1940 1960 1980 2000
1850 1870 1890 1930 1910 1950 1970 1990 2010
First pictures: fun, topographic + military purpose - few perserved
1914 – 1919: World War1
More satellites start to develop: 1977: Meteosat Launch of Meteosat-1, the first European weather satellite. Provide visible and IR day/night cloud cover data 1980: NOAA AVHRR (Advanced Very High Resolution Radiometer): 5 chanels, spatial resolution 1 km 1975 – 1984 Landsat 2-5. 1986 SPOT 1 (Systeme Probatorie de la Obsercation de la Terre). French satellite system
CORONA Landsat
NOAA, Meteosat SPOT
Remote sensing history –as earth from above 1900: Cameras on pigeons
1939– 1945: World War II
1900 1840 1860 1880 1920 1940 1960 1980 2000
1850 1870 1890 1930 1910 1950 1970 1990 2010
First pictures: fun, topographic + military purpose - few perserved
1914 – 1919: World War1
1990’s and 2000 Many new satellite systems develop Satellites in ongoing systems are launched (Landsat /SPOT /Meteosat Radar satellites 1999: IKONOS (spat. Res. 0.8 – 4 m) 1999: MODIS TERRA/AQUA Moderate Resolution Imaging Spectroradiometer: 36 chanels 2001 Quickbird (spat. Res. 60 – 70 cm)
CORONA Landsat
NOAA, Meteosat SPOT
Learning objectives
Knowledge and understanding:
• History of remote sensing – important mile stones
• Basics of radiation theory, wavelength bands and false color composites
• Theory and technique behind: aerial photographs, digital photographs, digital sensors/scanners
• Digital image processing techniques
• Key terminology used in the lecture
Skills and abilities
• Apply the appropriate remote sensing analysis product for a certain purpose
• Discuss and compare advantages and disadvantages between different image techniques
• Discuss the trade of between different kinds of resolutions
• Present examples of different image processing techniques and when they are applicable
Sun is the source...
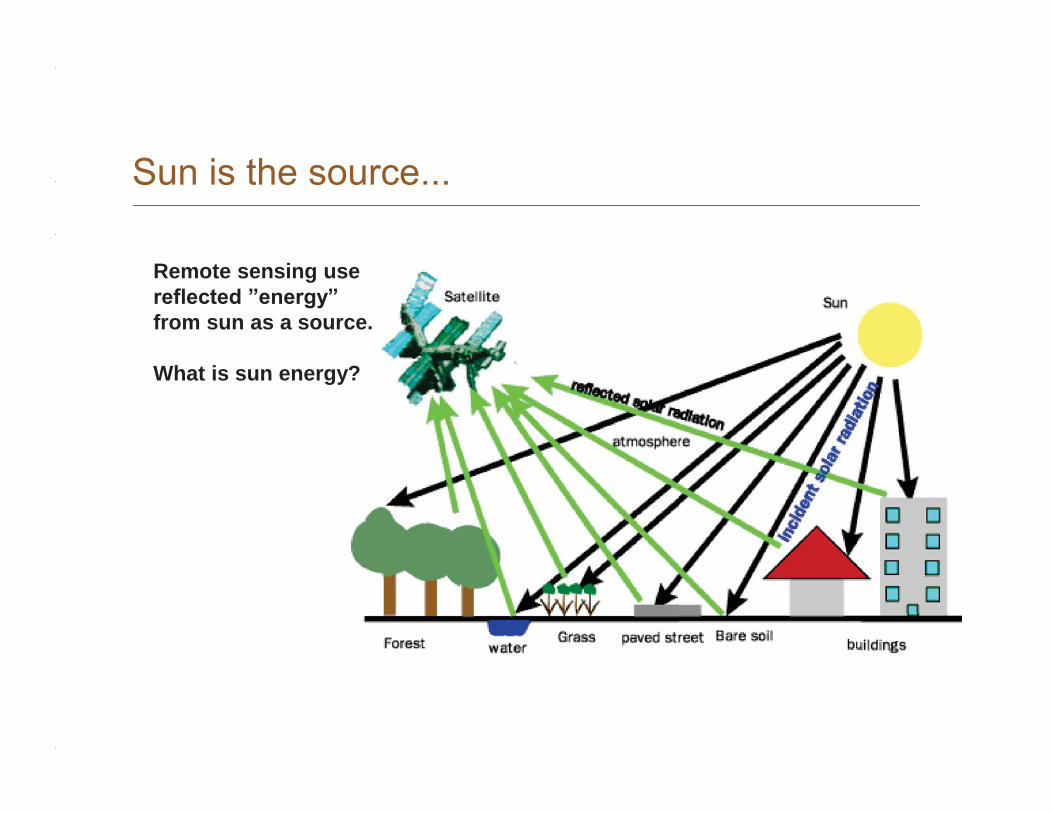
Remote sensing use reflected ”energy” from sun as a source. What is sun energy?
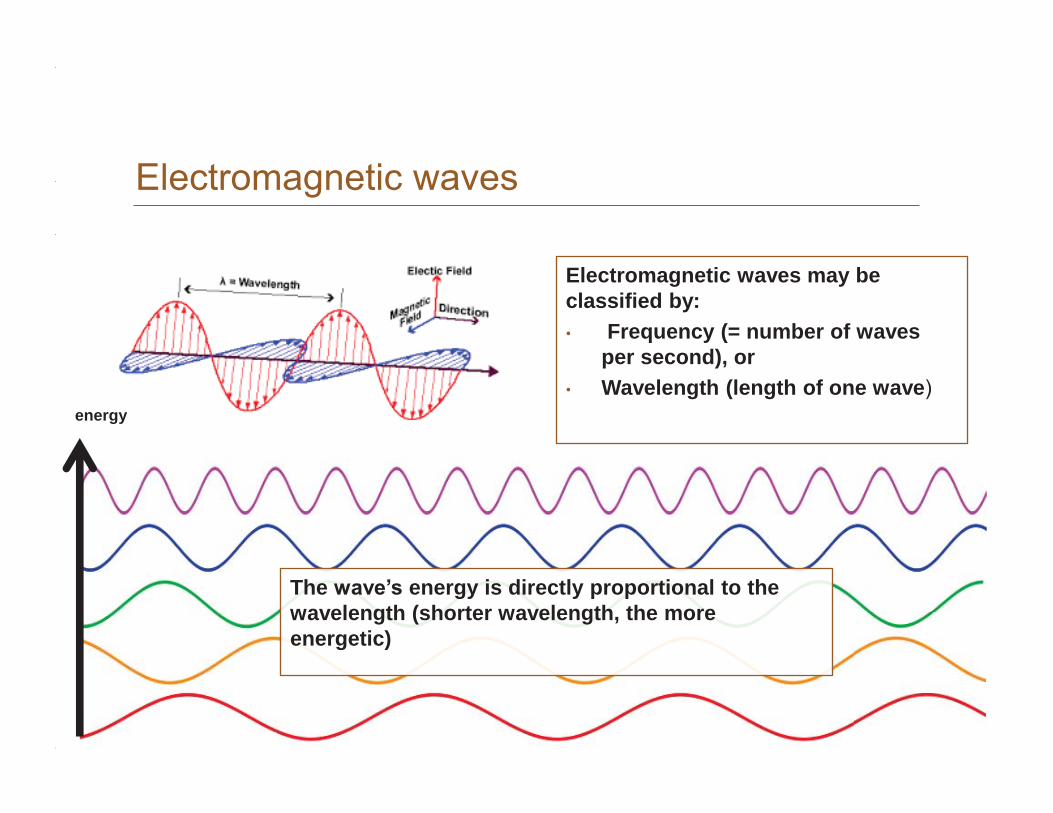
Electromagnetic waves
Electromagnetic waves may be classified by: • Frequency (= number of waves
per second), or • Wavelength (length of one wave)
The wave’s energy is directly proportional to the wavelength (shorter wavelength, the more energetic)
energy
The electromagnetic spectrum
• Visible part is small
• Photographs use mainly VIS
• Near infrared to some extent
Reflectance
White
Black
Blue
High reflectance in all visible wavelengths
Low reflectance in all visible wavelengths
High reflectance in blue and low reflectance in all other visible wavelengths
Reminder: All objects reflect electromagnetic waves differently different colors. It is the reflected light that we sense as colors.
blue green red
blue green red
blue green red
Spectral reflectance signatures
It is the different properties in reflectance in different wavelengths that makes up the images
The spectral reflectance signature curves = how different material reflects different wavelengths.
green grass low ref. in VIS, except for a peak in green high refl. in NIR
Soil greater ref. the longer the wavelengths Water absorber in most regions Dry grass higher reflectance in VIS than green grass
Photograph/sensors detect specific wavelengths
Visible wavelength bands: blue (0.4 – 0.46) μm green (0.50 – 0.59) μm red (0.61 – 0.68) μm Infrared near infrared (0.7 – 1.2) μm thermal (only multispectral scanners) Panchromatic Visible (0.4 – 0-7) μm parts of infrared
Wavelength bands –width of the bands varies among the sensors!
No specific borderline..
Color Airphoto = multispectral photograph
Information from 3 wavelength bands are used • Blue • Green • Red
... to create 1 value for each pixel in the image Same principle for film photograph as digital image, BUT: the process is very different...
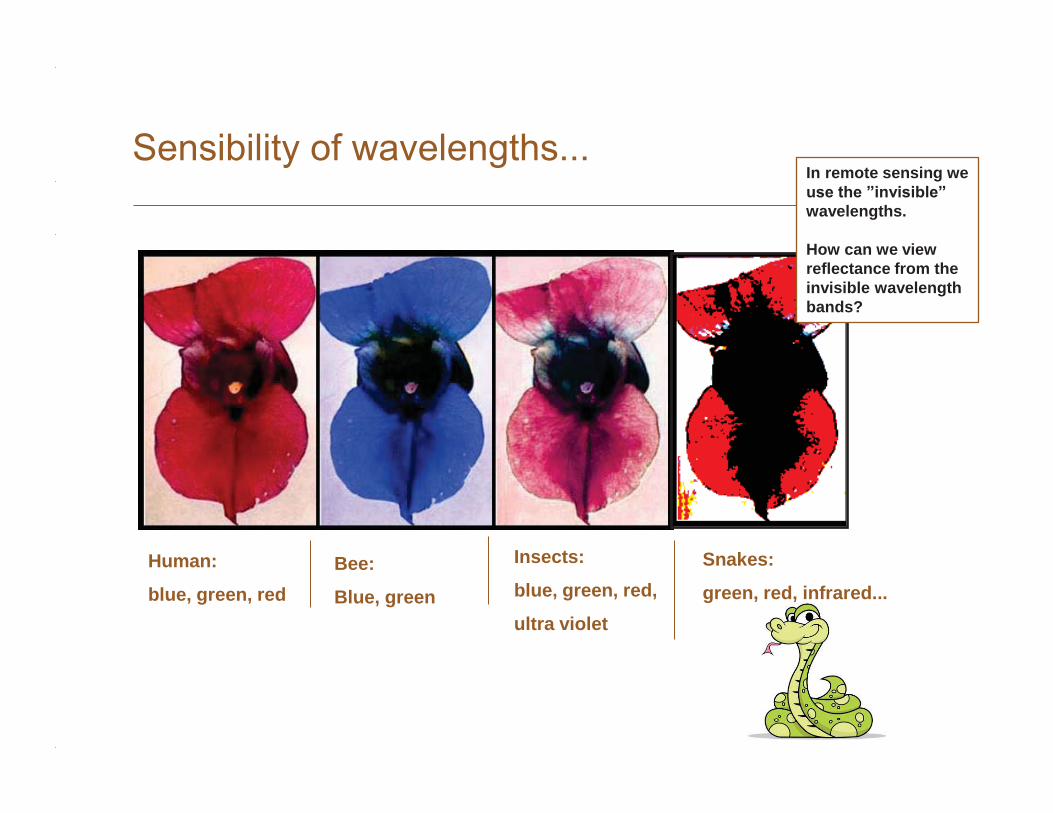
Human:
blue, green, red Bee:
Blue, green
Insects:
blue, green, red,
ultra violet
Snakes:
green, red, infrared...
Sensibility of wavelengths... In remote sensing we use the ”invisible” wavelengths. How can we view reflectance from the invisible wavelength bands?
False color composite = multispectral image
Ref. in green
Ref. in red
Ref. in NIR
green color Blue color red color
How can we visualize the information from NIR?
False color composite = multispectral image
Ref. in green
Ref. in red
Ref. in NIR
green color Blue color red color
This combination is common for vegetation properties
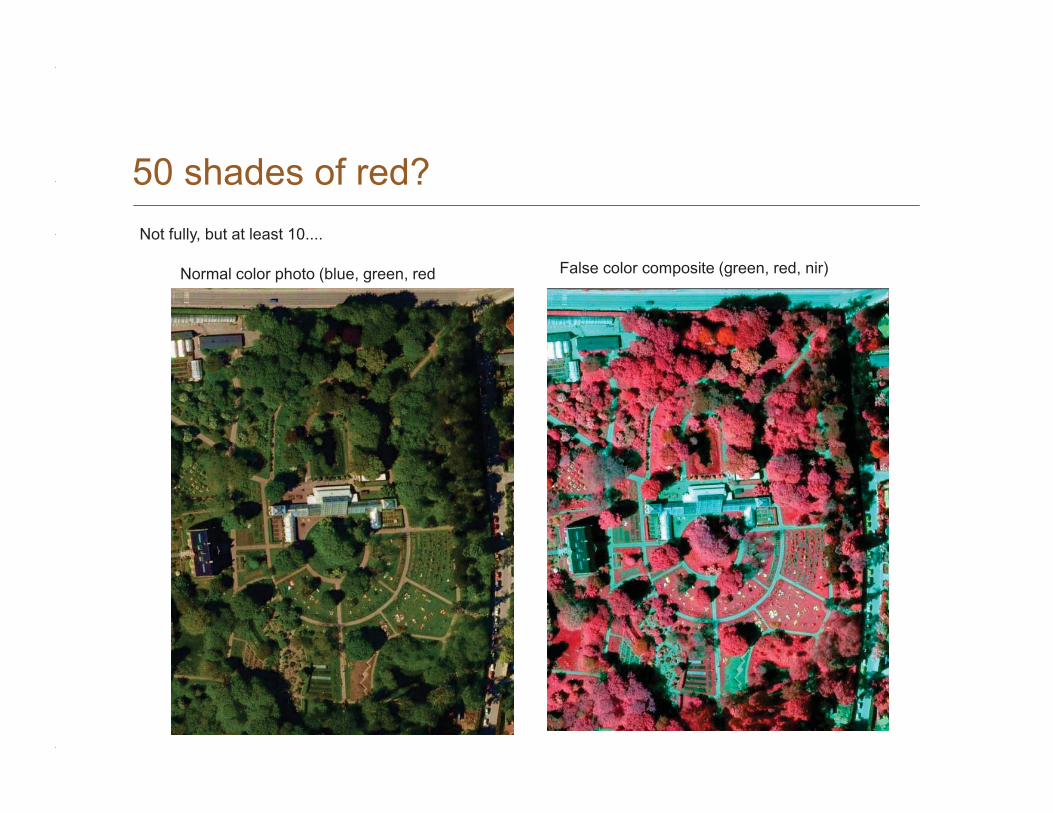
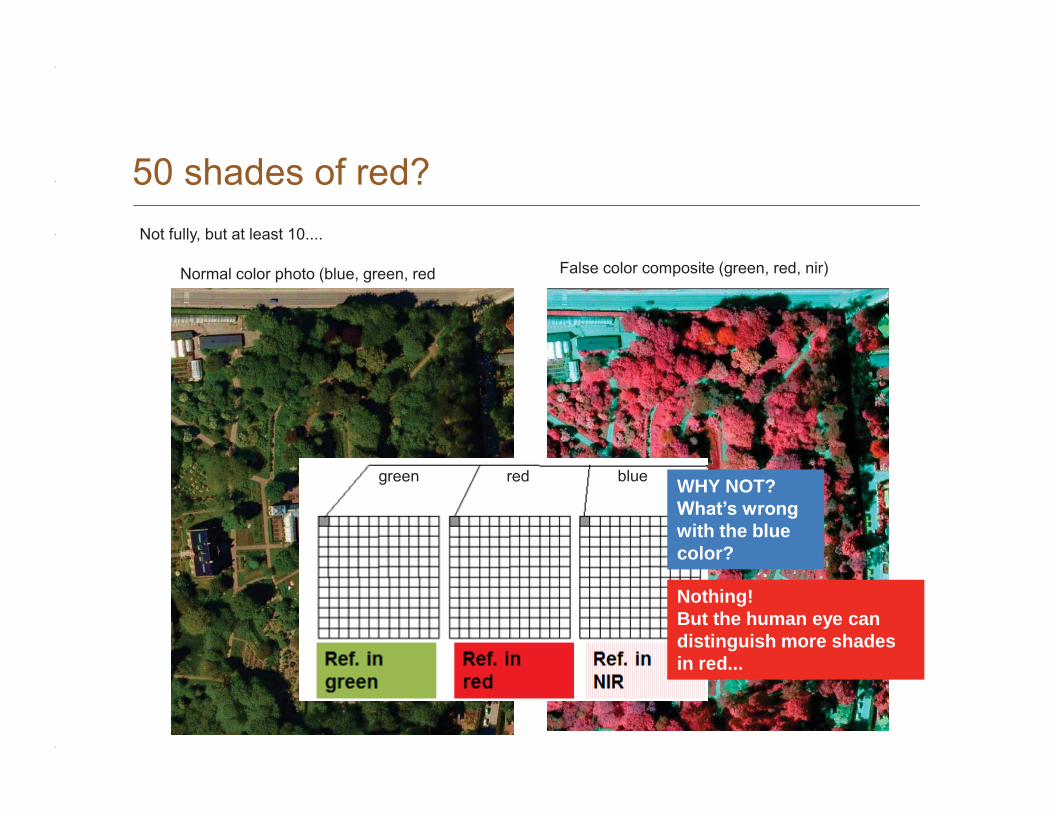
50 shades of red? Not fully, but at least 10....
Normal color photo (blue, green, red False color composite (green, red, nir)
50 shades of red? Not fully, but at least 10....
Normal color photo (blue, green, red False color composite (green, red, nir)
green red blue WHY NOT? What’s wrong with the blue color?
50 shades of red? Not fully, but at least 10....
Normal color photo (blue, green, red False color composite (green, red, nir)
green red blue WHY NOT? What’s wrong with the blue color?
Nothing! But the human eye can distinguish more shades in red...
Infrared wavelengths provide info. about the vegetation.
• Green = soil
• Red = vegetation
Landsat ETM+ 30 m
Example of a “False Color Composite”
Infrared wavelengths provide info. about the vegetation.
• Green = soil
• Red = vegetation
Landsat ETM+ 30 m
Example of a “False Color Composite”
Eslöv Ringsjöarna
LUND
Vomb Södra Sandby
•Hörby
Höör
Learning objectives
Knowledge and understanding:
• History of remote sensing – important mile stones
• Basics of radiation theory, wavelength bands and false color composites
• Theory and technique behind: aerial photographs, digital photographs, digital sensors/scanners
• Digital image processing techniques
• Key terminology used in the lecture
Skills and abilities
• Apply the appropriate remote sensing analysis technique (satellite/aerial, image band, vegetation indices) for a certain purpose
• Discuss and compare advantages and disadvantages between different image techniques
• Discuss the trade of between different kinds of resolutions
• Present examples of different image processing techniques and when they are applicable
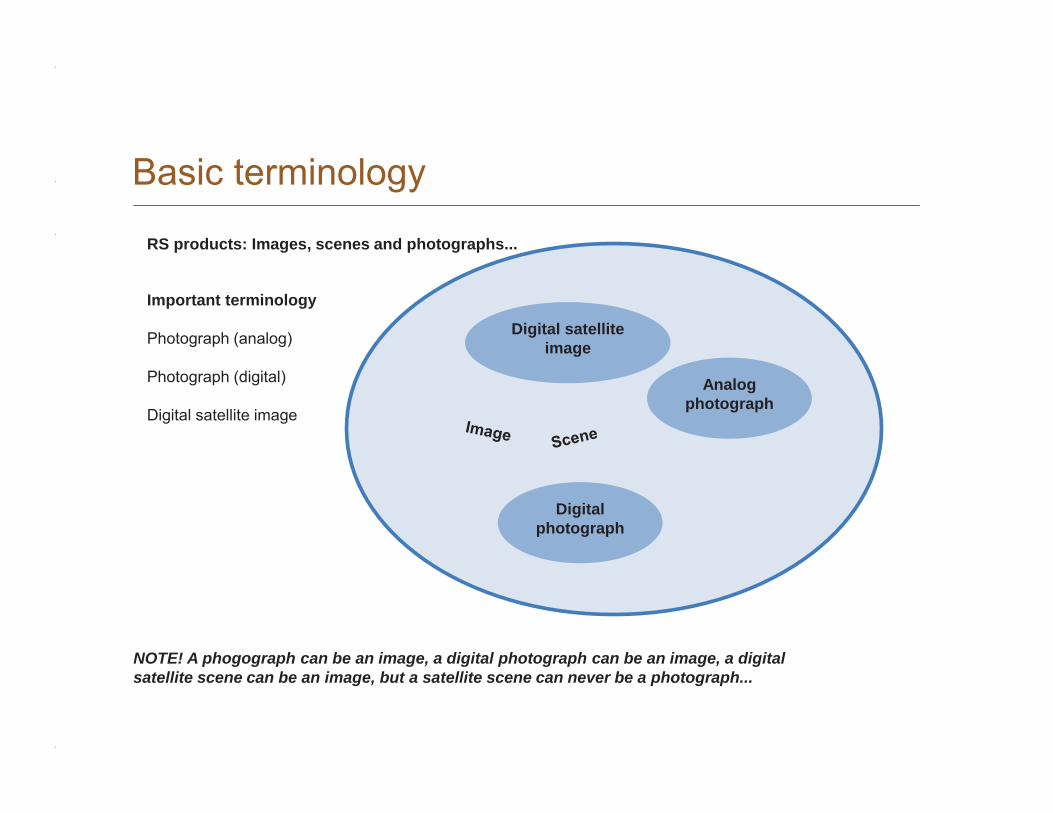
Basic terminology
Important terminology Photograph (analog) Photograph (digital) Digital satellite image
Analog photograph
Digital photograph
Digital satellite image
NOTE! A phogograph can be an image, a digital photograph can be an image, a digital satellite scene can be an image, but a satellite scene can never be a photograph...
RS products: Images, scenes and photographs...
Photographs (analog)
• Chemical process –the signal (reflection) is captured on a photographic film
• Film is made of layers of light-sensitive halide emulsion, exposed to light in the camera
• Image created when the film is ”developed” (put into a solution of chemicals in a dark room.
• Spatial resolution (level of detail) depend on the area of film and grain. Grain = appearance of silver salts.
Aerial photographs
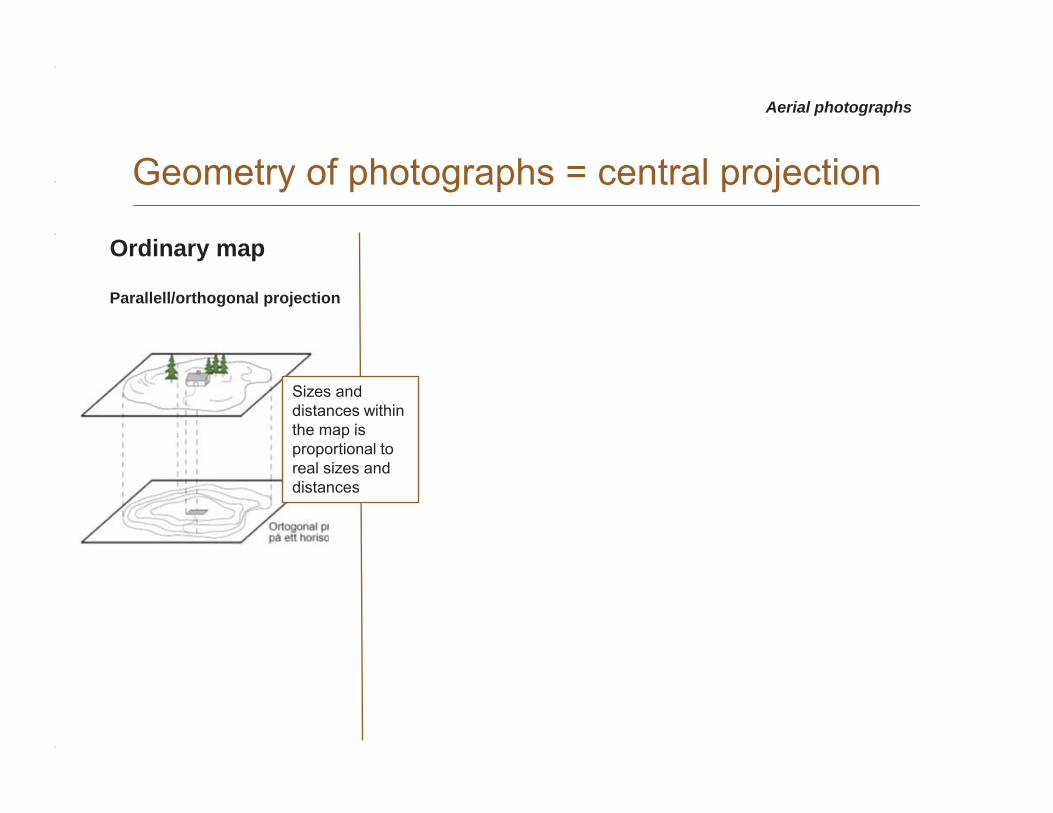
Geometry of photographs = central projection
Parallell/orthogonal projection
Aerial photographs
Ordinary map
Sizes and distances within the map is proportional to real sizes and distances
Geometry of photographs = central projection
Parallell/orthogonal projection Central projection (aerial photographs)
Scale = d in photo/d on ground d = distance between 2 points
f = focal length, distance from lens to focal plane (film)
Projection center
camera
Scale = focal length/altitude
Aerial photographs
Parallell/orthogonal projection
lens
lens
Film (focal plane)
h = flight height (altitude abobe ground level)
• Projection center = where the camera lens receives the reflected light
• Focal length = the distance from the lens to the film (or focal plane), where the image is captured.
If the focal length would have been as long as the altitude, the scale would be 1:1.
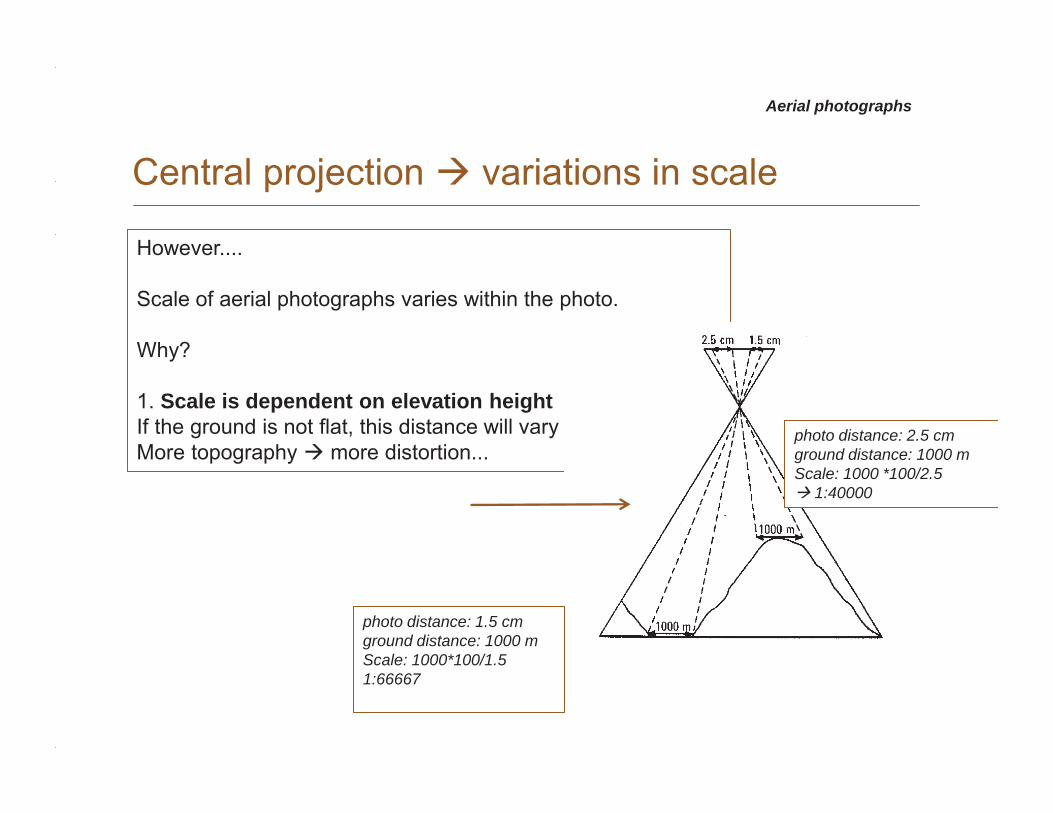
Central projection variations in scale
However.... Scale of aerial photographs varies within the photo. Why? 1. Scale is dependent on elevation height If the ground is not flat, this distance will vary More topography more distortion...
photo distance: 1.5 cm ground distance: 1000 m Scale: 1000*100/1.5 1:66667
photo distance: 2.5 cm ground distance: 1000 m Scale: 1000 *100/2.5
1:40000
Aerial photographs
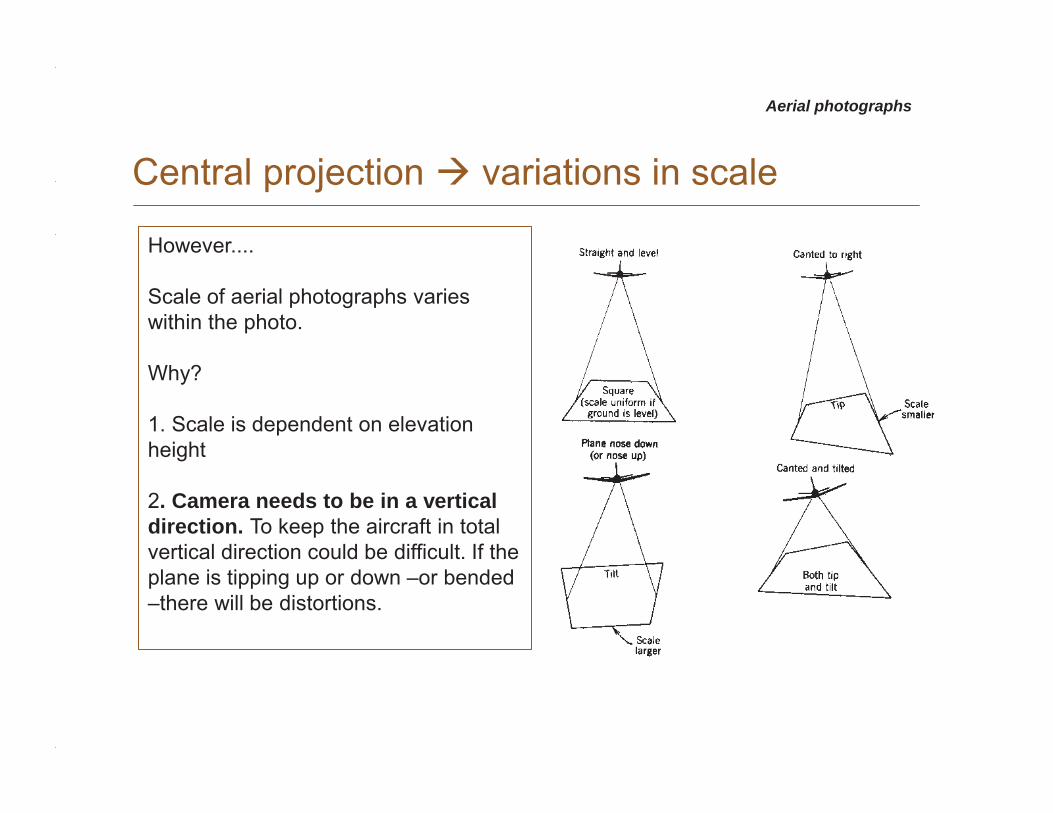
Central projection variations in scale
However.... Scale of aerial photographs varies within the photo. Why? 1. Scale is dependent on elevation height 2. Camera needs to be in a vertical direction. To keep the aircraft in total vertical direction could be difficult. If the plane is tipping up or down –or bended –there will be distortions.
Aerial photographs
Rectification
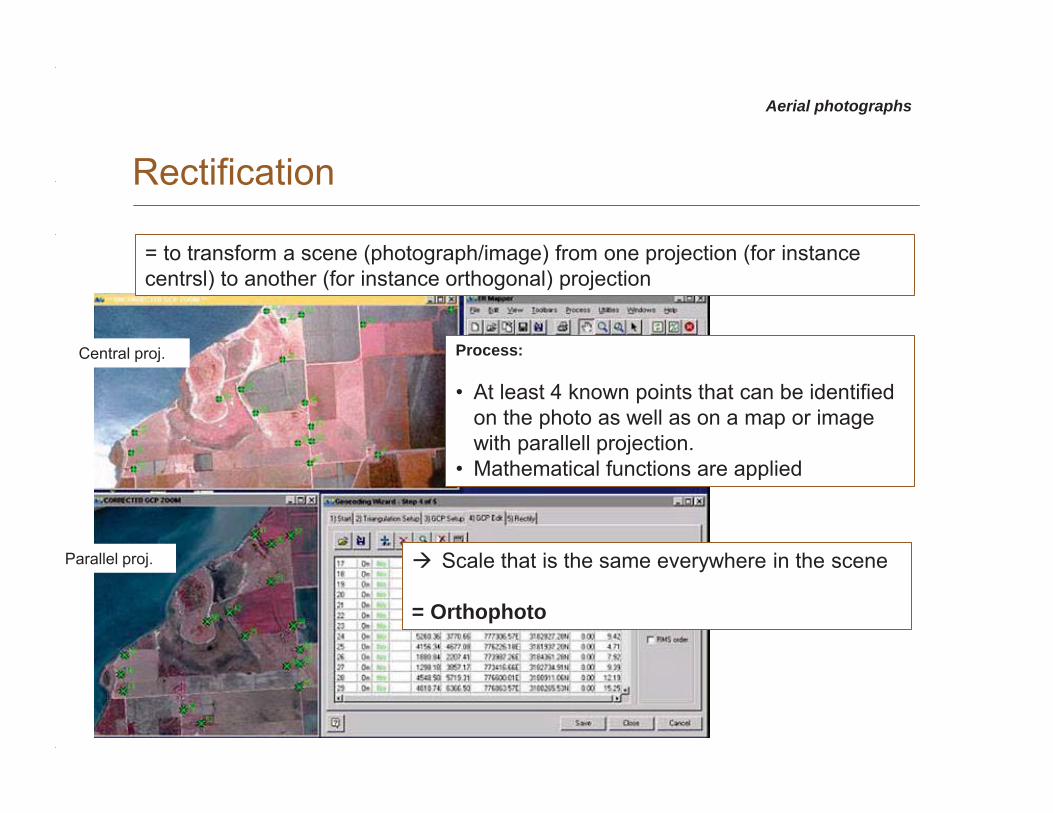
= to transform a scene (photograph/image) from one projection (for instance centrsl) to another (for instance orthogonal) projection
Process: • At least 4 known points that can be identified
on the photo as well as on a map or image with parallell projection.
• Mathematical functions are applied
Aerial photographs
Scale that is the same everywhere in the scene = Orthophoto
Central proj.
Parallel proj.
Aerial photographs are good for looking in 3D
Aerial photographs
Why?
Aerial photos used for 3D view
1. Hold up your left hand (tum) fairly close to your face
2. Hold up your right hand (tum) as far as you can reach
3. Close your right eye
4. Look at your right tum with your open eye
5. Switch eyes (open the eye that is closed and close the eye that is open)
Aerial photographs
What can you say about the distance between the two fingers?
Any difference depending on the eye that is open? In what way?
Stereo view –how does it work?
Did your near thumb "jump" left and right?
The difference in distance between the thumbs: = binocular disparity • Each eye sees a 2d image from a different angle
(eyes 60 mm apart) • The eyes transmit 2 images to the brain • The brain merge the images to the 3d-view
Why do we need 3D?
Aerial photographs
Stereo view –how does it work?
Did your near thumb "jump" left and right?
The difference in distance between the thumbs: = binocular disparity • Each eye sees a 2d image from a different angle
(eyes 60 mm apart) • The eyes transmit 2 images to the brain • The brain merge the images to the 3d-view
Why do we need 3D?
Possibility to interpret if moving objects are heading towards us or away from us.
Aerial photographs
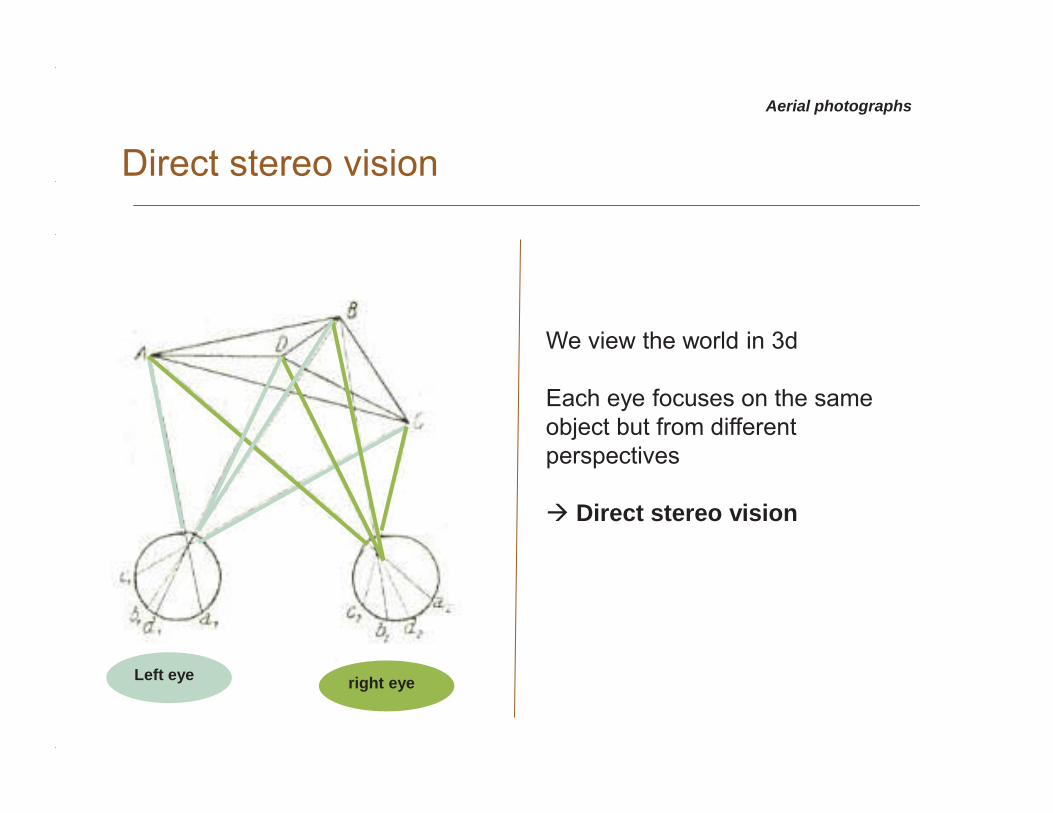
Direct stereo vision
We view the world in 3d Each eye focuses on the same object but from different perspectives
Direct stereo vision
Left eye right eye
Aerial photographs
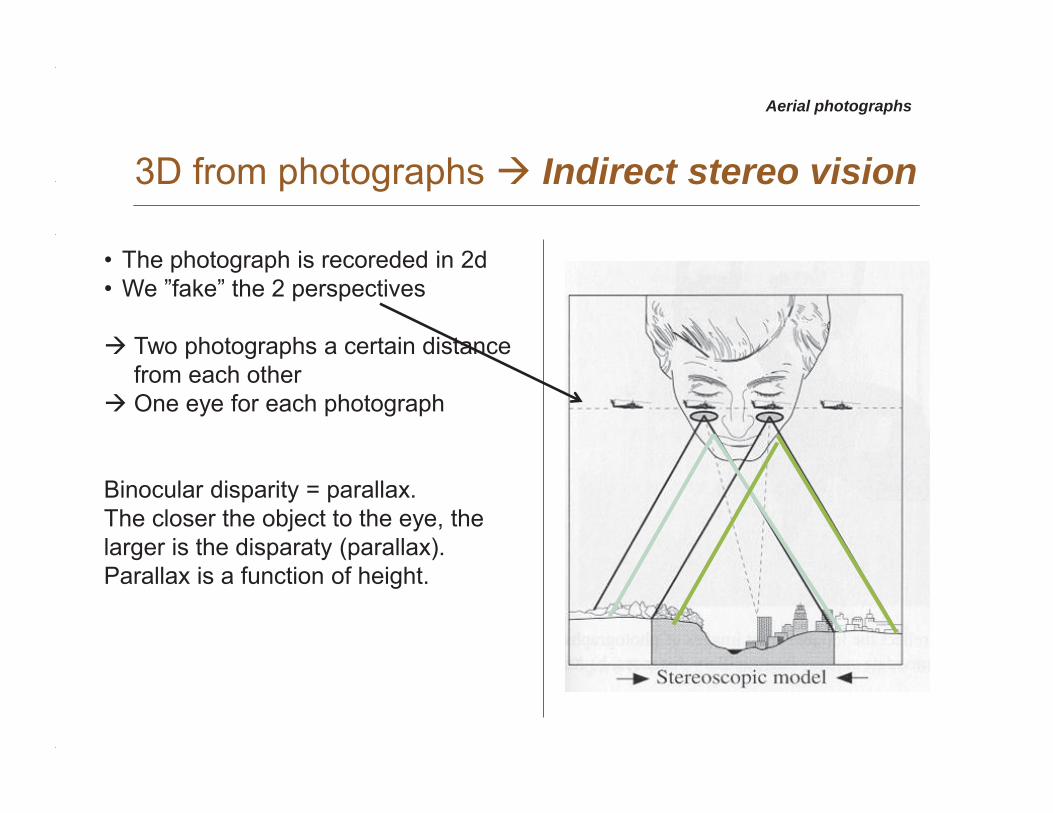
3D from photographs Indirect stereo vision
• The photograph is recoreded in 2d • We ”fake” the 2 perspectives
Two photographs a certain distance from each other One eye for each photograph
Binocular disparity = parallax. The closer the object to the eye, the larger is the disparaty (parallax). Parallax is a function of height.
Aerial photographs
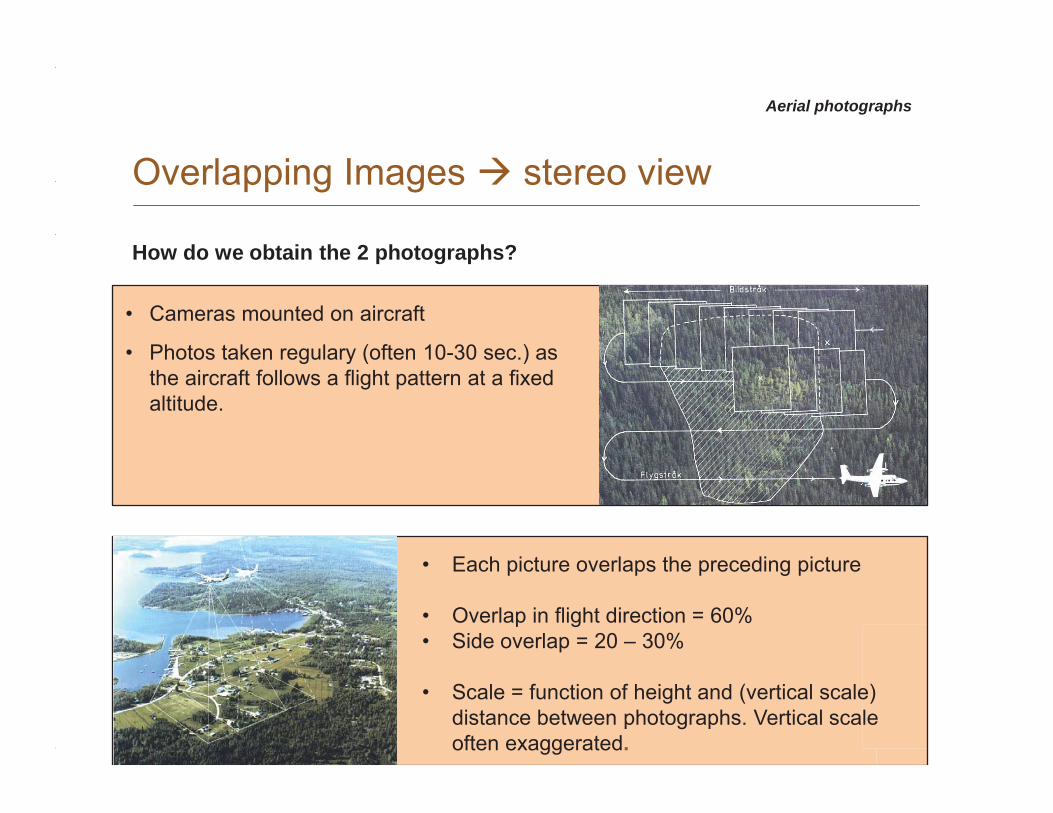
Overlapping Images stereo view
• Cameras mounted on aircraft
• Photos taken regulary (often 10-30 sec.) as the aircraft follows a flight pattern at a fixed altitude.
• Each picture overlaps the preceding picture • Overlap in flight direction = 60% • Side overlap = 20 – 30% • Scale = function of height and (vertical scale)
distance between photographs. Vertical scale often exaggerated.
Aerial photographs
How do we obtain the 2 photographs?
Stereoscope
• Helps the brain to look at 2 images i parallell mode • Magnifies the images
height = 6-12 cm
Aerial photographs
Pocket lens stereoscope • ~ 6 cm between the same point on the images
• Magnification: 2-4 times (depending on the
height • Restricted to small images or narrow parts of
larger images
Stereoscope
Aerial photographs
Mirror stereoscope (Wheatstone 1838) • Mirrors fool the distance between the viewing perspectives and
the photograph
The distance between the photographs can be longer (more than 6 cm between the same location on 2 images)
larger areas can be viewed and analysed
Quiz 1
Quiz 1
1. A road is 1 km long, but on the aerial photograph if covers only 4 cm. What is the scale of the photograph?
2. A camera has a focal length of 152 mm, and the plane’s altitude above ground level is 7600 m. What is the scale of the photograph?
3. A camera with a focal length of 305 mm was used to take photographs from 4000 meters above the main sea level.
• a, Find the scale at the location of point A (800 m above mean sea level), and point B (0 m above mean sea level).
• b, Imagine that a 400 m track is located on A and B. What would be the difference of size in cm on the photograph?
Quiz....
1. A road is 1 km long, but on the aerial photograph if covers only 4 cm. What is the scale of the photograph?
photo distance = 4 cm ground distance = 1 km 4/(1x100000) 1/25000
scale: 1:25000
Recall from earlier slide: Scale = d in photo/d on ground d = distance between 2 points
Quiz....
2. A camera has a focal length of 152 mm, and the plane’s altitude above ground level is 7600 m. What is the scale of the photograph?
Focal length = 152 mm Altitude = 7600 m
152/(7600x1000) 1/50000 scale: 1:50000
Recall from earlier slide: Scale = focal length/altitude
Quiz....
3. A camera with a focal length of 305 mm was used to take photographs from 4000 meters above the main sea level.
a, Find the scale at the location of point A (800 m above mean sea level), and point B (0 m above mean sea level).
Point A: 0.305/(4000-800) = 1:10490
Point B: 0.305/4000 = 1:13110
Recall from earlier slide: Scale = focal length/altitude
Quiz....
3. A camera with a focal length of 305 mm was used to take photographs from 4000 meters above the main sea level.
a, Find the scale at the location of point A (800 m above mean sea level), and point B (0 m above mean sea level).
0.305/(4000-800) = 1:10490
0.305/4000 = 1:13110
b, Imagine that a 400 m track is located on A and B. What would be the difference of the track length in cm on the photograph?
Ground distance = 400 m Scale: 1:10490) x cm = (400 * 100)/10490 = 3.81 cm
Ground distance = 400 m Scale 1/13110
= (400x100)/13110 x = 3.05 cm
Difference = 3.81 – 3.05 = 0,76 cm
Digital photograph = an image produced from a digital camera. Electronic detectors instead of film
• Sensor = matrix of of photodiodes = light sensitive detectors
• One photodiode in each photosite
• Detector sense an electrical current =amount of photons exposed during the exposure time
• 1 photodiode sense within 1 wavelength band
Each photosite sense blue, green or red wavelengths (Bayer pattern)
Still, the outcome could be a color image (composed of the amount of red, green and blue in each photosite). How is this possible?
Photosite = position in the matrix
Digital photographs
Digital photograph
Digital photographs
Photosite = position in the matrix
= an image produced from a digital camera. Electronic detectors instead of film
• Matrix of of photodiodes = light sensitive detectors
• One photodiode in each photosite
• Amount of photons are sensed during the exposure time electrical current
• Only 1 band can be sensed per photodiode
filter allows photodiodes to sense 1 color
Each photosite sense blue, green or red wavelengths (Bayer pattern)
Still, the outcome could be a color image (composed of the amount of red, green and blue in each photosite). How is this possible?
= an image produced from a digital camera. Electronic detectors instead of film
• Matrix of of photodiodes = light sensitive detectors
• One photodiode in each photosite
• Amount of photons are sensed during the exposure time electrical current
• Only 1 band can be sensed per photodiode
filter allows photodiodes to sense 1 color
Each photosite sense blue, green or red wavelengths(Bayer pattern)
Still, the outcome could be a color image (composed of the amount of red, green and blue in each photosite). How is this possible?
Solution is Interpolation
The missing colors are interpolated from surrounding photosites of the same color
Multispectral cameras
Digital photographs
= each photosite has 2-3 photodiodes
Reflectance in 2 – 3 wavelengthbands simultaneously
What makes it digital?
The photodiodes generate an electrical signal that corresponds to the energy
…converts the electronic signal to a digital number
A-to-D converter
Digital number = DN number = brightness value = pixel value = average radiance
Digital data
Looks like a photograph from fillm. BUT: The digital image is composed of pixels.
Clemenstorget, Lund
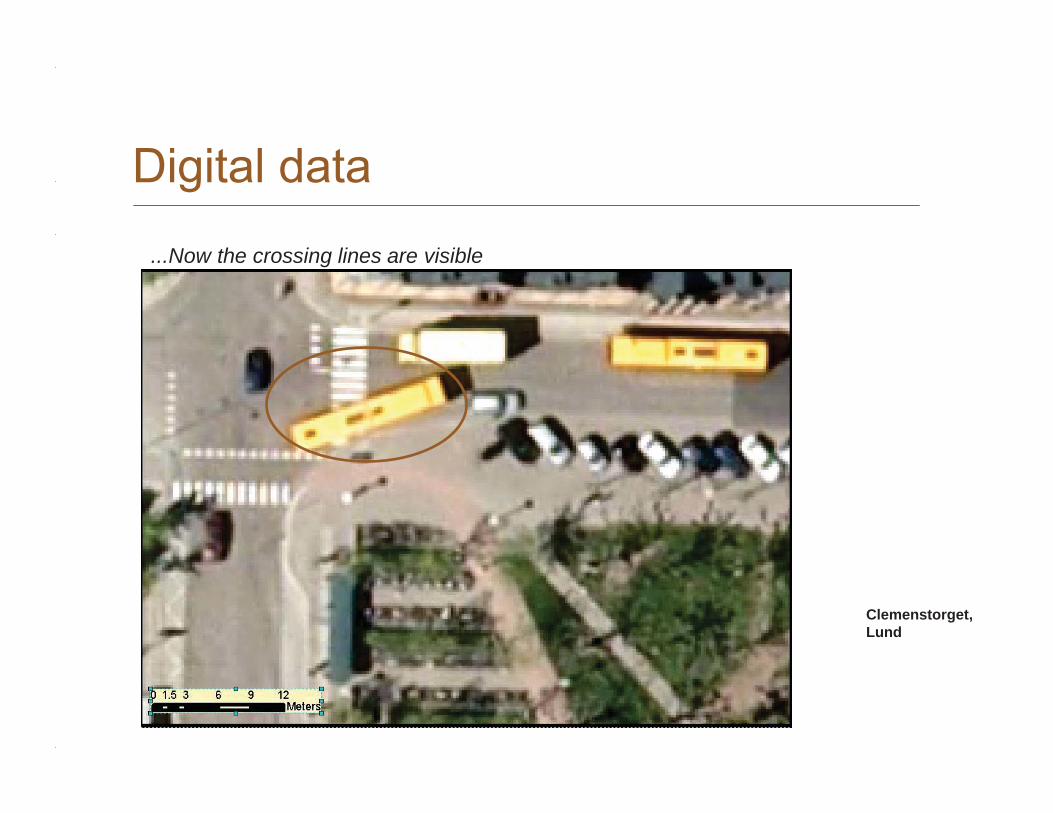
Digital data
...Now the crossing lines are visible
Clemenstorget, Lund
Digital data
Is the resolution increased?
Clemenstorget, Lund
Digital data
Now each pixel is clearly viewable
Clemenstorget, Lund
Digital data
The digital number = the brightness level of the pixel. What do you think is the range? Why?
Digital data
Black = 0 White = 255 The range goes from 0 to 255 Why?
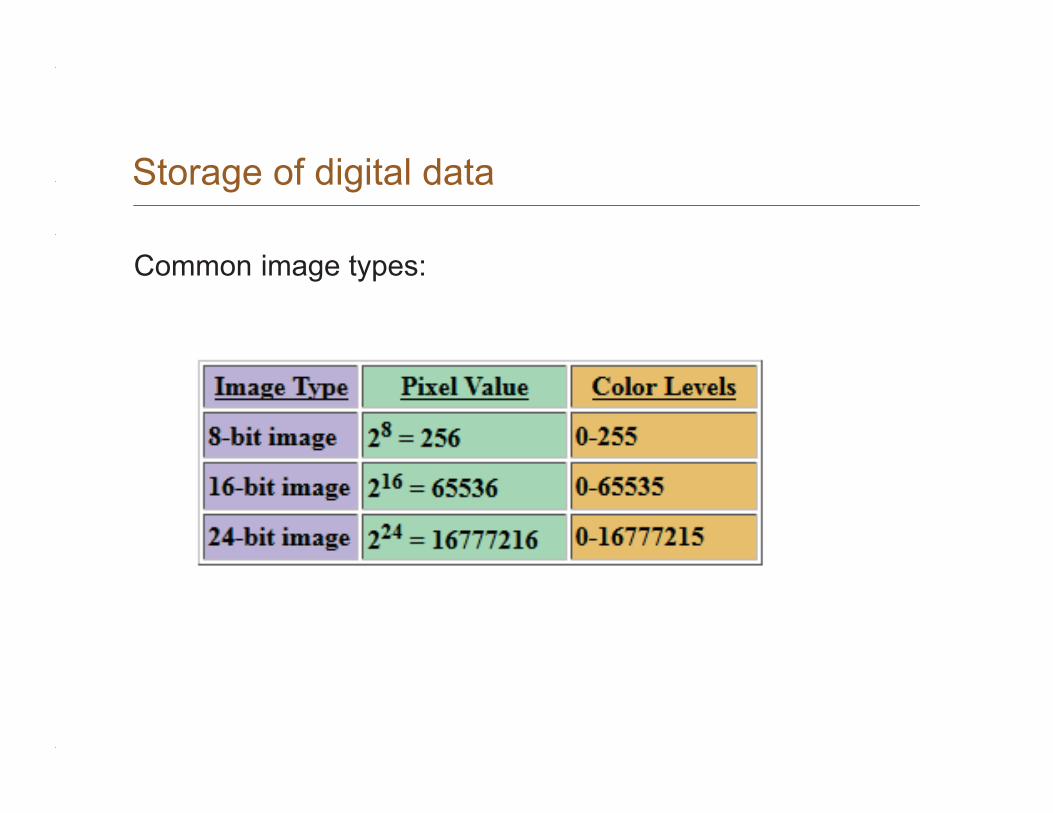
DN-numbers
The digital numbers are stored in the computer in bits in the form of binary digits which vary from 0 to a power of 2.
Each bit records an exponent of power 2
The number of brightness values depend on the number of bits per pixel for storage. This is called image type.
Number of bits = Color depth = quantization level
Storage of digital data
Common image types:
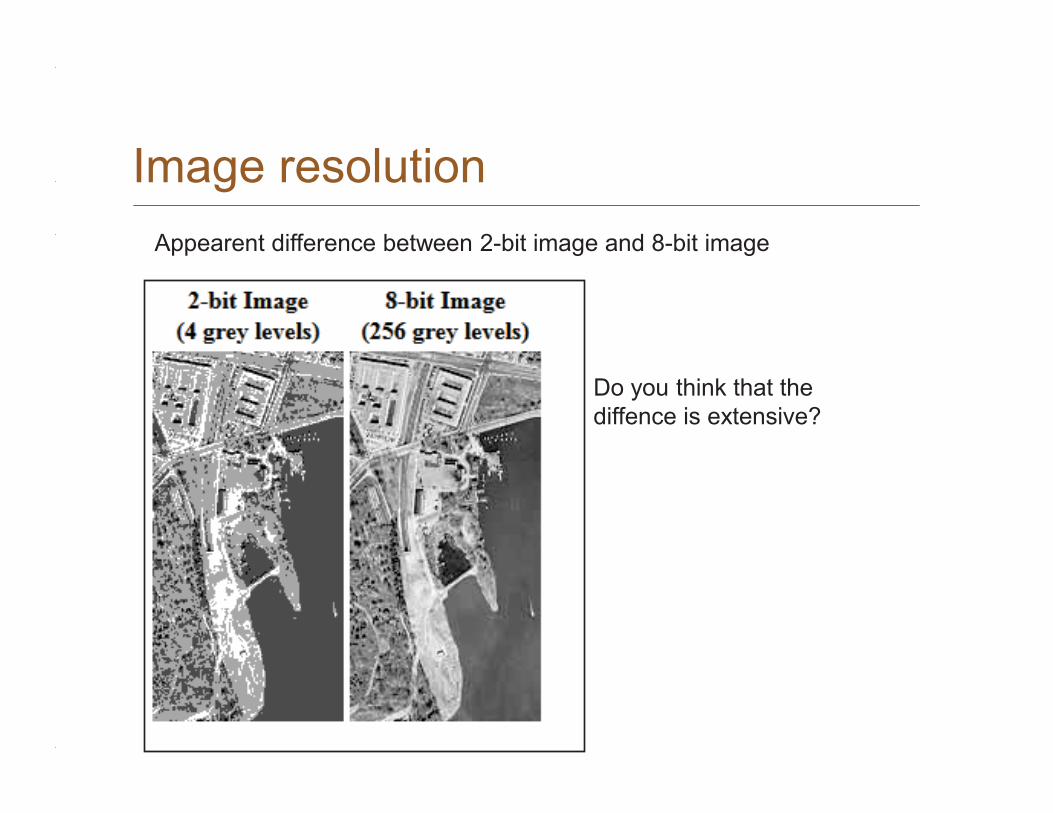
Image resolution Appearent difference between 2-bit image and 8-bit image
Do you think that the diffence is extensive?
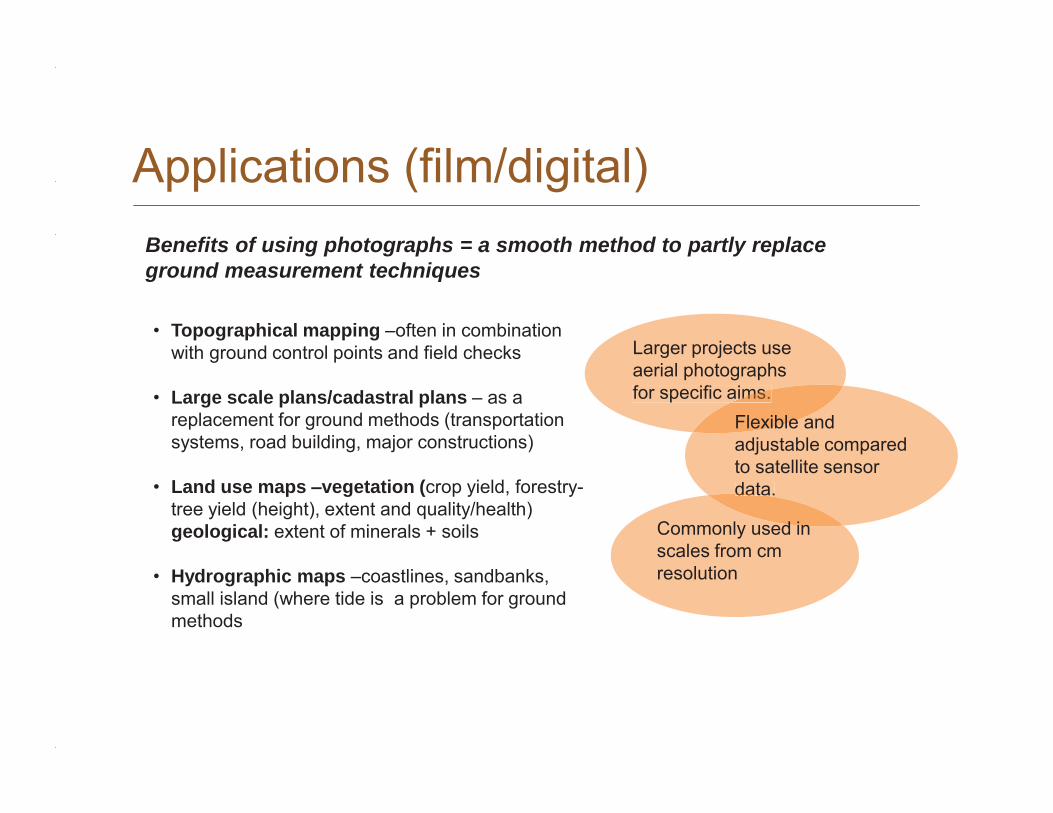
Applications (film/digital)
• Topographical mapping –often in combination with ground control points and field checks
• Large scale plans/cadastral plans – as a
replacement for ground methods (transportation systems, road building, major constructions)
• Land use maps –vegetation (crop yield, forestry-
tree yield (height), extent and quality/health) geological: extent of minerals + soils
• Hydrographic maps –coastlines, sandbanks,
small island (where tide is a problem for ground methods
Benefits of using photographs = a smooth method to partly replace ground measurement techniques
Larger projects use aerial photographs for specific aims. aims.
Flexible and adjustable compared to satellite sensor data. data
Commonly used in scales from cm resolution
Quiz 2
Quiz 2
1. What would be the range of values if the number of bits for storing each pixel in an image is:
a) 2
b) 4
c) 8
d) 16
2. You have obtained an aerial photograph, but there is no information about the scale on the photo. Is it possible for compute the scale?
When you measure the distance between two road intersections with a measurement stick, it turns out to be 5 cm. On a 1:24000 topo map, the distance between the same two road intersections is 2 cm.
3. Could an aerial image (photograph or digital photograph) be considered to be a kind of a map? Why/why not?
Quiz – solution on qu. 1
What would be the range of values within an image if the amount of bits for storing each pixel is:
A, 2 bits = 22 = 4 0 - 3
B, 4 bits = 24 = 16 0 - 15
C, 8 bits = 28 = 256 0 – 255 = 1 byte
D, 16 bits = 216 = 65536 0 - 65535
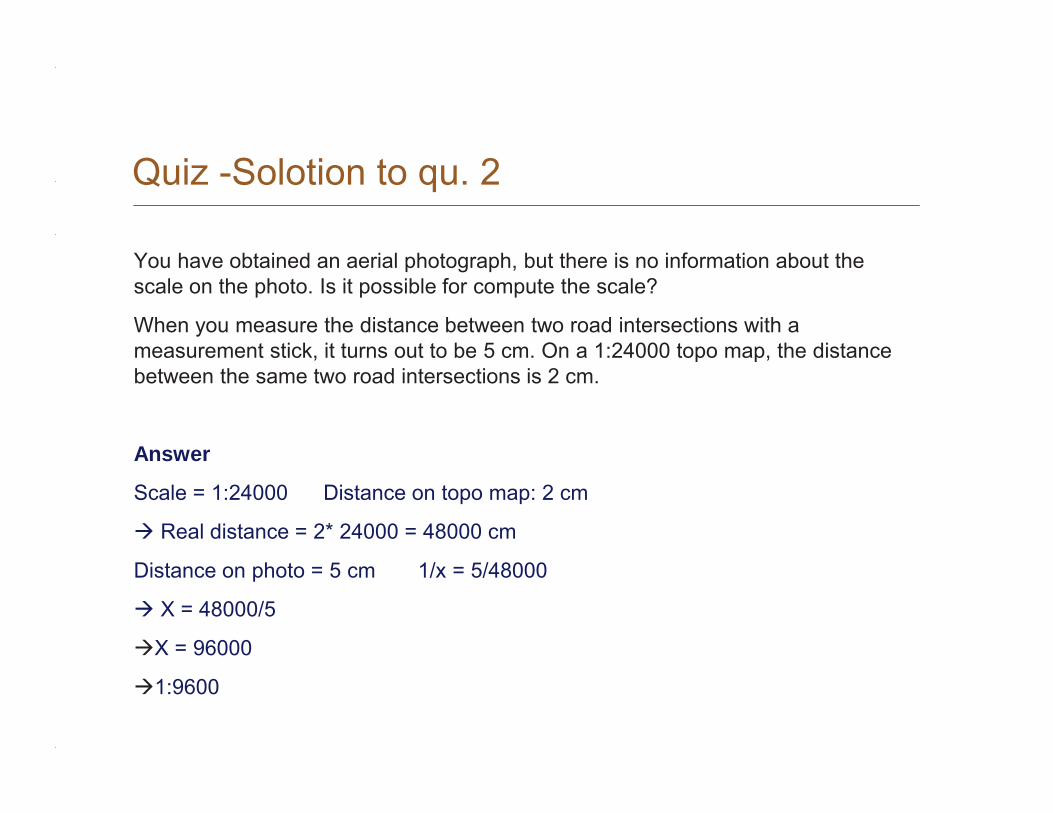
Quiz -Solotion to qu. 2
You have obtained an aerial photograph, but there is no information about the scale on the photo. Is it possible for compute the scale?
When you measure the distance between two road intersections with a measurement stick, it turns out to be 5 cm. On a 1:24000 topo map, the distance between the same two road intersections is 2 cm.
Answer
Scale = 1:24000 Distance on topo map: 2 cm
Real distance = 2* 24000 = 48000 cm
Distance on photo = 5 cm 1/x = 5/48000
X = 48000/5
X = 96000
1:9600
Quiz - Solution to qu. 3
Could an aerial image (photograph or digital photograph) be considered to be a kind of a map? Why/why not?
NO!
• Maps are based on parallel projection, photos on central projection
Maps have a unique scale –image scale varies
So if we have a digital photograph then? Or an orthophoto?
2. Could an aerial image (photograph or digital photograph) be considered to be a kind of a map? Why/why not?
NO!
• Maps are based on parallel projection, photos on central projection
Maps have a unique scale –image scale varies
So if we have a digital photograph then?
Still NO!
Maps are interpreted and generalised
Quiz –continuing solution to qu. 3
Aerial photographs vs. digital images
Photograph A scene which was detected as well as recorded on film Chemical reactions on a film that is light sensitive –detects the intensity of incoming energy Simple Register wavelengths from 0.3 – 0.9 μm Manual interpretation
Digital image A scene which was detected electronically Generate an electrical signal proportional to the incoming energy Complex Usually register wavelengths from 0.3 – 0.9 μm Converted to digital format automatic processing possible
Multispectral scanners
• Register in wavebands from 0.3 μm to 14 μm ( UV, VIS, near-IR, mid-Ir thermal-IR)
• Can be put on aircraft (air plane) or space craft (satellite)
• 2 types:
Across-track scanner // Along-track scanner
Across track scanner (1)
= whiskbroom scanner
A = the mirror
• Directs reflectance from 1 pixel at a time
• Moves back and forth (like a whisk)
Lines of pixels perpendicular to the moving dir. = scan lines
A 2d image as the air/space craft moves forward.
• Dwell time = length of time for registration of 1 pixel.
B = The detectors
– one for each waveband
Illustration from Natural Resources Canada: http://www.nrcan.gc.ca/earth-sciences/
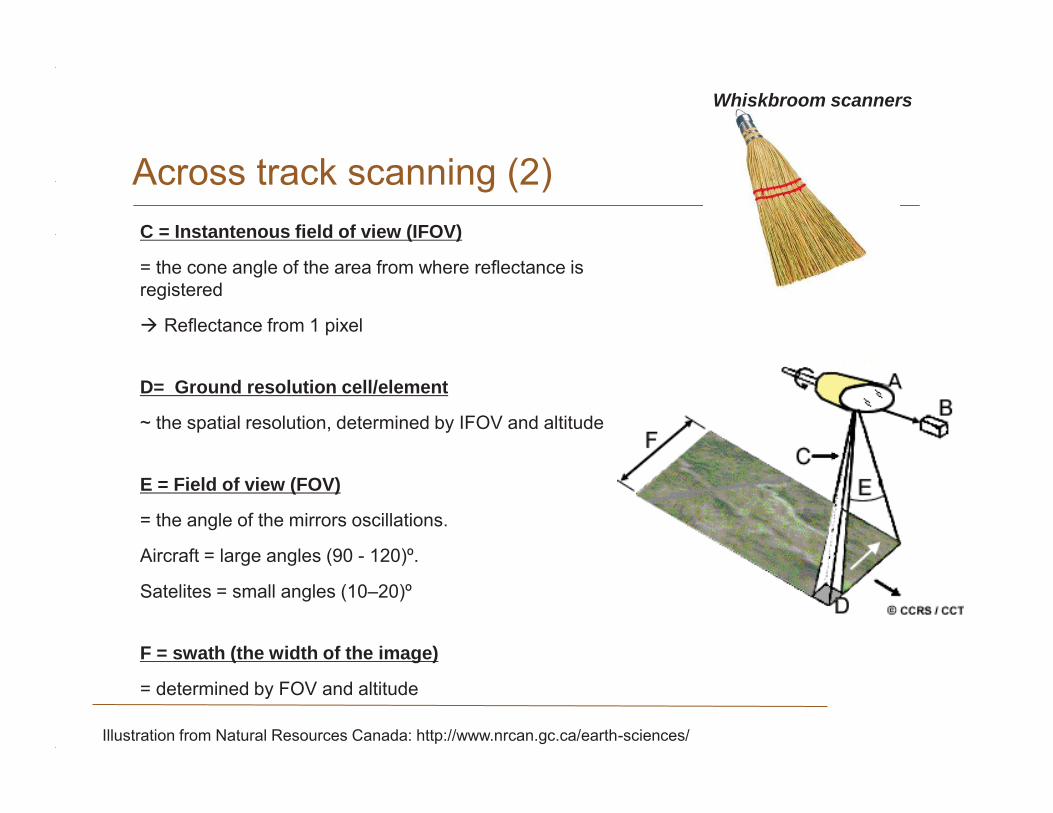
Across track scanning (2) C = Instantenous field of view (IFOV)
= the cone angle of the area from where reflectance is registered
Reflectance from 1 pixel
D= Ground resolution cell/element
~ the spatial resolution, determined by IFOV and altitude
E = Field of view (FOV)
= the angle of the mirrors oscillations.
Aircraft = large angles (90 - 120)º.
Satelites = small angles (10–20)º
F = swath (the width of the image)
= determined by FOV and altitude
Illustration from Natural Resources Canada: http://www.nrcan.gc.ca/earth-sciences/
Whiskbroom scanners
The mirror and the detectors
Illustration from course book (Remote sensing and image interpration (Lillesand et al). pp. 327
The imcomming energy is separated into several wavelength regions
Dichroic grating separates into thermal/non-thermal
A prisma separates into UV, blue, gren, red, near infrared etc
Detectors are placed in correct positions to pick up the wavelengths to form bands
A-to-D conversion
Whiskbroom scanners
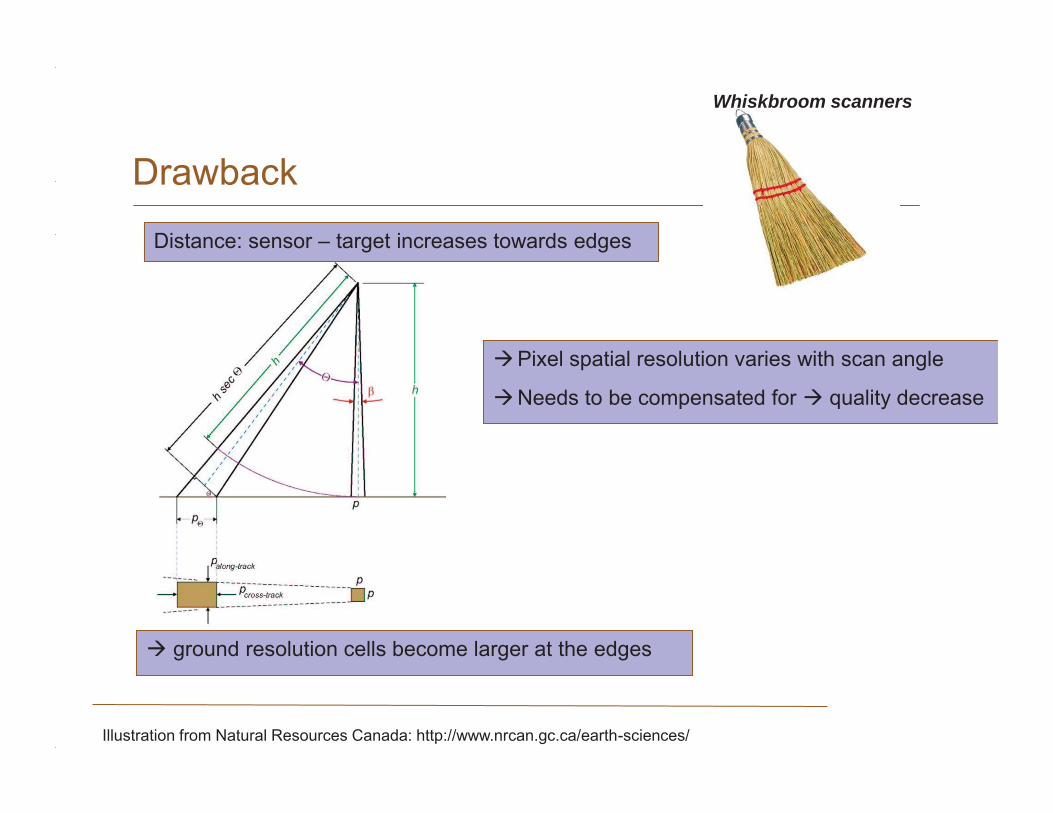
Drawback
Illustration from Natural Resources Canada: http://www.nrcan.gc.ca/earth-sciences/
Whiskbroom scanners
Distance: sensor – target increases towards edges
ground resolution cells become larger at the edges
Pixel spatial resolution varies with scan angle
Needs to be compensated for quality decrease
Along track scanning
= Pushbroom scanning
The detector array is pushed along the moving direction
A = linear array of detectors
• Placed in focal plane (B)
• Each wavelength band has 1 array
• Area array for multi-spectral use
• Detectors = CCD (charge coupled devices)
C = lens/optic system
D = ground resolution cell
Illustration from Natural Resources Canada: http://www.nrcan.gc.ca/earth-sciences/
Pushbroom scanners
Along track scanning
• The size of the ground resolution cell is determined by the size of the detectors
• Better geometry than cross
track scanners –fixed relationship among detector elements equal size of the ground resolution cells.
• One detector for each cell in
the array
Pushbroom scanners
Illustration from course book (Remote sensing and image interpration (Lillesand et al).
Whiskbroom vs. Ppushbroom
Whiskbroom Pushbroom Wide swath width Narrow swath width Few detectors Many detectors Heavier system, more energy
Light, small devices, require less energy
Shorter dwell time Longer dwell time Pixel distortion No pixel distortion Used by Landsat 1-7 Likely to wear out
Most common today
Satellite remote sensing
Difference from aircraft:
• Altitude: higher altitude of platforms
Lower spatial image resolution
Radiation must pass (twice) through the atmosphere
• Orbits –regular visits to the same area
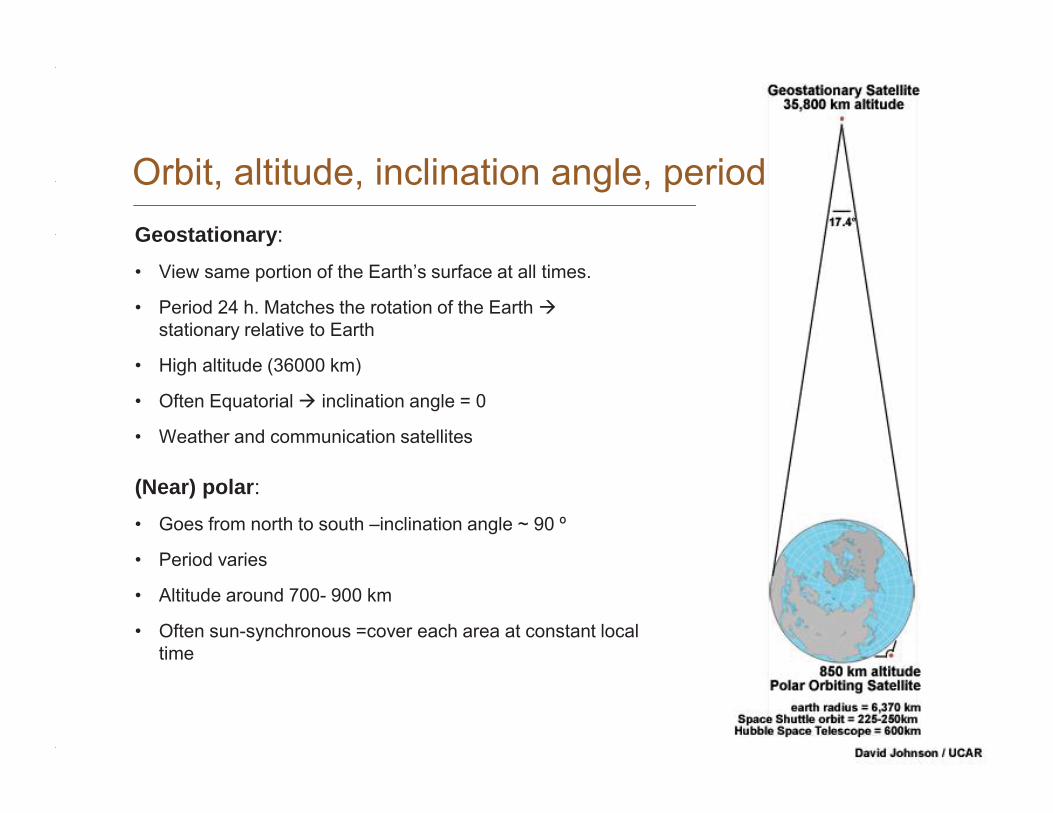
Orbit, altitude, inclination angle, period Geostationary:
• View same portion of the Earth’s surface at all times.
• Period 24 h. Matches the rotation of the Earth stationary relative to Earth
• High altitude (36000 km)
• Often Equatorial inclination angle = 0
• Weather and communication satellites
(Near) polar: • Goes from north to south –inclination angle ~ 90 º
• Period varies
• Altitude around 700- 900 km
• Often sun-synchronous =cover each area at constant local time
Distortion due to earths curvature
Polar orbiting satellites
sun-synchronos satellites: • Landsat • SPOT
High resolution satellites • IKONOS • Quickbird
Superspectral sensing
• Acquire images in many spectral bands >10
• from visible to thermal IR
• High spectral resolution
• Across or along tracking sensors
MODIS, MERIS
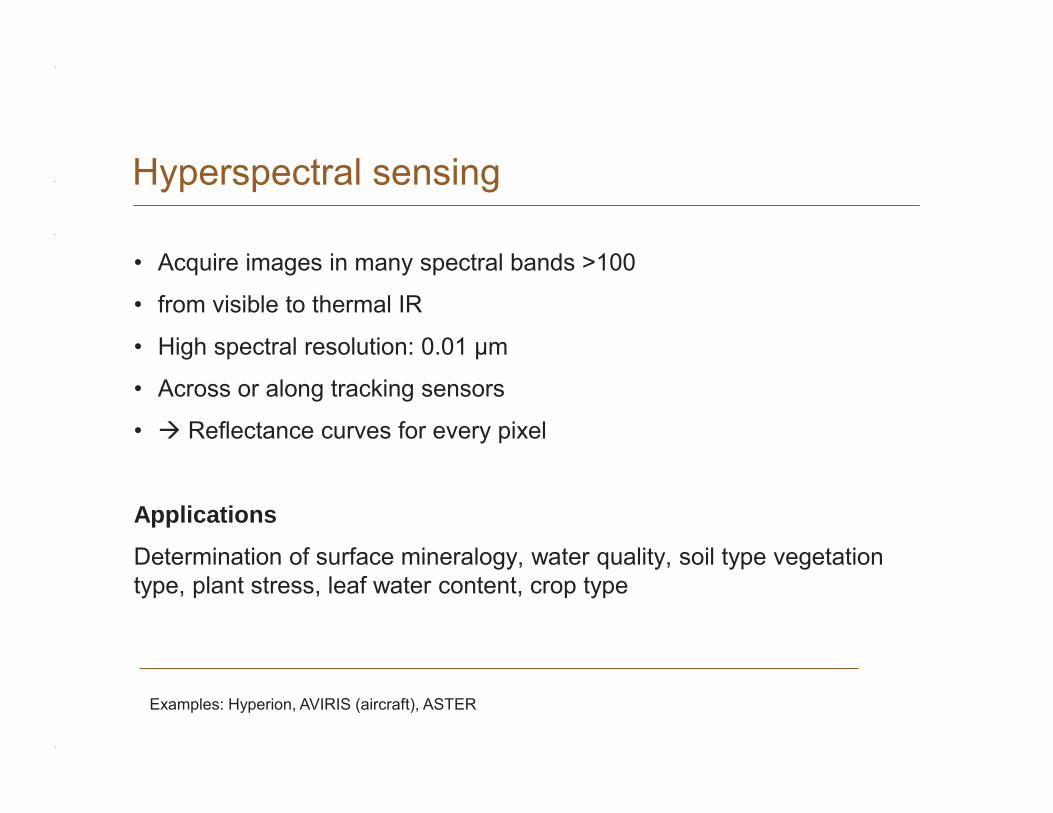
Hyperspectral sensing
• Acquire images in many spectral bands >100
• from visible to thermal IR
• High spectral resolution: 0.01 μm
• Across or along tracking sensors
• Reflectance curves for every pixel
Applications
Determination of surface mineralogy, water quality, soil type vegetation type, plant stress, leaf water content, crop type
Examples: Hyperion, AVIRIS (aircraft), ASTER
Learning objectives
Knowledge and understanding:
• History of remote sensing – important mile stones
• Basics of radiation theory, wavelength bands and false color composites
• Theory and technique behind: aerial photographs, digital photographs, digital sensors/scanners
• Digital image processing techniques
• Key terminology used in the lecture
Skills and abilities
• Apply the appropriate remote sensing analysis technique (satellite/aerial, image band, vegetation indices) for a certain purpose
• Discuss and compare advantages and disadvantages between different image techniques
• Discuss the trade of between different kinds of resolutions
• Present examples of different image processing techniques and when they are applicable
Image processing of digital images
Advantages:
• manipulate how the numbers are scaled in the image
• Linear stretch
Easier for visual interpretation
• possible to perform analyses using the DN-numbers
Image histogram
X-axis = brightness value Y-axis = number of pixels on each brightness value
= helps us to view the distribution of brightness values
Linear contrast stretch
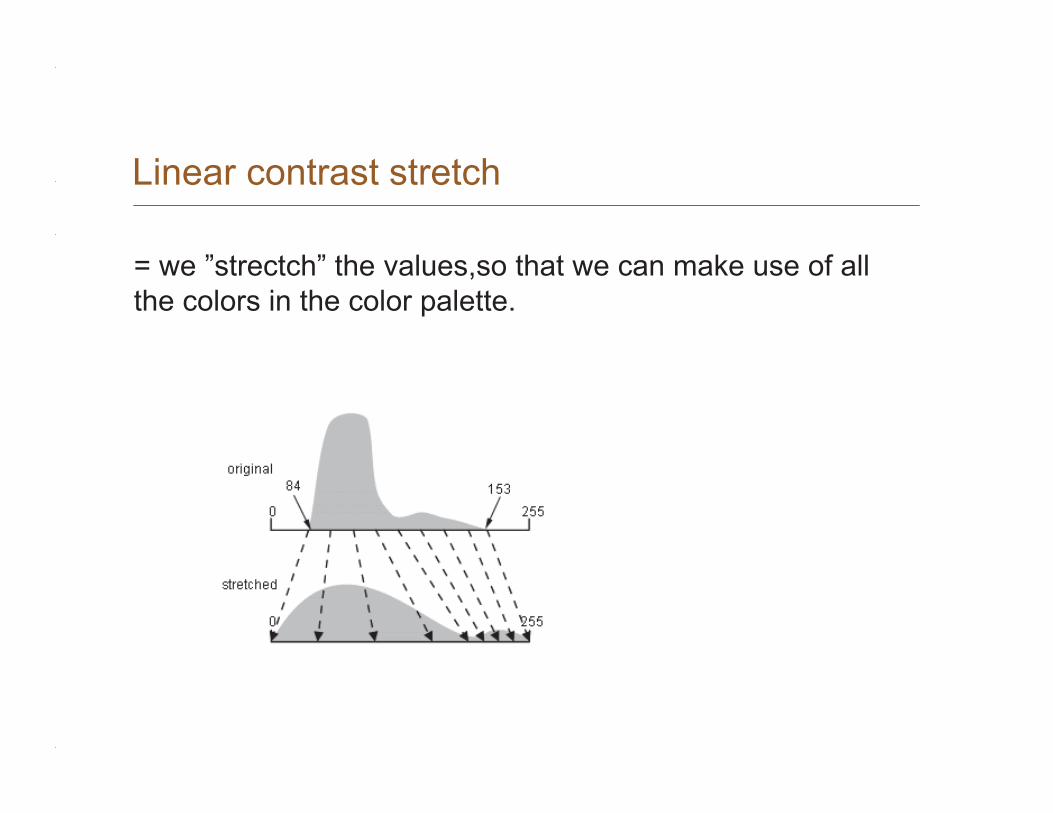
The chosen data type in the computer = 1 byte 256 levels (0-255) -but the distribution of brightness values goes from 84 to 153...
We only use 153-84 = 69 values (colors) out of 256...
Linear contrast stretch
= we ”strectch” the values,so that we can make use of all the colors in the color palette.
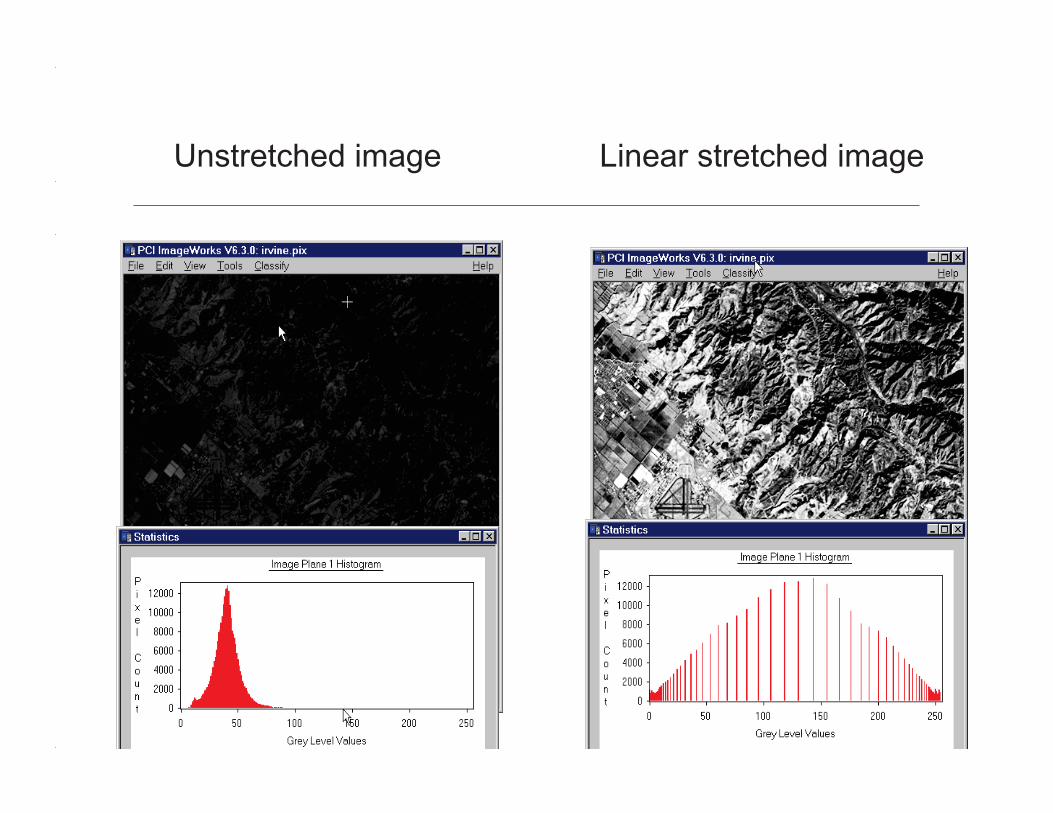
Unstretched image
Brightness values goes from 8 to 90 all pixels will be dark...
Unstretched image Linear stretched image
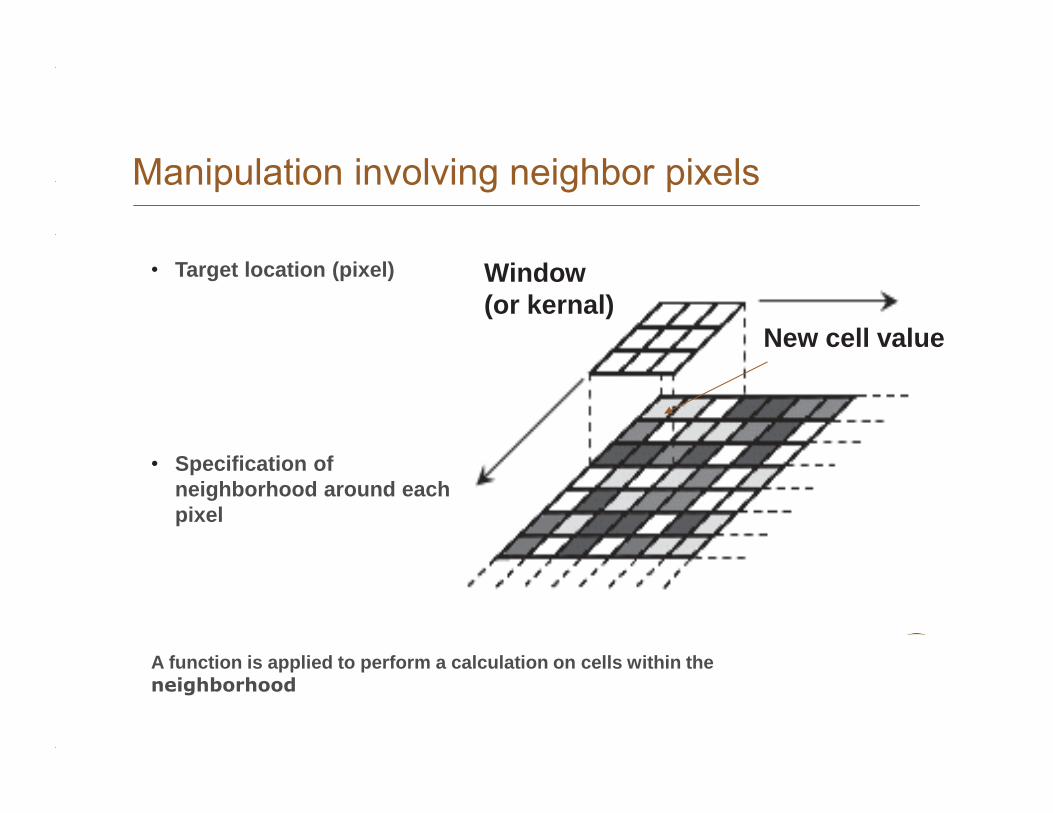
Manipulation involving neighbor pixels
• Target location (pixel)
• Specification of neighborhood around each pixel
Window (or kernal)
New cell value
A function is applied to perform a calculation on cells within the neighborhood
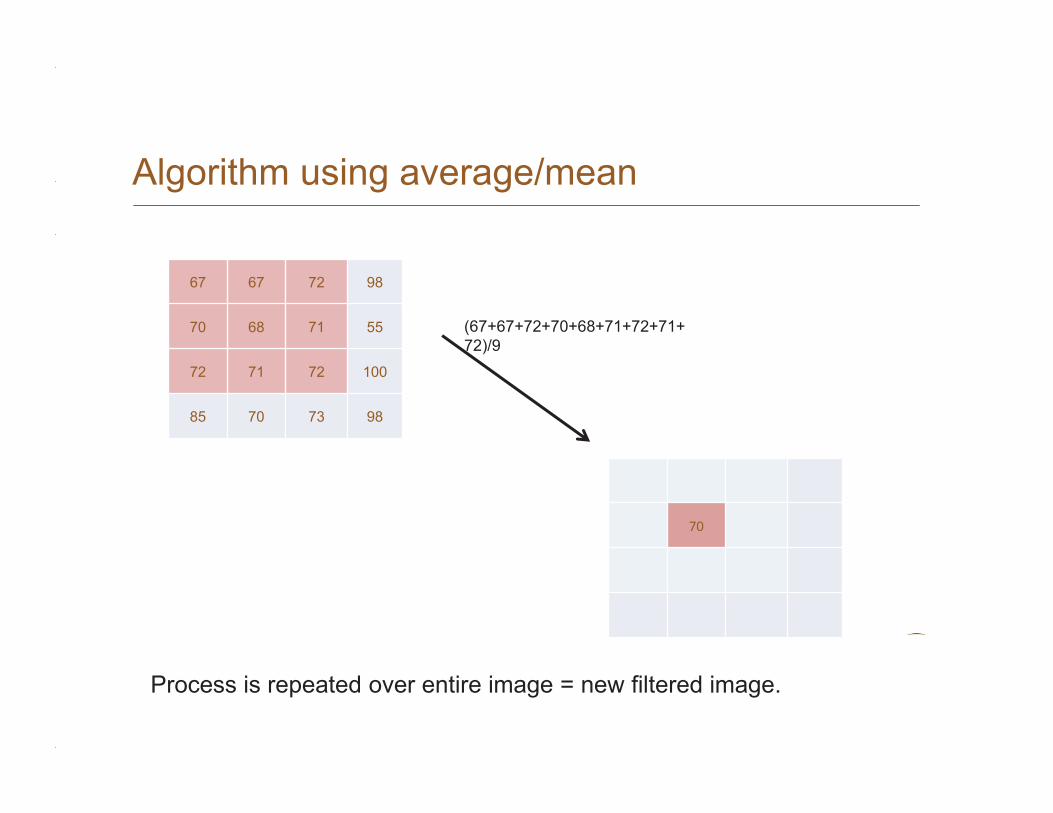
Algorithm using average/mean
67 67 72 98
70 68 71 55
72 71 72 100
85 70 73 98
(67+67+72+70+68+71+72+71+72)/9
70
Process is repeated over entire image = new filtered image.
Low pass filter
= “low frequency will pass”
• Designed to produce more homogenous areas
reduces noice/detail
smoother appearance
• The function is usually AVERAGE (arithmetic mean) or median.
• The larger the window, the more smooth and the more reduce of detail…
Applied low-pass filter
High pass filter
= “high frequency will pass” Enhances edges between different properties
Method 1. Apply a low pass filter 2. Subtract the low pass filter from the original image.
The resulting image will have high frequency information
Original image High pass applied
High pass 5 X 5 window
From: www.microimages.com
Analyses performed using digital values
• Classifications –land cover classes
• Change detection analyses • Composing Indices (vegetation indices)
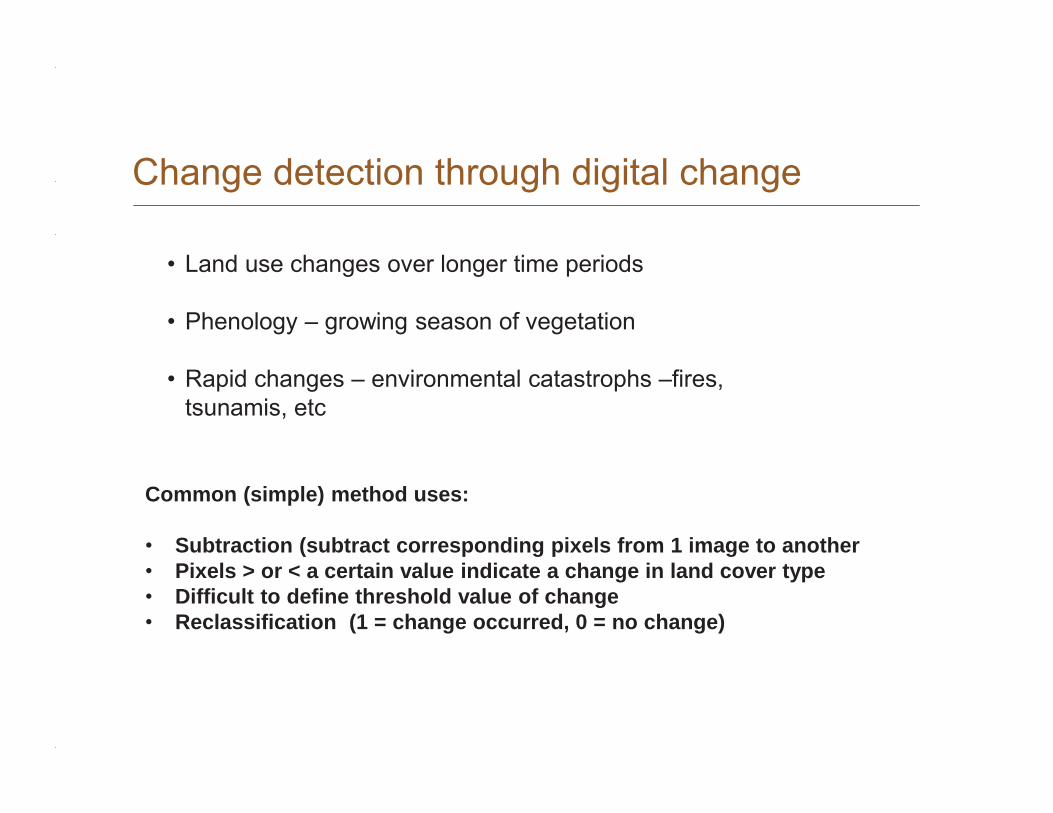
Change detection through digital change
• Land use changes over longer time periods • Phenology – growing season of vegetation • Rapid changes – environmental catastrophs –fires,
tsunamis, etc
Common (simple) method uses: • Subtraction (subtract corresponding pixels from 1 image to another •
Subtraction
5 1 7
6 5 6
3 4 5
7 2 3
5 4 1
6 5 3
- = -2 -1 4
1 1 5
-3 -1 2
MAY BE RECLASSIFIED INTO ABSOLUTE VALUES!
Subtraction = take the difference between corresponding pixels from 2 layers.
Change detection through digital change
• Land use changes over longer time periods • Phenology – growing season of vegetation • Rapid changes – environmental catastrophs –fires,
tsunamis, etc
Common (simple) method uses: • Subtraction (subtract corresponding pixels from 1 image to another • Pixels > or < a certain value indicate a change in land cover type • Difficult to define threshold value of change • Reclassification (1 = change occurred, 0 = no change)
Quiz 3
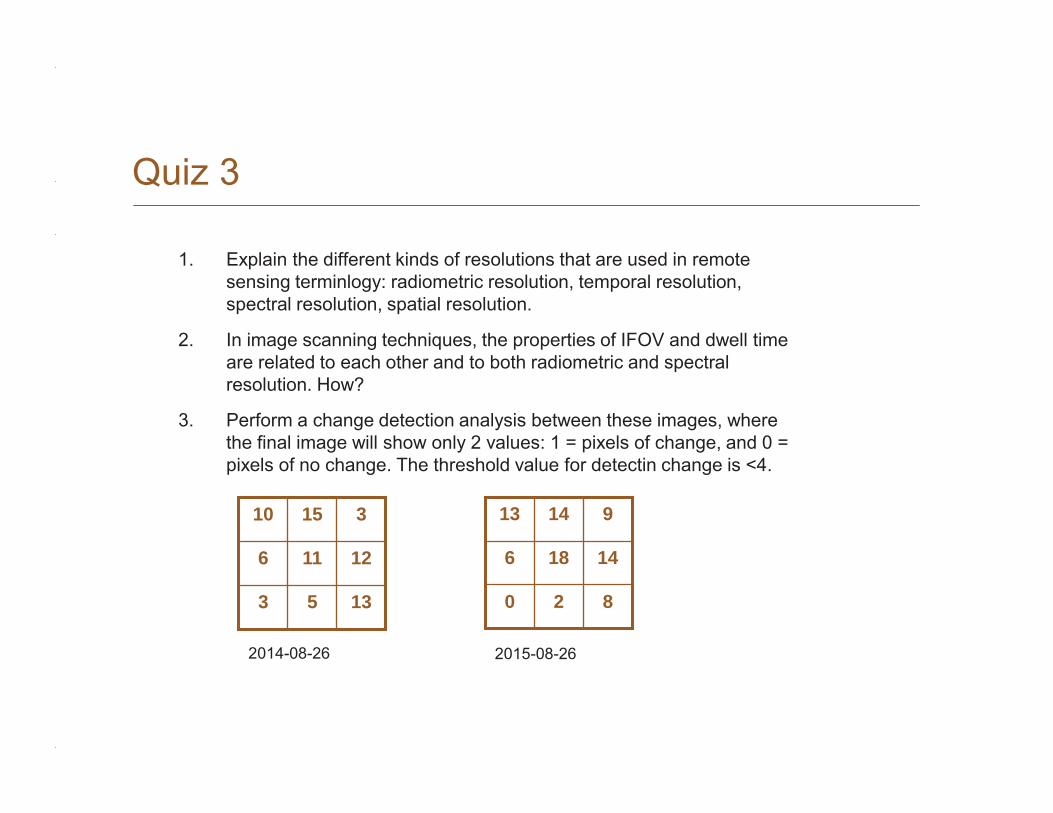
Quiz 3
1. Explain the different kinds of resolutions that are used in remote sensing terminlogy: radiometric resolution, temporal resolution, spectral resolution, spatial resolution.
2. In image scanning techniques, the properties of IFOV and dwell time are related to each other and to both radiometric and spectral resolution. How?
3. Perform a change detection analysis between these images, where the final image will show only 2 values: 1 = pixels of change, and 0 = pixels of no change. The threshold value for detectin change is <4.
13 5 3
12 11 6
315 10
8 2 0
14 18 6
9 14 13
2014-08-26 2015-08-26
Quiz 3 –solution on question 1
1.
Radiometric resolution = Describes the ability to discriminate differences in energy. The finer the radiometric resolution, the more differences in the image. Depend on:
• The strength of the signal from the ground
• The ability of the sensor to detect signal variations
• Number of bits available to store the brightness value
Temporal resolution = revisit time of a recording over an area
Spectral resolution = width of the wavelength band
spatial resolution = how small an object on the earth’s surface can be that is seen by the sensor.
Film photograph = the area of film and grain (amount of silver salts).
Digital image: = the ground area represented by a single pixel (depend on IFOV and altitude)
Quiz 3 –solution on question 2
In image scanning techniques, the properties of IFOV and dwell time are related to each other and to both radiometric and spectral resolution. How? Radiometric resolution depend on the strength of the signal from the ground …which depend on IFOV (larger IFOV larger area stronger signal), dwell time (more time stronger signal) and the spectral resolution (broader wavelength band stronger signal)
Larger IFOV lower spatial resolution Small IFOV may result in need for broader wavelength band lower spectral resolution High spatial resolution small IFOV, but reduces the amount of detectable energy reduced radiometric resolution.
Quiz 3 –solution on question 3
Perform a change detection analysis between these images, where the final image will show only 2 values: 1 = pixels of change, and 0 = pixels of no change. The threshold value for detecting change is >+/- 4. 1. Image 1 – image 2


![[REMOTE SENSING] 3-PM Remote Sensing](https://static.documents.pub/doc/80x56/61f2bbb282fa78206228d9e2/remote-sensing-3-pm-remote-sensing.jpg)


