Thermodynamic analysis of two-stage heat treatment in TRIP steels S. Li a , R. Zhu a , I. Karaman a,b , R. Arro ´ yave a,b,⇑ a Department of Mechanical Engineering, Texas A&M University, TX 77843, USA b Materials Science and Engineering Program, Texas A&M University, TX 77843, USA Received 31 May 2012; received in revised form 22 July 2012; accepted 22 July 2012 Available online 4 September 2012 Abstract In this work, we present a detailed thermodynamic analysis of the two-stage heat treatment (intercritical annealing (IA) and banite isothermal transformation (BIT)) necessary to stabilize retained austenite in transformation-induced plasticity (TRIP) assisted steels. Through a set of experiments on alloys with nominal composition Fe–0.32C–1.42Mn–1.56Si (wt.%), we monitored the evolution of the volume fraction of retained austenite at room temperature as a function of the IA and BIT temperatures. We also investigated the thermodynamic limit for the bainitic transformation during BIT under the displacive (partitionless) transformation assumption. The fraction of retained austenite at the end of the two-stage heat treatment was calculated by taking into account the corresponding start of the martensitic transformation (T Ms ). Comparisons with experiments suggest good qualitative agreement in the fraction of retained austenite when considering the effect of the IA temperature. On the other hand, the analysis of the effect of BIT on the amount of retained austenite showed qualitative disagreement with the observations. To further analyze this discrepancy, we utilize a modified thermodynamic analysis with empirical observations as input, and conclude that the assumption of thermodynamic equilibrium at IA is not valid at lower IA temperatures. Moreover, the unexpected high carbon enrichment in retained austenite indicates the importance of the kinetic effects. We conclude that the thermodynamic limit for the bainitic transformation can be used at least to provide a lower bound to the expected fraction of retained austenite under specific IA + BIT treatment schedules. Published by Elsevier Ltd. on behalf of Acta Materialia Inc. Keywords: Transformation-induced plasticity steels; Thermodynamics; Retained austenite; Bainite; Bainitic transformation 1. Introduction The quest for improvements in vehicle fuel economy through weight reduction has motivated the development of advanced high-strength steels (AHSSs). In transforma- tion-induced plasticity (TRIP)-assisted steels, ductility is improved through the strain-induced martensitic transfor- mation of retained austenite [1–3], making them good AHSS candidates. Although TRIP-assisted steels consist of complex multiphase microstructures, one of their key characteristics is the fraction of retained austenite available for the ductility-enhancing martensitic transformation dur- ing plastic deformation. Due to the low alloy content of these steels, the stability of the retained austenite at room temperature is mostly controlled through its level of carbon enrichment, which in turn can be manipulated through judicious design of the steel’s phase constitution via heat treatments. The most common strategy to control the phase consti- tution of TRIP steels is through a two-stage heat treatment protocol [4–6] consisting of four distinct processes: (1) fast heating and dissolution of pearlite; (2) holding at the tem- perature in which a two-phase, ferrite + austenite, micro- structure is stable (intercritical annealing (IA)); (3) rapid quenching; and (4) holding at a temperature at which a bainitic isothermal transformation (BIT) takes place. The purpose of the IA treatment—typically temperatures on the order of 1053–1153 K [7]—is to decompose the original pearlite and generate a ferrite–austenite microstructure, with the austenite having a considerable carbon enrichment 1359-6454/$36.00 Published by Elsevier Ltd. on behalf of Acta Materialia Inc. http://dx.doi.org/10.1016/j.actamat.2012.07.054 ⇑ Corresponding author at: Department of Mechanical Engineering, Texas A&M University, TX 77843, USA. Tel.: +1 979 845 5416. E-mail address: [email protected](R. Arro ´ yave). www.elsevier.com/locate/actamat Available online at www.sciencedirect.com Acta Materialia 60 (2012) 6120–6130
Transcript
Available online at www.sciencedirect.com
www.elsevier.com/locate/actamat
Acta Materialia 60 (2012) 6120–6130
Thermodynamic analysis of two-stage heat treatment in TRIP steels
S. Li a, R. Zhu a, I. Karaman a,b, R. Arroyave a,b,⇑
a Department of Mechanical Engineering, Texas A&M University, TX 77843, USAb Materials Science and Engineering Program, Texas A&M University, TX 77843, USA
Received 31 May 2012; received in revised form 22 July 2012; accepted 22 July 2012Available online 4 September 2012
Abstract
In this work, we present a detailed thermodynamic analysis of the two-stage heat treatment (intercritical annealing (IA) and baniteisothermal transformation (BIT)) necessary to stabilize retained austenite in transformation-induced plasticity (TRIP) assisted steels.Through a set of experiments on alloys with nominal composition Fe–0.32C–1.42Mn–1.56Si (wt.%), we monitored the evolution ofthe volume fraction of retained austenite at room temperature as a function of the IA and BIT temperatures. We also investigatedthe thermodynamic limit for the bainitic transformation during BIT under the displacive (partitionless) transformation assumption.The fraction of retained austenite at the end of the two-stage heat treatment was calculated by taking into account the correspondingstart of the martensitic transformation (TMs). Comparisons with experiments suggest good qualitative agreement in the fraction ofretained austenite when considering the effect of the IA temperature. On the other hand, the analysis of the effect of BIT on the amountof retained austenite showed qualitative disagreement with the observations. To further analyze this discrepancy, we utilize a modifiedthermodynamic analysis with empirical observations as input, and conclude that the assumption of thermodynamic equilibrium at IA isnot valid at lower IA temperatures. Moreover, the unexpected high carbon enrichment in retained austenite indicates the importance ofthe kinetic effects. We conclude that the thermodynamic limit for the bainitic transformation can be used at least to provide a lowerbound to the expected fraction of retained austenite under specific IA + BIT treatment schedules.Published by Elsevier Ltd. on behalf of Acta Materialia Inc.
The quest for improvements in vehicle fuel economythrough weight reduction has motivated the developmentof advanced high-strength steels (AHSSs). In transforma-tion-induced plasticity (TRIP)-assisted steels, ductility isimproved through the strain-induced martensitic transfor-mation of retained austenite [1–3], making them goodAHSS candidates. Although TRIP-assisted steels consistof complex multiphase microstructures, one of their keycharacteristics is the fraction of retained austenite availablefor the ductility-enhancing martensitic transformation dur-ing plastic deformation. Due to the low alloy content of
1359-6454/$36.00 Published by Elsevier Ltd. on behalf of Acta Materialia Inc
http://dx.doi.org/10.1016/j.actamat.2012.07.054
⇑ Corresponding author at: Department of Mechanical Engineering,Texas A&M University, TX 77843, USA. Tel.: +1 979 845 5416.
these steels, the stability of the retained austenite at roomtemperature is mostly controlled through its level of carbonenrichment, which in turn can be manipulated throughjudicious design of the steel’s phase constitution via heattreatments.
The most common strategy to control the phase consti-tution of TRIP steels is through a two-stage heat treatmentprotocol [4–6] consisting of four distinct processes: (1) fastheating and dissolution of pearlite; (2) holding at the tem-perature in which a two-phase, ferrite + austenite, micro-structure is stable (intercritical annealing (IA)); (3) rapidquenching; and (4) holding at a temperature at which abainitic isothermal transformation (BIT) takes place. Thepurpose of the IA treatment—typically temperatures onthe order of 1053–1153 K [7]—is to decompose the originalpearlite and generate a ferrite–austenite microstructure,with the austenite having a considerable carbon enrichment
Table 1Chemical composition (in wt.%) of the as-cast Fe–0.3C–1.5Mn–1.5SiTRIP-assisted steel determined through ICP-AES.
Element C Mn Si P S Alwt.% 0.32 1.42 1.56 0.012 0.008 0.01
Element Mo Cu Ni Cr Fewt.% 0.02 0.07 0.04 0.06 Bal.
S. Li et al. / Acta Materialia 60 (2012) 6120–6130 6121
due to carbon partitioning. During the BIT—which typi-cally occurs at temperatures within the 600–700 Krange—the formation of essentially carbon-free bainiticferrite results in further carbon enrichment of the remain-ing austenite—provided that the presence of carbide phasesand other carbon sinks is inhibited—stabilizing it againstmartensitic transformation as the alloy is quenched toroom temperature.
Due to the importance of the BIT treatment in dictatingthe carbon enrichment (and stability) of austenite, consid-erable effort has been dedicated to the understanding ofthe thermodynamics and kinetics of the bainitic phasetransformation [8–10]. Although the actual mechanismfor the transformation is still subject to debate, many ofthe descriptions of BIT assume that the transformationoccurs in a partionless manner. Upon transformation, thebainitic ferrite rejects carbon into austenite, enriching andstabilizing it against martensitic transformation. Bhadeshia[11] proposed a limit to the carbon enrichment in retainedaustenite during BIT resulting from the exhaustion—due tocarbon enrichment in the retained austenite—of the drivingforce for partitionless bainite growth. This limit is usuallydenoted as the T0 line (see Section 3) [12].
From the viewpoint of the design of the two-stage heattreatment for TRIP steels, T0 and related constraints havebeen proposed as key parameters to predict the maximumpossible carbon enrichment of austenite as well as the lat-ter’s volume fraction during BIT [13,14]. However, experi-ments often show significantly higher carbon enrichments[8,15,16] than the ones suggested by thermodynamic con-straints, resulting in a more stable austenite at room tem-perature [14,17,18]. The reasons for this discrepancy areunclear but it has been proposed that the competitionbetween the actual rate of the transformation and the dif-fusion of carbon away from bainitic ferrite into austenitemay be important contributors [9,13,14,17,19].
In this work, we present a detailed thermodynamic anal-ysis of the two-stage heat treatment (IA and BIT) necessaryto stabilize retained austenite in transformation-inducedplasticity (TRIP)-assisted steels with typical compositionFe–0.32C–1.42Mn–1.56Si (wt.%). Using thermodynamicanalysis we examine the phase transformation criteriabased on the thermodynamic limits (i.e. T0) for the comple-tion of the BIT transformation, which constitute reliableindicators for the volume fraction of retained austenite.The results are compared with a set of experiments. Thethermodynamic calculations are performed usingThermo-Calc [20] with the most recent edition of the ther-modynamic database for steels (TCFE6 v.6.2). By combin-ing a limited set of experimental data obtained fromdifferent heat treatments we proceed to use thermodynamiccalculations and experiments to determine the carbonenrichment in austenite after the treatments. To accomplishthis, we include estimates for the martensite start and finishtemperatures (TMs and TMf) for austenite both after IA andduring/after BIT. Finally, we discuss the possible use ofthermodynamic criteria to estimate lower bounds for the
likely volume fraction of retained austenite after the two-step treatment of TRIP steels.
2. Experimental
2.1. Initial processing
Billets of the model TRIP-assisted steel with a nominalcomposition of Fe–1.5Mn–1.5Si–0.3C (wt.%) were castwith dimensions of 25.4 mm � 25.4 mm � 177.8 mm andprocessed at high temperature using equal-channel angularpressing (ECAP). Inductively coupled plasma atomic emis-sion spectroscopy (ICP-AES) was conducted on the as-castmaterials to determine the actual composition and theresults are shown in Table 1. The as-cast billets were firstheated up to 1223 K for 1 h to austenitize the microstruc-ture, then quickly ECAP processed at a rate of 25.4 mm s�1
non-isothermally while the billets were at 1223 K and theECAP die was at 573 K. After ECAP, the billets were aircooled to room temperature. Two passes were conductedusing route C (180� rotation between the passes along thelongitudinal axis of the billet) with the same extrusion con-ditions. The purpose of this processing is to homogenizethe as-cast structure.
2.2. Two-step treatment
Dog-bone shaped samples with gage dimensions of8 mm � 3 mm � 1 mm were cut from the ECAP-processedbillets using wire electrodischarge machining along the lon-gitudinal axis of the billets. The samples were intercriticalannealed in the furnace, followed by fast quenching intoa salt bath for BIT, and finally quenching into water.The parameters used are summarized in Table 2. The selec-tion methodology of these parameters will be explained indetail in the subsequent sections. Each sample was sealed inan argon environment to avoid decarburization during theheat treatments.
2.3. Microstructural characterization
The volume fraction of ferrite was measured throughimage analysis. Field emission scanning electron micros-copy (FE-SEM) images were obtained using a JEOLJSM-7500F ultra-high-resolution microscope equippedwith a high-brightness conical FE gun and a low-aberra-tion conical objective lens. Additional samples with onlythe IA treatment (IA + quenched in water) were prepared
Table 2Experimental heat treatment conditions used to validate the thermodynamic analysis; IA and BIT stand for the heat treatment conditions for intercriticalannealing and bainitic isothermal transformationm respectively; Vf is the volume fraction of each phase (austenite (Aus) and ferrite (Fer)); wc
Mn and wcSi are
the weight percentages of Mn and Si in austenite; wcC;BIT represents the carbon content in retained austenite.
Treatment A B C D E F
IA 1023 K, 2 h 1045 K, 2 h 1083 K, 2 h 1045 K, 10 minBIT 613 K, 12 min 613 K, 15 min 643 K, 15 min 693 K, 5 min 613 K, 15 min 613 K, 15 minVf(Aus) 11.73 ± 2.5% 11.85 ± 3.04% 18.61 ± 1.54% 20.40 ± 1.84% 7.37 ± 1.04% 11.56 ± 3.25%Vf(Fer) – 41.20 ± 0.8% 15.10 ± 0.5% 52.70 ± 3.0%wc
Fig. 1. SEM image showing a typical microstructure after 1053 K 2 h(IA) + 693 K 4 min (BIT) + water quenching. Refer to the text and Table2 for more details.
Fig. 2. The flowchart of the forward thermodynamic calculation model.
6122 S. Li et al. / Acta Materialia 60 (2012) 6120–6130
in order to measure the volume fraction of IA-ferriteassuming that the ferrite from IA is stable and no addi-tional ferrite similar to IA-ferrite is formed during BIT.Samples were mechanically polished and etched using 2%Nital before imaging. Typical microstructures of the alloysafter the BIT treatment are shown in Fig. 1.
The volume fraction of retained austenite was calculatedbased on the X-ray diffraction (XRD) spectrum obtainedwith a Bruker-AXS D8 diffractometer with Cu Ka radia-tion (wavelength k = 0.15406 nm). Samples were chemi-cally polished in a solution of 14 ml of 40% HF and 30%H2O2 diluted in 100 ml distilled water before testing. Adirect comparison method [21] was utilized on (111),(200), (220) austenite peaks and (110), (200), (21 1) mar-tensite peaks. The carbon content was calculated using theempirical equation by Dyson [22].
The Mn and Si content after IA was determined usingCameca SX50 electron microprobe with wavelength-dis-persive spectroscopy (WDS). Samples were mechanicallypolished without etching before the microprobe investiga-tion. Two or three comparison samples were heat treatedand analyzed to check the repeatability of the experiments.
3. Thermodynamic analysis—forward calculation
3.1. Intercritical annealing
As mentioned in the Introduction, we investigated thetwo-step heat treatment for the selected TRIP steel usingthermodynamic calculations. The calculation procedure isoutlined in Fig. 2. As shown in the figure, the thermody-namic analysis starts by estimating the phase constitutionof the steel alloy during IA at arbitrary temperatures.The predicted (metastable) phase diagram for the presentcomposition is shown in Fig. 3a. As indicated in the dia-gram, austenite and ferrite coexist between 985 and1091 K. This range of temperature of 106 K constitutesthe temperature window for potential IA temperatures(TIA).
One of the main goals of IA treatment is the stabiliza-tion of a dual-phase microstructure with sufficient volumefraction of ferrite to result in adequate ductility of theTRIP steel as well as an austenite phase sufficientlyenriched with carbon so it is stable against martensitic
transformation during quenching to BIT temperature.The selection of TIA must also be sufficiently above the sta-bility boundary for the formation of cementite to guaranteethat there are no carbon sinks that would deplete the
Fig. 3. The thermodynamic equilibrium analysis for Fe–0.32C–1.42Mn–1.56Si (wt.%): (a) the predicted metastable phase diagram; (b) the chemicalcomposition and volume fraction of austenite during IA at differenttemperatures.
Fig. 4. Schematic diagram of the two-step heat treatment: (a) the volumefraction of the phases at each step of the treatment; (b) the criticaltemperatures in BIT treatment; TBIT: BIT treatment temperature; TMs:martensite start temperature; TIA
Ms : TMs of IA austenite; TBITMs : TMs of the
alloy after heat treatment; T00 : the thermodynamic limit of the carbonsaturation in retained austenite; �w : the average carbon content inaustenite.
S. Li et al. / Acta Materialia 60 (2012) 6120–6130 6123
IA-austenite of carbon, making it more susceptible to mar-tensitic transformation after quenching.
Fig. 3b shows the equilibrium partitioning of C, Si andMn, as well as the equilibrium volume fraction of austeniteas a function of IA. As can be seen, lower TIA result in highenrichment of C and Mn, leading to a more stable austen-ite, although in these cases the equilibrium amount of aus-tenite is rather low, suggesting a compromise betweenaustenite stability and phase constitution.
3.2. Bainitic isothermal transformation
Since IA-ferrite is stable below Ae1 [16], the thermody-namic analysis of the BIT treatment can be carried outby considering only IA-austenite, with its chemical compo-
sition corresponding to that at the end of IA (point (1) inFig. 4). After the IA treatment, the alloy must be quenchedto BIT in order to promote further C-enrichment of austen-ite. At this stage, the proper quenching rate and holdingtemperature are required to avoid the formation of cement-ite. At the same time, the isothermal holding temperature(TBIT) must be higher than the martensitic start tempera-ture (TMs) of the IA-austenite and must be lower thanthe bainite start temperature (TBs).
Although there is still some uncertainty regarding theprocesses involved in the nucleation and growth of bainite,the most conventional theories by Bhadeshia and collabo-rators [23] suggest that the nucleation process occursthrough the partitioning of C and the formation of a bain-itic ferrite nucleus with C-content close to that obtainedunder para-equilibrium conditions. Once ferrite nucleates,the growth of bainite subunits occurs in a diffusionless
6124 S. Li et al. / Acta Materialia 60 (2012) 6120–6130
(partitionless) fashion. Upon transformation, the bainiticferrite rejects carbon into austenite, enriching and stabiliz-ing it against martensitic transformation. According to thismodel, the bainitic transformation is only thermodynami-cally possible when (1) the maximum driving force forthe nucleation of para-equilibrium ferrite (DGMax) over-comes the so-called universal nucleation energy barrier(DGN); and (2) the diffusionless driving force for the contin-ued growth of bainite plates (DGc!a) is greater than thestrain energy (DGSE) that accompanies the austenite–ferritetransformation and that results from elastic incompatibili-ties between matrix (austenite) and precipitate (bainitic fer-rite) phases [11]. These two conditions are illustrated inFig. 5.
The universal nucleation energy is essential for the pre-diction of TBs. However, DGN is at best an empirical quan-tity which was determined by comparing experimentallydetermined TBs with the chemical driving force for the
Fig. 5. The schematic diagram of (a) the driving forces for bainitictransformation and (b) bainite start temperature (TBs).
bainitic transformation obtained from thermodynamic cal-culations using specific thermodynamic databases.
Bhadeshia and his collaborators have determined thisquantity to be DGN = 3.637(T � 273.18) + 2540 [26,19].Unfortunately, if one is to use these ideas with differentthermodynamic databases, it is necessary to adjust thisfunction. In this work, we have refitted this quantity usingthe Thermo-Calc database TCFE6 (Fig. 6a), and obtainedthe following functional form:
DGN ¼ 4:736T � 4769 ð1ÞIn order to predict the thermodynamic stability limit forthe formation of bainite, one must also calculate the max-imum chemical driving force for the formation of bainite,which is given by [27]:
Fig. 6. (a) The universal energy for bainitic nucleation formulated basedon the TCFE6 database (the empirical data refers to Refs. [24,25]) and (b)the effective driving force (DGMax � DGN) of Fe–0.32C–1.42Mn–1.56Si,both as a function of the BIT temperature.
Fig. 7. Martensite start temperature (TMs), as a function of the carboncontent in austenite, calculated using different approaches.
1 For interpretation of color in Figs. 4, 10, the reader is referred to theweb version of this article.
S. Li et al. / Acta Materialia 60 (2012) 6120–6130 6125
DGMax ¼ RT lna wa
Fe
� �a wc
Feð Þ
� �ð2Þ
where a waFe
� �and a wc
Feð Þ are the chemical activities of Fe inbainitic ferrite under para-equilibrium conditions (assum-ing partitioning of C) and in austenite with a carbon con-tent corresponding to the instantaneous composition ofthe austenite matrix. To verify that our calculations yieldsimilar quantitative results to those resulting from Bhades-hia’s analysis, we calculate (see Fig. 6b) the effective drivingforce (DGMax � DGN) using the updated universal nucle-ation energy and the chemical driving forces calculatedusing Thermo-Calc and compare it with the results ob-tained using the MUCG83 code [28].
If one assumes that the growth of bainite plates occursin a partitionless fashion, then the available chemical driv-ing force for the transformation is given by the difference inGibbs energies of austenite and ferrite Gc � Ga at theinstantaneous composition of the austenite matrix. As thebainitic transformation progresses, this driving force startsto decrease until it vanishes completely. The locus of thiscomposition as a function of temperature is denoted asT0. This thermodynamic limit for the transformation is fur-ther constrained when considering the energy barriers tothe growth of bainite plates, i.e. DGSE, estimated byBhadeshia to be about 400 J mol�1 [11]. As the transforma-tion progresses, carbon is rejected into the untransformedaustenite, reducing the driving force for subsequent diffu-sionless growth of bainite. Once this driving force equalsDGSE, the bainitic transformation can no longer be sus-tained and the reaction stops. This thermodynamic con-straint to the bainitic transformation is denoted as T00.
3.3. Martensite start (TMs) and finish (TMf) temperatures
Depending on the chemical composition and heat treat-ment, martensite may occupy 1–5% total volume of TRIPsteels [7]. In the present alloy, we are not interested in the fur-ther carbon partitioning from martensite into austenite andthe design of the heat treatments is developed around theidea of minimizing the formation of martensite. In the cur-rent two-step heat treatment, martensite may form afterrapid quenching to BIT or after BIT to room temperature.In other words, if TBIT is higher than TMs after IA(T BIT > T IA
Ms: cf. point (2) in Fig. 4) and TMs after BIT is lowerthan room temperature (T BIT
Ms < 300 K: cf. point (4) in Fig. 4),martensitic transformation can be avoided. Although thereare many models built to predict TMs [29–32], in this work,a thermodynamics-based model is implemented: the freeenergy barrier (DGMs) to martensitic transformation is inthe range of 1100–1400 J mol�1 while the molar fraction ofcarbon is between 0.01 to 0.06 [33] and in this case, we canestimate TMs by calculating the diffusionless driving force:
DGc!a < DGMs ð3Þ
Fig. 7 compares the martensite start temperature (TMs)using different approaches, including the calculations using
the thermodynamic arguments described in Eq. (3). Thefigure shows that the thermodynamic model provides loweraustenite stability than Andrew’s model [34,35]. The maxi-mum difference is about 20 K comparing to Ishida’s model[29].
Due to the diffusionless nature of martensite, the volumefraction of martensite (VfMar.) at arbitrary temperatures, T,below TMs is calculated using the Koistinen–Marburger(K–M) relation [36,37]:
VfMar ¼ 1� exp½�0:011ðT Ms � T Þ� ð4ÞCompared to bainite or ferrite, martensite possesses
higher carbon content. This means that the formation ofmartensite during the two-step treatment can limit the car-bon enrichment of austenite and reduce its stability againstmartensitic transformation upon quenching from TBIT toroom temperature. Ideally, the formation of martensitecan be avoided by careful selection of the heat-treatmentparameters for certain alloy compositions. As shown inFig. 4b, if TBIT is higher than T IA
Ms; Vf IAMar: is zero. If the car-
bon content is higher than w300 in Fig. 4b, the retained aus-tenite will be stable at room temperature. The red1 trianglein Fig. 4b is the optimum area in which the formation ofmartensite can be suppressed and constitutes the ideal de-sign window for the selection of the heat-treatment temper-atures for typical TRIP steels.
estimation of phase constitution after heat treatment
In the sections above, we have described the differentcomponents of the thermodynamic analysis necessary topredict the phase constitution of any TRIP steel alloy at dif-
Table 3The thermodynamic equilibrium state at 1023 K (the composition is inwt.%).
Fig. 8. The volume fraction of retained austenite after different heattreatments (the solid curves are the theoretical predictions) while (a) TBIT
is fixed at 613 K, (b) TIA is fixed at 1045 K.
6126 S. Li et al. / Acta Materialia 60 (2012) 6120–6130
ferent stages of the heat-treatment process. In order to verifythis approach, we designed a series of experiments on thepresent model alloy where we varied the TIA as well as TBIT
and examined the phase constitutions in the resulting micro-structure both after IA as well as after BIT once the alloyshad been quenched to room temperature. Table 2 presentsthe different experiments as well as the phase constitutionsand composition of the austenite after IA. More details onthe experimental techniques are provided in Section 2.
By using the thermodynamic approach described in Sec-tion 3, we assume that the system reaches equilibrium dur-ing IA and is under para-equilibrium during BIT. Theequilibrium assumption during IA may be reasonable giventhe elevated temperature of the treatment (�1050 K). How-ever, our previous work [38] suggests that even at these ele-vated temperatures the alloy only reaches equilibriumconditions over prolonged times. In fact, we found thatthe IA treatments with short holding times may result inthe volume fraction of IA-austenite being significantlylower than what one would expect at equilibrium, withthe subsequent greater carbon enrichment of IA-austenite.Therefore, in the examined cases listed in Table 2, weselected the IA time as 2 h; thus, we considered that theassumption of equilibrium should be reasonable.
The assumption of para-equilibrium during BIT shouldalso be reasonable considering the much larger diffusivityof carbon in austenite (and ferrite) compared to the substi-tutional elements at typical BIT temperatures. In the pres-ent case, however, the difference in carbon diffusivitybetween austenite and ferrite is quite significant [38] andit is uncertain how this assumption affects our estimatesfor the thermodynamics of bainite transformation.
We start our analysis by examining the equilibrium con-ditions for the IA treatment at 1023 K, which correspondsto case A in Table 2. In this case, the total fraction of aus-tenite is about 55.6% of total volume, and the chemicalcompositions of both phases (ferrite and austenite) arelisted in Table 3.
Assuming an equilibrium volume fraction of austeniteand equilibrium partitioning of the elements, we use theIA-austenite phase as the matrix phase that undergoesthe bainitic transformation during BIT. By using the pre-dictions of TMs after IA and BIT as well as the thermody-namic and constrained thermodynamic limits for bainitetransformation (T0 and T 00, respectively), we predicted theexpected volume fraction of retained austenite, using ther-modynamic criteria alone.
In Fig. 8, we present the results of the “forward” ther-modynamic calculation in two distinct cases. In Fig. 8a,we compare the estimated volume fraction for retained aus-tenite using a fixed TBIT of 613 K and different TIAs. In thiscase, the comparison suggests qualitative agreement withexperiments, provided one takes T0 and not T 00 as the ther-modynamic limit for the bainitic transformation. As in theexperiments, the predictions suggest a decrease in the vol-ume fraction of austenite as TIA increases. This is mainlydue to the increase in the equilibrium volume fraction of
austenite with increase in TIA during IA. This increasedvolume fraction reduces carbon saturation in the IA-aus-tenite, reducing its stability.
While the comparison between the predictions and theexperiments is satisfactory in Fig. 8a, the discrepancybetween the predictions and the experiments shown inFig. 8b, where the volume fraction of retained austenite isplotted as a function of TBIT for a fixed TIA, is rather prob-
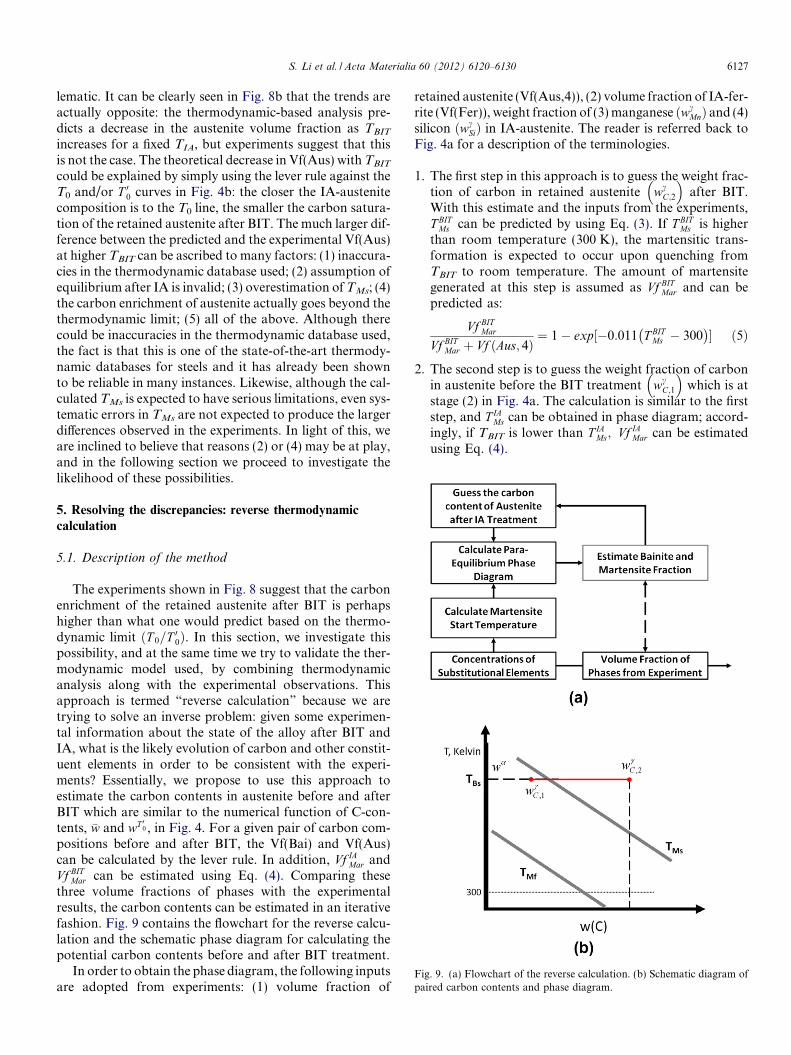
Fig. 9. (a) Flowchart of the reverse calculation. (b) Schematic diagram ofpaired carbon contents and phase diagram.
S. Li et al. / Acta Materialia 60 (2012) 6120–6130 6127
lematic. It can be clearly seen in Fig. 8b that the trends areactually opposite: the thermodynamic-based analysis pre-dicts a decrease in the austenite volume fraction as TBIT
increases for a fixed TIA, but experiments suggest that thisis not the case. The theoretical decrease in Vf(Aus) with TBIT
could be explained by simply using the lever rule against theT0 and/or T 00 curves in Fig. 4b: the closer the IA-austenitecomposition is to the T0 line, the smaller the carbon satura-tion of the retained austenite after BIT. The much larger dif-ference between the predicted and the experimental Vf(Aus)at higher TBIT can be ascribed to many factors: (1) inaccura-cies in the thermodynamic database used; (2) assumption ofequilibrium after IA is invalid; (3) overestimation of TMs; (4)the carbon enrichment of austenite actually goes beyond thethermodynamic limit; (5) all of the above. Although therecould be inaccuracies in the thermodynamic database used,the fact is that this is one of the state-of-the-art thermody-namic databases for steels and it has already been shownto be reliable in many instances. Likewise, although the cal-culated TMs is expected to have serious limitations, even sys-tematic errors in TMs are not expected to produce the largerdifferences observed in the experiments. In light of this, weare inclined to believe that reasons (2) or (4) may be at play,and in the following section we proceed to investigate thelikelihood of these possibilities.
5. Resolving the discrepancies: reverse thermodynamic
calculation
5.1. Description of the method
The experiments shown in Fig. 8 suggest that the carbonenrichment of the retained austenite after BIT is perhapshigher than what one would predict based on the thermo-dynamic limit ðT 0=T 00Þ. In this section, we investigate thispossibility, and at the same time we try to validate the ther-modynamic model used, by combining thermodynamicanalysis along with the experimental observations. Thisapproach is termed “reverse calculation” because we aretrying to solve an inverse problem: given some experimen-tal information about the state of the alloy after BIT andIA, what is the likely evolution of carbon and other constit-uent elements in order to be consistent with the experi-ments? Essentially, we propose to use this approach toestimate the carbon contents in austenite before and afterBIT which are similar to the numerical function of C-con-tents, �w and wT 0
0 , in Fig. 4. For a given pair of carbon com-positions before and after BIT, the Vf(Bai) and Vf(Aus)can be calculated by the lever rule. In addition, Vf IA
Mar andVf BIT
Mar can be estimated using Eq. (4). Comparing thesethree volume fractions of phases with the experimentalresults, the carbon contents can be estimated in an iterativefashion. Fig. 9 contains the flowchart for the reverse calcu-lation and the schematic phase diagram for calculating thepotential carbon contents before and after BIT treatment.
In order to obtain the phase diagram, the following inputsare adopted from experiments: (1) volume fraction of
retained austenite (Vf(Aus,4)), (2) volume fraction of IA-fer-rite (Vf(Fer)), weight fraction of (3) manganese wc
Mnð Þ and (4)silicon wc
Sið Þ in IA-austenite. The reader is referred back toFig. 4a for a description of the terminologies.
1. The first step in this approach is to guess the weight frac-tion of carbon in retained austenite wc
C;2
� �after BIT.
With this estimate and the inputs from the experiments,T BIT
Ms can be predicted by using Eq. (3). If T BITMs is higher
than room temperature (300 K), the martensitic trans-formation is expected to occur upon quenching fromTBIT to room temperature. The amount of martensitegenerated at this step is assumed as Vf BIT
Mar and can bepredicted as:
Vf BITMar
Vf BITMar þ Vf ðAus; 4Þ
¼ 1� exp½�0:011 T BITMs � 300
� �� ð5Þ
2. The second step is to guess the weight fraction of carbonin austenite before the BIT treatment wc
C;1
� �which is at
stage (2) in Fig. 4a. The calculation is similar to the firststep, and T IA
Ms can be obtained in phase diagram; accord-ingly, if TBIT is lower than T IA
Ms; Vf IAMar can be estimated
using Eq. (4).
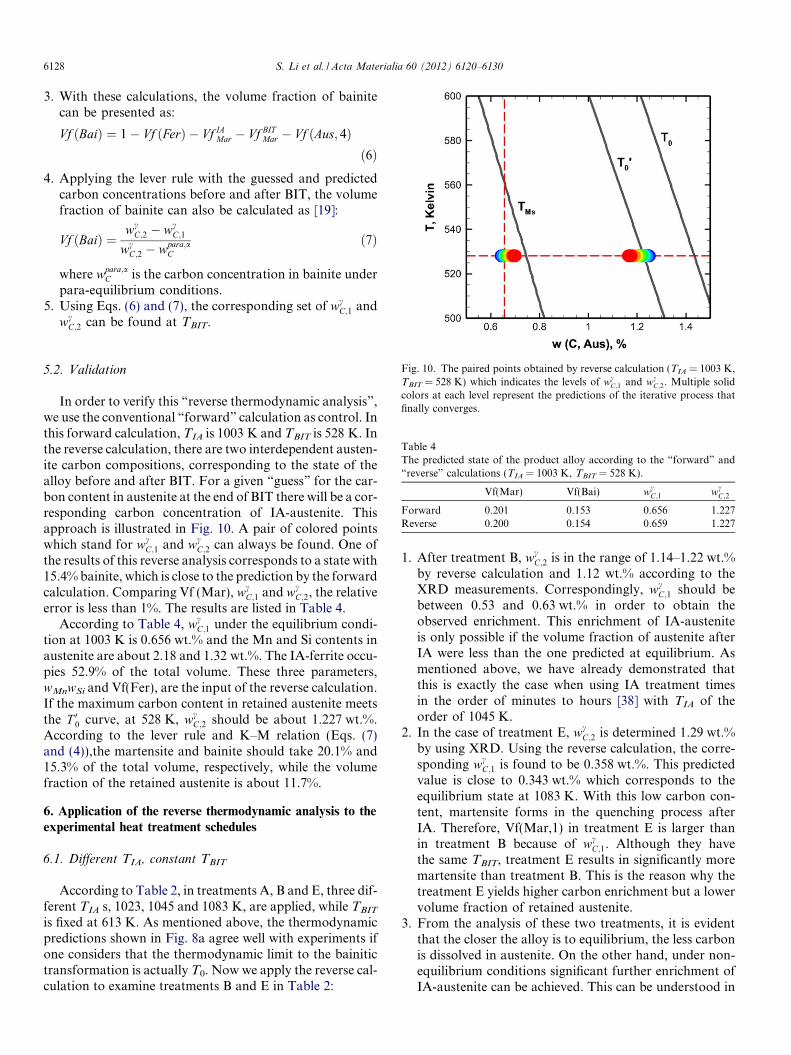
Fig. 10. The paired points obtained by reverse calculation (TIA = 1003 K,TBIT = 528 K) which indicates the levels of wc
C;1 and wcC;2. Multiple solid
colors at each level represent the predictions of the iterative process thatfinally converges.
Table 4The predicted state of the product alloy according to the “forward” and“reverse” calculations (TIA = 1003 K, TBIT = 528 K).
6128 S. Li et al. / Acta Materialia 60 (2012) 6120–6130
3. With these calculations, the volume fraction of bainitecan be presented as:
Vf ðBaiÞ ¼ 1� Vf ðFerÞ � Vf IAMar � Vf BIT
Mar � Vf ðAus; 4Þð6Þ
4. Applying the lever rule with the guessed and predictedcarbon concentrations before and after BIT, the volumefraction of bainite can also be calculated as [19]:
Vf ðBaiÞ ¼wc
C;2 � wcC;1
wcC;2 � wpara;a
C
ð7Þ
where wpara;aC is the carbon concentration in bainite under
para-equilibrium conditions.5. Using Eqs. (6) and (7), the corresponding set of wc
C;1 andwc
C;2 can be found at TBIT.
5.2. Validation
In order to verify this “reverse thermodynamic analysis”,we use the conventional “forward” calculation as control. Inthis forward calculation, TIA is 1003 K and TBIT is 528 K. Inthe reverse calculation, there are two interdependent austen-ite carbon compositions, corresponding to the state of thealloy before and after BIT. For a given “guess” for the car-bon content in austenite at the end of BIT there will be a cor-responding carbon concentration of IA-austenite. Thisapproach is illustrated in Fig. 10. A pair of colored pointswhich stand for wc
C;1 and wcC;2 can always be found. One of
the results of this reverse analysis corresponds to a state with15.4% bainite, which is close to the prediction by the forwardcalculation. Comparing Vf (Mar), wc
C;1 and wcC;2, the relative
error is less than 1%. The results are listed in Table 4.According to Table 4, wc
C;1 under the equilibrium condi-tion at 1003 K is 0.656 wt.% and the Mn and Si contents inaustenite are about 2.18 and 1.32 wt.%. The IA-ferrite occu-pies 52.9% of the total volume. These three parameters,wMnwSi and Vf(Fer), are the input of the reverse calculation.If the maximum carbon content in retained austenite meetsthe T 00 curve, at 528 K, wc
C;2 should be about 1.227 wt.%.According to the lever rule and K–M relation (Eqs. (7)and (4)),the martensite and bainite should take 20.1% and15.3% of the total volume, respectively, while the volumefraction of the retained austenite is about 11.7%.
6. Application of the reverse thermodynamic analysis to the
experimental heat treatment schedules
6.1. Different TIA, constant TBIT
According to Table 2, in treatments A, B and E, three dif-ferent TIA s, 1023, 1045 and 1083 K, are applied, while TBIT
is fixed at 613 K. As mentioned above, the thermodynamicpredictions shown in Fig. 8a agree well with experiments ifone considers that the thermodynamic limit to the bainitictransformation is actually T0. Now we apply the reverse cal-culation to examine treatments B and E in Table 2:
1. After treatment B, wcC;2 is in the range of 1.14–1.22 wt.%
by reverse calculation and 1.12 wt.% according to theXRD measurements. Correspondingly, wc
C;1 should bebetween 0.53 and 0.63 wt.% in order to obtain theobserved enrichment. This enrichment of IA-austeniteis only possible if the volume fraction of austenite afterIA were less than the one predicted at equilibrium. Asmentioned above, we have already demonstrated thatthis is exactly the case when using IA treatment timesin the order of minutes to hours [38] with TIA of theorder of 1045 K.
2. In the case of treatment E, wcC;2 is determined 1.29 wt.%
by using XRD. Using the reverse calculation, the corre-sponding wc
C;1 is found to be 0.358 wt.%. This predictedvalue is close to 0.343 wt.% which corresponds to theequilibrium state at 1083 K. With this low carbon con-tent, martensite forms in the quenching process afterIA. Therefore, Vf(Mar,1) in treatment E is larger thanin treatment B because of wc
C;1. Although they havethe same TBIT, treatment E results in significantly moremartensite than treatment B. This is the reason why thetreatment E yields higher carbon enrichment but a lowervolume fraction of retained austenite.
3. From the analysis of these two treatments, it is evidentthat the closer the alloy is to equilibrium, the less carbonis dissolved in austenite. On the other hand, under non-equilibrium conditions significant further enrichment ofIA-austenite can be achieved. This can be understood in
Fig. 11. The reverse calculation while TIA = 1045 K; the dash and dash-dot lines cover the range of wc
C;2 and the corresponding wcC;1.
S. Li et al. / Acta Materialia 60 (2012) 6120–6130 6129
terms of cementite being dissolved at the very beginningof the IA treatment which provides abundant carbon toaustenite. Along with the IA treatment, carbon diffusesout of the austenite and further drives ferrite transfor-mation into austenite. In other words, before the alloyreaches equilibrium, the carbon content should behigher than the equilibrium one. This observation is val-idated by analyzing another experiment, labeled F inTable 2. In treatment F, the alloy is treated for 15 minat 1045 K during IA. The predicted wc
C;1 is 0.55 wt.%and Vf IA
Mar is zero. Comparing B and F, the 2 h treatmentat 1045 K does not result in obvious differences when itcomes to the amount of retained austenite after BIT,even though wc
C;1 s are notably different.
6.2. Different TBIT, constant TIA
According to Table 2, schedules B, C and D correspondto treatments with the same TIA at 1045 K and TBIT at 613,643 and 693 K, respectively. As shown above, the “for-ward” predictions shown in Fig. 8b do not agree with theexperimentally determined volume factions of austenite.For each treatment, the observed amount of retained aus-tenite is higher than the predicted one, with dramatic qual-itative differences with respect to the experimentalobservations. This discrepancy suggests that the carboncontent in austenite after IA and BIT must be significantlyhigher than what one would predict using the thermody-namic approach. These three samples are treated by thesame IA treatment, and so the chemical composition is ide-ally identical and it is very likely that the composition ofaustenite after IA is also quite similar.
Using the experimental inputs described above, the mostlikely combinations of carbon content in austenite beforeand after BIT are shown in Fig. 11. In the case of treatmentB, the most likely composition of IA-austenite wc
C;1 is0.53 wt.%, while in the case of treatment C, this composi-tion is closer to 0.63 wt.%. While there is obviously someuncertainty in the calculations, it is evident that wc
C;1 lieswithin the 0.53–0.63 wt.% range after 2 h at 1045 K. Thisis significantly higher than the expected IA-austenite car-bon composition if one were to consider equilibrium condi-tions, but it is consistent with a reduced volume fraction ofaustenite reported in Ref. [38].
More importantly than these results, Fig. 11 shows thatby using either the “reverse analysis” or XRD measure-ments, one can conclude that wc
C;2 must be larger thanT0. This is perhaps the reason why the forward calculationunderestimates the volume fraction of retained austenite.From this analysis, wc
C;1 is about 0.06–0.16 wt.% larger thanthe thermodynamic limit. This enrichment suppresses theformation of martensite during the quenching process. Thisexplains why in treatment B, even though wc
C;2 is less thanT0, the volume fraction of retained austenite can be largerthan the prediction based on the thermodynamic approach,simply because of the different bounds for the lever rule.
6.3. Final remarks—kinetic effects
Fig. 11 shows that in treatments C and D, the carbonenrichment in retained austenite is clearly beyond the T0
curve. While the reason for this is at the moment uncertain,it is possible that this super-enrichment of retained austen-ite is the result of competition between the bainitic trans-formation and carbon diffusion in austenite [13,17]. If thecarbon diffusion is relatively slow, the non-homogeneousdistribution of carbon is more obvious which results inthe higher probability of bainite nucleating and the higherwc
C;2 as a consequence. On the other hand, if the phase tran-sition is much slower than carbon diffusion, carbon evenlydistributes in austenite and decreases the driving forcegradually, which stops bainitic transformation at T00. Infact, several models have been proposed to predict thekinetics of the bainitic transformation during BIT[9,19,17]. It is important to note that due to the non-homo-geneous distribution of carbon (i.e. the formation of a so-called C-rich austenite film), the average carbon contentin retained austenite may be higher than the thermody-namic limit ðT00Þ [17,14].
7. Conclusion
In this work, we have presented a detailed thermody-namic analysis of the two-stage heat treatment necessaryto stabilize retained austenite in TRIP steels. The resultshave been compared with experiments and it has beenshown that when comparing the effect of TIA on the volumefraction of retained austenite, there is a qualitative agree-ment with experiments. In these cases, it has also beenshown that the enrichment of carbon in BIT-austenite isgreater than what one would expect considering the ther-modynamic limit to the progression of the bainitic trans-formation during BIT. On the other hand, the analysis ofthe effect of BIT on the amount of retained austenite
6130 S. Li et al. / Acta Materialia 60 (2012) 6120–6130
showed qualitative disagreement with the observations, asthe experiments suggest a much greater stability of retainedaustenite against martensitic transformation.
To make sense of these discrepancies, a “reverse thermo-dynamic analysis” is proposed. Using this methodology it isconcluded that the discrepancy with the experiments couldbe the result of the non-equilibrium nature of the austeniteafter IA, particularly at relatively low TIA s. Further contri-bution to the observed discrepancies arises from theobserved carbon super enrichment of BIT-austenite. Whilethe reason for this is uncertain, this is likely the result of com-petition between the rate of bainite transformation and thecarbon diffusion into austenite as baintic ferrite rejects it.
While this study is not exhaustive, the comparison withthe experiments also suggests that the use of thermodynam-ics to predict the amount of retained austenite after thetwo-stage heat treatment of steels yields effectively a lowerbound for the expected retained austenite. The thermody-namic approach can be used to develop computationaloptimization approaches to the design of heat treatmentsin TRIP steels.
Acknowledgments
This study is funded by the US National Science Foun-dation, Division of Civil, Mechanical, and ManufacturingInnovation, Materials and Surface Engineering Program,Grant No. 0900187. The authors thank Dr. Pedro Rivera,University of Cambridge, for discussions during the prepa-ration of this manuscript. Dr. Paul Mason from Thermo-Calc is acknowledged for his advice regarding the use ofthe computational thermodynamics software.
References
[1] Matsumura O, Sakuma Y, Ishii Y, Zhao J. ISIJ Int 1992;32:1110.[2] Matsumura O, Sakuma Y, Takechi H. ISIJ Int 1992;32:1014.[3] Yi H, Lee K, Bhadeshia H. Mater Sci Eng A 2011.
[4] De Cooman B. Curr Opin Solid State Mater Sci 2004;8:285.[5] Matsumura O, Sakuma Y, Takechi H. Scripta Metall 1987;21:1301.[6] Sakuma Y, Matsumura O, Takechi H. Metall Mater Trans A
1991;22:489.[7] Kuziak R, Kawalla R, Waengler S. Arch Civil Mech Eng 2008;8:103.[8] Caballero F, Bhadeshia H, Mawella K, Jones D, Brown P. Mater Sci
Technol 2002;18:279.[9] Caballero F, Santofimia M, Garcia-Mateo C, Garcia de Andres C.
Mater Trans 2004;45:3272.[10] Van Bohemen S, Sietsma J. Int J Mater Res 2008;99:739.[11] Bhadeshia H. Bainite in steels. The Inst Mater 2001.[12] Bhadeshia H, Edmonds D. Acta Metall 1980;28:1265.[13] Yescas M, Bhadeshia H. Mater Sci Eng A 2002;333:60.[14] Chang L, Bhadeshia H. Mater Sci Technol 1995;11:874.[15] Chupatanakul S, Nash P. J Mater Sci 2006;41:4965.[16] Jacques P. Curr Opin Solid State Mater Sci 2004;8:259.[17] Gaude-Fugarolas D, Jacques P. ISIJ Int 2006;46:712.[18] Speer J, Edmonds D, Rizzo F, Matlock D. Curr Opin Solid State
Mater Sci 2004;8:219.[19] Matsuda H, Bhadeshia H. P Roy Soc Lond A: Mat Phys Eng Sci
2004;460:1707.[20] Andersson J, Helander T, Hoglund L, Shi P, Sundman B. Calphad
2002;26:273.[21] Jatczak CF, Larson JA, Shin DW. Retained austenite and its
measurements by X-ray diffraction. Warrendale, PA: Society ofAutomotive Engineerings, Inc.; 1980.
[22] Dyson DJ, Holmes B. J Iron Steel I 1970;2008:469.[23] Bhadeshia H. Bull Pol Acad Sci: Tec Sci 2010;58:255.[24] Chang L. Metall Mater Trans A 1999;30:909.[25] Zhao Z, Liu C, Liu Y, Northwood D. J Mater Sci 2001;36:5045.[26] Ali A, Bhadeshia H. Mater Sci Technol 1990;6:781.[27] Bhadeshia H. Metal Sci 1982;16:159.[28] Peet M, Bhadeshia H;URL http://www.msm.cam.ac.uk/mapsteel/
programs/mucg8 3.mod.html.[29] Ishida K. J Alloys Compd 1995;220:126.[30] Hongbing C et al. Acta Metall 1986;3:333.[31] Ghosh G, Olson G. Acta Metall Mater 1994;42:3361.[32] Cool T, Bhadeshia H. Mater Sci Technol 1996;12:40.[33] Bhadeshia H. Metal Sci 1981;15:175.[34] Andrews K. Iron Steel Inst J 1965;203:721.[35] Van Bohemen S, Sietsma J. Mater Sci Technol 2009;25:1009.[36] Koistinen D, Marburger R. Acta Metall 1959;7:59.[37] Chatterjee S, Bhadeshia H. Mater Sci Technol 2007;23:1101.[38] Zhu R, Li S, Karaman I, Arroyave R, Niendorf T, Maier H. Acta